Shareholder Report
Aug. 31, 2025
USD ($)
Holding
What were the Fund costs for the last year?
(Based on a hypothetical $10,000 investment)
| Class Name | Costs of a $10,000 investment | Costs paid as a percentage of a $10,000 investment |
| Institutional Shares | $64 | 0.62% |
Management's Discussion of Fund Performance
The following discussion compares the performance of the Fund to the ICE BofA Global High Yield Constrained USD Hedged Index to show how the Fund’s performance compares to the returns of similar investments for the reporting period. See the Average Annual Total Returns table below for the returns of the Fund and related indexes, including the Bloomberg Global Aggregate Index, which represents the overall global investment-grade debt market. The Fund seeks to provide current income and long-term capital appreciation alongside positive societal impact.
Top Contributors to Performance
-
From a sector perspective, the Fund’s overweight positioning in the Banking, Basic Industry and Automotive sectors were top contributors to its relative performance.
-
From an issuer perspective, the Fund’s off-benchmark position in Natwest (Banking) as well as overweight allocations to Liberty Global (Media) and Commerzbank (Banking) contributed the most to relative performance.
-
From a regional perspective, the Fund’s overweight aallocations to Western Europe, the UK and the Pacific were primary contributors to relative performance.
-
From a ratings perspective, the Fund’s overweight positioning in BBB-rated securities contributed the most to relative returns.
Top Detractors from Performance
-
From a sector perspective, the Fund’s underweight positioning in Energy, Media and Real Estate detracted the most from relative performance.
-
From an issuer perspective, the Fund’s lack of exposure to Pemex (Energy), Echostar Corp (Telecommunications) and Bausch Health (Healthcare) detracted the most from relative performance.
-
From a regional perspective, the Fund’s overweight positioning in North America as well as underweight allocations to Latin America and Asia detracted the most from relative performance.
-
From a ratings perspective, the Fund’s underweight positioning in B-rated securities and below detracted the most from relative returns.
Fund Performance
Keep in mind that the Fund’s past performance is not a good predictor of how the Fund will perform in the future. The graph and table do not reflect the deduction of taxes that a shareholder would pay on fund distributions or redemption of fund shares.
Cumulative Performance: September 26, 2019 through August 31, 2025
Initial Investment of $10,000
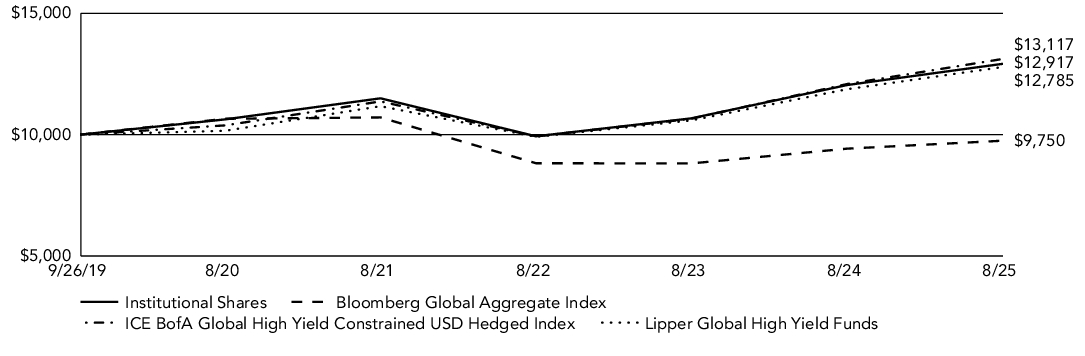
| Average Annual Total Returns | |||
| 1 Year | 5 Years | Since Inception | |
| Institutional Shares1 | 7.25% | 3.98% | 4.41% |
| Bloomberg Global Aggregate Index | 3.47% | -1.76% | -0.43% |
| ICE BofA Global High Yield Constrained USD Hedged Index | 8.55% | 4.79% | 4.68% |
| Lipper Global High Yield Funds | 7.69% | 4.71% | 4.22% |
|
1
|
Commenced operations on September 26, 2019.
|
Visit FederatedHermes.com/us/FundInformation and click on the link to your fund and share class for more recent performance information.
Key Fund Statistics
| Net Assets | $140,884,008 |
| Number of Investments | 249 |
| Portfolio Turnover Rate | 29% |
| Total Advisory Fees Paid | $181,970 |
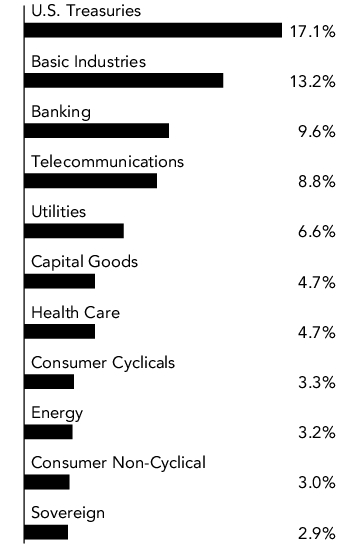
Fund Holdings
Top Sectors
(% of Net Assets)
(% of Net Assets)

What were the Fund costs for the last year?
(Based on a hypothetical $10,000 investment)
| Class Name | Costs of a $10,000 investment | Costs paid as a percentage of a $10,000 investment |
| Class R6 Shares | $59 | 0.57% |
Management's Discussion of Fund Performance
The following discussion compares the performance of the Fund to the ICE BofA Global High Yield Constrained USD Hedged Index to show how the Fund’s performance compares to the returns of similar investments for the reporting period. See the Average Annual Total Returns table below for the returns of the Fund and related indexes, including the Bloomberg Global Aggregate Index, which represents the overall global investment-grade debt market. The Fund seeks to provide current income and long-term capital appreciation alongside positive societal impact.
Top Contributors to Performance
-
From a sector perspective, the Fund’s overweight positioning in the Banking, Basic Industry and Automotive sectors were top contributors to its relative performance.
-
From an issuer perspective, the Fund’s off-benchmark position in Natwest (Banking) as well as overweight allocations to Liberty Global (Media) and Commerzbank (Banking) contributed the most to relative performance.
-
From a regional perspective, the Fund’s overweight aallocations to Western Europe, the UK and the Pacific were primary contributors to relative performance.
-
From a ratings perspective, the Fund’s overweight positioning in BBB-rated securities contributed the most to relative returns.
Top Detractors from Performance
-
From a sector perspective, the Fund’s underweight positioning in Energy, Media and Real Estate detracted the most from relative performance.
-
From an issuer perspective, the Fund’s lack of exposure to Pemex (Energy), Echostar Corp (Telecommunications) and Bausch Health (Healthcare) detracted the most from relative performance.
-
From a regional perspective, the Fund’s overweight positioning in North America as well as underweight allocations to Latin America and Asia detracted the most from relative performance.
-
From a ratings perspective, the Fund’s underweight positioning in B-rated securities and below detracted the most from relative returns.
Fund Performance
Keep in mind that the Fund’s past performance is not a good predictor of how the Fund will perform in the future. The graph and table do not reflect the deduction of taxes that a shareholder would pay on fund distributions or redemption of fund shares.
Cumulative Performance: September 26, 2019 through August 31, 2025
Initial Investment of $10,000

| Average Annual Total Returns | |||
| 1 Year | 5 Years | Since Inception | |
| Class R6 Shares1 | 7.29% | 4.02% | 4.45% |
| Bloomberg Global Aggregate Index | 3.47% | -1.76% | -0.43% |
| ICE BofA Global High Yield Constrained USD Hedged Index | 8.55% | 4.79% | 4.68% |
| Lipper Global High Yield Funds | 7.69% | 4.71% | 4.22% |
|
1
|
The Fund’s Class R6 Shares commenced operations on June 11, 2021. For the periods prior to the commencement of operations of the Fund’s Class R6 Shares, the performance information shown is for the Fund’s Institutional Shares, which commenced operations on September 26, 2019. The performance of the Institutional Shares has not been adjusted to reflect the expenses of the Class R6 Shares, since the Class R6 Shares have a lower expense ratio than the Institutional Shares.
|
Visit FederatedHermes.com/us/FundInformation and click on the link to your fund and share class for more recent performance information.
Key Fund Statistics
| Net Assets | $140,884,008 |
| Number of Investments | 249 |
| Portfolio Turnover Rate | 29% |
| Total Advisory Fees Paid | $181,970 |
Fund Holdings
Top Sectors
(% of Net Assets)
(% of Net Assets)