The following performance information indicates some of the risks of investing in the Fund. The bar chart shows the Fund’s performance from year to year. The table illustrates how the Fund’s average annual returns for the 1-year and since inception periods compared with those of a broad measure of market performance. The Fund’s past performance, before and after taxes, does not necessarily indicate how it will perform in the future. Updated performance information is also available on the Fund’s website at www.graniteshares.com or by calling the Fund toll free at 844-476-8747.
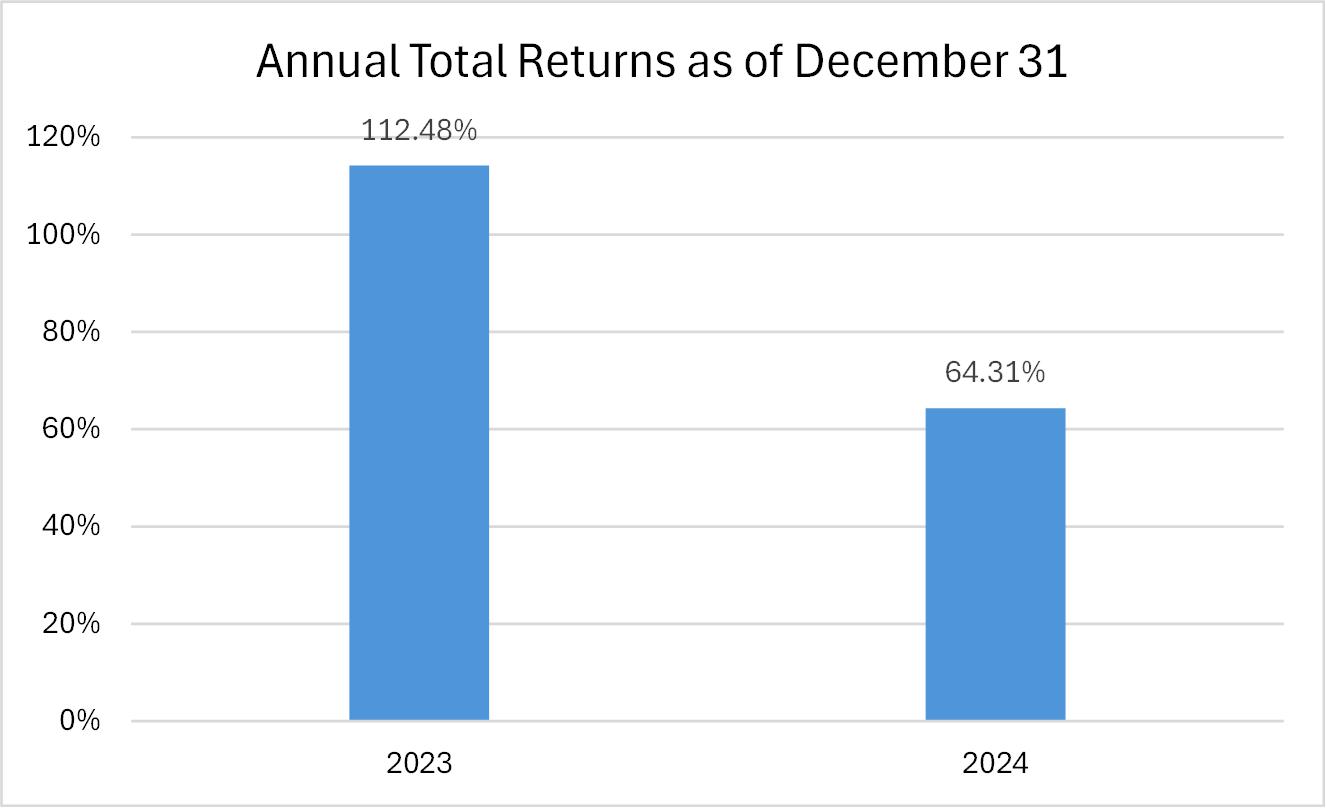
During the periods shown in the bar chart above, the Fund’s highest quarterly return was 85.34% (quarter ended March 31, 2023) and the Fund’s lowest quarterly return was -36.97% (quarter ended March 31, 2024). The calendar year-to-date total return of the Fund as of September 30, 2025, was 3.70%.
| 1 Year | Since Inception (8/8/2022) | |||||||
| Return Before Taxes | 64.31 | % | 5.38 | % | ||||
| Return After Taxes on Distributions | 64.31 | % | -1.41 | % | ||||
| Return After Taxes on Distributions and Sale of Fund Shares | 38.07 | % | 0.50 | % | ||||
| S&P 500 (no fees and expenses, or taxes applied) | 25.02 | % | 17.60 | % | ||||
The following performance information indicates some of the risks of investing in the Fund. The bar chart shows the Fund’s performance from year to year. The table illustrates how the Fund’s average annual returns for the 1-year and since inception periods compared with those of a broad measure of market performance. The Fund’s past performance, before and after taxes, does not necessarily indicate how it will perform in the future. Updated performance information is also available on the Fund’s website at www.graniteshares.com or by calling the Fund toll free at 844-476-8747.
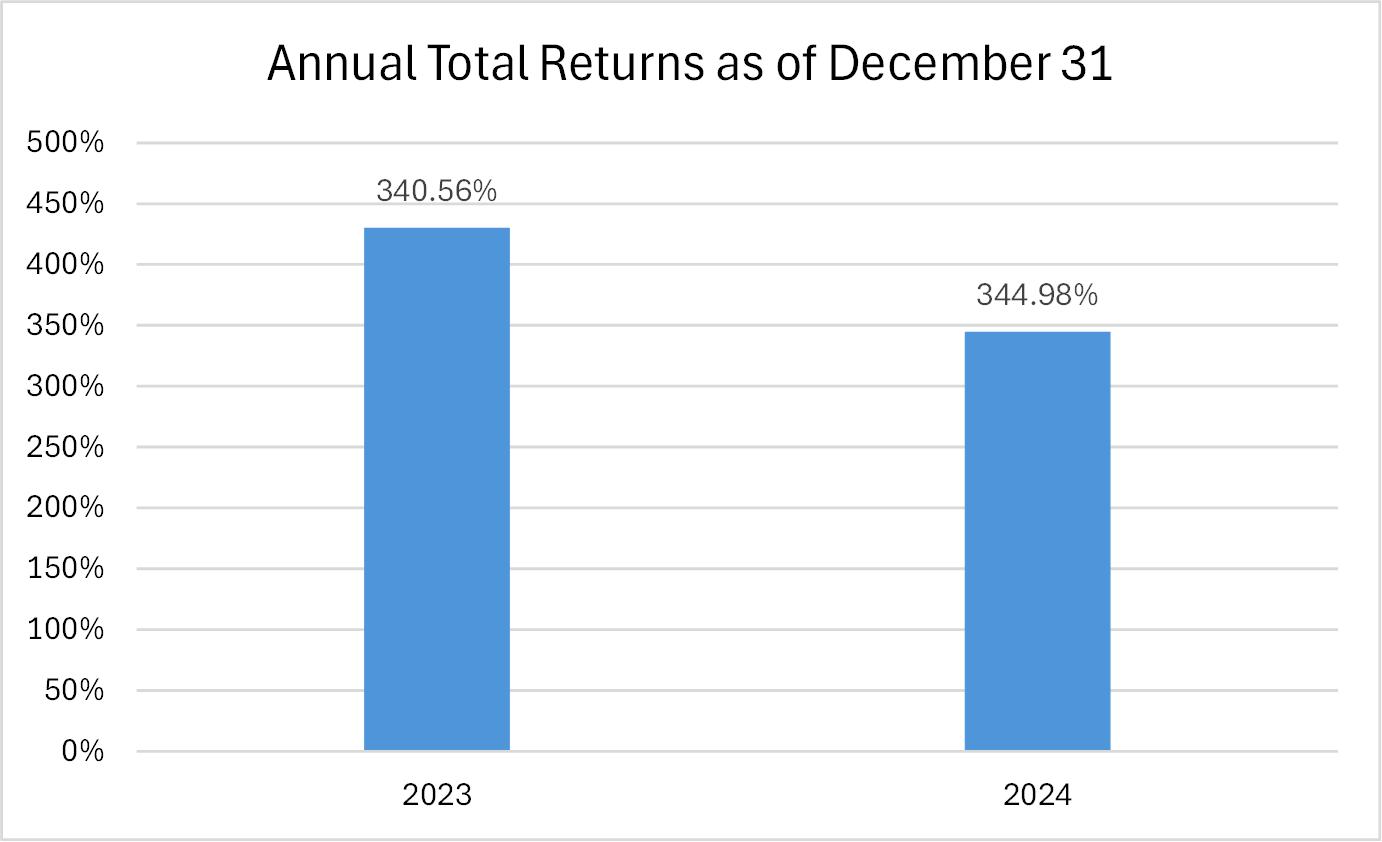
During the periods shown in the bar chart above, the Fund’s highest quarterly return was 178.63% (quarter ended March 31, 2024) and the Fund’s lowest quarterly return was -16.35% (quarter ended September 30, 2024). The calendar year-to-date total return of the Fund as of September 30, 2025, was 41.00%.
| 1 Year | Since Inception (12/12/2022) | |||||||
| Return Before Taxes | 344.98 | % | 306.23 | % | ||||
| Return After Taxes on Distributions | 344.98 | % | 297.93 | % | ||||
| Return After Taxes on Distributions and Sale of Fund Shares | 204.23 | % | 252.41 | % | ||||
| S&P 500 (no fees, expenses, or taxes applied) | 25.02 | % | 22.65 | % | ||||
The following performance information indicates some of the risks of investing in the Fund. The bar chart shows the Fund’s performance from year to year. The table illustrates how the Fund’s average annual returns for the 1-year and since inception periods compared with those of a broad measure of market performance. The Fund’s past performance, before and after taxes, does not necessarily indicate how it will perform in the future. Updated performance information is also available on the Fund’s website at www.graniteshares.com or by calling the Fund toll free at 844-476-8747.
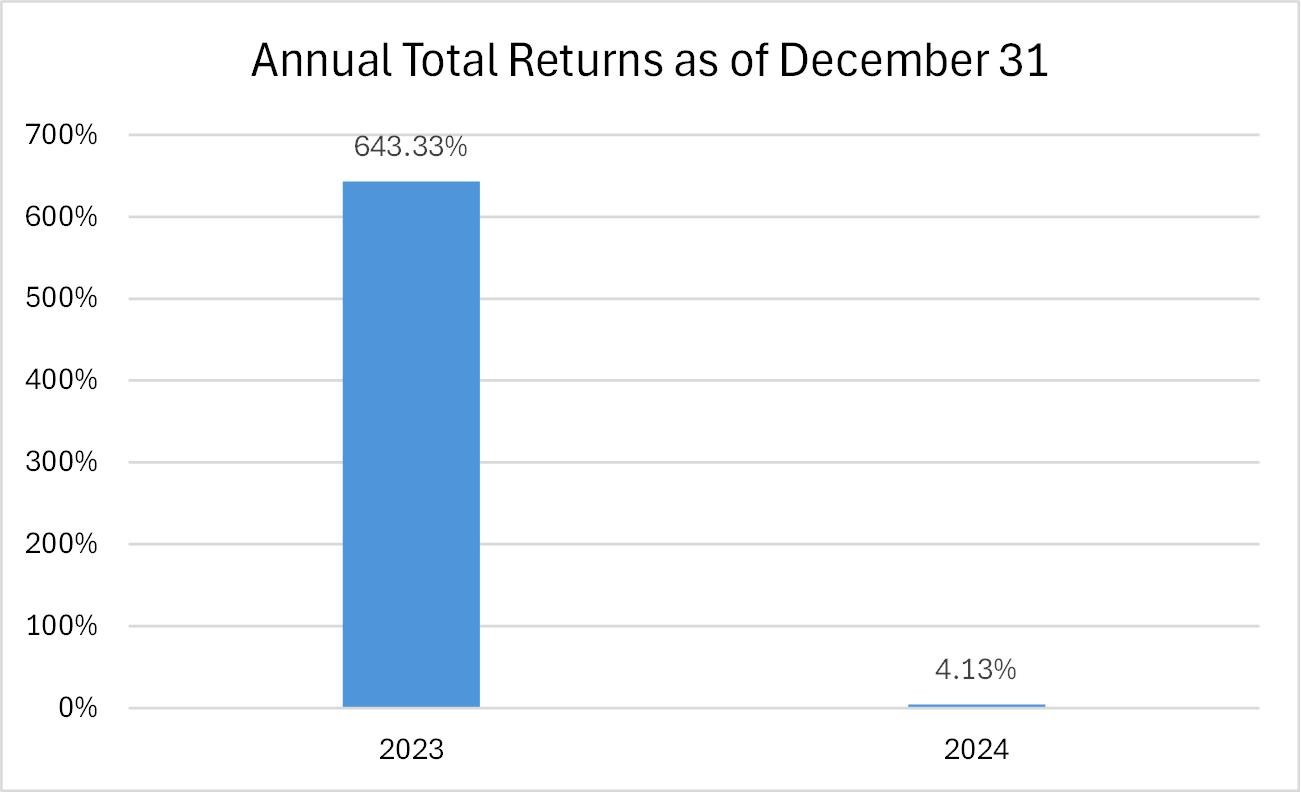
During the periods shown in the bar chart above, the Fund’s highest quarterly return was 232.71% (quarter ended December 31, 2023) and the Fund’s lowest quarterly return was -45.41% (quarter ended September 30, 2024). The calendar year-to-date total return of the Fund as of September 30, 2025, was 6.18%.
| 1 Year | Since Inception (8/8/2022) | |||||||
| Return Before Taxes | 4.13 | % | 15.60 | % | ||||
| Return After Taxes on Distributions | 4.03 | % | 15.55 | % | ||||
| Return After Taxes on Distributions and Sale of Fund Shares | 2.46 | % | 12.14 | % | ||||
| S&P 500 (no fees, expenses or taxes applied) | 25.02 | % | 17.60 | % | ||||
The following performance information indicates some of the risks of investing in the Fund. The bar chart shows the Fund’s performance from year to year. The table illustrates how the Fund’s average annual returns for the 1-year and since inception periods compared with those of a broad measure of market performance. The Fund’s past performance, before and after taxes, does not necessarily indicate how it will perform in the future. Updated performance information is also available on the Fund’s website at www.graniteshares.com or by calling the Fund toll free at 844-476-8747.
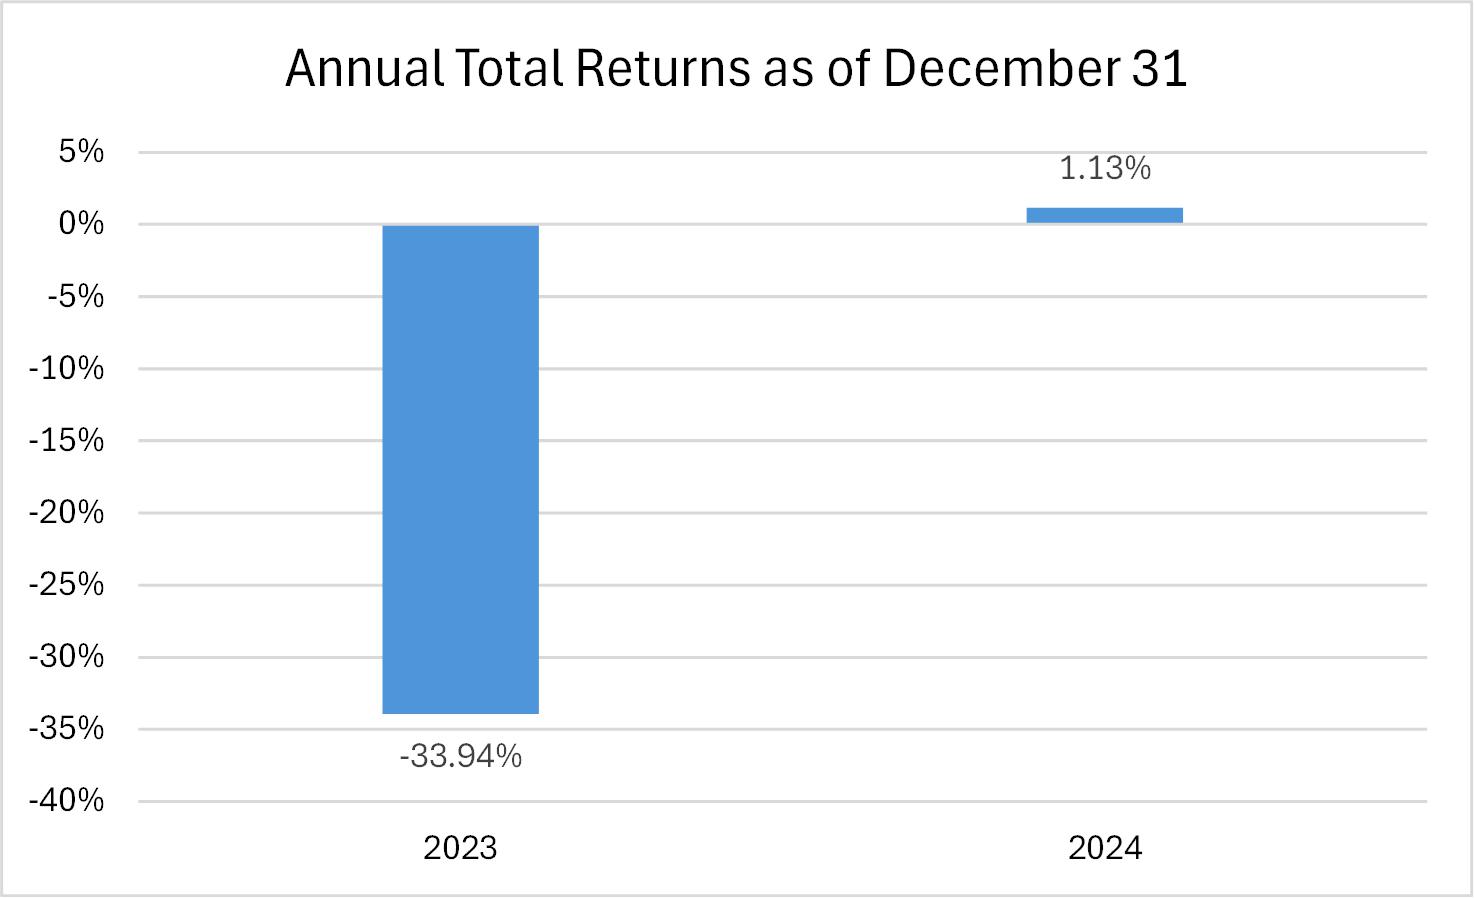
During the periods shown in the bar chart above, the Fund’s highest quarterly return was 104.98% (quarter ended September 30, 2024) and the Fund’s lowest quarterly return was -39.84% (quarter ended December 31, 2024). The calendar year-to-date total return of the Fund as of September 30, 2025, was 254.60%.
| 1 Year | Since Inception (12/12/2022) | |||||||
| Return Before Taxes | 1.13 | % | -19.33 | % | ||||
| Return After Taxes on Distributions | 1.13 | % | -19.33 | % | ||||
| Return After Taxes on Distributions and Sale of Fund Shares | 0.67 | % | -14.31 | % | ||||
| S&P 500 (no fees, expenses, or taxes applied) | 25.02 | % | 22.65 | % | ||||
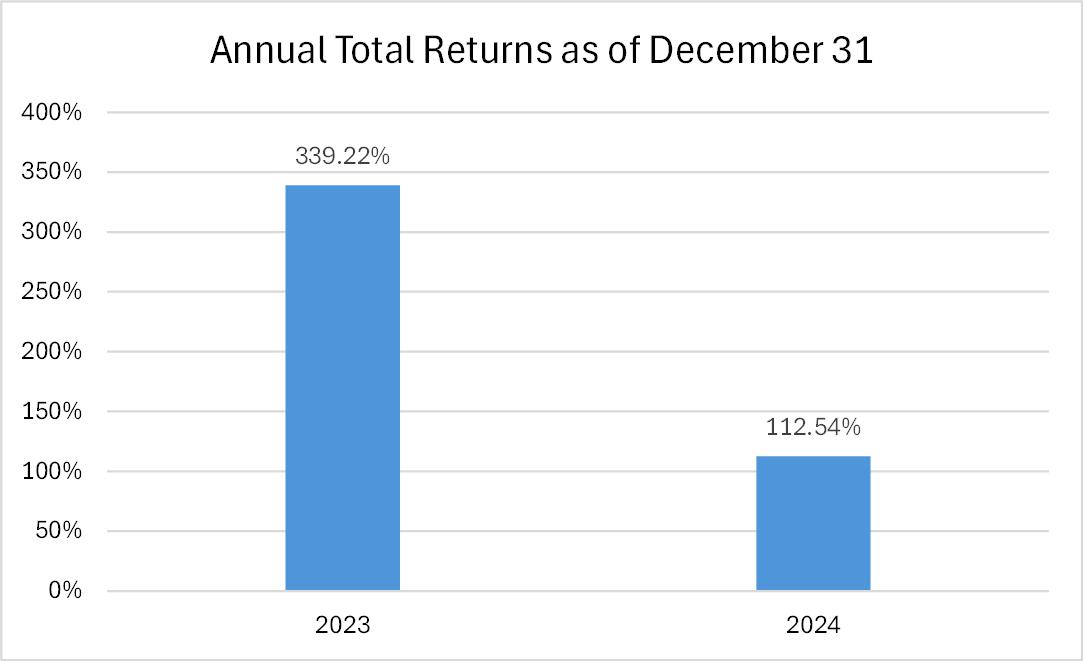
The following performance information indicates some of the risks of investing in the Fund. The bar chart shows the Fund’s performance from year to year. The table illustrates how the Fund’s average annual returns for the 1-year and since inception periods compared with those of a broad measure of market performance. The Fund’s past performance, before and after taxes, does not necessarily indicate how it will perform in the future. Updated performance information is also available on the Fund’s website at www.graniteshares.com or by calling the Fund toll free at 844-476-8747.
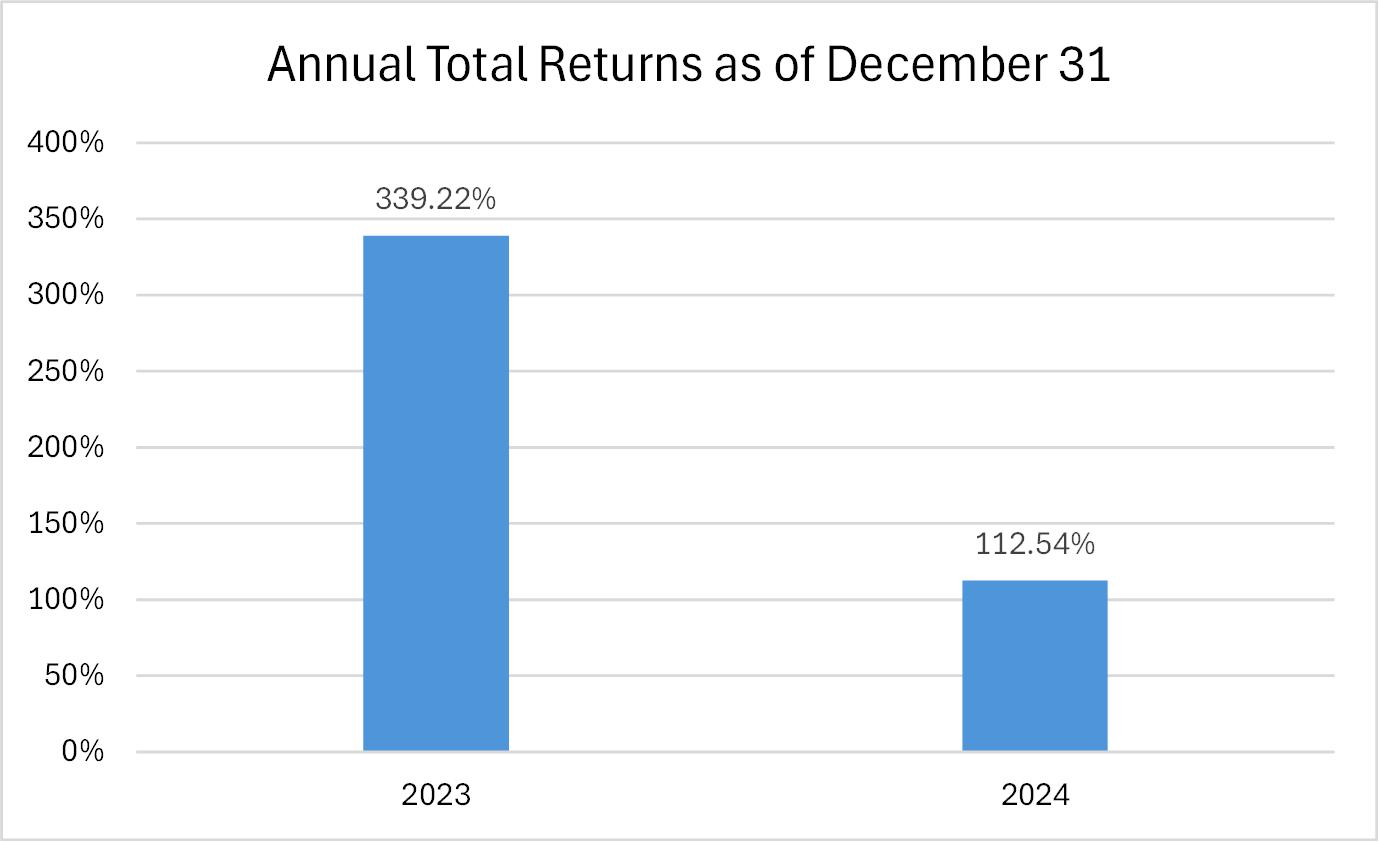
During the periods shown in the bar chart above, the Fund’s highest quarterly return was 123.64% (quarter ended March 31, 2023) and the Fund’s lowest quarterly return was 0.89% (quarter ended December 31, 2024). The calendar year-to-date total return of the Fund as of September 30, 2025, was 31.83%.
| 1 Year | Since Inception (12/12/2022) | |||||||
| Return Before Taxes | 112.54 | % | 206.23 | % | ||||
| Return After Taxes on Distributions | 112.54 | % | 184.96 | % | ||||
| Return After Taxes on Distributions and Sale of Fund Shares | 66.62 | % | 158.09 | % | ||||
| S&P 500 (no fees, expenses, or taxes applied) | 25.02 | % | 22.65 | % | ||||
Performance: Because the Fund has not yet launched, the performance section is omitted. In the future, performance information will be presented in this section of this Prospectus. Updated performance information, when available, will be available online at www.graniteshares.com or by calling 844-476-8747.
Performance: The Fund has not yet completed a full calendar year as of the date of this prospectus and therefore does not have a performance history for a full calendar year. Once available, the Fund’s performance information will be accessible on the Fund’s website at www.graniteshares.com and will provide some indication of the risks of investing in the Fund by showing changes in the Fund’s performance and by showing how the Fund’s returns compare with those of a broad measure of market performance. The Fund’s past performance (before and after taxes) is not necessarily an indication of how the Fund will perform in the future.
The following performance information indicates some of the risks of investing in the Fund. The bar chart shows the Fund’s performance from year to year. The table illustrates how the Fund’s average annual returns for the 1-year and since inception periods compare with those of a broad measure of market performance. The Fund’s past performance, before and after taxes, does not necessarily indicate how it will perform in the future. Updated performance information is also available on the Fund’s website at www.graniteshares.com or by calling the Fund toll free at 844-476-8747.
During the periods shown in the bar chart above, the Fund’s highest quarterly return was 47.24% (quarter ended March 31, 2023) and the Fund’s lowest quarterly return was -23.53% (quarter ended March 31, 2024). The calendar year-to-date total return of the Fund as of September 30, 2025 was -11.19%.
| 1 Year | Since Inception (8/8/2022) | |||||||
| Return Before Taxes | 47.19 | % | 21.77 | % | ||||
| Return After Taxes on Distributions | 47.19 | % | 18.46 | % | ||||
| Return After Taxes on Distributions and Sale of Fund Shares | 27.94 | % | 15.27 | % | ||||
| S&P 500 (No fees, expenses, or taxes applied) | 25.02 | % | 17.60 | % | ||||
Performance: The Fund has not yet completed a full calendar year as of the date of this prospectus and therefore does not have a performance history for a full calendar year. Once available, the Fund’s performance information will be accessible on the Fund’s website at www.graniteshares.com and will provide some indication of the risks of investing in the Fund by showing changes in the Fund’s performance and by showing how the Fund’s returns compare with those of a broad measure of market performance. The Fund’s past performance (before and after taxes) is not necessarily an indication of how the Fund will perform in the future.
Performance: The Fund has not yet completed a full calendar year as of the date of this prospectus and therefore does not have a performance history for a full calendar year. Once available, the Fund’s performance information will be accessible on the Fund’s website at www.graniteshares.com and will provide some indication of the risks of investing in the Fund by showing changes in the Fund’s performance and by showing how the Fund’s returns compare with those of a broad measure of market performance. The Fund’s past performance (before and after taxes) is not necessarily an indication of how the Fund will perform in the future.
Performance: The Fund has not yet completed a full calendar year as of the date of this prospectus and therefore does not have a performance history for a full calendar year. Once available, the Fund’s performance information will be accessible on the Fund’s website at www.graniteshares.com and will provide some indication of the risks of investing in the Fund by showing changes in the Fund’s performance and by showing how the Fund’s returns compare with those of a broad measure of market performance. The Fund’s past performance (before and after taxes) is not necessarily an indication of how the Fund will perform in the future.
Performance: The Fund has not yet completed a full calendar year as of the date of this prospectus and therefore does not have a performance history for a full calendar year. Once available, the Fund’s performance information will be accessible on the Fund’s website at www.graniteshares.com and will provide some indication of the risks of investing in the Fund by showing changes in the Fund’s performance and by showing how the Fund’s returns compare with those of a broad measure of market performance. The Fund’s past performance (before and after taxes) is not necessarily an indication of how the Fund will perform in the future.
Performance: Because the Fund has not yet launched, the performance section is omitted. In the future, performance information will be presented in this section of this Prospectus. Updated performance information, when available, will be available online at www.graniteshares.com or by calling 844-476-8747.
Performance: Because the Fund has not yet launched, the performance section is omitted. In the future, performance information will be presented in this section of this Prospectus. Updated performance information, when available, will be available online at www.graniteshares.com or by calling 844-476-8747.