Shareholder Report
|
12 Months Ended |
|
Aug. 31, 2025
USD ($)
Holding
|
|---|
| Shareholder Report [Line Items] |
|
|
| Document Type |
N-CSR
|
|
| Amendment Flag |
false
|
|
| Registrant Name |
Federated Hermes Adviser Series
|
|
| Entity Central Index Key |
0001707560
|
|
| Entity Investment Company Type |
N-1A
|
|
| Document Period End Date |
Aug. 31, 2025
|
|
| C000224642 |
|
|
| Shareholder Report [Line Items] |
|
|
| Fund Name |
Federated Hermes Conservative Microshort Fund
|
|
| Class Name |
Class A Shares
|
|
| Trading Symbol |
FHCBX
|
|
| Annual or Semi-Annual Statement [Text Block] |
This annual shareholder report contains important information about the Federated Hermes Conservative Microshort Fund (the "Fund") for the period of September 1, 2024 to August 31, 2025.
|
|
| Shareholder Report Annual or Semi-Annual |
Annual Shareholder Report
|
|
| Additional Information [Text Block] |
You can find additional information at FederatedHermes.com/us/FundInformation. You can also request this information by contacting us at 1-800-341-7400, Option 4, or your financial advisor.
|
|
| Additional Information Phone Number |
1-800-341-7400
|
|
| Additional Information Website |
FederatedHermes.com/us/FundInformation
|
|
| Expenses [Text Block] |
What were the Fund costs for the last year? (based on a hypothetical $10,000 investment) Class Name | Costs of a $10,000 investment | Costs paid as a percentage of a $10,000 investment |
|---|
Class A Shares | $34Footnote Reference1 | 0.40% |
|---|
| Footnote | Description | Footnote1 | Based on operations for the period from October 29, 2024 to August 31, 2025. Expenses for the full year would be higher. |
|
|
| Expenses Paid, Amount |
$ 34
|
[1] |
| Expense Ratio, Percent |
0.40%
|
|
| Expenses Short Period Footnote [Text Block] |
Based on operations for the period from October 29, 2024 to August 31, 2025. Expenses for the full year would be higher.
|
|
| Factors Affecting Performance [Text Block] |
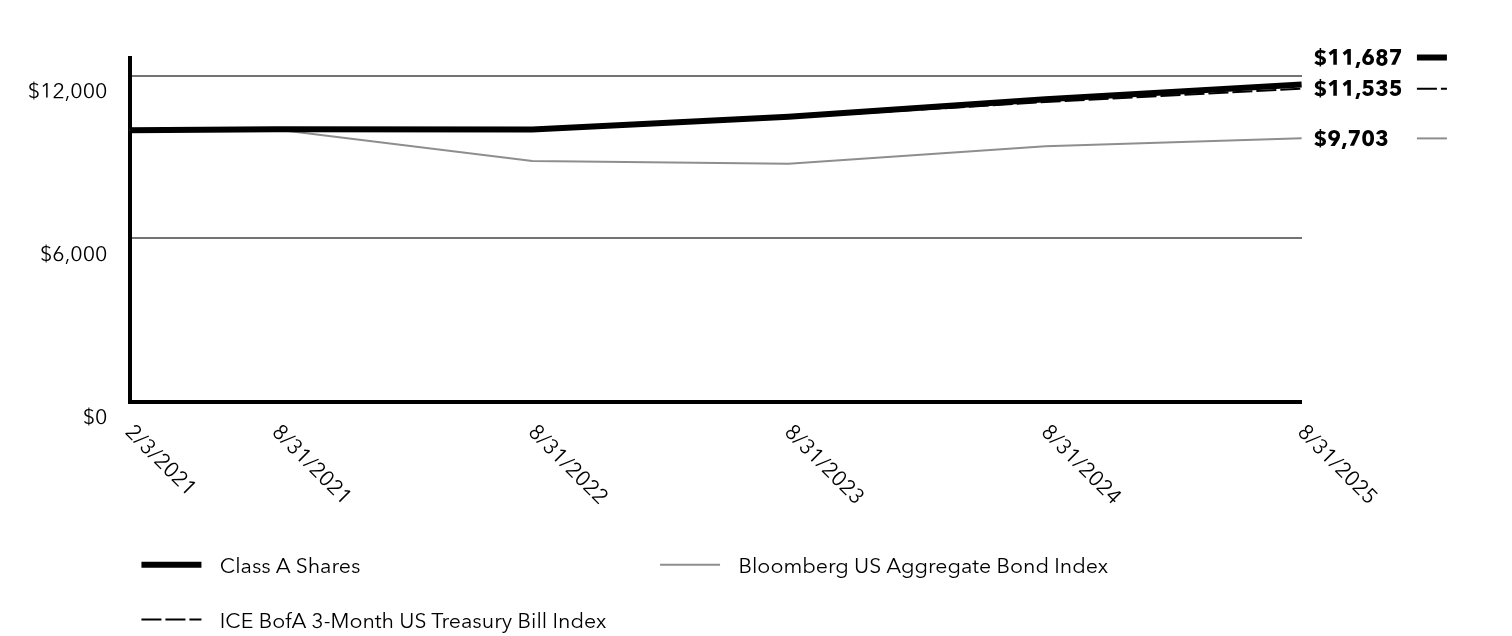
Management's Discussion of Fund PerformanceThe following discussion compares the performance of the Fund to the ICE BofA 3-Month US Treasury Bill Index (the “Index”) to show how the Fund’s performance compares to the returns of similar investments for the reporting period. See the Average Annual Total Returns table below for the returns of the Fund and related indexes, including the Bloomberg US Aggregate Bond Index, which represents the overall U.S. fixed-income market. The Fund seeks to provide current income consistent with capital preservation while maintaining liquidity by investing primarily in a diversified portfolio of investment-grade securities. Top Contributors to Performance Sector and Security Selection both contributed positively to excess returns as asset-backed securities and investment-grade corporate debt securities outperformed U.S. Treasuries during the last fiscal year. Duration Management contributed positively to excess returns as the portfolio duration was positioned longer than the Index in a period of declining interest rates over the reporting period.
Top Detractors from Performance There were no material detractors from relative Fund performance.
|
|
| Performance Past Does Not Indicate Future [Text] |
Keep in mind that the Fund’s past performance is not a good predictor of how the Fund will perform in the future.
|
|
| Line Graph [Table Text Block] |
| Class A Shares | Bloomberg US Aggregate Bond Index | ICE BofA 3-Month US Treasury Bill Index |
|---|
2/3/2021 | $10,000 | $10,000 | $10,000 |
|---|
8/31/2021 | $10,036 | $10,029 | $10,002 |
|---|
8/31/2022 | $10,026 | $8,874 | $10,039 |
|---|
8/31/2023 | $10,499 | $8,769 | $10,466 |
|---|
8/31/2024 | $11,140 | $9,408 | $11,040 |
|---|
8/31/2025 | $11,687 | $9,703 | $11,535 |
|---|
|
|
| Average Annual Return [Table Text Block] |
Fund/IndexFootnote Reference1 | 1 Year | Since
Inception
2/3/2021 |
|---|
Class A Shares | 4.91% | 3.47% |
|---|
Bloomberg US Aggregate Bond Index | 3.14% | (0.66%) |
|---|
ICE BofA 3-Month US Treasury Bill Index | 4.48% | 3.17% |
|---|
|
|
| Performance Inception Date |
Feb. 03, 2021
|
|
| No Deduction of Taxes [Text Block] |
The graph and table do not reflect the deduction of taxes that a shareholder would pay on fund distributions or redemption of fund shares.
|
|
| Updated Performance Information Location [Text Block] |
FederatedHermes.com/us/FundInformation
|
|
| AssetsNet |
$ 261,908,002
|
|
| Holdings Count | Holding |
95
|
|
| Advisory Fees Paid, Amount |
$ 35,475
|
|
| InvestmentCompanyPortfolioTurnover |
26.00%
|
|
| Additional Fund Statistics [Text Block] |
- Net Assets$261,908,002
- Number of Investments95
- Portfolio Turnover26%
- Total Advisory Fees Paid$35,475
|
|
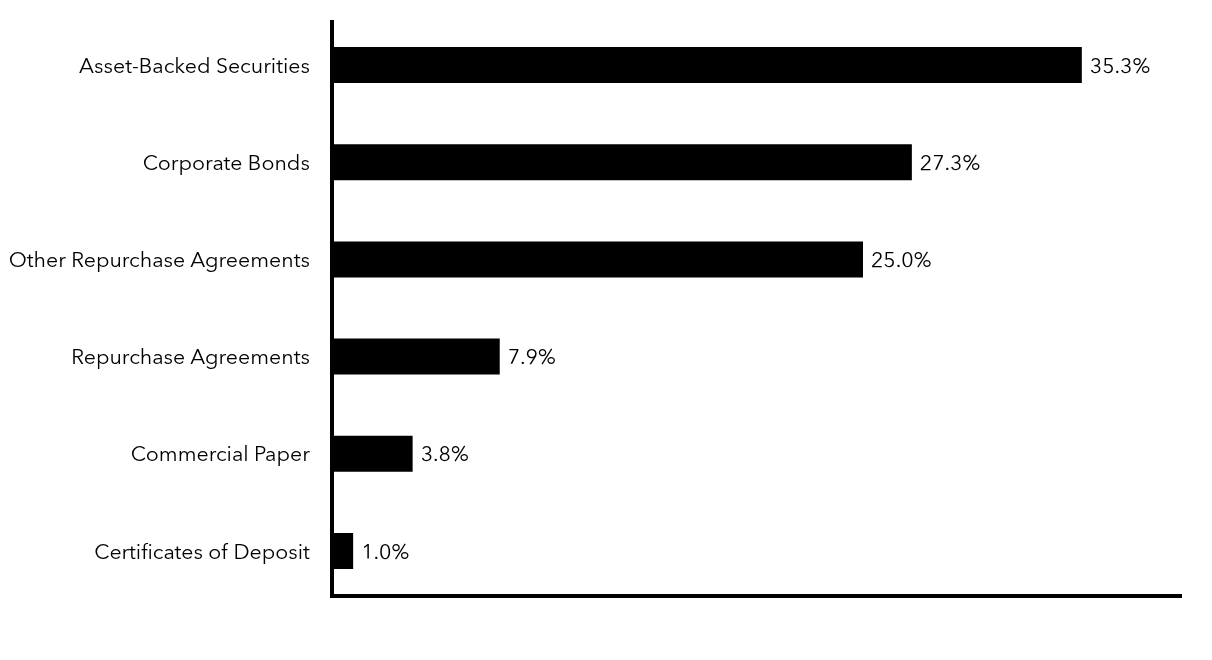
| Holdings [Text Block] |
Top Security Types (% of Net Assets)Value | Value |
|---|
Certificates of Deposit | 1.0% | Commercial Paper | 3.8% | Repurchase Agreements | 7.9% | Other Repurchase Agreements | 25.0% | Corporate Bonds | 27.3% | Asset-Backed Securities | 35.3% |
|
|
| Material Fund Change [Text Block] |
|
|
| C000224641 |
|
|
| Shareholder Report [Line Items] |
|
|
| Fund Name |
Federated Hermes Conservative Microshort Fund
|
|
| Class Name |
Institutional Shares
|
|
| Trading Symbol |
FHCOX
|
|
| Annual or Semi-Annual Statement [Text Block] |
This annual shareholder report contains important information about the Federated Hermes Conservative Microshort Fund (the "Fund") for the period of September 1, 2024 to August 31, 2025.
|
|
| Shareholder Report Annual or Semi-Annual |
Annual Shareholder Report
|
|
| Additional Information [Text Block] |
You can find additional information at FederatedHermes.com/us/FundInformation. You can also request this information by contacting us at 1-800-341-7400, Option 4, or your financial advisor.
|
|
| Additional Information Phone Number |
1-800-341-7400
|
|
| Additional Information Website |
FederatedHermes.com/us/FundInformation
|
|
| Expenses [Text Block] |
What were the Fund costs for the last year? (based on a hypothetical $10,000 investment) Class Name | Costs of a $10,000 investment | Costs paid as a percentage of a $10,000 investment |
|---|
Institutional Shares | $26 | 0.25% |
|---|
|
|
| Expenses Paid, Amount |
$ 26
|
|
| Expense Ratio, Percent |
0.25%
|
|
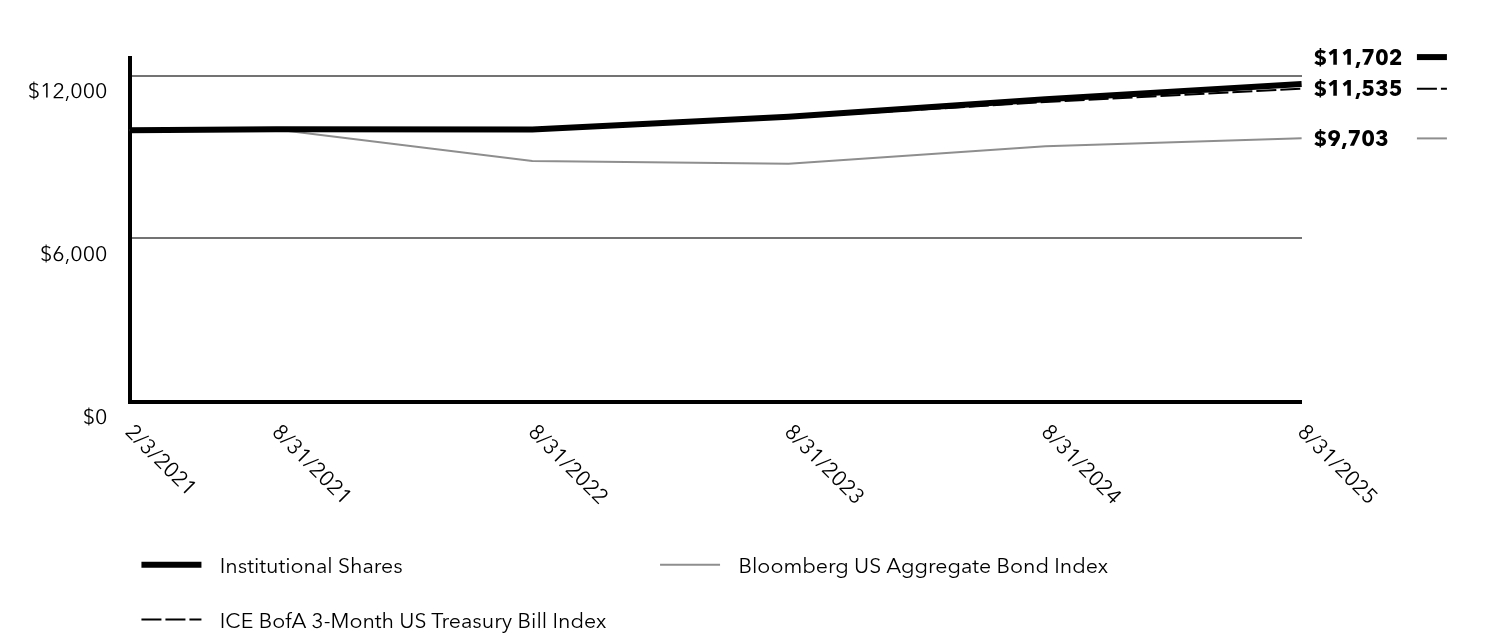
| Factors Affecting Performance [Text Block] |
Management's Discussion of Fund PerformanceThe following discussion compares the performance of the Fund to the ICE BofA 3-Month US Treasury Bill Index (the “Index”) to show how the Fund’s performance compares to the returns of similar investments for the reporting period. See the Average Annual Total Returns table below for the returns of the Fund and related indexes, including the Bloomberg US Aggregate Bond Index, which represents the overall U.S. fixed-income market. The Fund seeks to provide current income consistent with capital preservation while maintaining liquidity by investing primarily in a diversified portfolio of investment-grade securities. Top Contributors to Performance Sector and Security Selection both contributed positively to excess returns as asset-backed securities and investment-grade corporate debt securities outperformed U.S. Treasuries during the last fiscal year. Duration Management contributed positively to excess returns as the portfolio duration was positioned longer than the Index in a period of declining interest rates over the reporting period.
Top Detractors from Performance There were no material detractors from relative Fund performance.
|
|
| Performance Past Does Not Indicate Future [Text] |
Keep in mind that the Fund’s past performance is not a good predictor of how the Fund will perform in the future.
|
|
| Line Graph [Table Text Block] |
| Institutional Shares | Bloomberg US Aggregate Bond Index | ICE BofA 3-Month US Treasury Bill Index |
|---|
2/3/2021 | $10,000 | $10,000 | $10,000 |
|---|
8/31/2021 | $10,036 | $10,029 | $10,002 |
|---|
8/31/2022 | $10,026 | $8,874 | $10,039 |
|---|
8/31/2023 | $10,499 | $8,769 | $10,466 |
|---|
8/31/2024 | $11,140 | $9,408 | $11,040 |
|---|
8/31/2025 | $11,702 | $9,703 | $11,535 |
|---|
|
|
| Average Annual Return [Table Text Block] |
Fund/Index | 1 Year | Since
Inception
2/3/2021 |
|---|
Institutional Shares | 5.04% | 3.49% |
|---|
Bloomberg US Aggregate Bond Index | 3.14% | (0.66%) |
|---|
ICE BofA 3-Month US Treasury Bill Index | 4.48% | 3.17% |
|---|
|
|
| Performance Inception Date |
Feb. 03, 2021
|
|
| No Deduction of Taxes [Text Block] |
The graph and table do not reflect the deduction of taxes that a shareholder would pay on fund distributions or redemption of fund shares.
|
|
| Updated Performance Information Location [Text Block] |
FederatedHermes.com/us/FundInformation
|
|
| AssetsNet |
$ 261,908,002
|
|
| Holdings Count | Holding |
95
|
|
| Advisory Fees Paid, Amount |
$ 35,475
|
|
| InvestmentCompanyPortfolioTurnover |
26.00%
|
|
| Additional Fund Statistics [Text Block] |
- Net Assets$261,908,002
- Number of Investments95
- Portfolio Turnover26%
- Total Advisory Fees Paid$35,475
|
|
| Holdings [Text Block] |
Top Security Types (% of Net Assets)Value | Value |
|---|
Certificates of Deposit | 1.0% | Commercial Paper | 3.8% | Repurchase Agreements | 7.9% | Other Repurchase Agreements | 25.0% | Corporate Bonds | 27.3% | Asset-Backed Securities | 35.3% |
|
|
| Material Fund Change [Text Block] |
|
|
| C000224644 |
|
|
| Shareholder Report [Line Items] |
|
|
| Fund Name |
Federated Hermes Conservative Municipal Microshort Fund
|
|
| Class Name |
Class A Shares
|
|
| Trading Symbol |
FHMAX
|
|
| Annual or Semi-Annual Statement [Text Block] |
This annual shareholder report contains important information about the Federated Hermes Conservative Municipal Microshort Fund (the "Fund") for the period of September 1, 2024 to August 31, 2025.
|
|
| Shareholder Report Annual or Semi-Annual |
Annual Shareholder Report
|
|
| Additional Information [Text Block] |
You can find additional information at FederatedHermes.com/us/FundInformation. You can also request this information by contacting us at 1-800-341-7400, Option 4, or your financial advisor.
|
|
| Additional Information Phone Number |
1-800-341-7400
|
|
| Additional Information Website |
FederatedHermes.com/us/FundInformation
|
|
| Expenses [Text Block] |
What were the Fund costs for the last year? (based on a hypothetical $10,000 investment) Class Name | Costs of a $10,000 investment | Costs paid as a percentage of a $10,000 investment |
|---|
Class A Shares | $34Footnote Reference1 | 0.40% |
|---|
| Footnote | Description | Footnote1 | Based on operations for the period from October 29, 2024 to August 31, 2025. Expenses for the full year would be higher. |
|
|
| Expenses Paid, Amount |
$ 34
|
[2] |
| Expense Ratio, Percent |
0.40%
|
|
| Expenses Short Period Footnote [Text Block] |
Based on operations for the period from October 29, 2024 to August 31, 2025. Expenses for the full year would be higher.
|
|
| Factors Affecting Performance [Text Block] |
Management's Discussion of Fund PerformanceThe following discussion compares the performance of the Fund to the Bloomberg BVAL Municipal Yield Curve (Callable) 3-Month Index (the “Index”) to show how the Fund’s performance compares to the returns of similar investments for the reporting period. See the Average Annual Total Returns table below for the returns of the Fund and related indexes including the S&P Municipal Bond Index, which represents the overall U.S. municipal fixed-income market. The Fund seeks to provide current income consistent with preservation of capital with an emphasis on maintaining liquidity on a tax-exempt basis. Top Contributors to Performance Credit allocation contributed positively to relative Fund performance with exposure to A-2-rated primarily variable-rate securities as well as AA-rated and A-rated or equivalent issuer ratings fixed-rate securities, all of which are excluded from the AAA-rated Index. Selective yield curve allocations to high quality, longer than Index bond/note maturities of approximately six months to two years (though largely one year) during periods when short-term municipal market yields peaked contributed to relative performance. The 1-year AAA-rated Bloomberg Evaluation Service municipal yield fluctuated over a wide range from 2.19% to 3.23%. Within this, specific sector contributions were from General Obligation-Local and Industrial Development/Pollution Control Revenue.
Top Detractors from Performance A significant allocation to daily and weekly Variable-Rate Demand Notes (“VRDNs”), important components for both liquidity and duration management, were a minor detraction from relative performance. The 7-day SIFMA Index rate, a proxy for weekly VRDNs, which fluctuated over a wide range, averaged 2.84% during the period. Duration management was a minor detractor from relative performance. While the Fund ended the fiscal year with a weighted average maturity (WAM) over 90 days, the average WAM was slightly shorter than the duration of the Index, where yields fluctuated over a wide range from 2.34% to 3.39% and ended the period lower by 31 basis points at 2.34% as the Federal Reserve lowered rates by 100 basis points.
|
|
| Performance Past Does Not Indicate Future [Text] |
Keep in mind that the Fund’s past performance is not a good predictor of how the Fund will perform in the future.
|
|
| Line Graph [Table Text Block] |
| Class A Shares | S&P Municipal Bond Index | Bloomberg BVAL Municipal Yield Curve (Callable) 3-Month Index |
|---|
2/3/2021 | $10,000 | $10,000 | $10,000 |
|---|
8/31/2021 | $10,016 | $10,106 | $10,004 |
|---|
8/31/2022 | $10,076 | $9,289 | $10,072 |
|---|
8/31/2023 | $10,397 | $9,456 | $10,367 |
|---|
8/31/2024 | $10,801 | $10,047 | $10,717 |
|---|
8/31/2025 | $11,133 | $10,091 | $11,032 |
|---|
|
|
| Average Annual Return [Table Text Block] |
Fund/IndexFootnote Reference1 | 1 Year | Since
Inception
2/3/2021 |
|---|
Class A Shares | 3.07% | 2.37% |
|---|
S&P Municipal Bond Index | 0.44% | 0.20% |
|---|
Bloomberg BVAL Municipal Yield Curve (Callable) 3-Month Index | 2.94% | 2.17% |
|---|
|
|
| Performance Inception Date |
Feb. 03, 2021
|
|
| No Deduction of Taxes [Text Block] |
The graph and table do not reflect the deduction of taxes that a shareholder would pay on fund distributions or redemption of fund shares.
|
|
| Updated Performance Information Location [Text Block] |
FederatedHermes.com/us/FundInformation
|
|
| AssetsNet |
$ 468,455,246
|
|
| Holdings Count | Holding |
147
|
|
| Advisory Fees Paid, Amount |
$ 239,464
|
|
| InvestmentCompanyPortfolioTurnover |
60.00%
|
|
| Additional Fund Statistics [Text Block] |
- Net Assets$468,455,246
- Number of Investments147
- Portfolio Turnover60%
- Total Advisory Fees Paid$239,464
|
|
| Holdings [Text Block] |
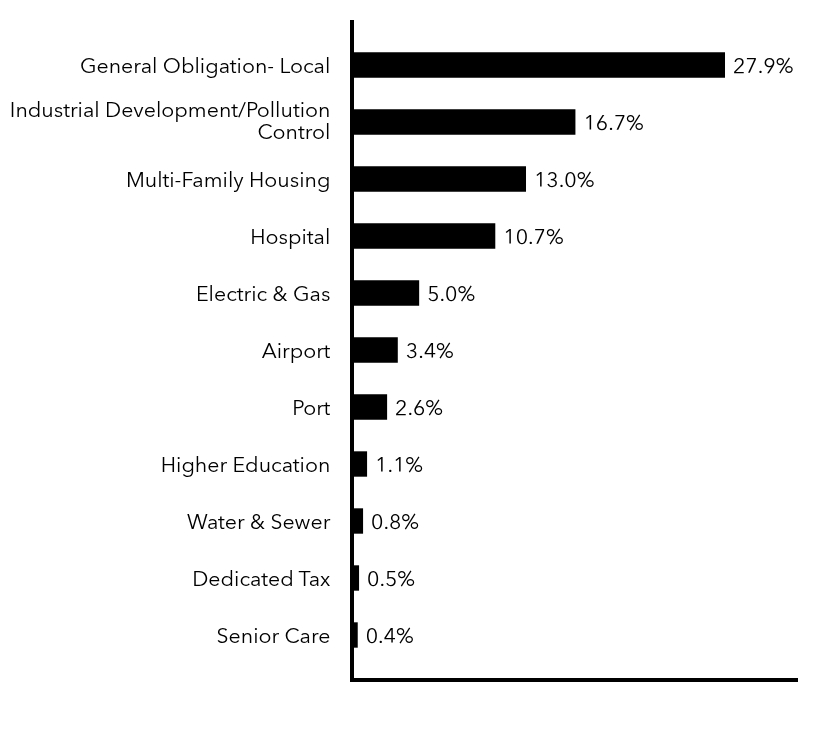
Top Sectors (% of Net Assets)Value | Value |
|---|
Senior Care | 0.4% | Dedicated Tax | 0.5% | Water & Sewer | 0.8% | Higher Education | 1.1% | Port | 2.6% | Airport | 3.4% | Electric & Gas | 5.0% | Hospital | 10.7% | Multi-Family Housing | 13.0% | Industrial Development/Pollution Control | 16.7% | General Obligation- Local | 27.9% |
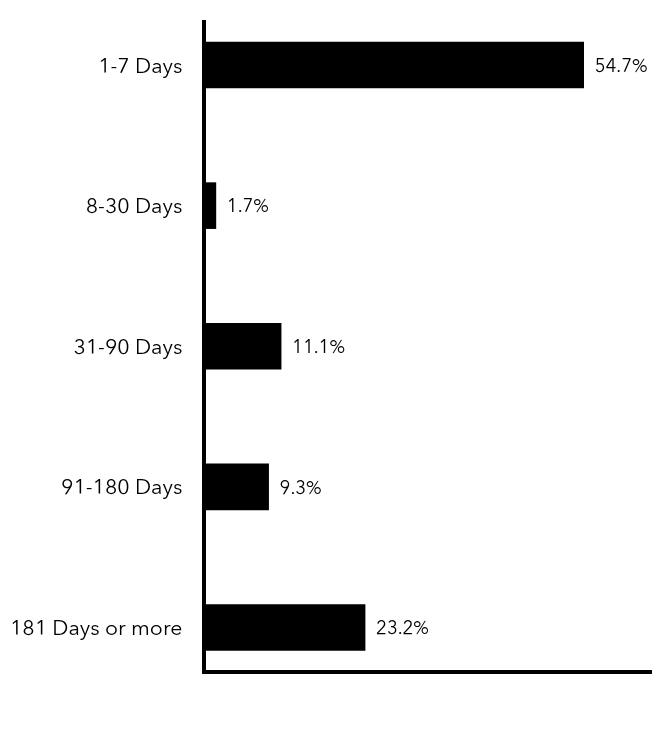
Effective Maturity Schedule (% of Net Assets)Value | Value |
|---|
181 Days or more | 23.2% | 91-180 Days | 9.3% | 31-90 Days | 11.1% | 8-30 Days | 1.7% | 1-7 Days | 54.7% |
|
|
| Material Fund Change [Text Block] |
|
|
| C000224643 |
|
|
| Shareholder Report [Line Items] |
|
|
| Fund Name |
Federated Hermes Conservative Municipal Microshort Fund
|
|
| Class Name |
Institutional Shares
|
|
| Trading Symbol |
FHMIX
|
|
| Annual or Semi-Annual Statement [Text Block] |
This annual shareholder report contains important information about the Federated Hermes Conservative Municipal Microshort Fund (the "Fund") for the period of September 1, 2024 to August 31, 2025.
|
|
| Shareholder Report Annual or Semi-Annual |
Annual Shareholder Report
|
|
| Additional Information [Text Block] |
You can find additional information at FederatedHermes.com/us/FundInformation. You can also request this information by contacting us at 1-800-341-7400, Option 4, or your financial advisor.
|
|
| Additional Information Phone Number |
1-800-341-7400
|
|
| Additional Information Website |
FederatedHermes.com/us/FundInformation
|
|
| Expenses [Text Block] |
What were the Fund costs for the last year? (based on a hypothetical $10,000 investment) Class Name | Costs of a $10,000 investment | Costs paid as a percentage of a $10,000 investment |
|---|
Institutional Shares | $25 | 0.25% |
|---|
|
|
| Expenses Paid, Amount |
$ 25
|
|
| Expense Ratio, Percent |
0.25%
|
|
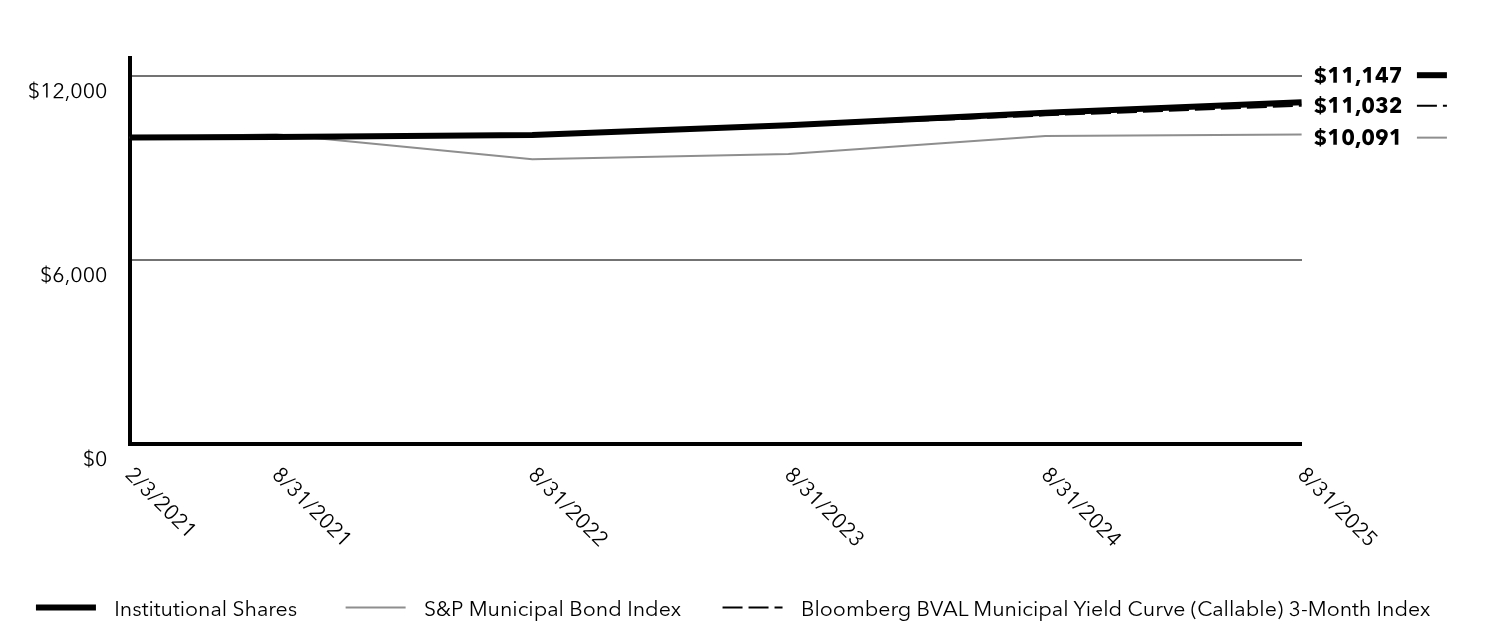
| Factors Affecting Performance [Text Block] |
Management's Discussion of Fund PerformanceThe following discussion compares the performance of the Fund to the Bloomberg BVAL Municipal Yield Curve (Callable) 3-Month Index (the “Index”) to show how the Fund’s performance compares to the returns of similar investments for the reporting period. See the Average Annual Total Returns table below for the returns of the Fund and related indexes including the S&P Municipal Bond Index, which represents the overall U.S. municipal fixed-income market. The Fund seeks to provide current income consistent with preservation of capital with an emphasis on maintaining liquidity on a tax-exempt basis. Top Contributors to Performance Credit allocation contributed positively to relative Fund performance with exposure to A-2-rated primarily variable-rate securities as well as AA-rated and A-rated or equivalent issuer ratings fixed-rate securities, all of which are excluded from the AAA-rated Index. Selective yield curve allocations to high quality, longer than Index bond/note maturities of approximately six months to two years (though largely one year) during periods when short-term municipal market yields peaked contributed to relative performance. The 1-year AAA-rated Bloomberg Evaluation Service municipal yield fluctuated over a wide range from 2.19% to 3.23%. Within this, specific sector contributions were from General Obligation-Local and Industrial Development/Pollution Control Revenue.
Top Detractors from Performance A significant allocation to daily and weekly Variable-Rate Demand Notes (“VRDNs”), important components for both liquidity and duration management, were a minor detraction from relative performance. The 7-day SIFMA Index rate, a proxy for weekly VRDNs, which fluctuated over a wide range, averaged 2.84% during the period. Duration management was a minor detractor from relative performance. While the Fund ended the fiscal year with a weighted average maturity (WAM) over 90 days, the average WAM was slightly shorter than the duration of the Index, where yields fluctuated over a wide range from 2.34% to 3.39% and ended the period lower by 31 basis points at 2.34% as the Federal Reserve lowered rates by 100 basis points.
|
|
| Performance Past Does Not Indicate Future [Text] |
Keep in mind that the Fund’s past performance is not a good predictor of how the Fund will perform in the future.
|
|
| Line Graph [Table Text Block] |
| Institutional Shares | S&P Municipal Bond Index | Bloomberg BVAL Municipal Yield Curve (Callable) 3-Month Index |
|---|
2/3/2021 | $10,000 | $10,000 | $10,000 |
|---|
8/31/2021 | $10,016 | $10,106 | $10,004 |
|---|
8/31/2022 | $10,076 | $9,289 | $10,072 |
|---|
8/31/2023 | $10,397 | $9,456 | $10,367 |
|---|
8/31/2024 | $10,801 | $10,047 | $10,717 |
|---|
8/31/2025 | $11,147 | $10,091 | $11,032 |
|---|
|
|
| Average Annual Return [Table Text Block] |
Fund/Index | 1 Year | Since
Inception
2/3/2021 |
|---|
Institutional Shares | 3.20% | 2.40% |
|---|
S&P Municipal Bond Index | 0.44% | 0.20% |
|---|
Bloomberg BVAL Municipal Yield Curve (Callable) 3-Month Index | 2.94% | 2.17% |
|---|
|
|
| Performance Inception Date |
Feb. 03, 2021
|
|
| No Deduction of Taxes [Text Block] |
The graph and table do not reflect the deduction of taxes that a shareholder would pay on fund distributions or redemption of fund shares.
|
|
| Updated Performance Information Location [Text Block] |
FederatedHermes.com/us/FundInformation
|
|
| AssetsNet |
$ 468,455,246
|
|
| Holdings Count | Holding |
147
|
|
| Advisory Fees Paid, Amount |
$ 239,464
|
|
| InvestmentCompanyPortfolioTurnover |
60.00%
|
|
| Additional Fund Statistics [Text Block] |
- Net Assets$468,455,246
- Number of Investments147
- Portfolio Turnover60%
- Total Advisory Fees Paid$239,464
|
|
| Holdings [Text Block] |
Top Sectors (% of Net Assets)Value | Value |
|---|
Senior Care | 0.4% | Dedicated Tax | 0.5% | Water & Sewer | 0.8% | Higher Education | 1.1% | Port | 2.6% | Airport | 3.4% | Electric & Gas | 5.0% | Hospital | 10.7% | Multi-Family Housing | 13.0% | Industrial Development/Pollution Control | 16.7% | General Obligation- Local | 27.9% |
Effective Maturity Schedule (% of Net Assets)Value | Value |
|---|
181 Days or more | 23.2% | 91-180 Days | 9.3% | 31-90 Days | 11.1% | 8-30 Days | 1.7% | 1-7 Days | 54.7% |
|
|
| Material Fund Change [Text Block] |
|
|
|
|