
Copyright © Booz Allen Hamilton Inc. 2025 www.boozallen.com OK TO WORK DESIGN Booz Allen Hamilton Internal ri t ll ilt I . Q2 FY26 EARNINGS CALL PRESENTATION OCTOBER 24, 2025

2Copyright © Booz Allen Hamilton Inc. 2025 www.boozallen.com PARTICIPANTS EARNINGS CALL PARTICIPANTS HORACIO ROZANSKI Chairman, Chief Executive Officer & President MATT CALDERONE Executive Vice President, Chief Financial Officer KRISTINE MARTIN ANDERSON Executive Vice President, Chief Operating Officer DUSTIN DARENSBOURG Head of Investor Relations
3Copyright © Booz Allen Hamilton Inc. 2025 www.boozallen.com Booz Allen Hamilton Restricted Disclaimer DISCLAIMER Forward Looking Safe Harbor Statement Certain statements contained in this presentation and in related comments by our management include “forward-looking statements” within the meaning of the Private Securities Litigation Reform Act of 1995. Examples of forward- looking statements include information concerning Booz Allen’s preliminary financial results, financial outlook and guidance, including forecasted revenue, Adjusted EBITDA, Diluted EPS, Adjusted Diluted EPS, future quarterly dividends, and future improvements in operating margins, as well as any other statement that does not directly relate to any historical or current fact. In some cases, you can identify forward-looking statements by terminology such as “may,” “will,” “could,” “should,” “forecasts,” “expects,” “intends,” “plans,” “anticipates,” “projects,” “outlook,” “believes,” “estimates,” “predicts,” “potential,” “continue,” “preliminary,” or the negative of these terms or other comparable terminology. Although we believe that the expectations reflected in the forward-looking statements are reasonable, we can give you no assurance these expectations will prove to have been correct. These forward-looking statements relate to future events or our future financial performance and involve known and unknown risks, uncertainties and other factors that may cause our actual results, levels of activity, performance or achievements to differ materially from any future results, levels of activity, performance or achievements expressed or implied by these forward-looking statements. A number of important factors could cause actual results to differ materially from those contained in or implied by these forward-looking statements, including those factors discussed in our filings with the Securities and Exchange Commission (SEC), including our Annual Report on Form 10-K for the fiscal year ended March 31, 2025, which can be found at the SEC’s website at www.sec.gov. All forward-looking statements attributable to us or persons acting on our behalf are expressly qualified in their entirety by the foregoing cautionary statements. All such statements speak only as of the date made and, except as required by law, we undertake no obligation to update or revise publicly any forward-looking statements, whether as a result of new information, future events or otherwise. Booz Allen’s fiscal year ends on March 31 and unless otherwise noted, references to fiscal year, fiscal or FY are for fiscal years ended March 31. Note Regarding Non-GAAP Financial Data Information Booz Allen discloses Revenue, Excluding Billable Expenses, Adjusted EBITDA, Adjusted EBITDA Margin on Revenue, Adjusted Net Income, Adjusted Diluted EPS, Free Cash Flow, and Net Leverage Ratio, which are not recognized measurements under accounting principles generally accepted in the United States, or GAAP, and when analyzing Booz Allen’s performance or liquidity as applicable, investors should (i) evaluate each adjustment in our reconciliation of revenue to Revenue, Excluding Billable Expenses, net income attributable to common stockholders to Adjusted EBITDA, Adjusted EBITDA Margin on Revenue, Adjusted Net Income and Adjusted Diluted EPS, net cash used in operating activities to Free Cash Flow, and net debt to Net Leverage Ratio, and the explanatory footnotes regarding those adjustments, each as defined under GAAP, (ii) use Revenue, Excluding Billable Expenses, Adjusted EBITDA, Adjusted EBITDA Margin on Revenue, Adjusted Net Income, and Adjusted Diluted EPS in addition to, and not as an alternative to, revenue, operating income, net income attributable to common stockholders or diluted EPS as measures of operating results, each as defined under GAAP, (iii) use Free Cash Flow in addition to, and not as an alternative to, net cash used in operating activities as a measure of liquidity, each as defined under GAAP, and (iv) use Net Leverage Ratio in addition to, and not as an alternative to, net debt as a measure of Booz Allen's debt leverage. The Appendix includes a reconciliation of Revenue, Excluding Billable Expenses, Adjusted EBITDA, Adjusted EBITDA Margin on Revenue, Adjusted Net Income, Adjusted Diluted EPS, Free Cash Flow and Net Leverage Ratio to the most directly comparable financial measure calculated and presented in accordance with GAAP. Booz Allen presents these supplemental performance measures because it believes that these measures provide investors and securities analysts with important supplemental information with which to evaluate Booz Allen’s performance, long term earnings potential, or liquidity, as applicable, and to enable them to assess Booz Allen’s performance on the same basis as management. These supplemental performance and liquidity measurements may vary from and may not be comparable to similarly titled measures by other companies in Booz Allen’s industry. With respect to our expectations under “Financial Outlook", reconciliation of Adjusted Diluted EPS guidance, Adjusted EBITDA, and Adjusted EBITDA Margin on Revenue, and Adjusted Effective Tax Rate to the closest corresponding GAAP measure is not available without unreasonable efforts on a forward-looking basis due to our inability to predict our stock price, equity grants and dividend declarations with respect to Adjusted Diluted EPS, and our net income, net interest and other expenses with respect to Adjusted EBITDA, Adjusted EBITDA Margin on Revenue, and Adjusted Effective Tax Rate, during the course of fiscal 2026. With respect to Adjusted Diluted EPS guidance, projecting future stock price, equity grants and dividends to be declared would be necessary to accurately calculate the difference between Adjusted Diluted EPS and GAAP EPS as a result of the effects of the two-class method and related possible dilution used in the calculation of EPS. Consequently, any attempt to disclose such reconciliation would imply a degree of precision that could be confusing or misleading to investors. We expect the variability of the above charges to have an unpredictable, and potentially significant, impact on our future GAAP financial results. For the same reason, a reconciliation of Adjusted EBITDA and Adjusted EBITDA Margin on Revenue guidance for fiscal 2026, of Adjusted EBITDA guidance through fiscal 2026, and of Adjusted Effective Tax Rate guidance through fiscal 2026 to the closest corresponding GAAP measures are not available without unreasonable efforts on a forward-looking basis due to our inability to predict specific quantifications of the amounts that would be required to reconcile such measures. Accordingly, Booz Allen is relying on the exception provided by Item 10(e)(1)(i)(B) of Regulation S-K to exclude these reconciliations.
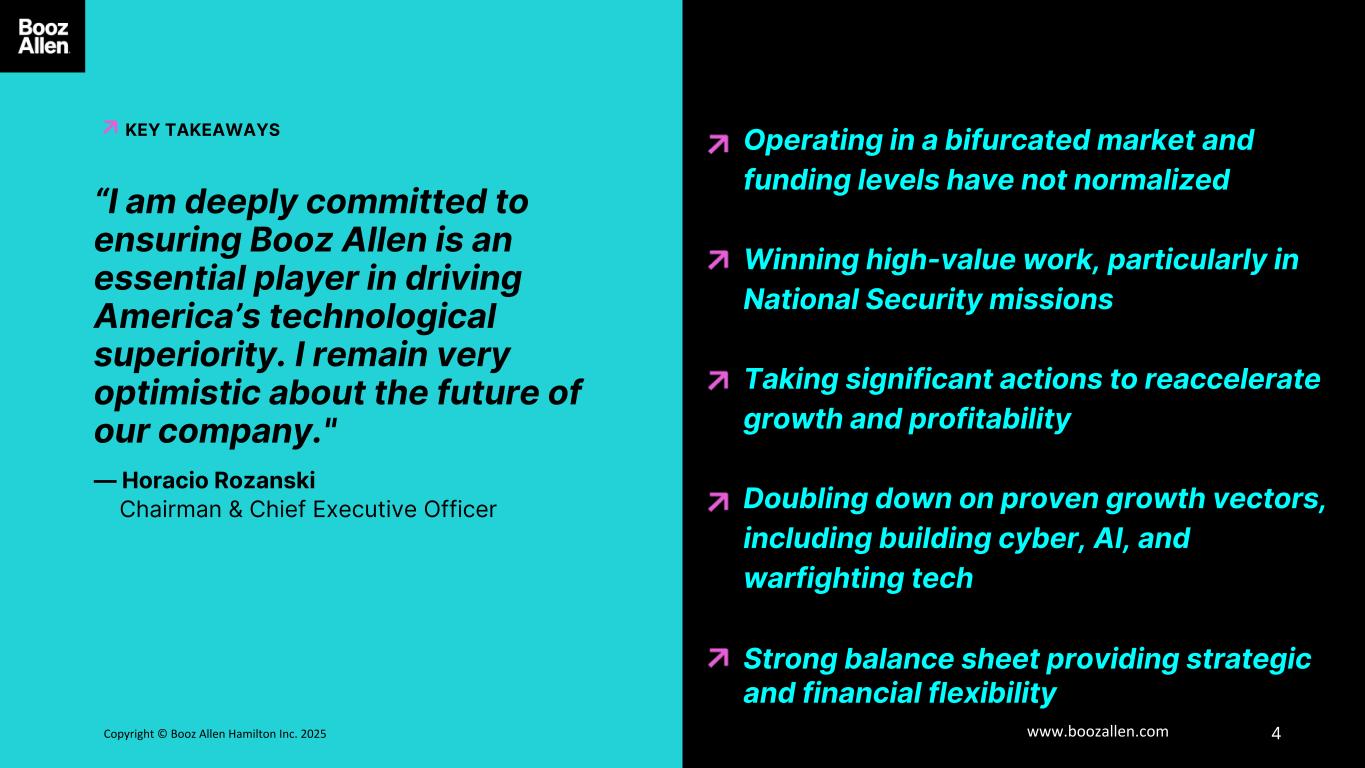
4Copyright © Booz Allen Hamilton Inc. 2025 www.boozallen.com “I am deeply committed to ensuring Booz Allen is an essential player in driving America’s technological superiority. I remain very optimistic about the future of our company." — Horacio Rozanski Chairman & Chief Executive Officer KEY TAKEAWAYS Operating in a bifurcated market and funding levels have not normalized Winning high-value work, particularly in National Security missions Taking significant actions to reaccelerate growth and profitability Doubling down on proven growth vectors, including building cyber, AI, and warfighting tech Strong balance sheet providing strategic and financial flexibility
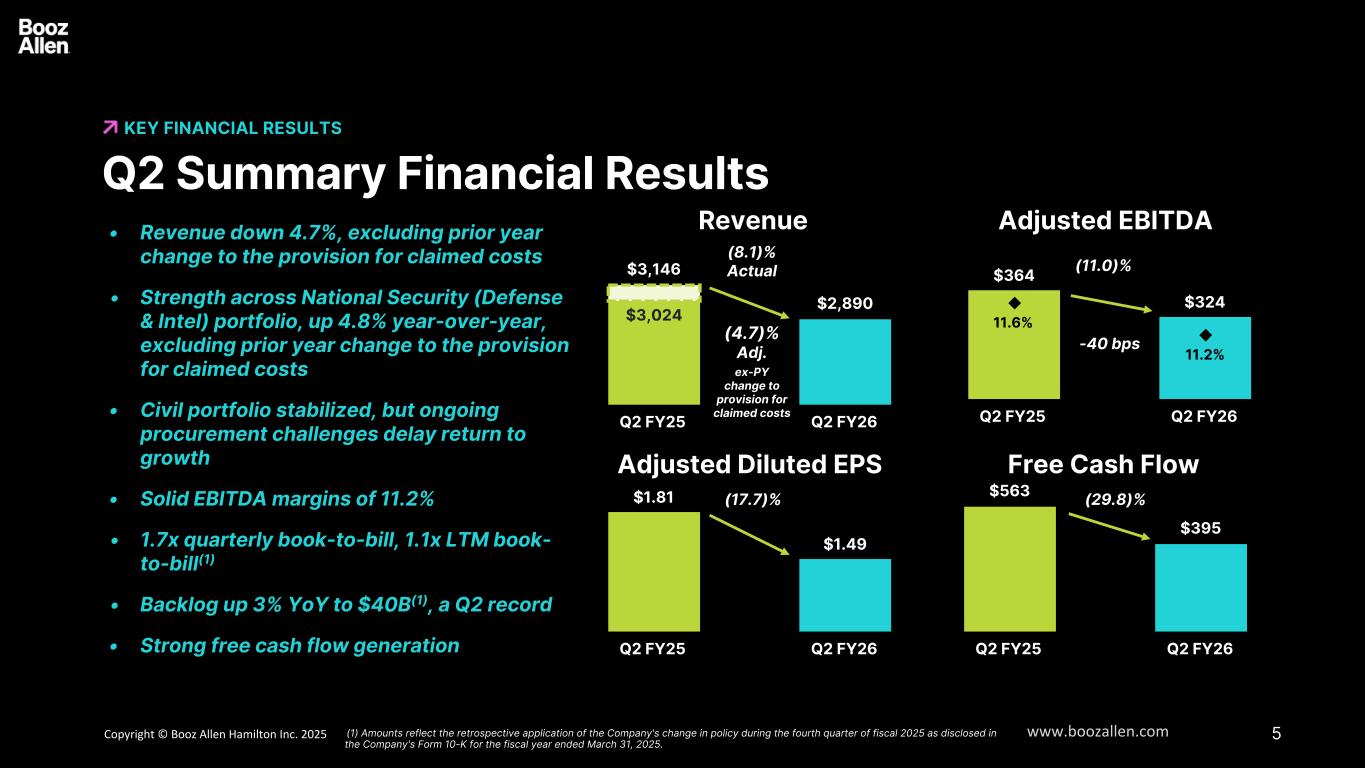
5Copyright © Booz Allen Hamilton Inc. 2025 www.boozallen.com $563 $395 Q2 FY25 Q2 FY26 $3,146 $2,890 $3,024 Q2 FY25 Q2 FY26 $1.81 $1.49 Q2 FY25 Q2 FY26 $364 $324 11.6% 11.2% Q2 FY25 Q2 FY26 Revenue • Revenue down 4.7%, excluding prior year change to the provision for claimed costs • Strength across National Security (Defense & Intel) portfolio, up 4.8% year-over-year, excluding prior year change to the provision for claimed costs • Civil portfolio stabilized, but ongoing procurement challenges delay return to growth • Solid EBITDA margins of 11.2% • 1.7x quarterly book-to-bill, 1.1x LTM book- to-bill(1) • Backlog up 3% YoY to $40B(1), a Q2 record • Strong free cash flow generation • KEY FINANCIAL RESULTS Q2 Summary Financial Results Adjusted EBITDA Adjusted Diluted EPS Free Cash Flow (8.1)% Actual (11.0)% (29.8)%(17.7)% -40 bps (1) Amounts reflect the retrospective application of the Company's change in policy during the fourth quarter of fiscal 2025 as disclosed in the Company's Form 10-K for the fiscal year ended March 31, 2025. (4.7)% Adj. s ex-PY change to provision for claimed costs
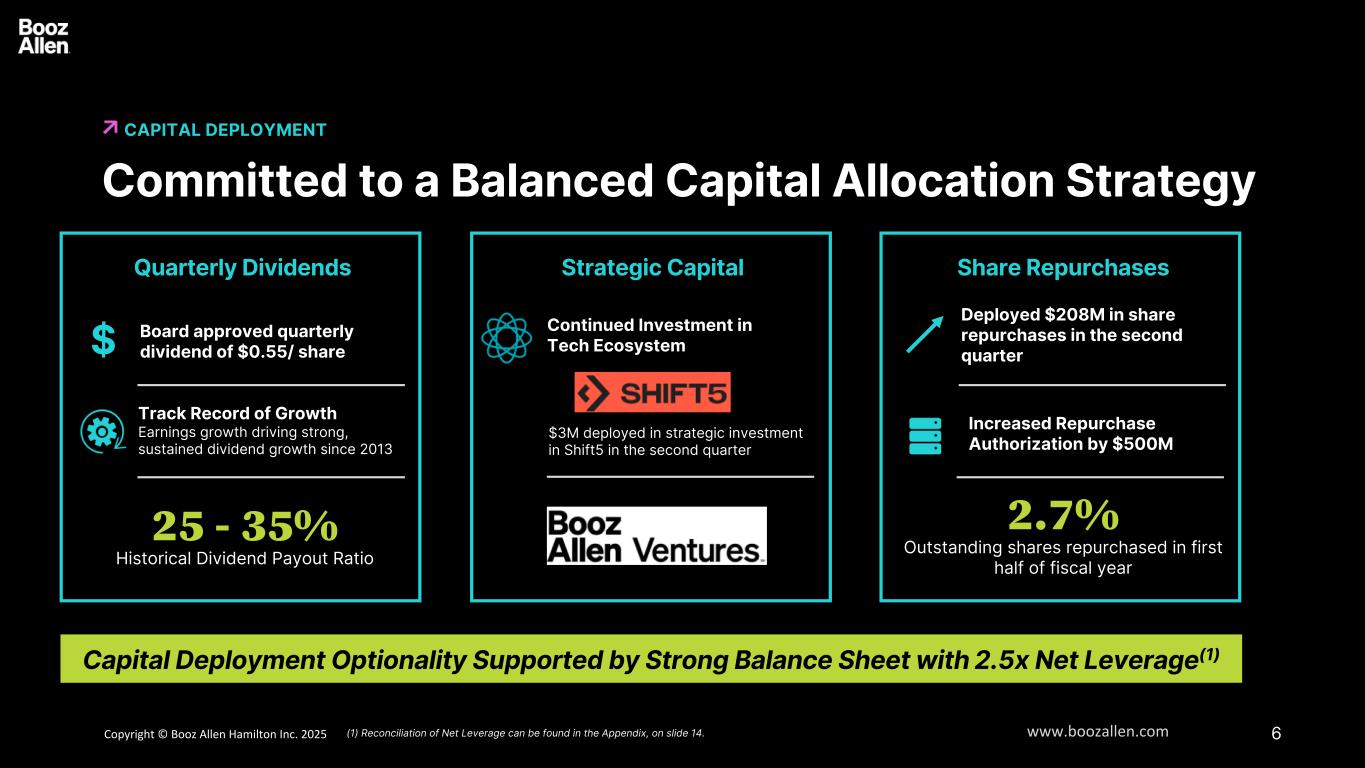
6Copyright © Booz Allen Hamilton Inc. 2025 www.boozallen.com Committed to a Balanced Capital Allocation Strategy CAPITAL DEPLOYMENT Quarterly Dividends Strategic Transaction s Share Repurchase s Capital Deployment Optionality Supported by Strong Balance Sheet with 2.5x Net Leverage(1) Continued Investment in Tech Ecosystem Strategic Capital Share RepurchasesQuarterly Dividends 25 - 35% Historical Dividend Payout Ratio Track Record of Growth Earnings growth driving strong, sustained dividend growth since 2013 Deployed $208M in share repurchases in the second quarter Increased Repurchase Authorization by $500M 2.7% Outstanding shares repurchased in first half of fiscal year Board approved quarterly dividend of $0.55/ share (1) Reconciliation of Net Leverage can be found in the Appendix, on slide 14. $ $3M deployed in strategic investment in Shift5 in the second quarter
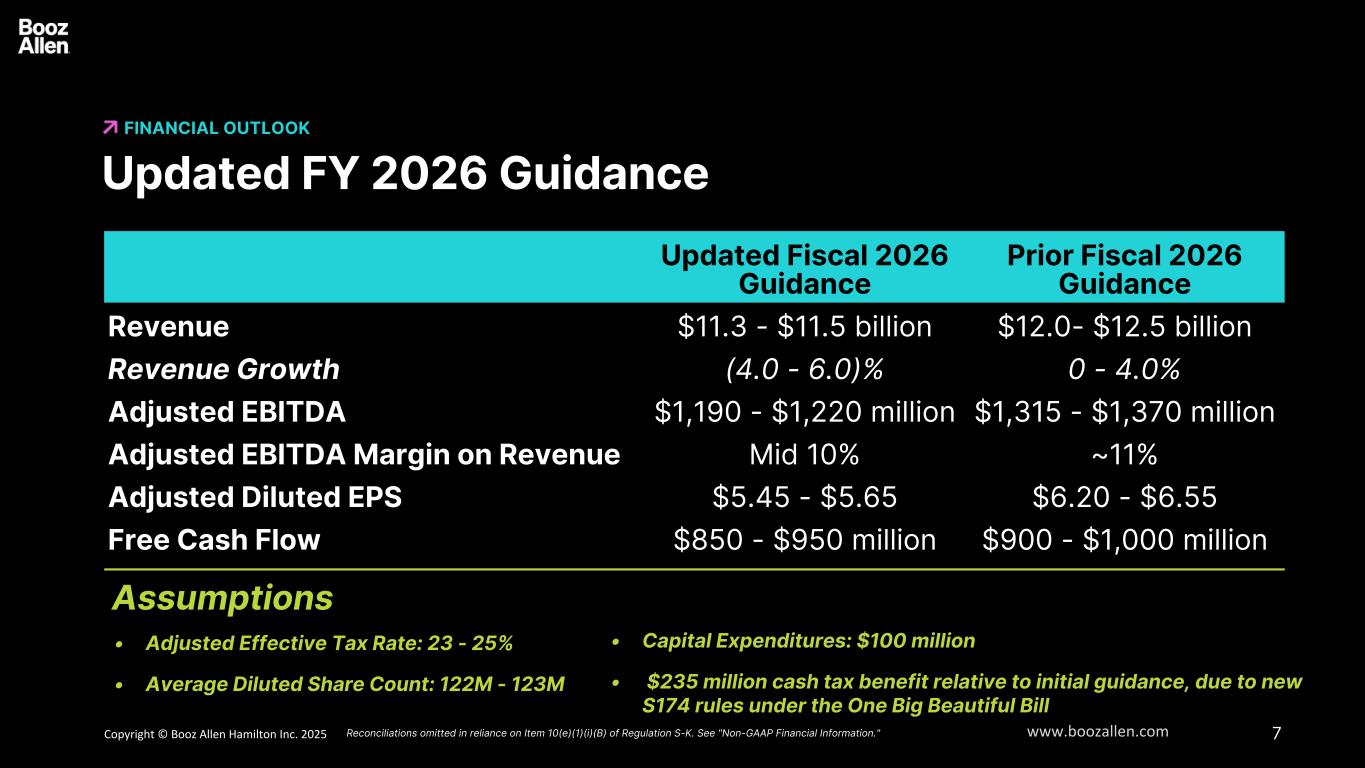
7Copyright © Booz Allen Hamilton Inc. 2025 www.boozallen.com FINANCIAL OUTLOOK Updated FY 2026 Guidance Assumptions • Adjusted Effective Tax Rate: 23 - 25% • Average Diluted Share Count: 122M - 123M Reconciliations omitted in reliance on Item 10(e)(1)(i)(B) of Regulation S-K. See "Non-GAAP Financial Information." Updated Fiscal 2026 Guidance Prior Fiscal 2026 Guidance Revenue $11.3 - $11.5 billion $12.0- $12.5 billion Revenue Growth (4.0 - 6.0)% 0 - 4.0% Adjusted EBITDA $1,190 - $1,220 million $1,315 - $1,370 million Adjusted EBITDA Margin on Revenue Mid 10% ~11% Adjusted Diluted EPS $5.45 - $5.65 $6.20 - $6.55 Free Cash Flow $850 - $950 million $900 - $1,000 million • Capital Expenditures: $100 million • $235 million cash tax benefit relative to initial guidance, due to new S174 rules under the One Big Beautiful Bill
8Copyright © Booz Allen Hamilton Inc. 2025 www.boozallen.com Booz Allen Hamilton Restricted APPENDIX
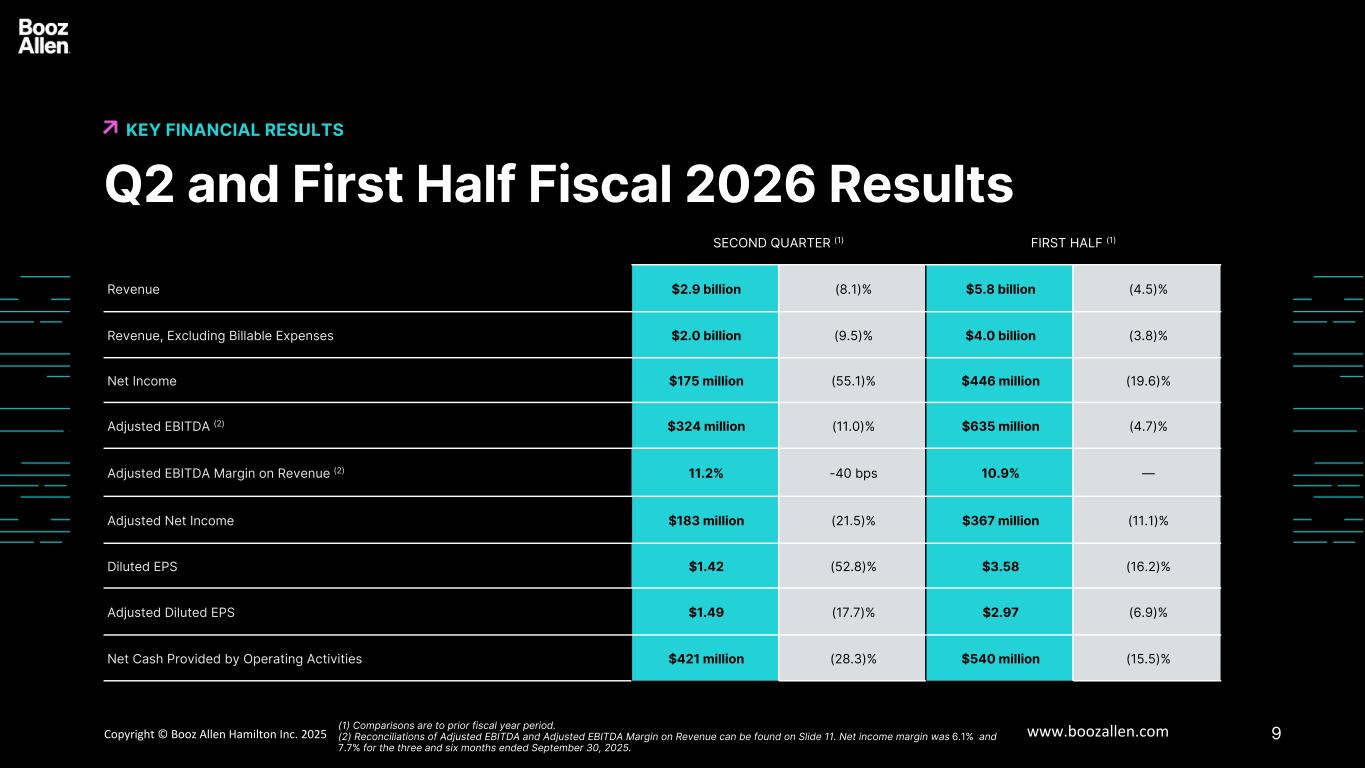
9Copyright © Booz Allen Hamilton Inc. 2025 www.boozallen.com SECOND QUARTER (1) FIRST HALF (1) Revenue $2.9 billion (8.1)% $5.8 billion (4.5)% Revenue, Excluding Billable Expenses $2.0 billion (9.5)% $4.0 billion (3.8)% Net Income $175 million (55.1)% $446 million (19.6)% Adjusted EBITDA (2) $324 million (11.0)% $635 million (4.7)% Adjusted EBITDA Margin on Revenue (2) 11.2% -40 bps 10.9% — Adjusted Net Income $183 million (21.5)% $367 million (11.1)% Diluted EPS $1.42 (52.8)% $3.58 (16.2)% Adjusted Diluted EPS $1.49 (17.7)% $2.97 (6.9)% Net Cash Provided by Operating Activities $421 million (28.3)% $540 million (15.5)% Booz Allen Hamilton Restricted Q2 and First Half Fiscal 2026 Results KEY FINANCIAL RESULTS (1) Comparisons are to prior fiscal year period. (2) Reconciliations of Adjusted EBITDA and Adjusted EBITDA Margin on Revenue can be found on Slide 11. Net income margin was 6.1% and 7.7% for the three and six months ended September 30, 2025.
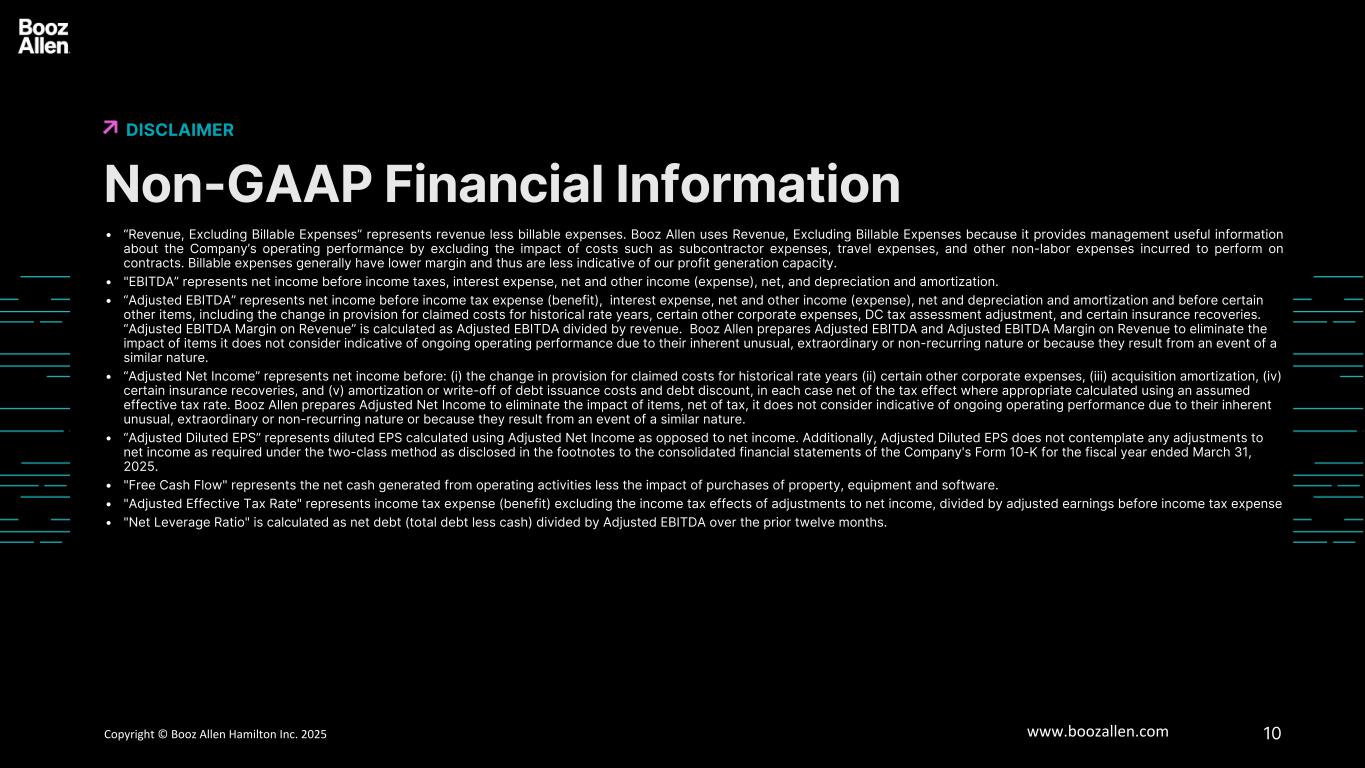
10Copyright © Booz Allen Hamilton Inc. 2025 www.boozallen.com Booz Allen Hamilton Restricted Non-GAAP Financial Information DISCLAIMER • “Revenue, Excluding Billable Expenses” represents revenue less billable expenses. Booz Allen uses Revenue, Excluding Billable Expenses because it provides management useful information about the Company’s operating performance by excluding the impact of costs such as subcontractor expenses, travel expenses, and other non-labor expenses incurred to perform on contracts. Billable expenses generally have lower margin and thus are less indicative of our profit generation capacity. • "EBITDA” represents net income before income taxes, interest expense, net and other income (expense), net, and depreciation and amortization. • “Adjusted EBITDA” represents net income before income tax expense (benefit), interest expense, net and other income (expense), net and depreciation and amortization and before certain other items, including the change in provision for claimed costs for historical rate years, certain other corporate expenses, DC tax assessment adjustment, and certain insurance recoveries. “Adjusted EBITDA Margin on Revenue” is calculated as Adjusted EBITDA divided by revenue. Booz Allen prepares Adjusted EBITDA and Adjusted EBITDA Margin on Revenue to eliminate the impact of items it does not consider indicative of ongoing operating performance due to their inherent unusual, extraordinary or non-recurring nature or because they result from an event of a similar nature. • “Adjusted Net Income” represents net income before: (i) the change in provision for claimed costs for historical rate years (ii) certain other corporate expenses, (iii) acquisition amortization, (iv) certain insurance recoveries, and (v) amortization or write-off of debt issuance costs and debt discount, in each case net of the tax effect where appropriate calculated using an assumed effective tax rate. Booz Allen prepares Adjusted Net Income to eliminate the impact of items, net of tax, it does not consider indicative of ongoing operating performance due to their inherent unusual, extraordinary or non-recurring nature or because they result from an event of a similar nature. • “Adjusted Diluted EPS” represents diluted EPS calculated using Adjusted Net Income as opposed to net income. Additionally, Adjusted Diluted EPS does not contemplate any adjustments to net income as required under the two-class method as disclosed in the footnotes to the consolidated financial statements of the Company's Form 10-K for the fiscal year ended March 31, 2025. • "Free Cash Flow" represents the net cash generated from operating activities less the impact of purchases of property, equipment and software. • "Adjusted Effective Tax Rate" represents income tax expense (benefit) excluding the income tax effects of adjustments to net income, divided by adjusted earnings before income tax expense • "Net Leverage Ratio" is calculated as net debt (total debt less cash) divided by Adjusted EBITDA over the prior twelve months.
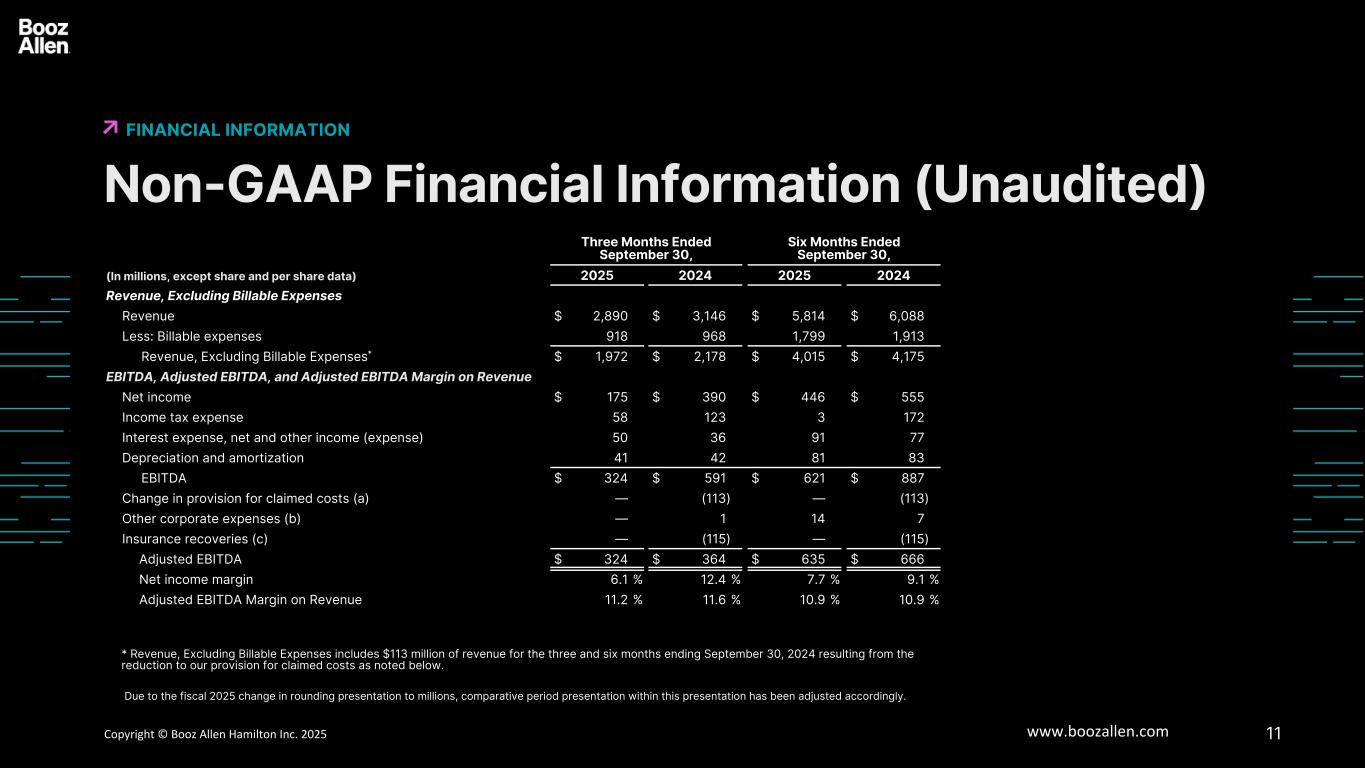
11Copyright © Booz Allen Hamilton Inc. 2025 www.boozallen.com Booz Allen Hamilton Restricted Non-GAAP Financial Information (Unaudited) FINANCIAL INFORMATION Three Months Ended September 30, Six Months Ended September 30, (In millions, except share and per share data) 2025 2024 2025 2024 Revenue, Excluding Billable Expenses Revenue $ 2,890 $ 3,146 $ 5,814 $ 6,088 Less: Billable expenses 918 968 1,799 1,913 Revenue, Excluding Billable Expenses* $ 1,972 $ 2,178 $ 4,015 $ 4,175 EBITDA, Adjusted EBITDA, and Adjusted EBITDA Margin on Revenue Net income $ 175 $ 390 $ 446 $ 555 Income tax expense 58 123 3 172 Interest expense, net and other income (expense) 50 36 91 77 Depreciation and amortization 41 42 81 83 EBITDA $ 324 $ 591 $ 621 $ 887 Change in provision for claimed costs (a) — (113) — (113) Other corporate expenses (b) — 1 14 7 Insurance recoveries (c) — (115) — (115) Adjusted EBITDA $ 324 $ 364 $ 635 $ 666 Net income margin 6.1 % 12.4 % 7.7 % 9.1 % Adjusted EBITDA Margin on Revenue 11.2 % 11.6 % 10.9 % 10.9 % * Revenue, Excluding Billable Expenses includes $113 million of revenue for the three and six months ending September 30, 2024 resulting from the reduction to our provision for claimed costs as noted below. Due to the fiscal 2025 change in rounding presentation to millions, comparative period presentation within this presentation has been adjusted accordingly.
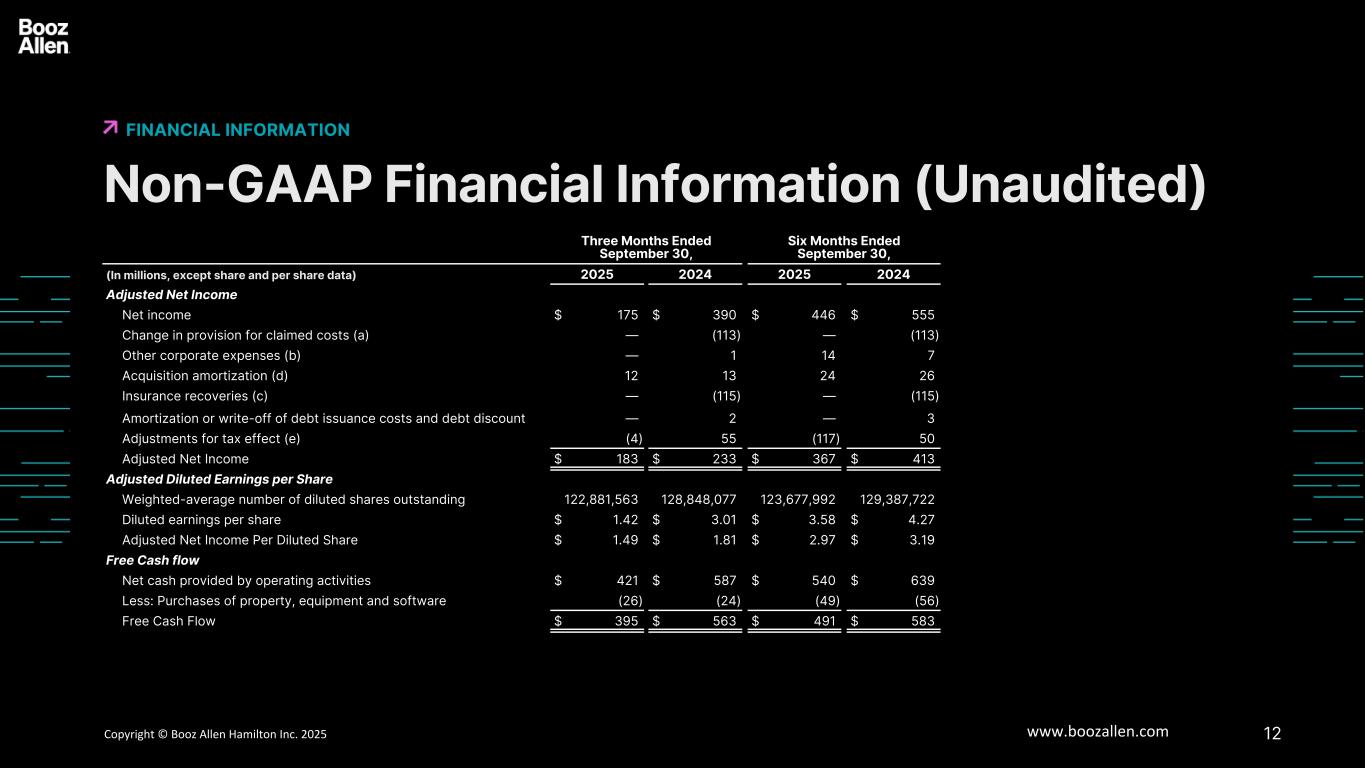
12Copyright © Booz Allen Hamilton Inc. 2025 www.boozallen.com Booz Allen Hamilton Restricted Non-GAAP Financial Information (Unaudited) FINANCIAL INFORMATION Three Months Ended September 30, Six Months Ended September 30, (In millions, except share and per share data) 2025 2024 2025 2024 Adjusted Net Income Net income $ 175 $ 390 $ 446 $ 555 Change in provision for claimed costs (a) — (113) — (113) Other corporate expenses (b) — 1 14 7 Acquisition amortization (d) 12 13 24 26 Insurance recoveries (c) — (115) — (115) Amortization or write-off of debt issuance costs and debt discount — 2 — 3 Adjustments for tax effect (e) (4) 55 (117) 50 Adjusted Net Income $ 183 $ 233 $ 367 $ 413 Adjusted Diluted Earnings per Share Weighted-average number of diluted shares outstanding 122,881,563 128,848,077 123,677,992 129,387,722 Diluted earnings per share $ 1.42 $ 3.01 $ 3.58 $ 4.27 Adjusted Net Income Per Diluted Share $ 1.49 $ 1.81 $ 2.97 $ 3.19 Free Cash flow Net cash provided by operating activities $ 421 $ 587 $ 540 $ 639 Less: Purchases of property, equipment and software (26) (24) (49) (56) Free Cash Flow $ 395 $ 563 $ 491 $ 583
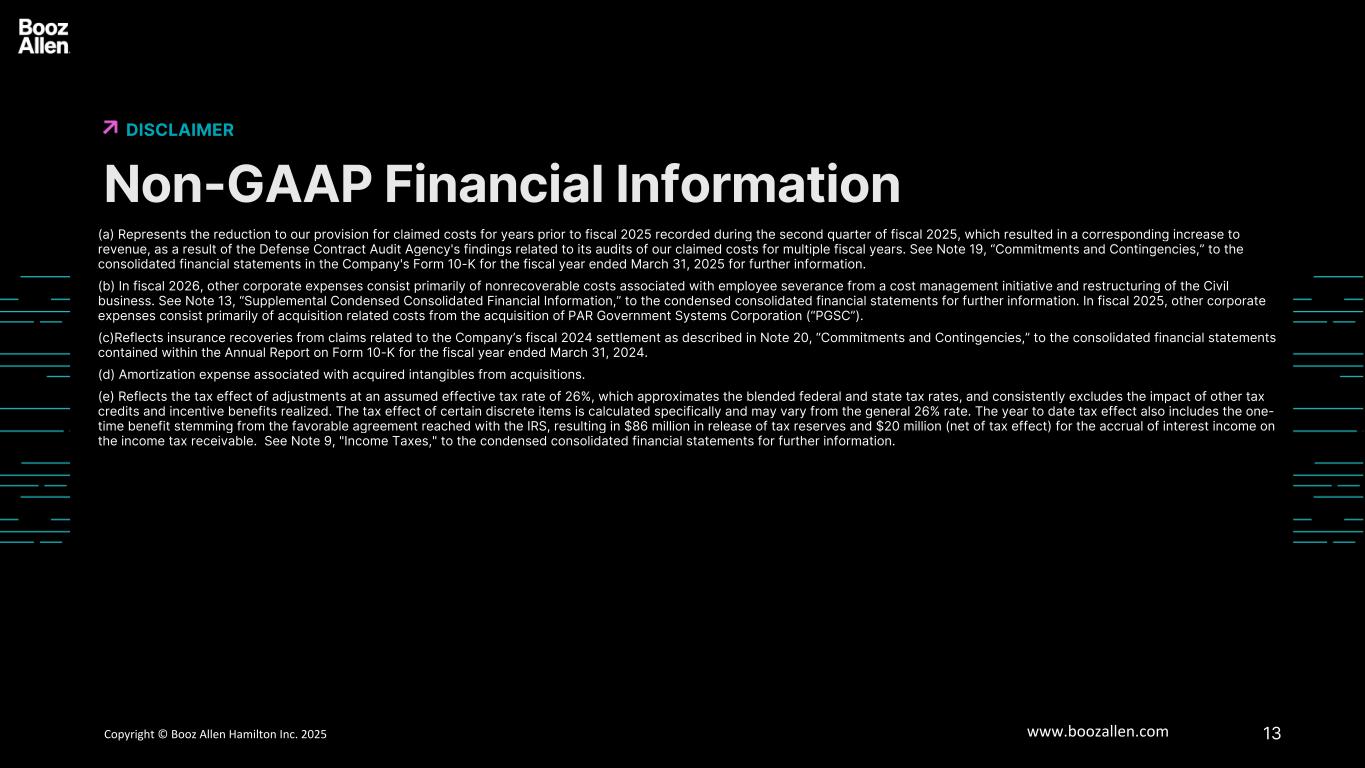
13Copyright © Booz Allen Hamilton Inc. 2025 www.boozallen.com Booz Allen Hamilton Restricted Non-GAAP Financial Information DISCLAIMER (a) Represents the reduction to our provision for claimed costs for years prior to fiscal 2025 recorded during the second quarter of fiscal 2025, which resulted in a corresponding increase to revenue, as a result of the Defense Contract Audit Agency's findings related to its audits of our claimed costs for multiple fiscal years. See Note 19, “Commitments and Contingencies,” to the consolidated financial statements in the Company's Form 10-K for the fiscal year ended March 31, 2025 for further information. (b) In fiscal 2026, other corporate expenses consist primarily of nonrecoverable costs associated with employee severance from a cost management initiative and restructuring of the Civil business. See Note 13, “Supplemental Condensed Consolidated Financial Information,” to the condensed consolidated financial statements for further information. In fiscal 2025, other corporate expenses consist primarily of acquisition related costs from the acquisition of PAR Government Systems Corporation (“PGSC”). (c)Reflects insurance recoveries from claims related to the Company’s fiscal 2024 settlement as described in Note 20, “Commitments and Contingencies,” to the consolidated financial statements contained within the Annual Report on Form 10-K for the fiscal year ended March 31, 2024. (d) Amortization expense associated with acquired intangibles from acquisitions. (e) Reflects the tax effect of adjustments at an assumed effective tax rate of 26%, which approximates the blended federal and state tax rates, and consistently excludes the impact of other tax credits and incentive benefits realized. The tax effect of certain discrete items is calculated specifically and may vary from the general 26% rate. The year to date tax effect also includes the one- time benefit stemming from the favorable agreement reached with the IRS, resulting in $86 million in release of tax reserves and $20 million (net of tax effect) for the accrual of interest income on the income tax receivable. See Note 9, "Income Taxes," to the condensed consolidated financial statements for further information.
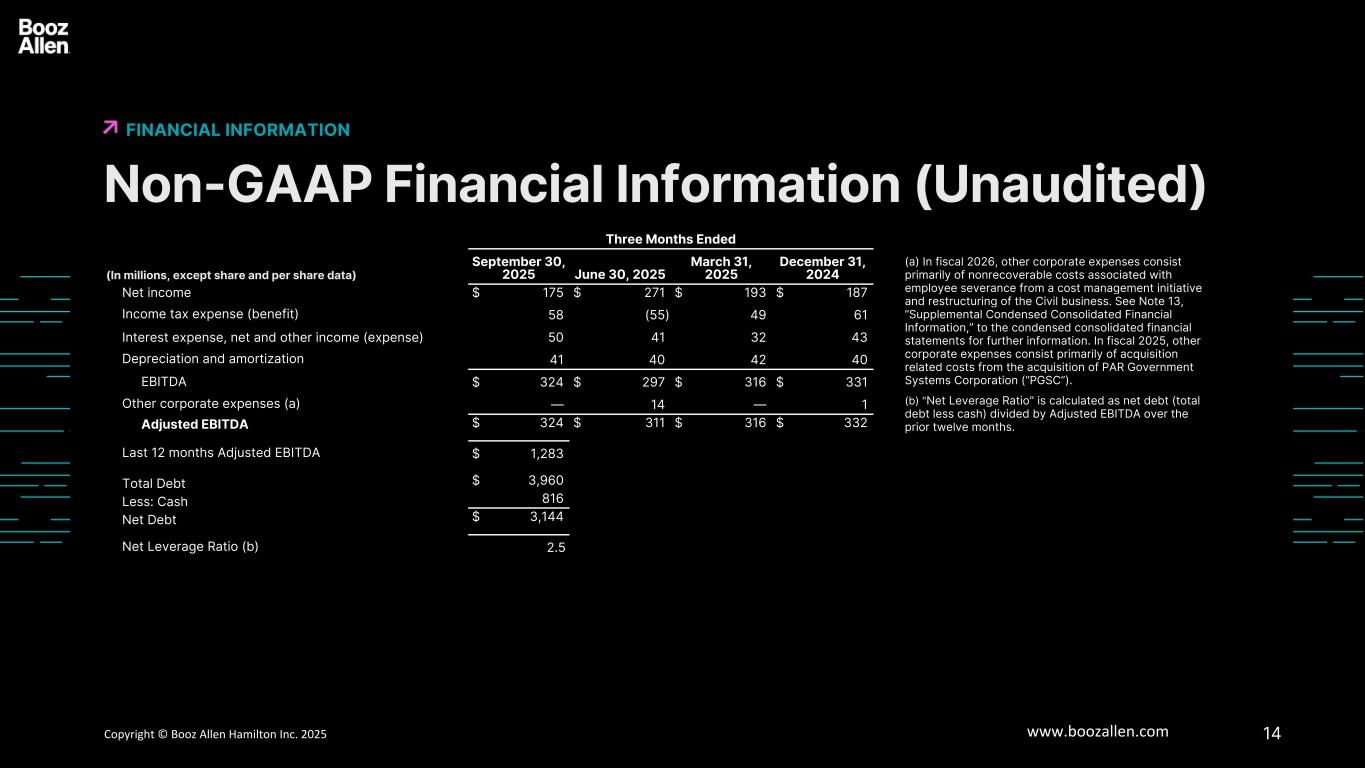
14Copyright © Booz Allen Hamilton Inc. 2025 www.boozallen.com Booz Allen Hamilton Restricted Non-GAAP Financial Information (Unaudited) FINANCIAL INFORMATION (a) In fiscal 2026, other corporate expenses consist primarily of nonrecoverable costs associated with employee severance from a cost management initiative and restructuring of the Civil business. See Note 13, “Supplemental Condensed Consolidated Financial Information,” to the condensed consolidated financial statements for further information. In fiscal 2025, other corporate expenses consist primarily of acquisition related costs from the acquisition of PAR Government Systems Corporation (“PGSC”). (b) "Net Leverage Ratio" is calculated as net debt (total debt less cash) divided by Adjusted EBITDA over the prior twelve months. Three Months Ended (In millions, except share and per share data) September 30, 2025 June 30, 2025 March 31, 2025 December 31, 2024 Net income $ 175 $ 271 $ 193 $ 187 Income tax expense (benefit) 58 (55) 49 61 Interest expense, net and other income (expense) 50 41 32 43 Depreciation and amortization 41 40 42 40 EBITDA $ 324 $ 297 $ 316 $ 331 Other corporate expenses (a) — 14 — 1 Adjusted EBITDA $ 324 $ 311 $ 316 $ 332 Last 12 months Adjusted EBITDA $ 1,283 Total Debt $ 3,960 Less: Cash 816 Net Debt $ 3,144 Net Leverage Ratio (b) 2.5
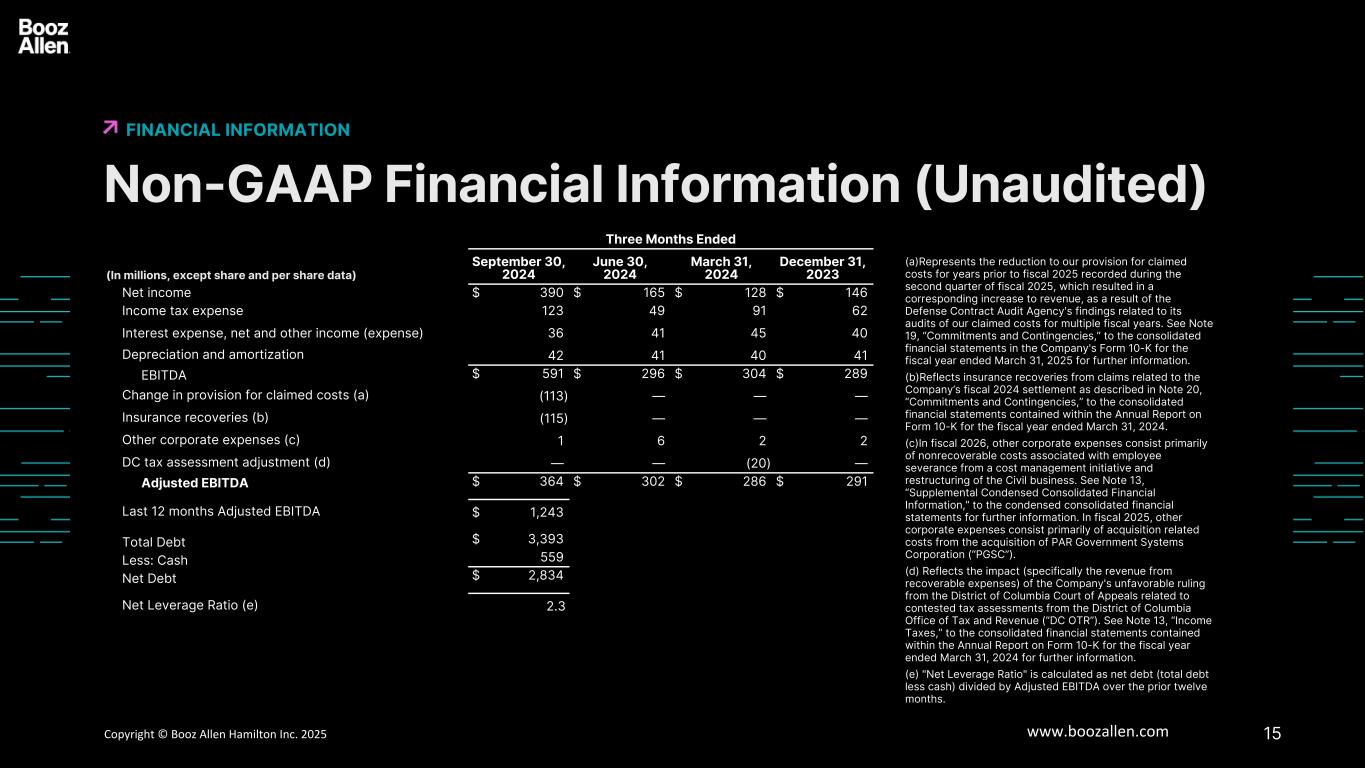
15Copyright © Booz Allen Hamilton Inc. 2025 www.boozallen.com Booz Allen Hamilton Restricted Non-GAAP Financial Information (Unaudited) FINANCIAL INFORMATION (a)Represents the reduction to our provision for claimed costs for years prior to fiscal 2025 recorded during the second quarter of fiscal 2025, which resulted in a corresponding increase to revenue, as a result of the Defense Contract Audit Agency's findings related to its audits of our claimed costs for multiple fiscal years. See Note 19, “Commitments and Contingencies,” to the consolidated financial statements in the Company's Form 10-K for the fiscal year ended March 31, 2025 for further information. (b)Reflects insurance recoveries from claims related to the Company’s fiscal 2024 settlement as described in Note 20, “Commitments and Contingencies,” to the consolidated financial statements contained within the Annual Report on Form 10-K for the fiscal year ended March 31, 2024. (c)In fiscal 2026, other corporate expenses consist primarily of nonrecoverable costs associated with employee severance from a cost management initiative and restructuring of the Civil business. See Note 13, “Supplemental Condensed Consolidated Financial Information,” to the condensed consolidated financial statements for further information. In fiscal 2025, other corporate expenses consist primarily of acquisition related costs from the acquisition of PAR Government Systems Corporation (“PGSC”). (d) Reflects the impact (specifically the revenue from recoverable expenses) of the Company's unfavorable ruling from the District of Columbia Court of Appeals related to contested tax assessments from the District of Columbia Office of Tax and Revenue (“DC OTR”). See Note 13, “Income Taxes,” to the consolidated financial statements contained within the Annual Report on Form 10-K for the fiscal year ended March 31, 2024 for further information. (e) "Net Leverage Ratio" is calculated as net debt (total debt less cash) divided by Adjusted EBITDA over the prior twelve months. Three Months Ended (In millions, except share and per share data) September 30, 2024 June 30, 2024 March 31, 2024 December 31, 2023 Net income $ 390 $ 165 $ 128 $ 146 Income tax expense 123 49 91 62 Interest expense, net and other income (expense) 36 41 45 40 Depreciation and amortization 42 41 40 41 EBITDA $ 591 $ 296 $ 304 $ 289 Change in provision for claimed costs (a) (113) — — — Insurance recoveries (b) (115) — — — Other corporate expenses (c) 1 6 2 2 DC tax assessment adjustment (d) — — (20) — Adjusted EBITDA $ 364 $ 302 $ 286 $ 291 Last 12 months Adjusted EBITDA $ 1,243 Total Debt $ 3,393 Less: Cash 559 Net Debt $ 2,834 Net Leverage Ratio (e) 2.3
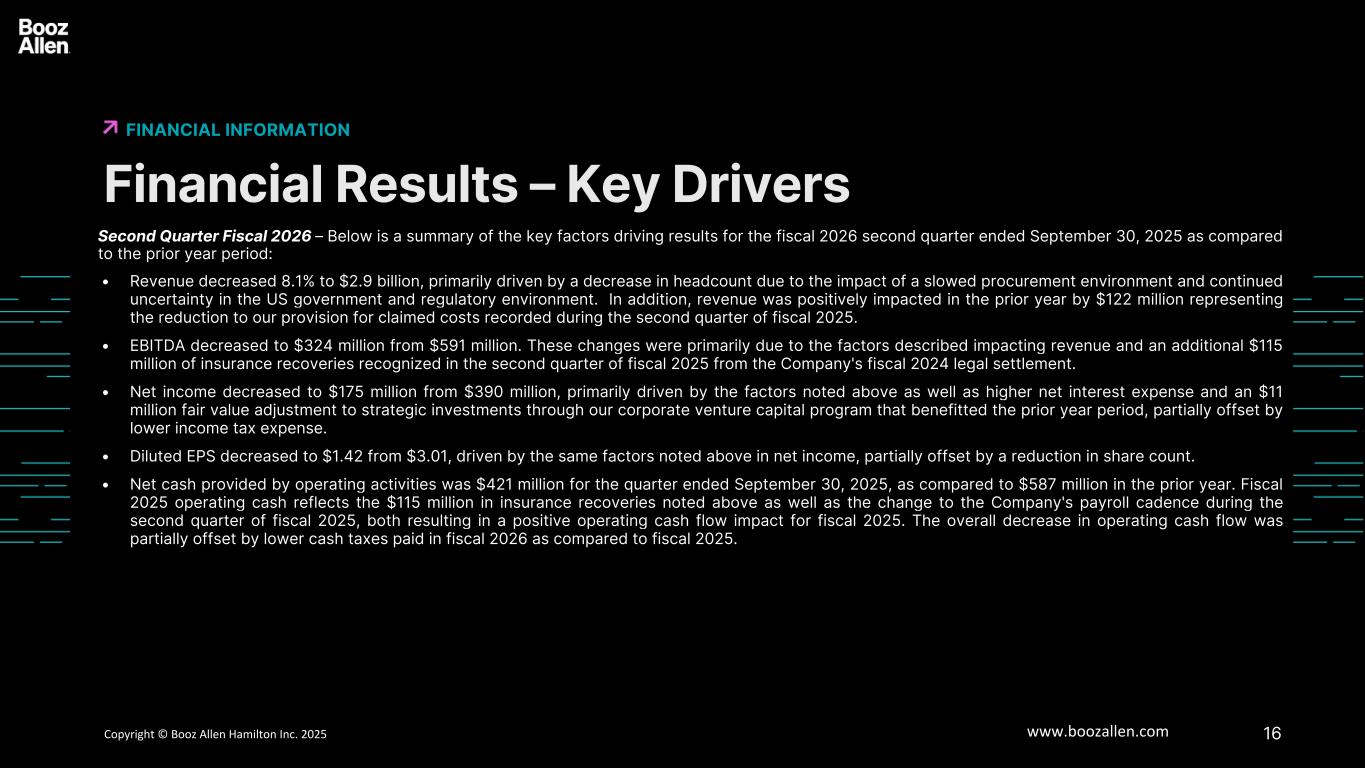
16Copyright © Booz Allen Hamilton Inc. 2025 www.boozallen.com Booz Allen Hamilton Restricted Financial Results – Key Drivers FINANCIAL INFORMATION Second Quarter Fiscal 2026 – Below is a summary of the key factors driving results for the fiscal 2026 second quarter ended September 30, 2025 as compared to the prior year period: • Revenue decreased 8.1% to $2.9 billion, primarily driven by a decrease in headcount due to the impact of a slowed procurement environment and continued uncertainty in the US government and regulatory environment. In addition, revenue was positively impacted in the prior year by $122 million representing the reduction to our provision for claimed costs recorded during the second quarter of fiscal 2025. • EBITDA decreased to $324 million from $591 million. These changes were primarily due to the factors described impacting revenue and an additional $115 million of insurance recoveries recognized in the second quarter of fiscal 2025 from the Company's fiscal 2024 legal settlement. • Net income decreased to $175 million from $390 million, primarily driven by the factors noted above as well as higher net interest expense and an $11 million fair value adjustment to strategic investments through our corporate venture capital program that benefitted the prior year period, partially offset by lower income tax expense. • Diluted EPS decreased to $1.42 from $3.01, driven by the same factors noted above in net income, partially offset by a reduction in share count. • Net cash provided by operating activities was $421 million for the quarter ended September 30, 2025, as compared to $587 million in the prior year. Fiscal 2025 operating cash reflects the $115 million in insurance recoveries noted above as well as the change to the Company's payroll cadence during the second quarter of fiscal 2025, both resulting in a positive operating cash flow impact for fiscal 2025. The overall decrease in operating cash flow was partially offset by lower cash taxes paid in fiscal 2026 as compared to fiscal 2025.