Exhibit 99.1
Investor Presentation September 2025
FORWARD - LOOKING STATEMENTS Special Note Concerning Forward - Looking Statements . This document contains, and future oral and written statements of the Company and its management may contain, forward - looking statements within the meaning of the Private Securities Litigation Reform Act of 1995 with respect to the financial condition, results of operations, plans, objectives, future performance and business of the Company . Forward - looking statements, which may be based upon beliefs, expectations and assumptions of the Company’s management and on information currently available to management, are generally identifiable by the use of words such as “believe,” “expect,” “anticipate,” “bode”, “predict,” “suggest,” “project”, “appear,” “plan,” “intend,” “estimate,” ”annualize,” “may,” “will,” “would,” “could,” “should,” “likely,” “might,” “potential,” “continue,” “annualized,” “target,” “outlook,” as well as the negative forms of those words, or other similar expressions . Additionally, all statements in this document, including forward - looking statements, speak only as of the date they are made, and the Company undertakes no obligation to update any statement in light of new information or future events . A number of factors, many of which are beyond the ability of the Company to control or predict, could cause actual results to differ materially from those in its forward - looking statements . These factors include, but are not limited to : (i) the strength of the local, state, national and international economies and financial markets, including effects of inflationary pressures, the threat or implementation of tariffs, trade wars and changes to immigration policy ; (ii) changes in, and the interpretation and prioritization of, local, state and federal laws, regulations and governmental policies (including those concerning the Company’s general business) ; (iii) the economic impact of any future terrorist threats and attacks, widespread disease or pandemics, acts of war or threats thereof (including the Russian invasion of Ukraine and ongoing conflicts in the Middle East), or other adverse events that could cause economic deterioration or instability in credit markets, and the response of the local, state and national governments to any such adverse external events ; (iv) new or revised accounting policies and practices, as may be adopted by state and federal regulatory agencies, the FASB, the Securities and Exchange Commission (the “SEC”) or the PCAOB ; (v) the imposition of tariffs or other governmental policies impacting the value of products produced by the Company’s commercial borrowers ; (vi) increased competition in the financial services sector, including from non - bank competitors such as credit unions, fintech companies, and digital asset service providers and the inability to attract new customers ; (vii) rapid technological changes implemented by us and our third - party vendors, including the development and implementation of tools incorporating artificial intelligence ; (viii) unexpected results of acquisitions, including failure to realize the anticipated benefits of the acquisitions and the possibility that transaction and integration costs may be greater than anticipated ; (ix) the loss of key executives and employees, talent shortages and employee turnover ; (x) changes in consumer spending ; (xi) unexpected outcomes and costs of existing or new litigation or other legal proceedings and regulatory actions involving the Company ; (xii) the economic impact on the Company and its customers of climate change, natural disasters and exceptional weather occurrences such as tornadoes, floods and blizzards ; (xiii) fluctuations in the value of securities held in our securities portfolio, including as a result of changes in interest rates ; (xiv) credit risk and risks from concentrations (by type of borrower, geographic area, collateral and industry) within our loan portfolio and large loans to certain borrowers (including CRE loans) ; (xv) the overall health of the local and national real estate market ; (xvi) the ability to maintain an adequate level of allowance for credit losses on loans ; (xvii) the concentration of large deposits from certain clients who have balances above current FDIC insurance limits and who may withdraw deposits to diversify their exposure ; (xviii) the ability to successfully manage liquidity risk, which may increase dependence on non - core funding sources such as brokered deposits, and may negatively impact the Company’s cost of funds ; (xix) the level of non - performing assets on our balance sheet ; (xx) interruptions involving our information technology and communications systems or third - party servicers ; (xxi) the occurrence of fraudulent activity, breaches or failures of our third - party vendors’ information security controls or cybersecurity - related incidents, including as a result of sophisticated attacks using artificial intelligence and similar tools or as a result of insider fraud ; (xxii) changes in the interest rates and repayment rates of the Company’s assets ; (xxiii) the effectiveness of the Company’s risk management framework, (xxiv) the ef fects of the current U . S . government shutdown, including the impact of prolonged closures or staffing reductions at government agencies ef fecting our business (for instance, the U . S . Department of Housing and Urban Development involvement with our LIHTC lending business), and (xxv) the ability of the Company to manage the risks associated with the foregoing . These risks and uncertainties should be considered in evaluating forward - looking statements and undue reliance should not be placed on such statements . Additional information concerning the Company and its business, including additional factors that could materially affect the Company’s financial results, is included in the Company’s filings with the SEC . NON - GAAP FINANCIAL MEASURES These slides contain non - GAAP financial measures . For purposes of Regulation G, a non - GAAP financial measure is a numerical measure of the registrant ’ s historical or future financial performance, financial position or cash flows that excludes amounts, or is subject to adjustments that have the effect of excluding amounts, that are included in the most directly comparable measure calculated and presented in accordance with GAAP in the statement of income, balance sheet or statement of cash flows (or equivalent statements) of the issuer ; or includes amounts, or is subject to adjustments that have the effect of including amounts, that are excluded from the most directly comparable measure so calculated and presented . In this regard, GAAP refers to generally accepted accounting principles in the United States . Pursuant to the requirement of Regulation G, the Company has provided reconciliations within the slides, as necessary, of the non - GAAP financial measure to the most directly comparable GAAP financial measure . For more details on the Company’s non - GAAP measures, refer to the Company’s Annual Report on Form 10 - K for the year ended December 31 , 2024 .
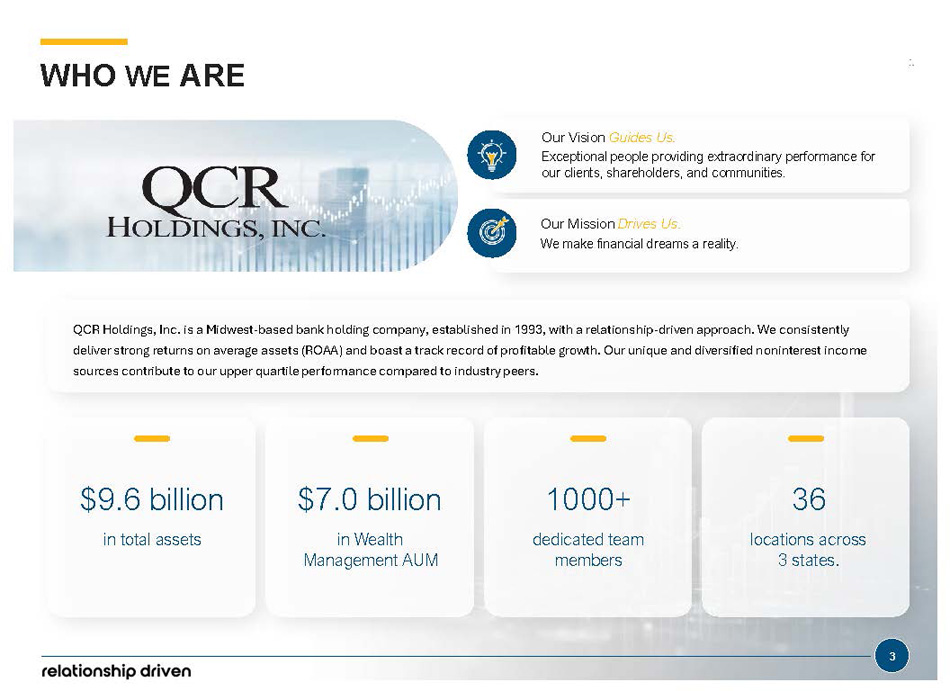
Our Vision Guides Us. Exceptional people providing extraordinary performance for our clients, shareholders, and communities. Our Mission Drives Us. We make financial dreams a reality. QCR Holdings, Inc. is a Midwest - based bank holding company, established in 1993, with a relationship - driven approach. We consistently deliver strong returns on average assets (ROAA) and boast a track record of profitable growth. Our unique and diversified noninterest income sources contribute to our upper quartile performance compared to industry peers. $9.6 billion in total assets $7.0 billion in Wealth Management AUM 1000+ dedicated team members 36 locations across 3 states. WHO WE ARE 3
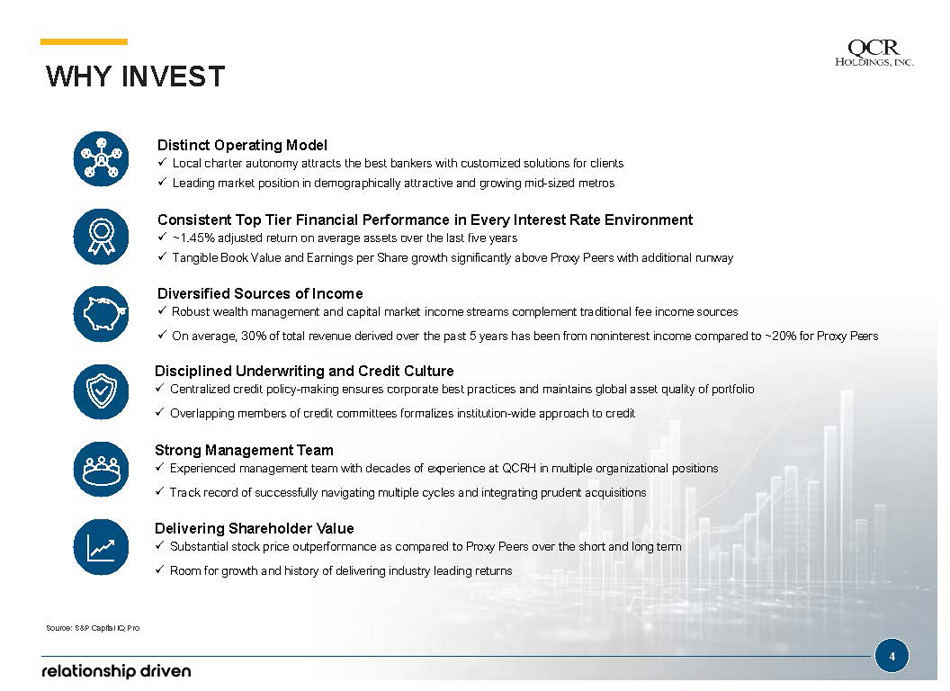
WHY INVEST Distinct Operating Model x Local charter autonomy attracts the best bankers with customized solutions for clients x Leading market position in demographically attractive and growing mid - sized metros Consistent Top Tier Financial Performance in Every Interest Rate Environment x ~1.45% adjusted return on average assets over the last five years x Tangible Book Value and Earnings per Share growth significantly above Proxy Peers with additional runway Diversified Sources of Income x Robust wealth management and capital market income streams complement traditional fee income sources x On average, 30% of total revenue derived over the past 5 years has been from noninterest income compared to ~20% for Proxy Peers Disciplined Underwriting and Credit Culture x Centralized credit policy - making ensures corporate best practices and maintains global asset quality of portfolio x Overlapping members of credit committees formalizes institution - wide approach to credit Strong Management Team x Experienced management team with decades of experience at QCRH in multiple organizational positions x Track record of successfully navigating multiple cycles and integrating prudent acquisitions Delivering Shareholder Value x Substantial stock price outperformance as compared to Proxy Peers over the short and long term x Room for growth and history of delivering industry leading returns Source: S&P Capital IQ Pro 4
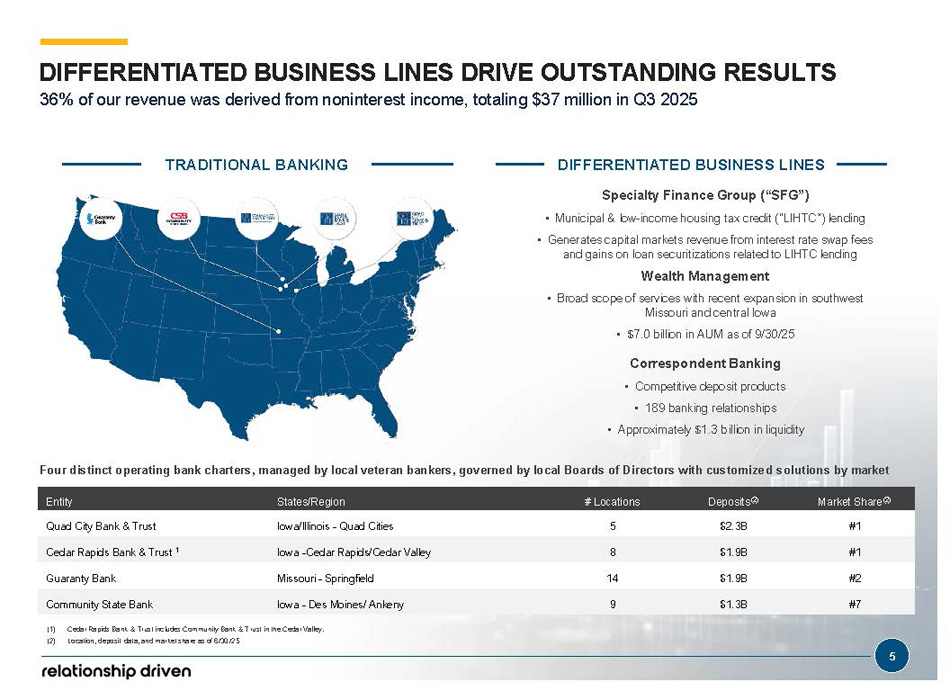
Market Share (2) Deposits (2) # Locations States/Region Entity #1 $2.3B 5 Iowa/Illinois - Quad Cities Quad City Bank & Trust #1 $1.9B 8 Iowa - Cedar Rapids/Cedar Valley Cedar Rapids Bank & Trust 1 #2 $1.9B 14 Missouri - Springfield Guaranty Bank #7 $1.3B 9 Iowa - Des Moines/ Ankeny Community State Bank • Municipal & low - income housing tax credit (“LIHTC”) lending • Generates capital markets revenue from interest rate swap fees and gains on loan securitizations related to LIHTC lending Wealth Management • Broad scope of services with recent expansion in southwest Missouri and central Iowa • $7.0 billion in AUM as of 9/30/25 Correspondent Banking • Competitive deposit products • 189 banking relationships • Approximately $1.3 billion in liquidity Four distinct operating bank charters, managed by local veteran bankers, governed by local Boards of Directors with customize d solutions by market DIFFERENTIATED BUSINESS LINES Specialty Finance Group (“SFG”) TRADITIONAL BANKING (1) Cedar Rapids Bank & Trust includes Community Bank & Trust in the Cedar Valley. (2) Location, deposit data, and market share as of 6/30/25 DIFFERENTIATED BUSINESS LINES DRIVE OUTSTANDING RESULTS 36% of our revenue was derived from noninterest income, totaling $37 million in Q3 2025 5
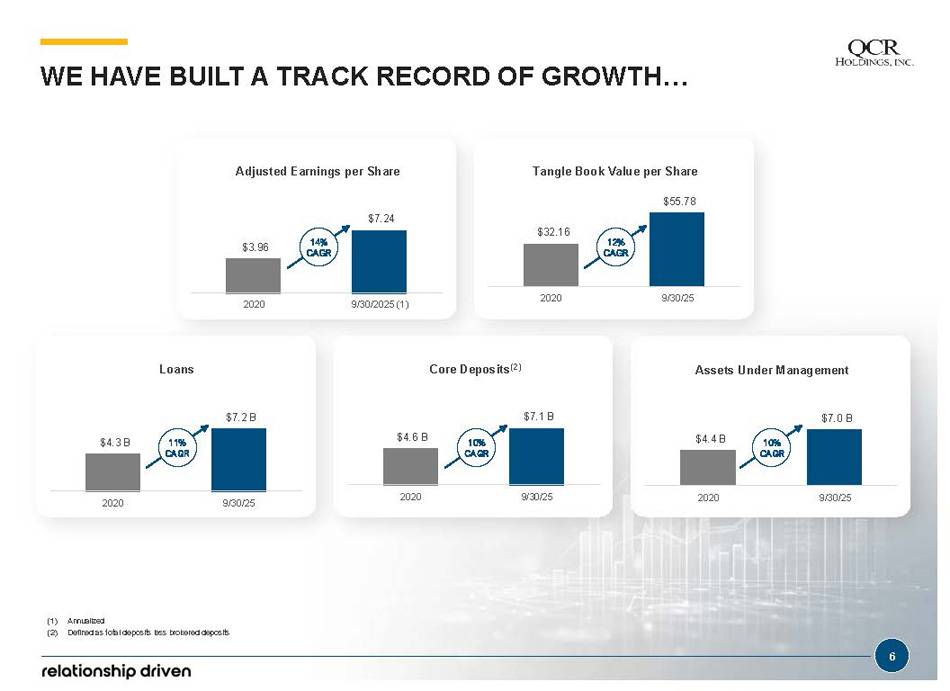
WE HAVE BUILT A TRACK RECORD OF GROWTH… (1) Annualized (2) Defined as total deposits less brokered deposits Adjusted Earnings per Share $3.96 $7.24 2020 9/30/2025 (1) 14% CAGR $32.16 $55.78 2020 9/30/25 Tangle Book Value per Share $4.4 B $7.0 B 2020 9/30/25 Assets Under Management Loans $4.3 B $7.2 B 2020 9/30/25 $4.6 B $7.1 B 2020 9/30/25 Core Deposits (2) 12% CAGR 11% CAGR 10% CAGR 10% CAGR 6
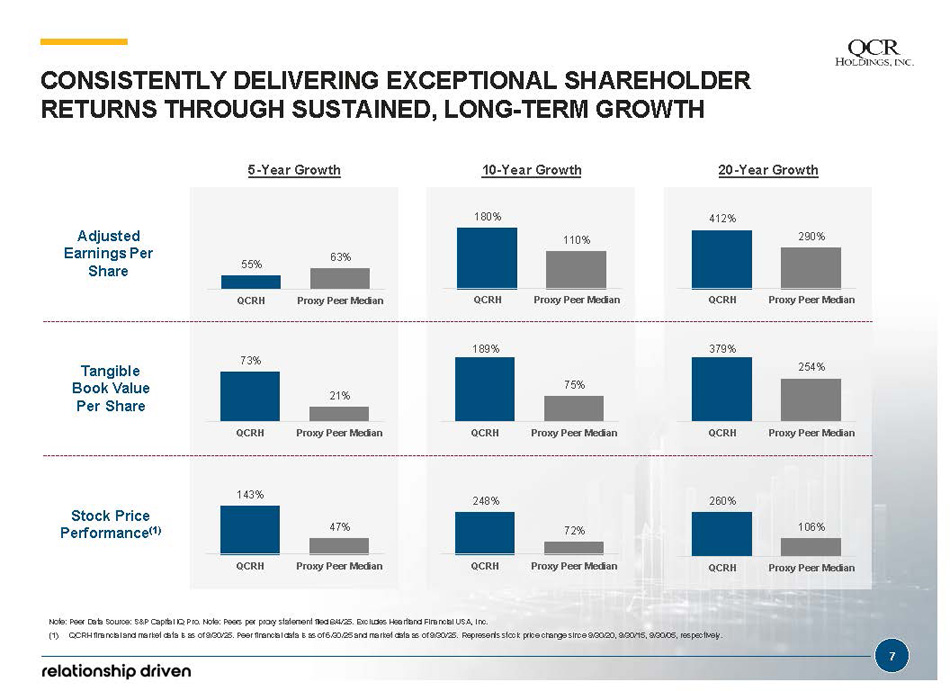
CONSISTENTLY DELIVERING EXCEPTIONAL SHAREHOLDER RETURNS THROUGH SUSTAINED, LONG - TERM GROWTH Note: Peer Data Source: S&P Capital IQ Pro. Note: Peers per proxy statement filed 8/4/25. Excludes Heartland Financial USA, Inc. Adjusted Earnings Per Share Tangible Book Value Per Share Stock Price Performance (1) 20 - Year Growth 55% 63% QCRH Proxy Peer Median 180% 110% QCRH Proxy Peer Median 412% 290% QCRH Proxy Peer Median 379% 254% QCRH Proxy Peer Median 10 - Year Growth 5 - Year Growth 189% 75% QCRH Proxy Peer Median 73% 21% QCRH Proxy Peer Median 143% (1) QCRH financial and market data is as of 9/30/25. Peer financial data is as of 6/30/25 and market data as of 9/30/25. Represents stock price change since 9/30/20, 9/30/15, 9/30/05, respectively. 7 47% QCRH Proxy Peer Median 248% 72% QCRH Proxy Peer Median 260% 106% QCRH Proxy Peer Median
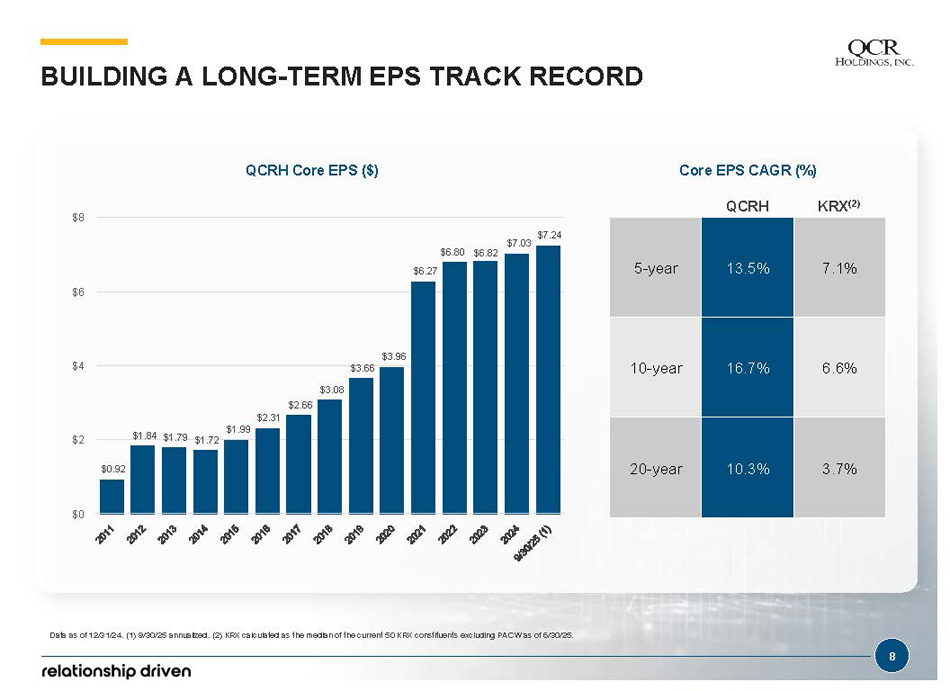
QCRH Core EPS ($) Core EPS CAGR (%) 7.1% 13.5% 5 - year 6.6% 16.7% 10 - year 3.7% 10.3% 20 - year $3.96 $3.66 $6.27 $6.80 $6.82 $7.03 $7.24 $0 $3.08 $2.66 $2.31 $2 $1.84 $1.79 $1.72 $1.99 $0.92 $4 $6 $8 BUILDING A LONG - TERM EPS TRACK RECORD Data as of 12/31/24. (1) 9/30/25 annualized. (2) KRX calculated as the median of the current 50 KRX constituents excluding PA CW as of 6/30/25. 8 KRX (2) QCRH
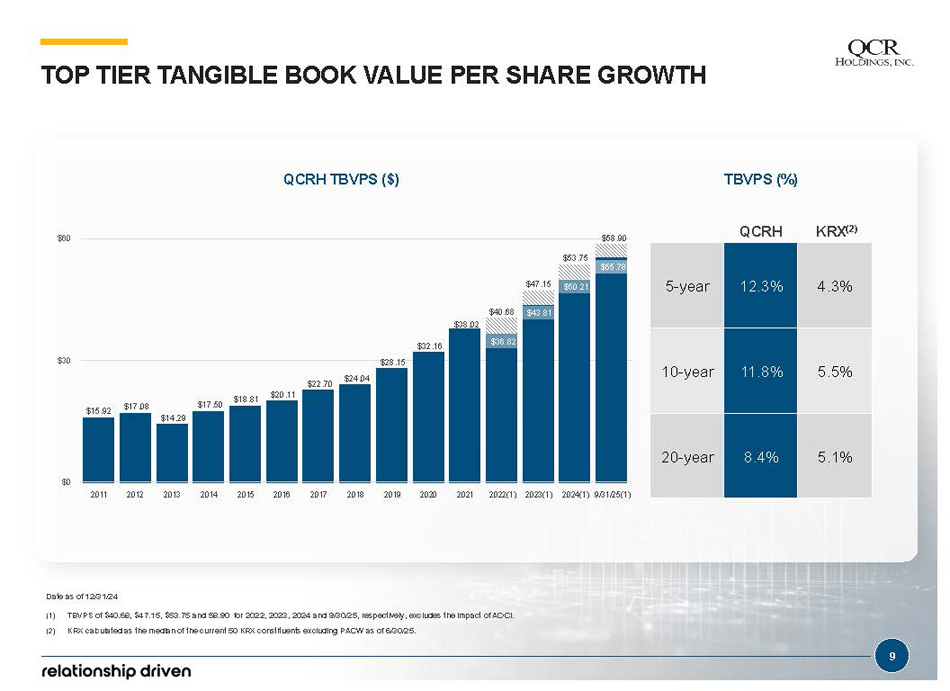
QCRH TBVPS ($) TBVPS (%) $15 .92 $17 .08 $14 .29 $17 .50 $18 .81 $20 .11 $22 .70 $24 .04 $28 .15 $32 .16 $38 .02 $36 .82 $43 .81 $50 .21 $40 .68 9 $47 .15 $53 .75 $55 .78 $58 .90 $0 $30 $60 2011 2012 2013 2014 2015 2016 2017 2018 2019 2020 2021 2022(1) 2023(1) 2024(1) 9/31/25(1) 4.3% 12.3% 5 - year 5.5% 11.8% 10 - year 5.1% 8.4% 20 - year KRX (2) TOP TIER TANGIBLE BOOK VALUE PER SHARE GROWTH QCRH Date as of 12/31/24 (1) TBVPS of $40.68, $4 7.15, $53.75 and 58.90 for 202 2, 2023 , 2024 and 9/30/25, respectively, excludes the impact of AOCI. (2) KRX calculated as the median of the current 50 KRX constituents excluding PACW as of 6/30/25.
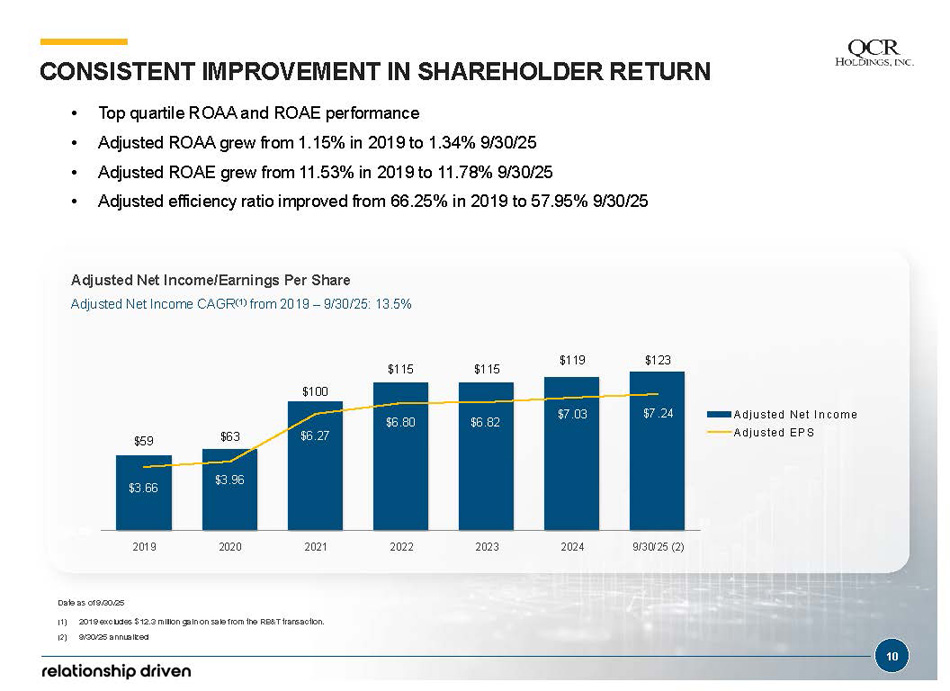
Adjusted Net Income/Earnings Per Share Adjusted Net Income CAGR (1) from 2019 – 9/30/25: 13.5% CONSISTENT IMPROVEMENT IN SHAREHOLDER RETURN • Top quartile ROAA and ROAE performance • Adjusted ROAA grew from 1.15% in 2019 to 1.34% 9/30/25 • Adjusted ROAE grew from 11.53% in 2019 to 11.78% 9/30/25 • Adjusted efficiency ratio improved from 66.25% in 2019 to 57.95% 9/30/25 $59 $63 $100 $115 $115 $119 $123 $3.66 $3.96 $6.27 $6.80 $6.82 $7.03 $7.24 $0.00 2019 2020 2021 2022 2023 2024 9/30/25 (2) Adjus ted Net I ncom e Adjus ted EP S 10 Date as of 9 /30 /25 (1) 201 9 excludes $ 12.3 million gain on sale from the RB&T transaction. (2) 9/30/25 annualized
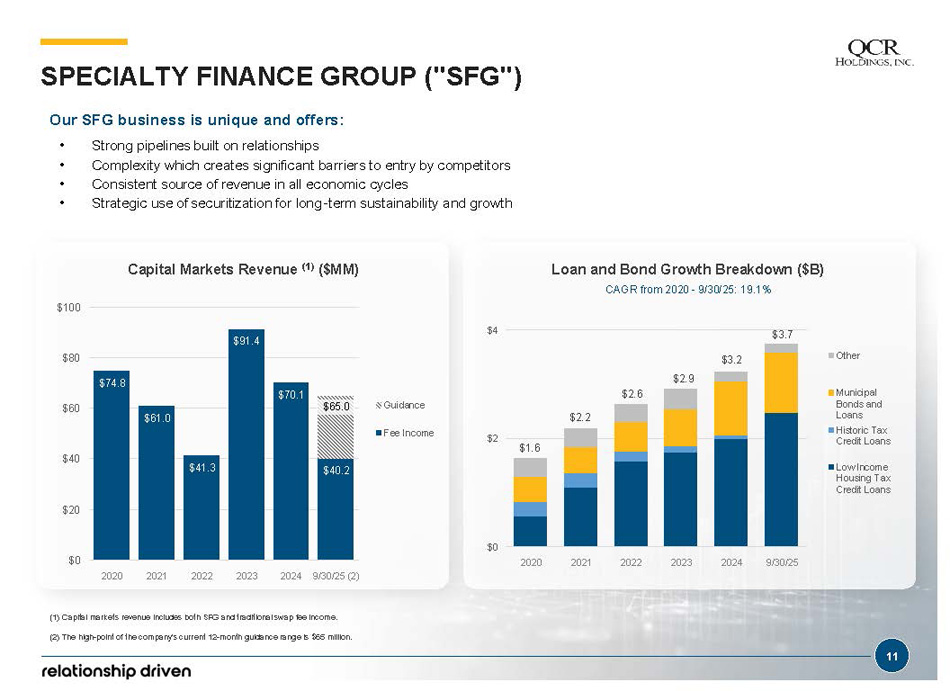
$74.8 $61.0 $41.3 $91.4 $70.1 $40.2 $65.0 $0 $20 $40 $60 $80 $100 2020 2021 2022 2023 2024 9/30/25 (2) Guidance Fee Income Our SFG business is unique and offers: • Strong pipelines built on relationships • Complexity which creates significant barriers to entry by competitors • Consistent source of revenue in all economic cycles • Strategic use of securitization for long - term sustainability and growth $0 $2 $4 2020 2021 2022 2023 2024 9/30/25 Other Municipal Bonds and Loans Historic Tax Credit Loans Low Income Housing Tax Credit Loans 11 $1.6 $2.2 $2.6 $3.2 $3.7 $2.9 SPECIALTY FINANCE GROUP ("SFG") Capital Markets Revenue (1) ($MM) Loan and Bond Growth Breakdown ($B) CAGR from 2020 - 9/30/25: 19.1% (1) Capital markets revenue includes both SFG and traditional swap fee income. (2) The high - point of the company's current 12 - month guidance range is $65 million.
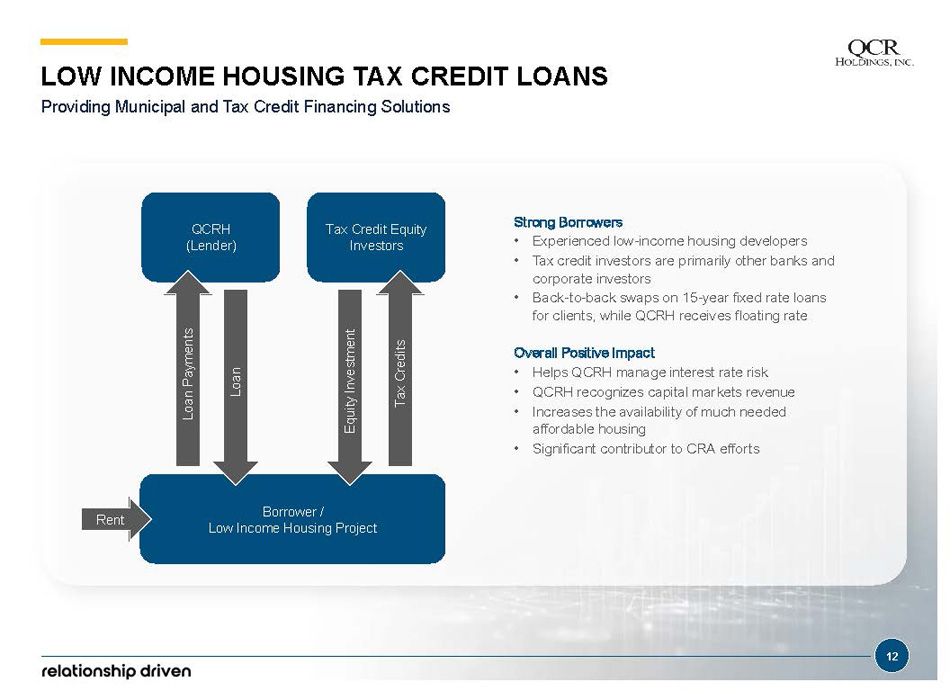
QCRH (Lender) Borrower / Low Income Housing Project Tax Credit Equity Investors Loan Payments Tax Credits Equity Investment Loan Rent 12 Strong Borrowers • Experienced low - income housing developers • Tax credit investors are primarily other banks and corporate investors • Back - to - back swaps on 15 - year fixed rate loans for clients, while QCRH receives floating rate Overall Positive Impact • Helps QCRH manage interest rate risk • QCRH recognizes capital markets revenue • Increases the availability of much needed affordable housing • Significant contributor to CRA efforts LOW INCOME HOUSING TAX CREDIT LOANS Providing Municipal and Tax Credit Financing Solutions
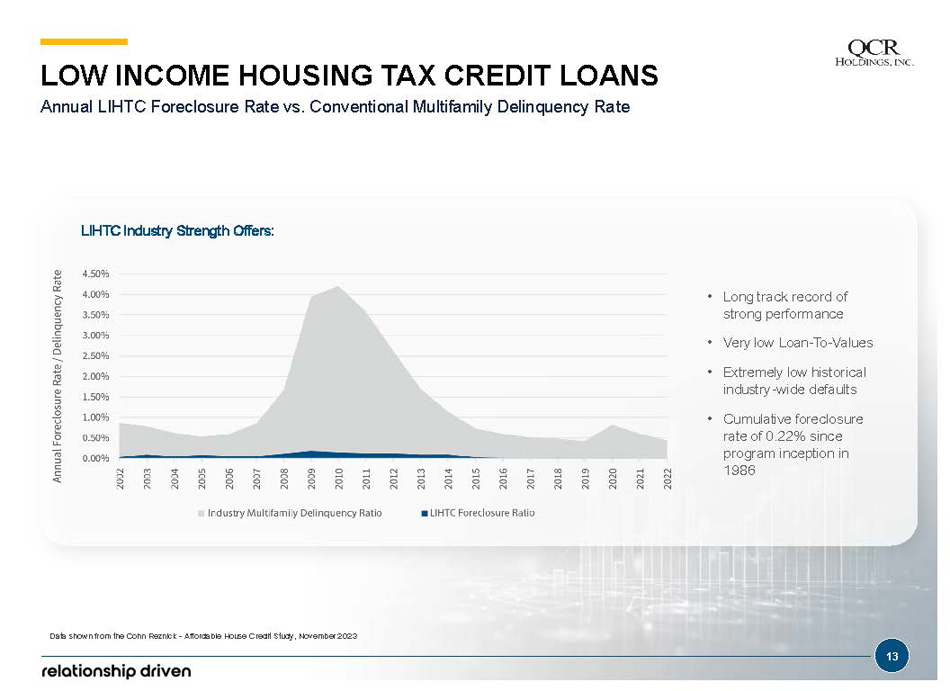
LOW INCOME HOUSING TAX CREDIT LOANS Annual LIHTC Foreclosure Rate vs. Conventional Multifamily Delinquency Rate • Long track record of strong performance • Very low Loan - To - Values • Extremely low historical industry - wide defaults • Cumulative foreclosure rate of 0.22% since program inception in 1986 Data shown from the Cohn Reznick - Affordable House Credit Study, November 20 23 LIHTC Industry Strength Offers: 13
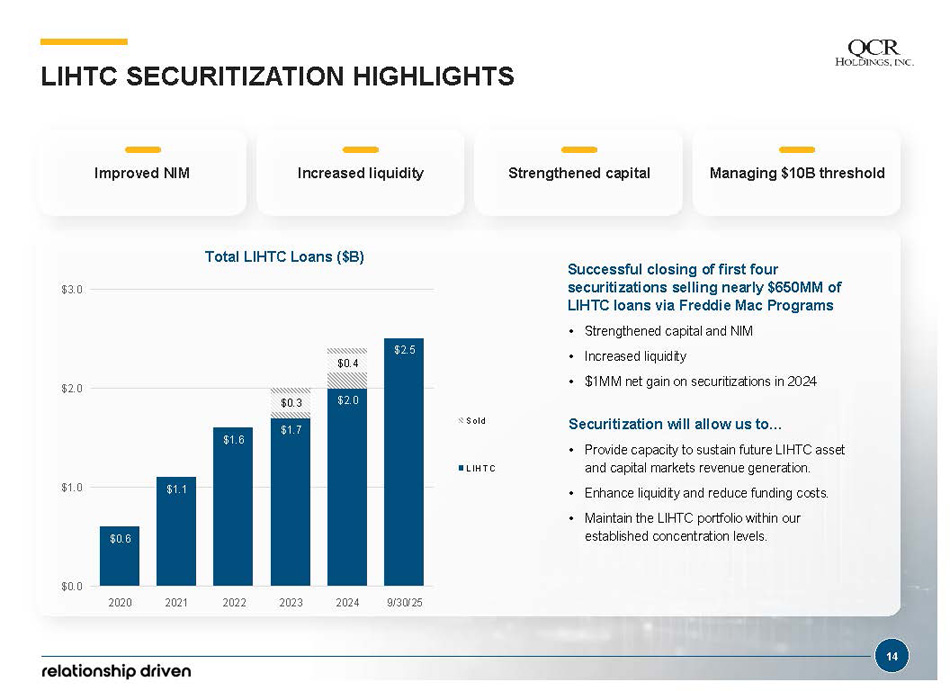
Successful closing of first four securitizations selling nearly $650MM of LIHTC loans via Freddie Mac Programs • Strengthened capital and NIM • Increased liquidity • $1MM net gain on securitizations in 2024 Securitization will allow us to… • Provide capacity to sustain future LIHTC asset and capital markets revenue generation. • Enhance liquidity and reduce funding costs. • Maintain the LIHTC portfolio within our established concentration levels. $0.6 $1.1 $1.6 $1.7 $2.0 $2.5 $0.3 $0.4 $0.0 $1.0 $2.0 $3.0 2020 2021 2022 2023 2024 9/30/25 S old L IH T C LIHTC SECURITIZATION HIGHLIGHTS Total LIHTC Loans ($B) Improved NIM Increased liquidity Strengthened capital Managing $10B threshold 14
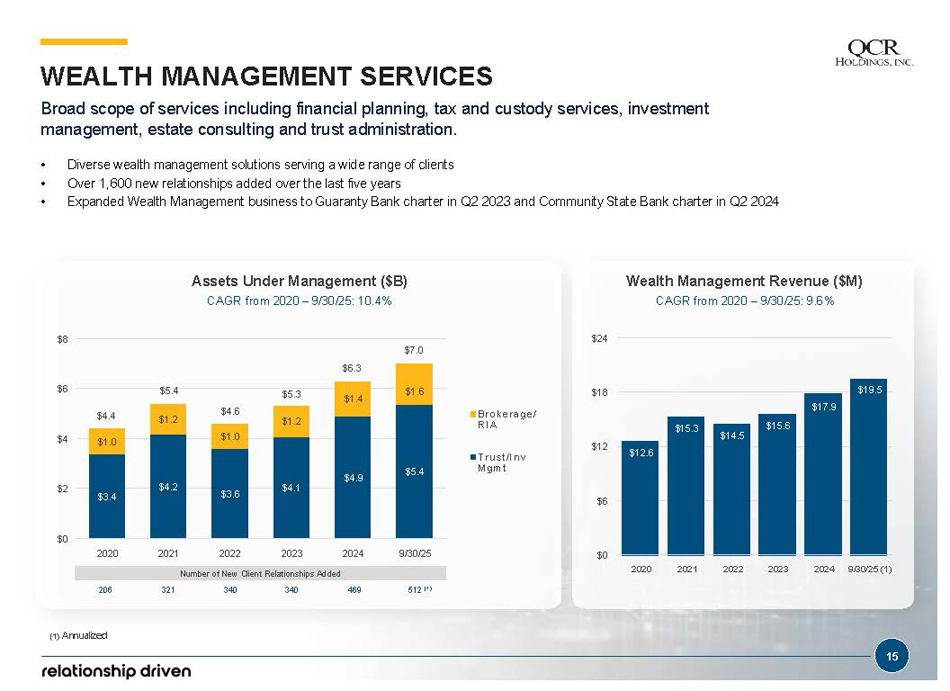
$3.4 $4.2 $3.6 $4.1 $4.9 $5.4 $1.0 $1.2 $1.0 $1.2 $1.4 $1.6 $0 $2 $4 $6 $8 2020 2021 2022 2023 2024 9/30/25 Bro ke ra ge/ RIA Trus t/ I nv Mgm t $4.6 $5.3 $12.6 15 $15.3 $14.5 $15.6 $17.9 $19.5 $0 $6 $12 $18 $24 2020 2021 2022 2023 2024 9/30/25 (1) Wealth Management Revenue ($M) CAGR from 2020 – 9/30/25: 9.6% Broad scope of services including financial planning, tax and custody services, investment management, estate consulting and trust administration. • Diverse wealth management solutions serving a wide range of clients • Over 1,600 new relationships added over the last five years • Expanded Wealth Management business to Guaranty Bank charter in Q2 2023 and Community State Bank charter in Q2 2024 $4.4 $5.4 $6.3 Assets Under Management ($B) CAGR from 2020 – 9/30/25: 10.4% Number of New Clien t Relationships Ad ded 206 321 340 340 469 WEALTH MANAGEMENT SERVICES $7.0 512 (1 ) (1) Annualized
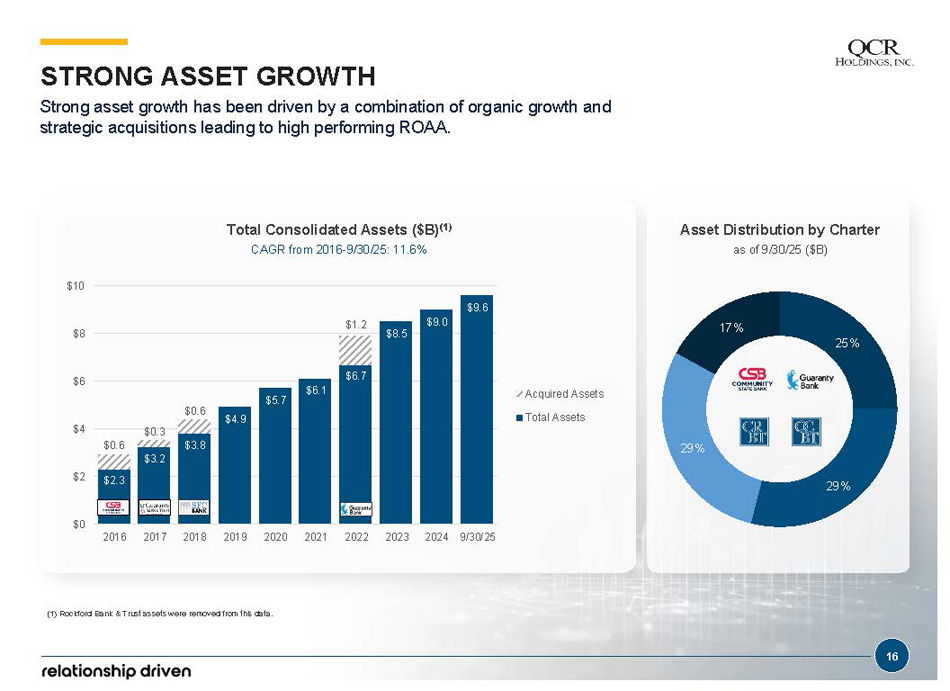
$2.3 $3.2 $3.8 $4.9 $5.7 $6.1 $6.7 $8.5 $9.0 $9.6 $0.6 $0.3 $0.6 $1.2 $0 $2 $4 $6 $8 $10 2016 2017 2018 2019 2020 2021 2022 2023 2024 9/30/25 Acquired Assets Total Assets (1) Rockford Bank & T rust assets were removed from this data. 25% 29% 29% 17% Total Consolidated Assets ($B) (1) CAGR from 2016 - 9/30/25: 11.6% 16 STRONG ASSET GROWTH Strong asset growth has been driven by a combination of organic growth and strategic acquisitions leading to high performing ROAA. Asset Distribution by Charter as of 9/30/25 ($B)
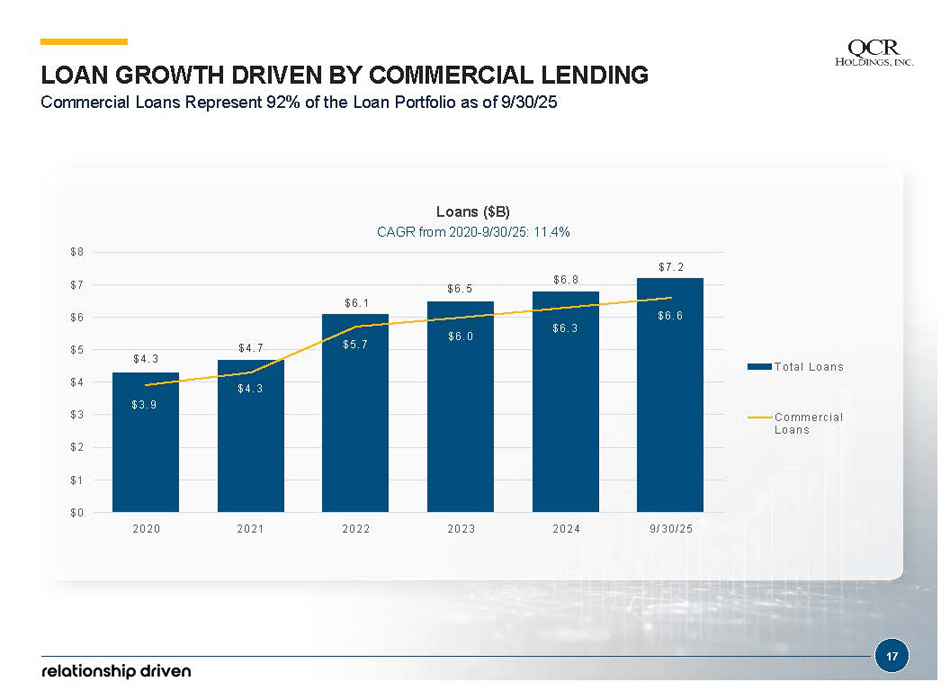
Loans ($B) CAGR from 2020 - 9/30/25: 11.4% LOAN GROWTH DRIVEN BY COMMERCIAL LENDING Commercial Loans Represent 92% of the Loan Portfolio as of 9/30/25 $ 4 . 3 $ 4 . 7 $ 6 . 1 $ 6 . 5 $ 6 . 8 $ 7 . 2 $ 3 . 9 $ 4 . 3 $ 5 . 7 $ 6 . 0 $ 6 . 3 $ 6 . 6 $2 $1 $0 $3 $4 $5 $6 $7 $8 2020 2021 2022 2023 2024 9 / 30 /25 T otal Loans Comm ercial Loans 17
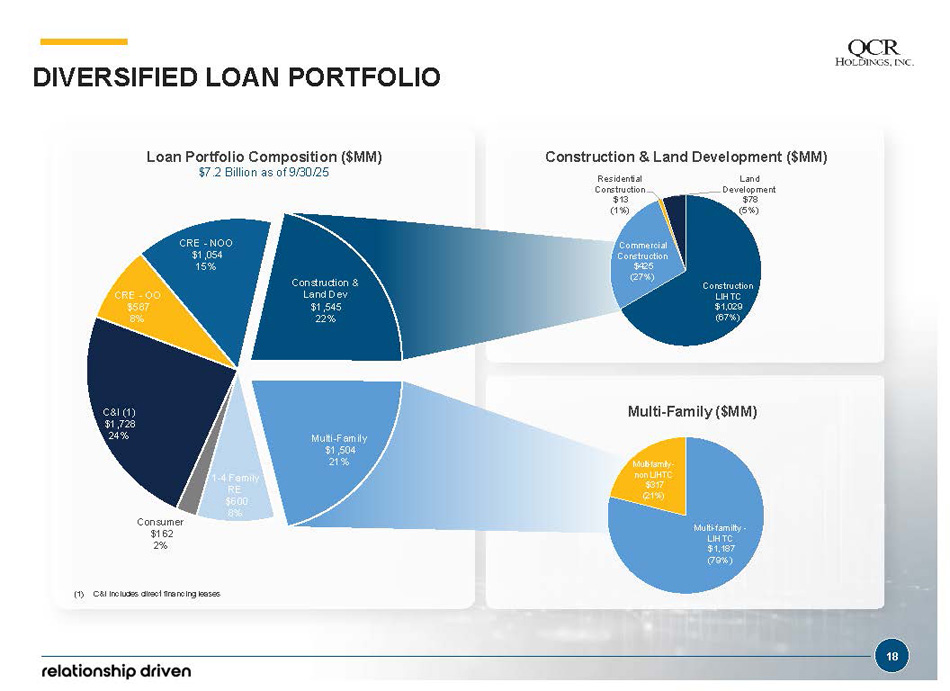
DIVERSIFIED LOAN PORTFOLIO Construction LIHTC $1,029 (67%) Commercial Construction $425 (27%) Residential Construction $13 (1%) Land Development $78 (5%) Multi - familty - LIHTC $1,187 (79%) Multi - family - non LIHTC $317 (21%) Loan Portfolio Composition ($MM) $7.2 Billion as of 9/30/25 Construction & Land Development ($MM) Multi - Family ($MM) (1) C&I includes direct financing leases C&I (1) $1,728 24% 18 CRE - OO $587 8% CRE - NOO $1,054 15% Construction & Land Dev $1,545 22% Multi - Family $1,504 21% 1 - 4 Family RE $600 8% Consumer $162 2%
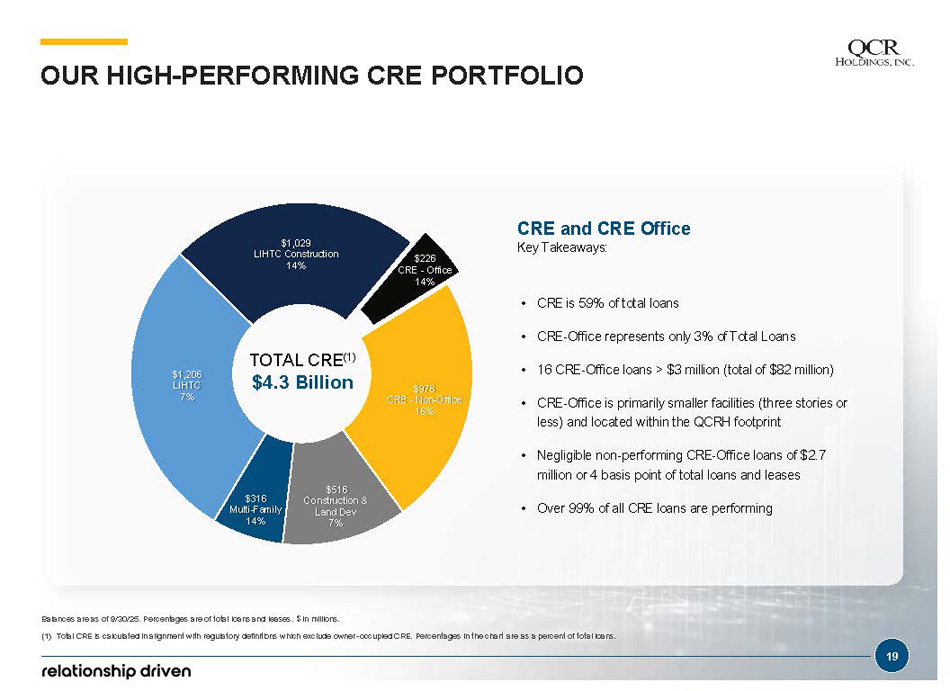
$226 CRE - Office 14% $976 CRE - Non - Office 16% $516 Construction & Land Dev 7% $316 Multi - Family 14% $1,206 LIHTC 7% $1,029 LIHTC Construction 14% 19 • CRE is 59% of total loans • CRE - Office represents only 3% of Total Loans • 16 CRE - Office loans > $3 million (total of $82 million) • CRE - Office is primarily smaller facilities (three stories or less) and located within the QCRH footprint • Negligible non - performing CRE - Office loans of $2.7 million or 4 basis point of total loans and leases • Over 99% of all CRE loans are performing CRE and CRE Office Key Takeaways: OUR HIGH - PERFORMING CRE PORTFOLIO Balances are as of 9/30/25. Percentages are of total loans and leases. $ in millions. (1) Total CRE is calculated in alignment with regulatory definitions which exclude owner - occupied CRE. Percentages in the chart are as a percent of total loans. TOTAL CRE (1) $4.3 Billion
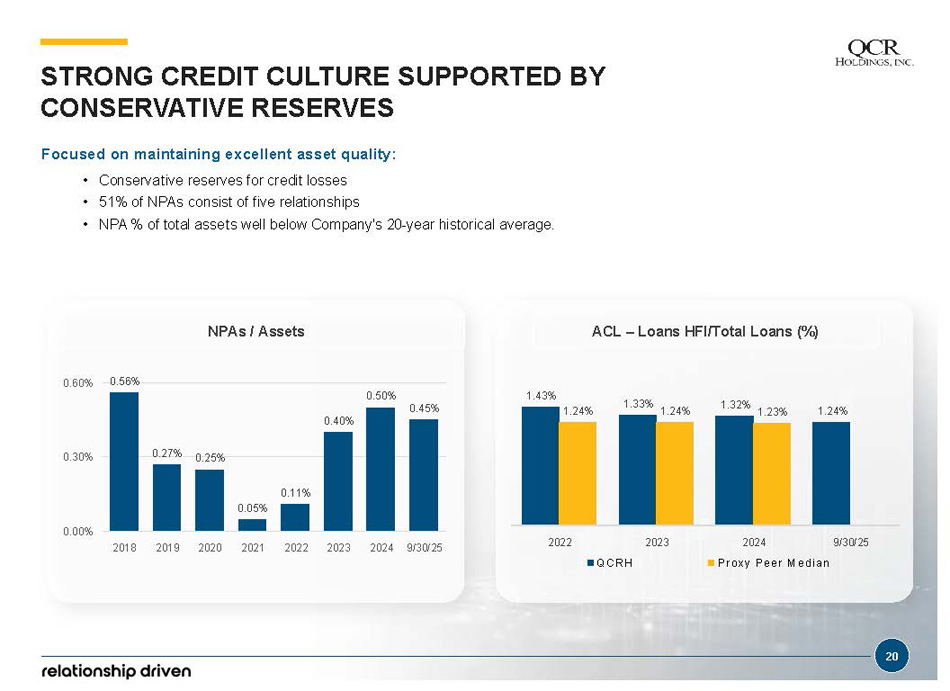
NPAs / Assets 0.56% 0.27% 0.25% 0.11% 0.05% 0.40% 0.50% 0.45% 0.00% 0.30% 0.60% 2018 2019 2020 2021 2022 2023 2024 9/30/25 1.43% 1.33% 1.32% 1.24% 1.24% 1.24% 1.23% 2022 2023 9/30/25 Q CRH 2024 Pr oxy Peer M edian ACL – Loans HFI/Total Loans (%) 20 STRONG CREDIT CULTURE SUPPORTED BY CONSERVATIVE RESERVES Focused on maintaining excellent asset quality: • Conservative reserves for credit losses • 51% of NPAs consist of five relationships • NPA % of total assets well below Company's 20 - year historical average.
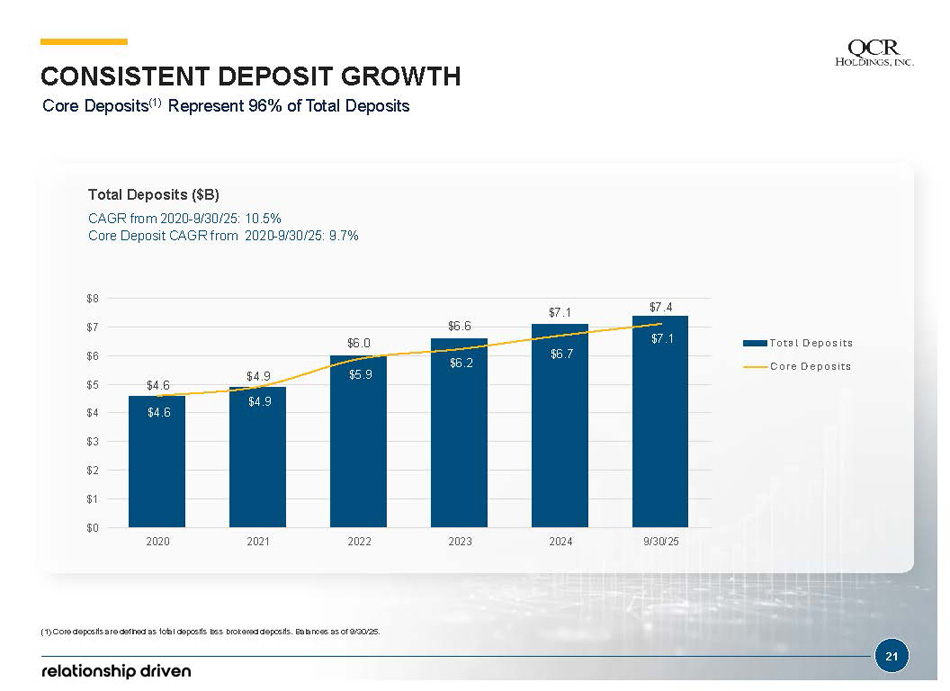
CONSISTENT DEPOSIT GROWTH Core Deposits (1) Represent 96% of Total Deposits (1) Core deposits are defined as total deposits less brokered deposits. Balances as of 9/30/25. Total Deposits ($B) CAGR from 2020 - 9/30/25: 10.5% Core Deposit CAGR from 2020 - 9/30/25: 9.7% $4.6 $4.9 $6.0 $6.6 $7.1 $7.4 $4.6 $4.9 $5.9 $6.2 $6.7 $7.1 $0 $1 $2 $3 $4 $5 $6 $7 $8 2020 2021 2022 2023 2024 9/30/25 Total D epos i ts Core D e posits 21
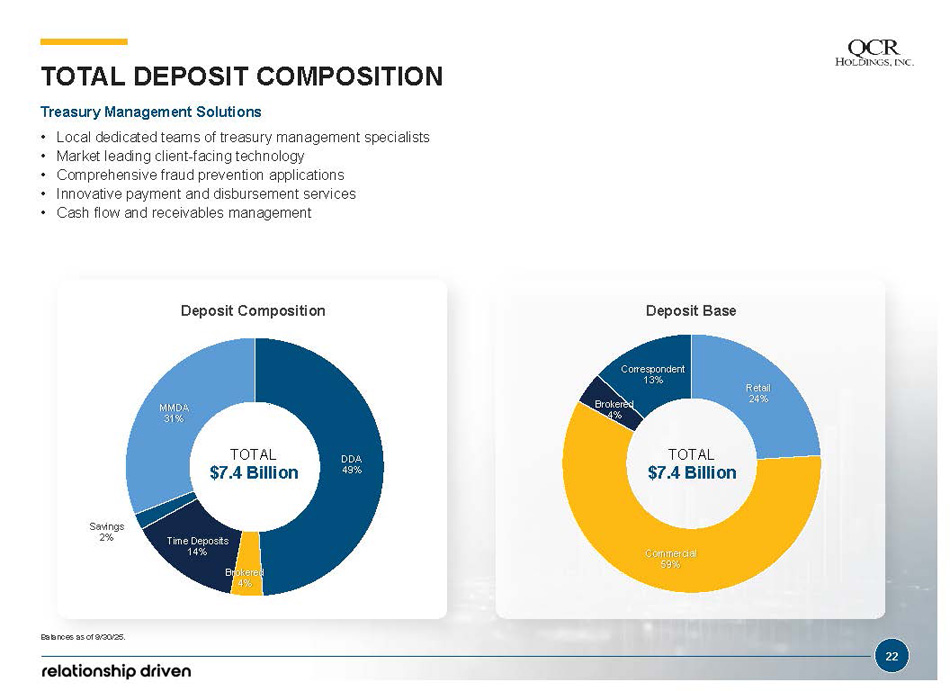
Retail 24% Commercial 59% Brokered 4% Correspondent 13% DDA 49% Brokered 4% Time Deposits 14% Savings 2% MMDA 31% 22 Balances as of 9/30/25. TOTAL DEPOSIT COMPOSITION TOTAL $7.4 Billion TOTAL $7.4 Billion Treasury Management Solutions • Local dedicated teams of treasury management specialists • Market leading client - facing technology • Comprehensive fraud prevention applications • Innovative payment and disbursement services • Cash flow and receivables management Deposit Composition Deposit Base
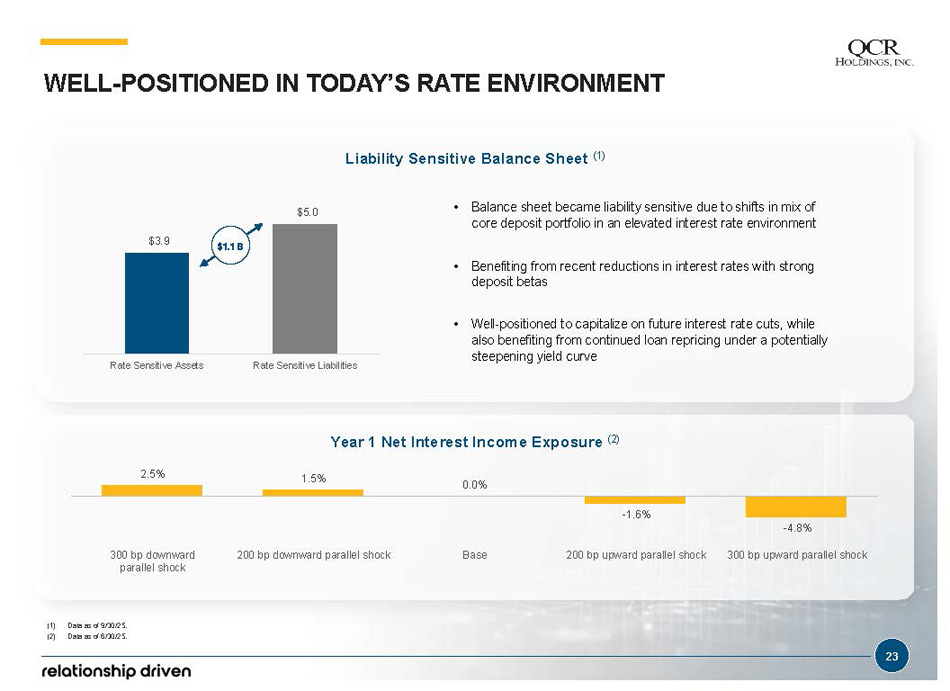
$3.9 $5.0 Rate Sensitive Assets Rate Sensitive Liabilities WELL - POSITIONED IN TODAY’S RATE ENVIRONMENT • Balance sheet became liability sensitive due to shifts in mix of core deposit portfolio in an elevated interest rate environment • Benefiting from recent reductions in interest rates with strong deposit betas • Well - positioned to capitalize on future interest rate cuts, while also benefiting from continued loan repricing under a potentially steepening yield curve Liability Sensitive Balance Sheet (1) $1.1 B 2.5% 23 1.5% 0.0% - 1.6% - 4.8% 300 bp downward parallel shock 200 bp downward parallel shock Base 200 bp upward parallel shock 300 bp upward parallel shock Year 1 Net Interest Income Exposure (2) (1) Data as of 9/30/25. (2) Data as of 6/30/25.
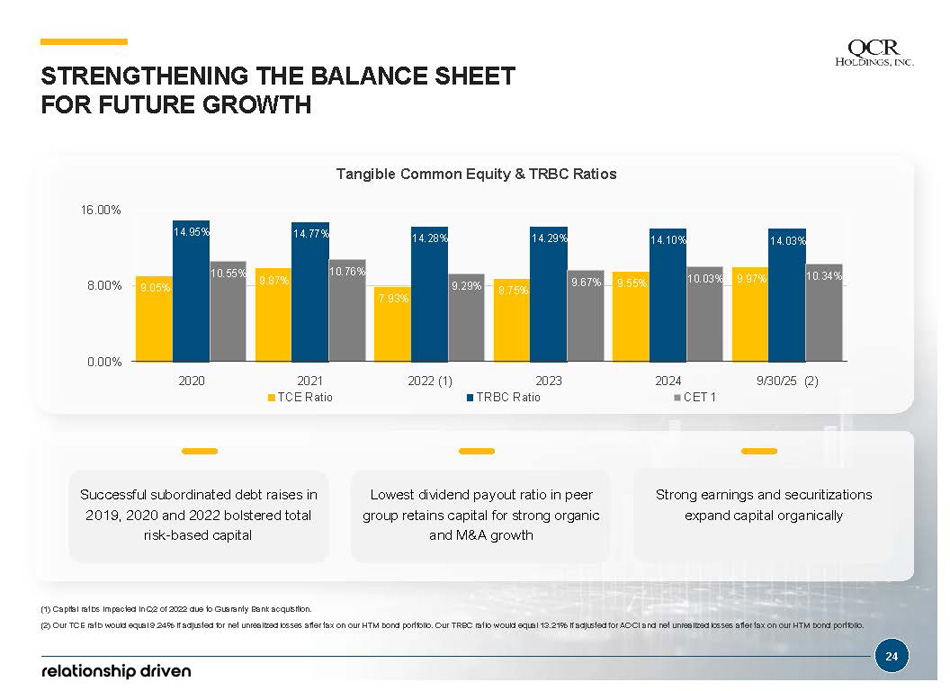
Successful subordinated debt raises in 2019, 2020 and 2022 bolstered total risk - based capital 9.05% 9.87% 7.93% 8.75% 9.55% 9.97% 14.95% 14.77% 14.28% 14.29% 14.10% 14.03% 10.55% 10.76% 9.29% 9.67% 10.03% 10.34% 0.00% 8.00% 16.00% 2020 2022 (1) 2024 9/30/25 (2) 2021 TCE Ratio 2023 TRBC Ratio CET 1 Tangible Common Equity & TRBC Ratios (1) Capital ratios impacted in Q2 of 2022 due to Guaranty Bank acquisition. (2) Our TCE ratio would equal 9 .24 % if adjusted for net unrealized losses after tax on our HTM bond portfolio. Our TRBC ratio would equal 13.21% if adjusted for AOCI and net unrealized losses after tax on our HTM bond portfolio. STRENGTHENING THE BALANCE SHEET FOR FUTURE GROWTH Lowest dividend payout ratio in peer group retains capital for strong organic and M&A growth Strong earnings and securitizations expand capital organically 24