
THIRD COAST BANCSHARES, INC. NYSE & NYSE Texas: TCBX Investor Presentation October 2025 © 2025 Third Coast Bancshares, Inc. Exhibit 99.2
02 DISCLAIMER Forward-Looking Statements This presentation contains forward-looking statements within the meaning of the Private Securities Litigation Reform Act of 1995 that are subject to risks and uncertainties and are made pursuant to the safe harbor provisions of Section 27A of the Securities Act of 1933, as amended, and Section 21E of the Securities Exchange Act of 1934, as amended. These forward-looking statements reflect the current views of Third Coast Bancshares, Inc. (the “Company,” “Third Coast,” “we,” “us,” or “our”) with respect to, among other things, future events and our financial performance. These statements are often, but not always, made through the use of words or phrases such as “may,” “should,” “could,” “predict,” “potential,” “believe,” “looking ahead,” “will likely result,” “expect,” “continue,” “will,” “anticipate,” “seek,” “estimate,” “intend,” “plan,” “projection,” “would” and “outlook,” or the negative version of those words or other comparable words or phrases of a future or forward-looking nature. These forward-looking statements are not historical facts, and are based on current expectations, estimates and projections about our industry, management’s beliefs and certain assumptions made by management, many of which, by their nature, are inherently uncertain and beyond our control. Accordingly, we caution you that any such forward-looking statements are not guarantees of future performance and are subject to risks, assumptions and uncertainties that are difficult to predict. Although we believe that the expectations reflected in these forward-looking statements are reasonable as of the date made, actual results may prove to be materially different from the results expressed or implied by the forward-looking statements. There are or will be important factors that could cause our actual results to differ materially from those indicated in these forward-looking statements, including, but not limited to, the following: interest rate risk and fluctuations in interest rates; market conditions and economic trends generally and in the banking industry; our ability to maintain important deposit relationships; our ability to grow or maintain our deposit base; our ability to implement our expansion strategy; our ability to pay dividends on our Series A Preferred Stock; credit risk associated with our business; economic conditions affecting the real estate market; prepayment risks associated with commercial real estate loans; liquidity risks in the securitization market; operational risks related to the administration of securitized assets; and changes in key management personnel. For a discussion of additional factors that could cause our actual results to differ materially from those described in the forward-looking statements, please see the risk factors discussed in our Annual Report on Form 10-K for the year ended December 31, 2024, filed with the U.S. Securities and Exchange Commission (the “SEC”), and our other filings with the SEC. The foregoing factors should not be construed as exhaustive and should be read together with the other cautionary statements included in this presentation. If one or more events related to these or other risks or uncertainties materialize, or if our underlying assumptions prove to be incorrect, actual results may differ materially from what we anticipate. Accordingly, you should not place undue reliance on any such forward-looking statements. Any forward-looking statement speaks only as of the date on which it is made, and we do not undertake any obligation to publicly update or review any forward-looking statement, whether as a result of new information, future developments or otherwise. New factors emerge from time to time, and it is not possible for us to predict which will arise. In addition, we cannot assess the impact of each factor on our business or the extent to which any factor, or combination of factors, may cause actual results to differ materially from those contained in any forward-looking statements. NON-GAAP FINANCIAL MEASURES This presentation contains non-GAAP financial measures, including Tangible Common Equity, Tangible Book Value Per Share, Tangible Common Equity to Tangible Assets and Return on Average Tangible Common Equity. The non-GAAP financial measures that we discuss in this presentation should not be considered in isolation or as a substitute for the most directly comparable or other financial measures calculated in accordance with GAAP. A reconciliation of the non-GAAP financial measures used in this presentation to the most directly comparable GAAP measures is provided in the Appendix to this presentation.
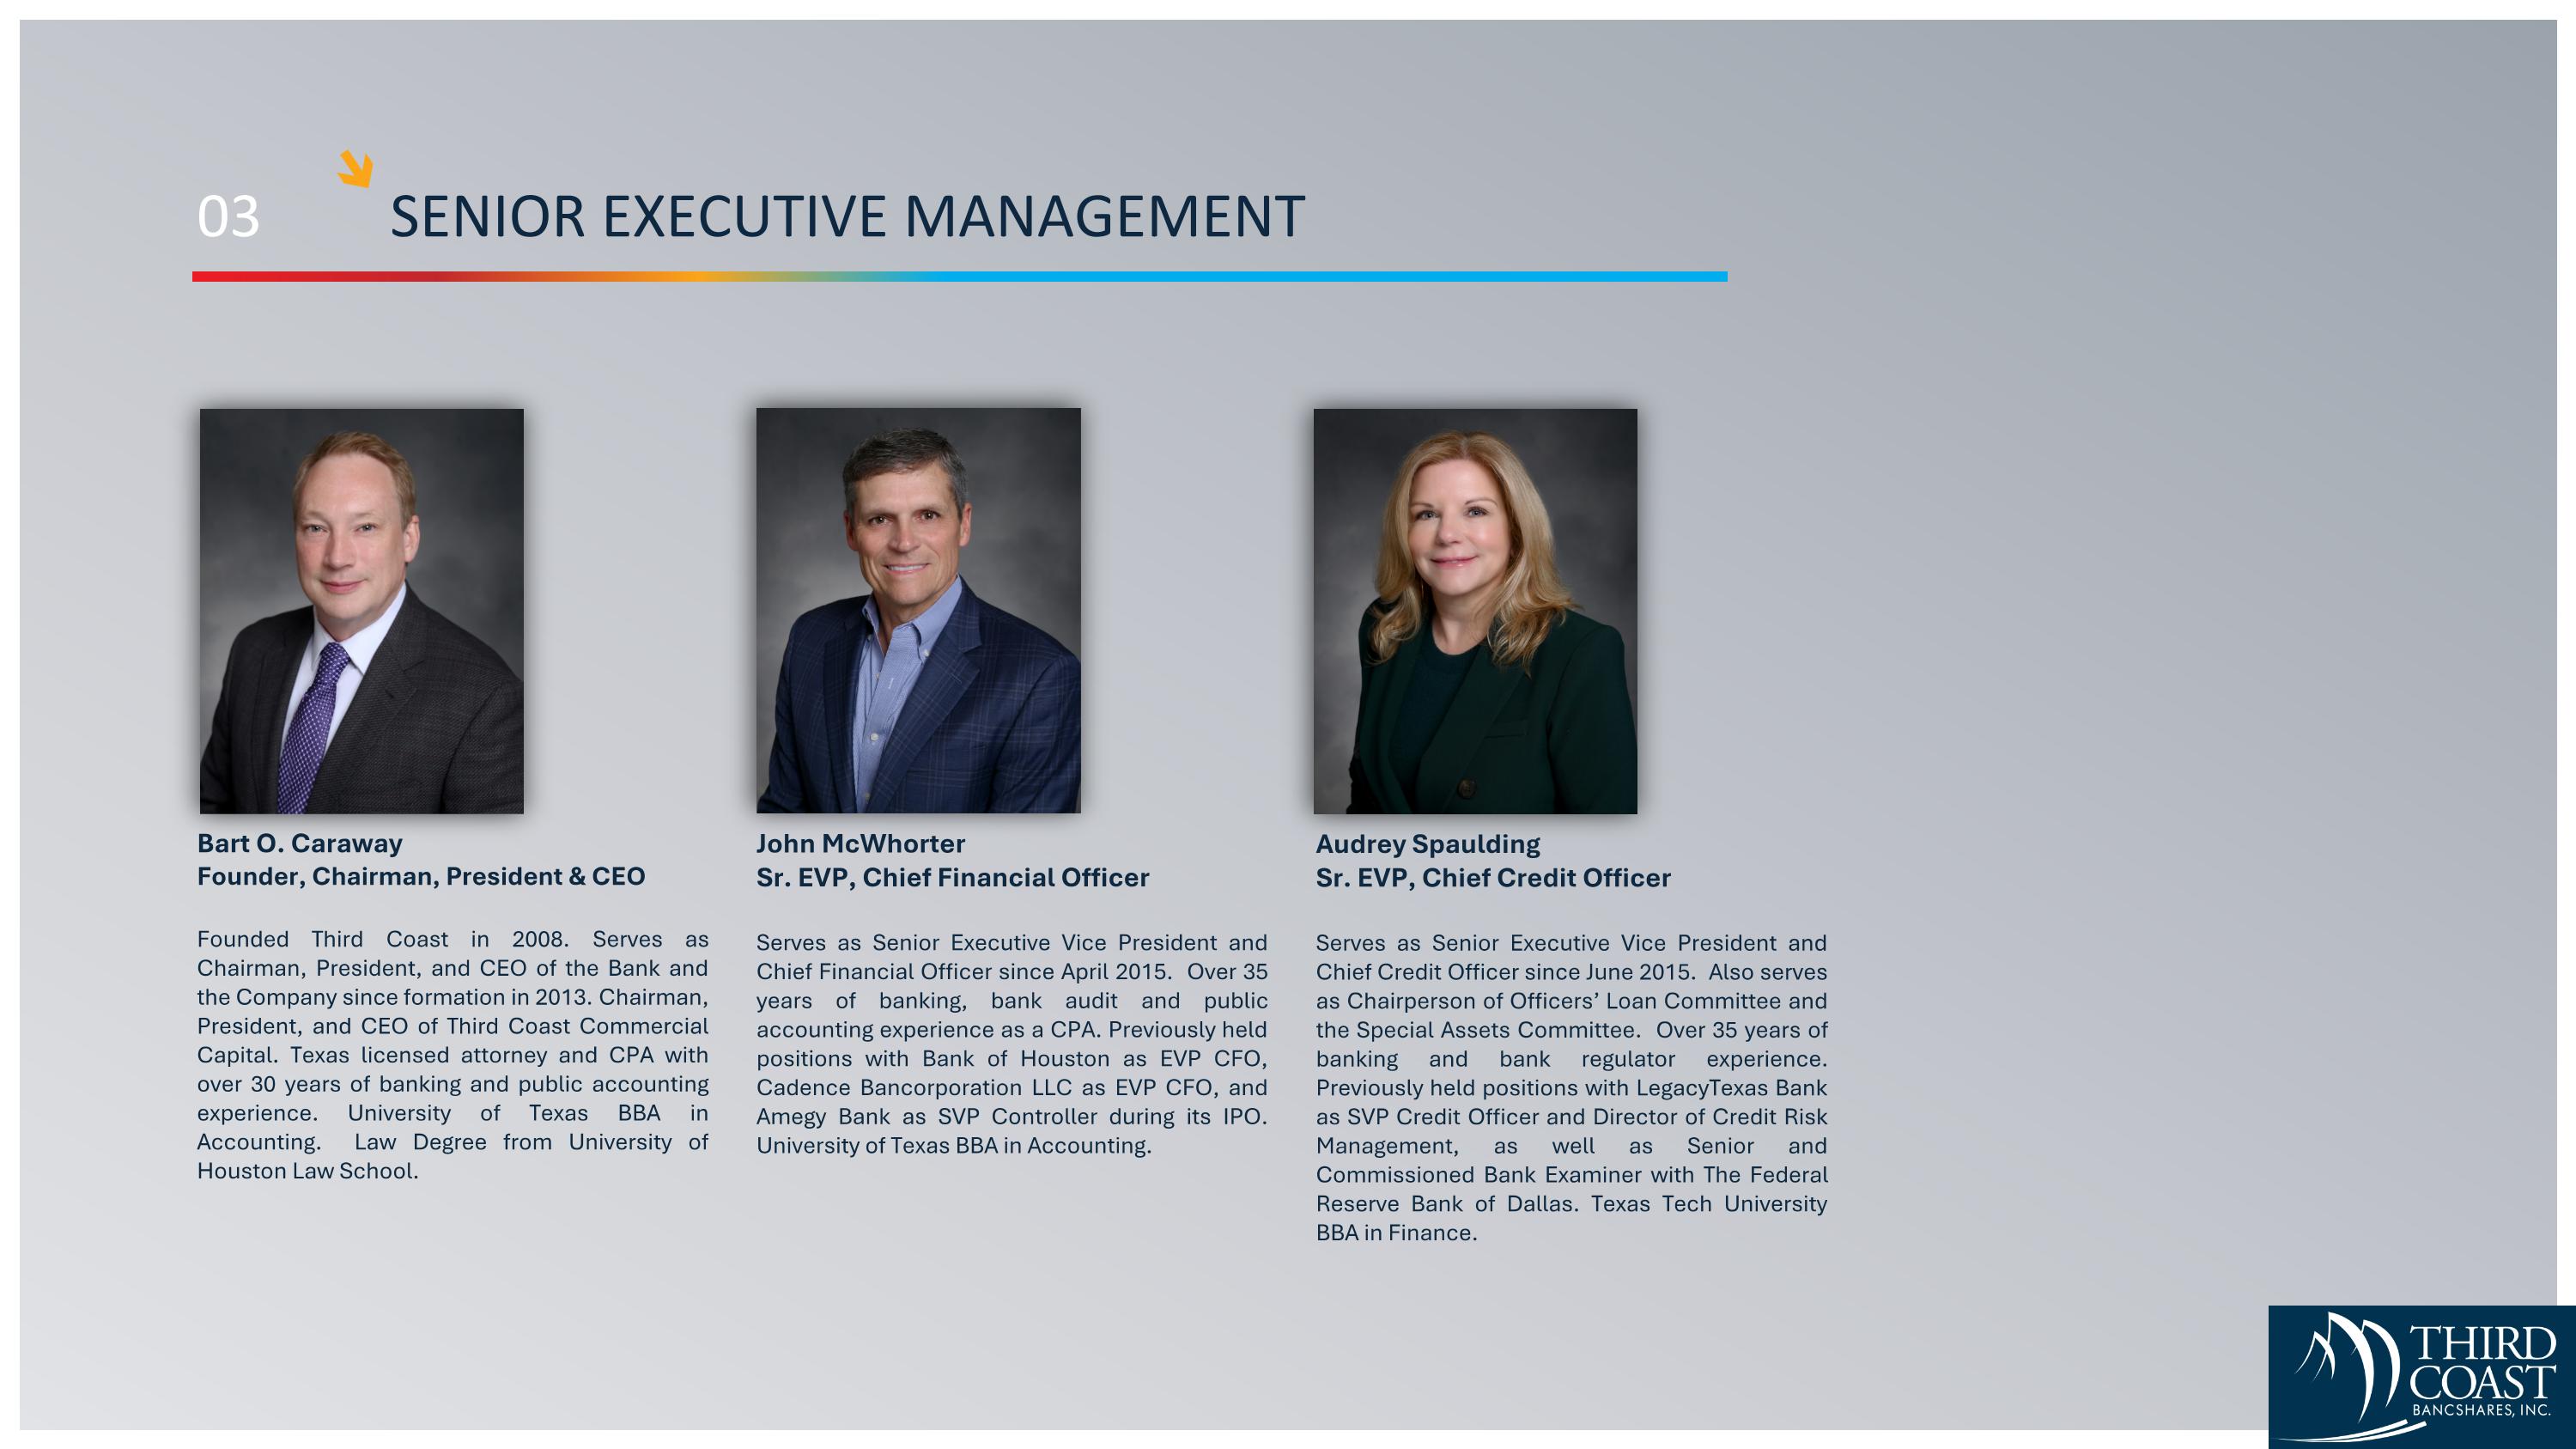
03 SENIOR EXECUTIVE MANAGEMENT Bart O. Caraway Founder, Chairman, President & CEO Founded Third Coast in 2008. Serves as Chairman, President, and CEO of the Bank and the Company since formation in 2013. Chairman, President, and CEO of Third Coast Commercial Capital. Texas licensed attorney and CPA with over 30 years of banking and public accounting experience. University of Texas BBA in Accounting. Law Degree from University of Houston Law School. John McWhorter Sr. EVP, Chief Financial Officer Serves as Senior Executive Vice President and Chief Financial Officer since April 2015. Over 35 years of banking, bank audit and public accounting experience as a CPA. Previously held positions with Bank of Houston as EVP CFO, Cadence Bancorporation LLC as EVP CFO, and Amegy Bank as SVP Controller during its IPO. University of Texas BBA in Accounting. Audrey Spaulding Sr. EVP, Chief Credit Officer Serves as Senior Executive Vice President and Chief Credit Officer since June 2015. Also serves as Chairperson of Officers’ Loan Committee and the Special Assets Committee. Over 35 years of banking and bank regulator experience. Previously held positions with LegacyTexas Bank as SVP Credit Officer and Director of Credit Risk Management, as well as Senior and Commissioned Bank Examiner with The Federal Reserve Bank of Dallas. Texas Tech University BBA in Finance.
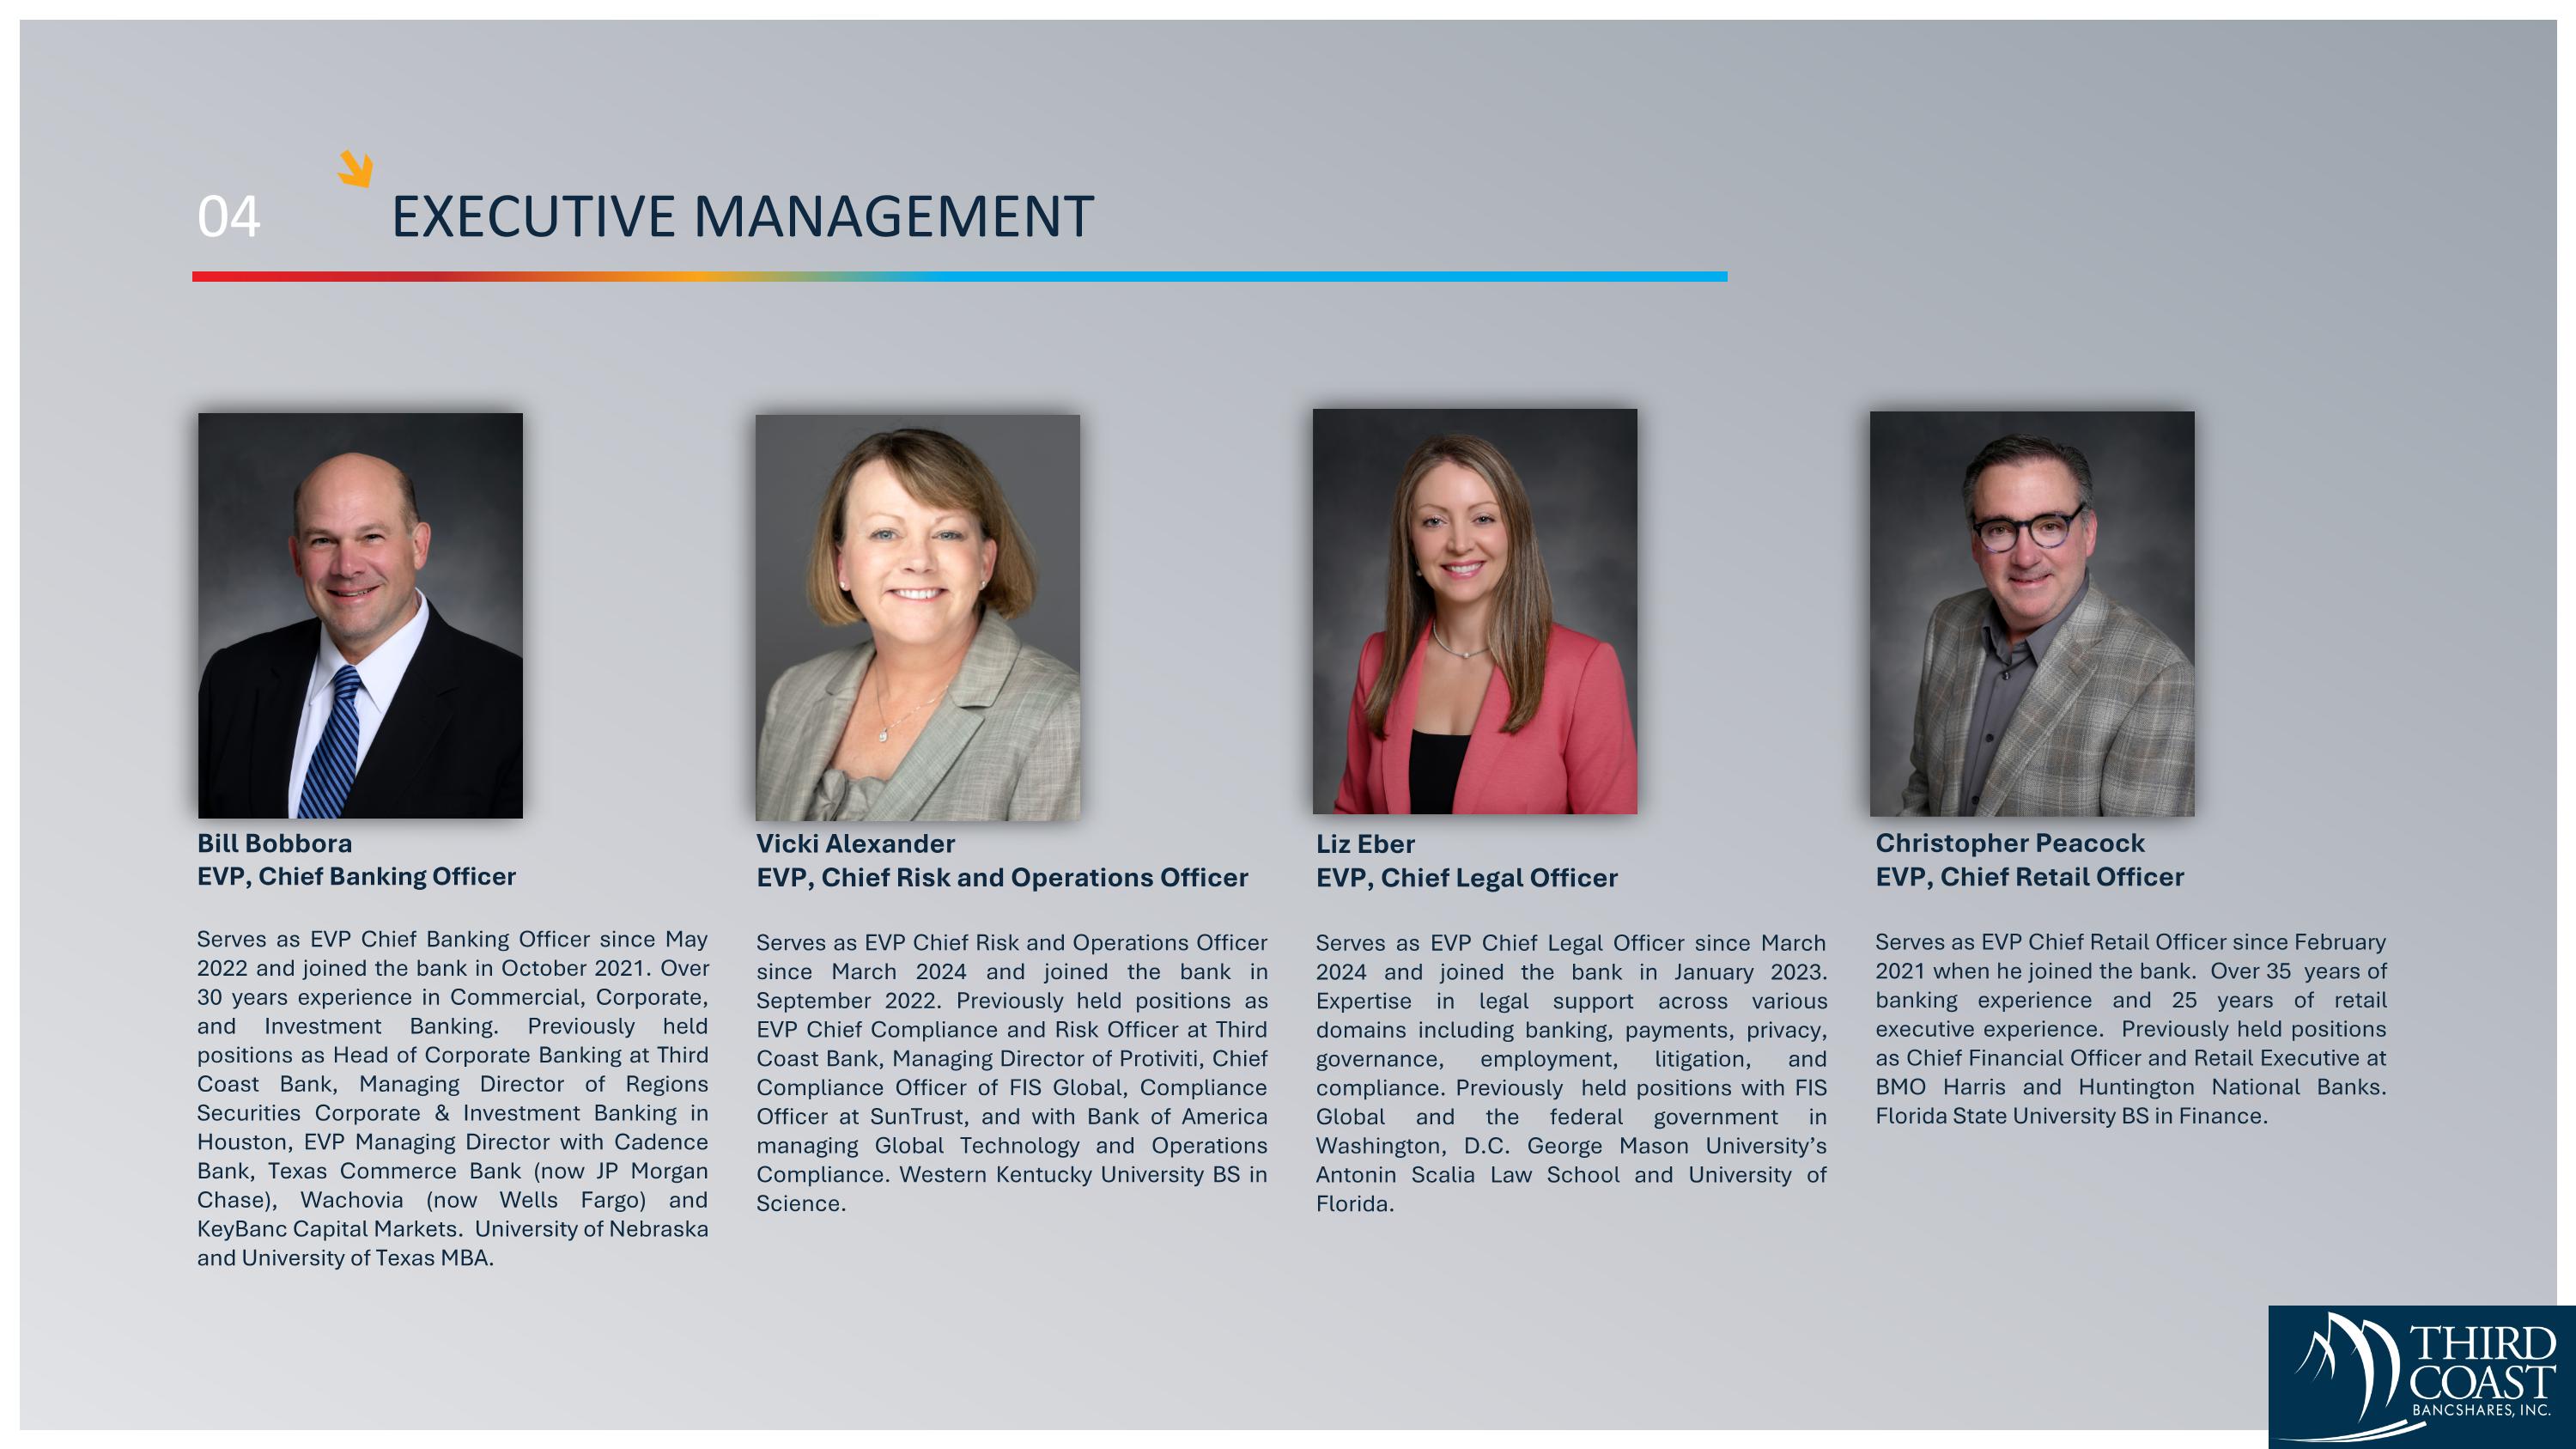
04 EXECUTIVE MANAGEMENT Bill Bobbora EVP, Chief Banking Officer Serves as EVP Chief Banking Officer since May 2022 and joined the bank in October 2021. Over 30 years experience in Commercial, Corporate, and Investment Banking. Previously held positions as Head of Corporate Banking at Third Coast Bank, Managing Director of Regions Securities Corporate & Investment Banking in Houston, EVP Managing Director with Cadence Bank, Texas Commerce Bank (now JP Morgan Chase), Wachovia (now Wells Fargo) and KeyBanc Capital Markets. University of Nebraska and University of Texas MBA. Vicki Alexander EVP, Chief Risk and Operations Officer Serves as EVP Chief Risk and Operations Officer since March 2024 and joined the bank in September 2022. Previously held positions as EVP Chief Compliance and Risk Officer at Third Coast Bank, Managing Director of Protiviti, Chief Compliance Officer of FIS Global, Compliance Officer at SunTrust, and with Bank of America managing Global Technology and Operations Compliance. Western Kentucky University BS in Science. Liz Eber EVP, Chief Legal Officer Serves as EVP Chief Legal Officer since March 2024 and joined the bank in January 2023. Expertise in legal support across various domains including banking, payments, privacy, governance, employment, litigation, and compliance. Previously held positions with FIS Global and the federal government in Washington, D.C. George Mason University’s Antonin Scalia Law School and University of Florida. Christopher Peacock EVP, Chief Retail Officer Serves as EVP Chief Retail Officer since February 2021 when he joined the bank. Over 35 years of banking experience and 25 years of retail executive experience. Previously held positions as Chief Financial Officer and Retail Executive at BMO Harris and Huntington National Banks. Florida State University BS in Finance.
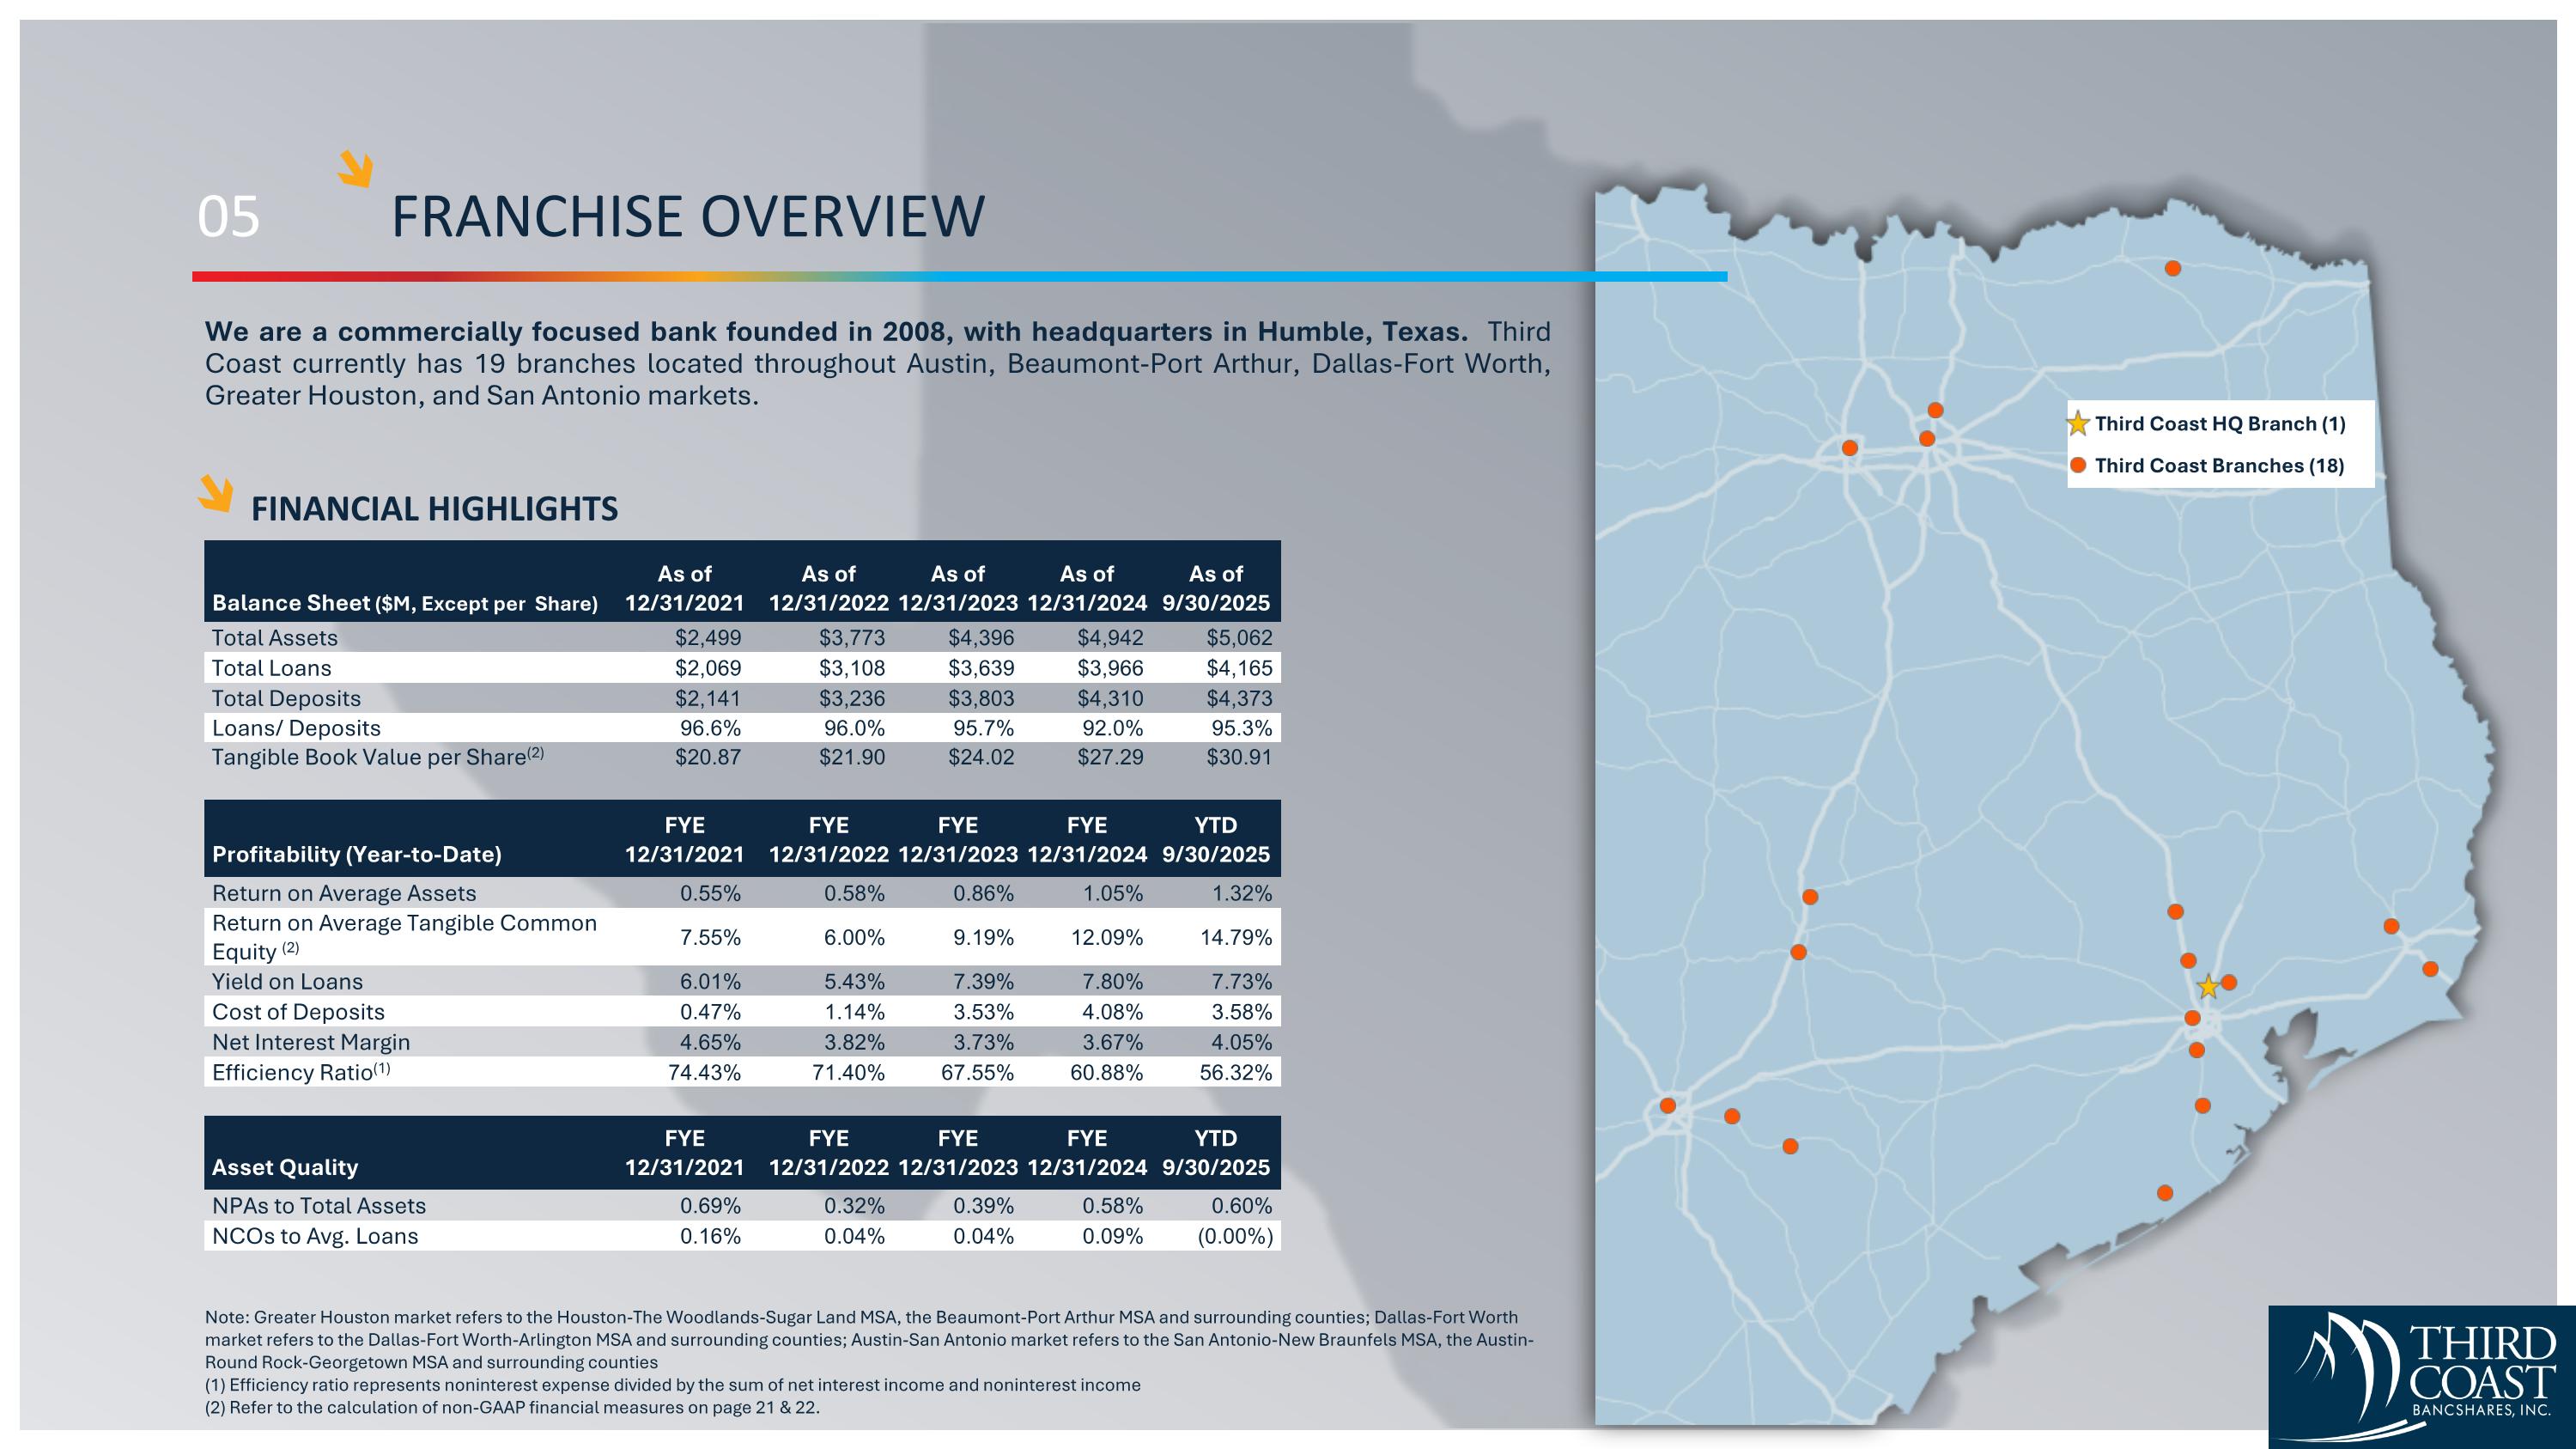
05 FRANCHISE OVERVIEW Third Coast HQ Branch (1) Third Coast Branches (18) FINANCIAL HIGHLIGHTS Note: Greater Houston market refers to the Houston-The Woodlands-Sugar Land MSA, the Beaumont-Port Arthur MSA and surrounding counties; Dallas-Fort Worth market refers to the Dallas-Fort Worth-Arlington MSA and surrounding counties; Austin-San Antonio market refers to the San Antonio-New Braunfels MSA, the Austin-Round Rock-Georgetown MSA and surrounding counties (1) Efficiency ratio represents noninterest expense divided by the sum of net interest income and noninterest income (2) Refer to the calculation of non-GAAP financial measures on page 21 & 22. As of As of As of As of As of Balance Sheet ($M, Except per Share) 12/31/2021 12/31/2022 12/31/2023 12/31/2024 9/30/2025 Total Assets $2,499 $3,773 $4,396 $4,942 $5,062 Total Loans $2,069 $3,108 $3,639 $3,966 $4,165 Total Deposits $2,141 $3,236 $3,803 $4,310 $4,373 Loans/ Deposits 96.6% 96.0% 95.7% 92.0% 95.3% Tangible Book Value per Share(2) $20.87 $21.90 $24.02 $27.29 $30.91 FYE FYE FYE FYE YTD Profitability (Year-to-Date) 12/31/2021 12/31/2022 12/31/2023 12/31/2024 9/30/2025 Return on Average Assets 0.55% 0.58% 0.86% 1.05% 1.32% Return on Average Tangible Common Equity (2) 7.55% 6.00% 9.19% 12.09% 14.79% Yield on Loans 6.01% 5.43% 7.39% 7.80% 7.73% Cost of Deposits 0.47% 1.14% 3.53% 4.08% 3.58% Net Interest Margin 4.65% 3.82% 3.73% 3.67% 4.05% Efficiency Ratio(1) 74.43% 71.40% 67.55% 60.88% 56.32% FYE FYE FYE FYE YTD Asset Quality 12/31/2021 12/31/2022 12/31/2023 12/31/2024 9/30/2025 NPAs to Total Assets 0.69% 0.32% 0.39% 0.58% 0.60% NCOs to Avg. Loans 0.16% 0.04% 0.04% 0.09% (0.00%) We are a commercially focused bank founded in 2008, with headquarters in Humble, Texas. Third Coast currently has 19 branches located throughout Austin, Beaumont-Port Arthur, Dallas-Fort Worth, Greater Houston, and San Antonio markets.
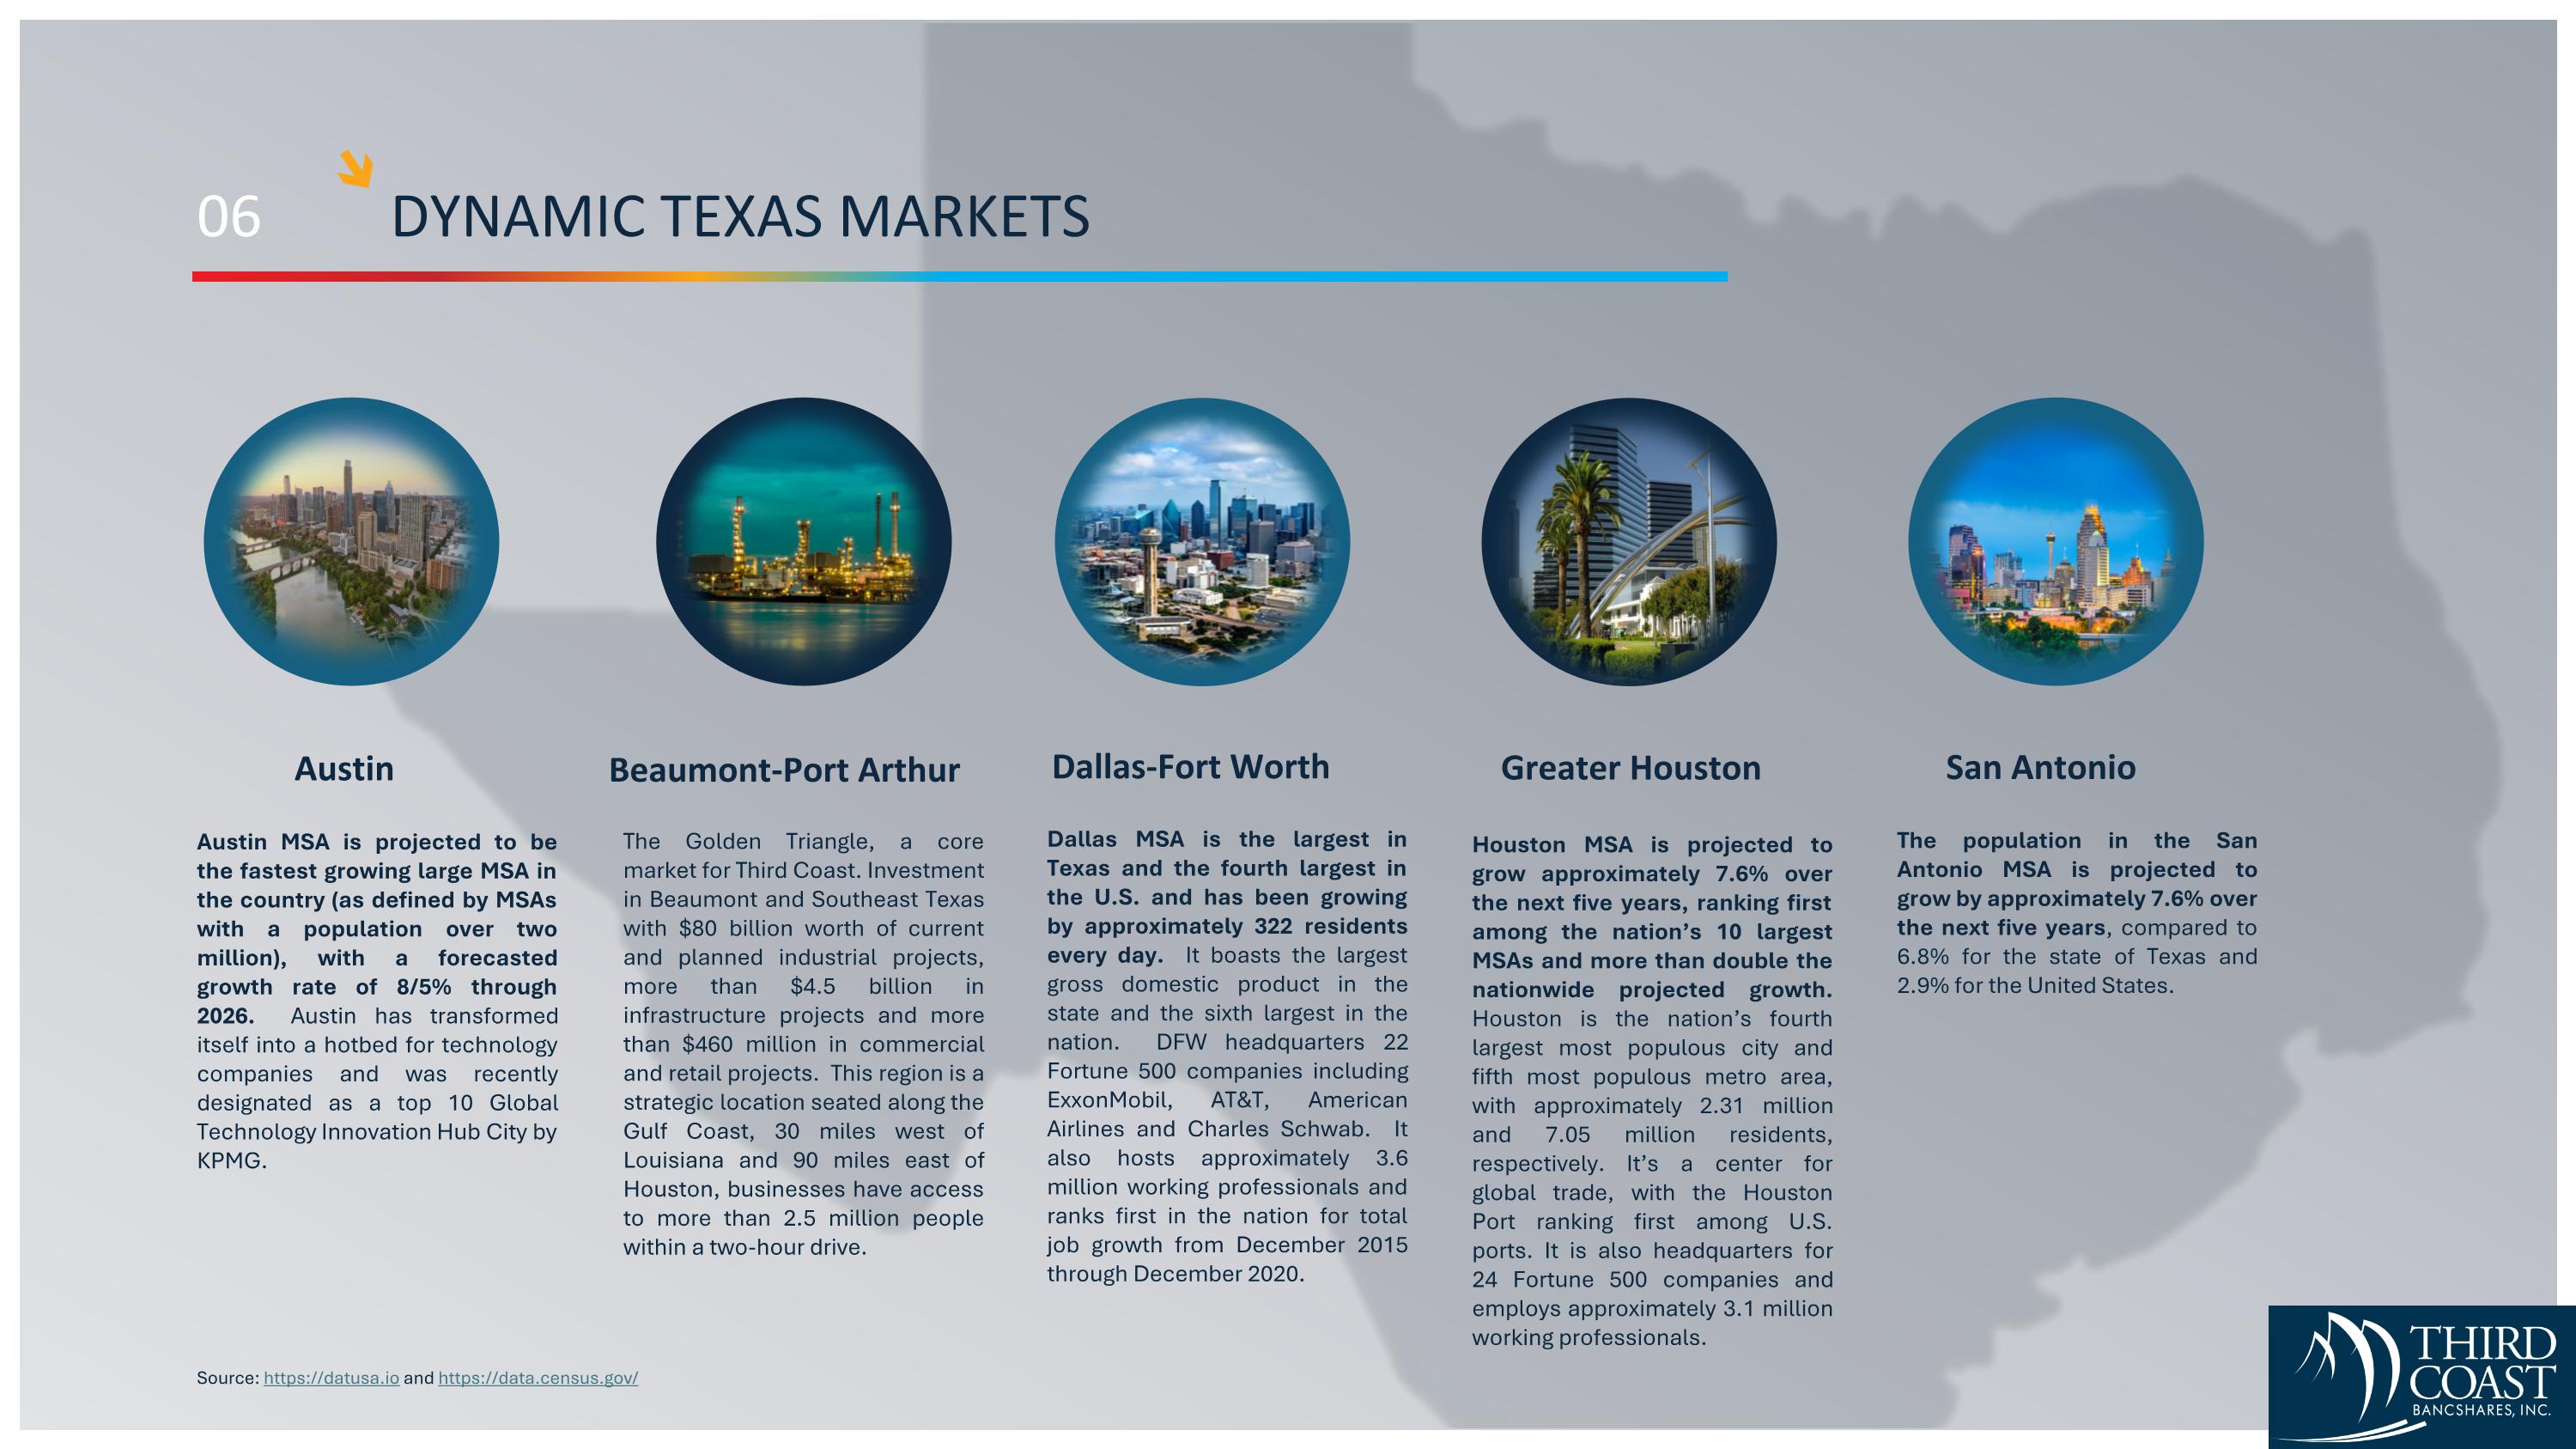
06 DYNAMIC TEXAS MARKETS Austin Source: https://datusa.io and https://data.census.gov/ Beaumont-Port Arthur Dallas-Fort Worth Greater Houston San Antonio Austin MSA is projected to be the fastest growing large MSA in the country (as defined by MSAs with a population over two million), with a forecasted growth rate of 8/5% through 2026. Austin has transformed itself into a hotbed for technology companies and was recently designated as a top 10 Global Technology Innovation Hub City by KPMG. The Golden Triangle, a core market for Third Coast. Investment in Beaumont and Southeast Texas with $80 billion worth of current and planned industrial projects, more than $4.5 billion in infrastructure projects and more than $460 million in commercial and retail projects. This region is a strategic location seated along the Gulf Coast, 30 miles west of Louisiana and 90 miles east of Houston, businesses have access to more than 2.5 million people within a two-hour drive. Dallas MSA is the largest in Texas and the fourth largest in the U.S. and has been growing by approximately 322 residents every day. It boasts the largest gross domestic product in the state and the sixth largest in the nation. DFW headquarters 22 Fortune 500 companies including ExxonMobil, AT&T, American Airlines and Charles Schwab. It also hosts approximately 3.6 million working professionals and ranks first in the nation for total job growth from December 2015 through December 2020. Houston MSA is projected to grow approximately 7.6% over the next five years, ranking first among the nation’s 10 largest MSAs and more than double the nationwide projected growth. Houston is the nation’s fourth largest most populous city and fifth most populous metro area, with approximately 2.31 million and 7.05 million residents, respectively. It’s a center for global trade, with the Houston Port ranking first among U.S. ports. It is also headquarters for 24 Fortune 500 companies and employs approximately 3.1 million working professionals. The population in the San Antonio MSA is projected to grow by approximately 7.6% over the next five years, compared to 6.8% for the state of Texas and 2.9% for the United States.
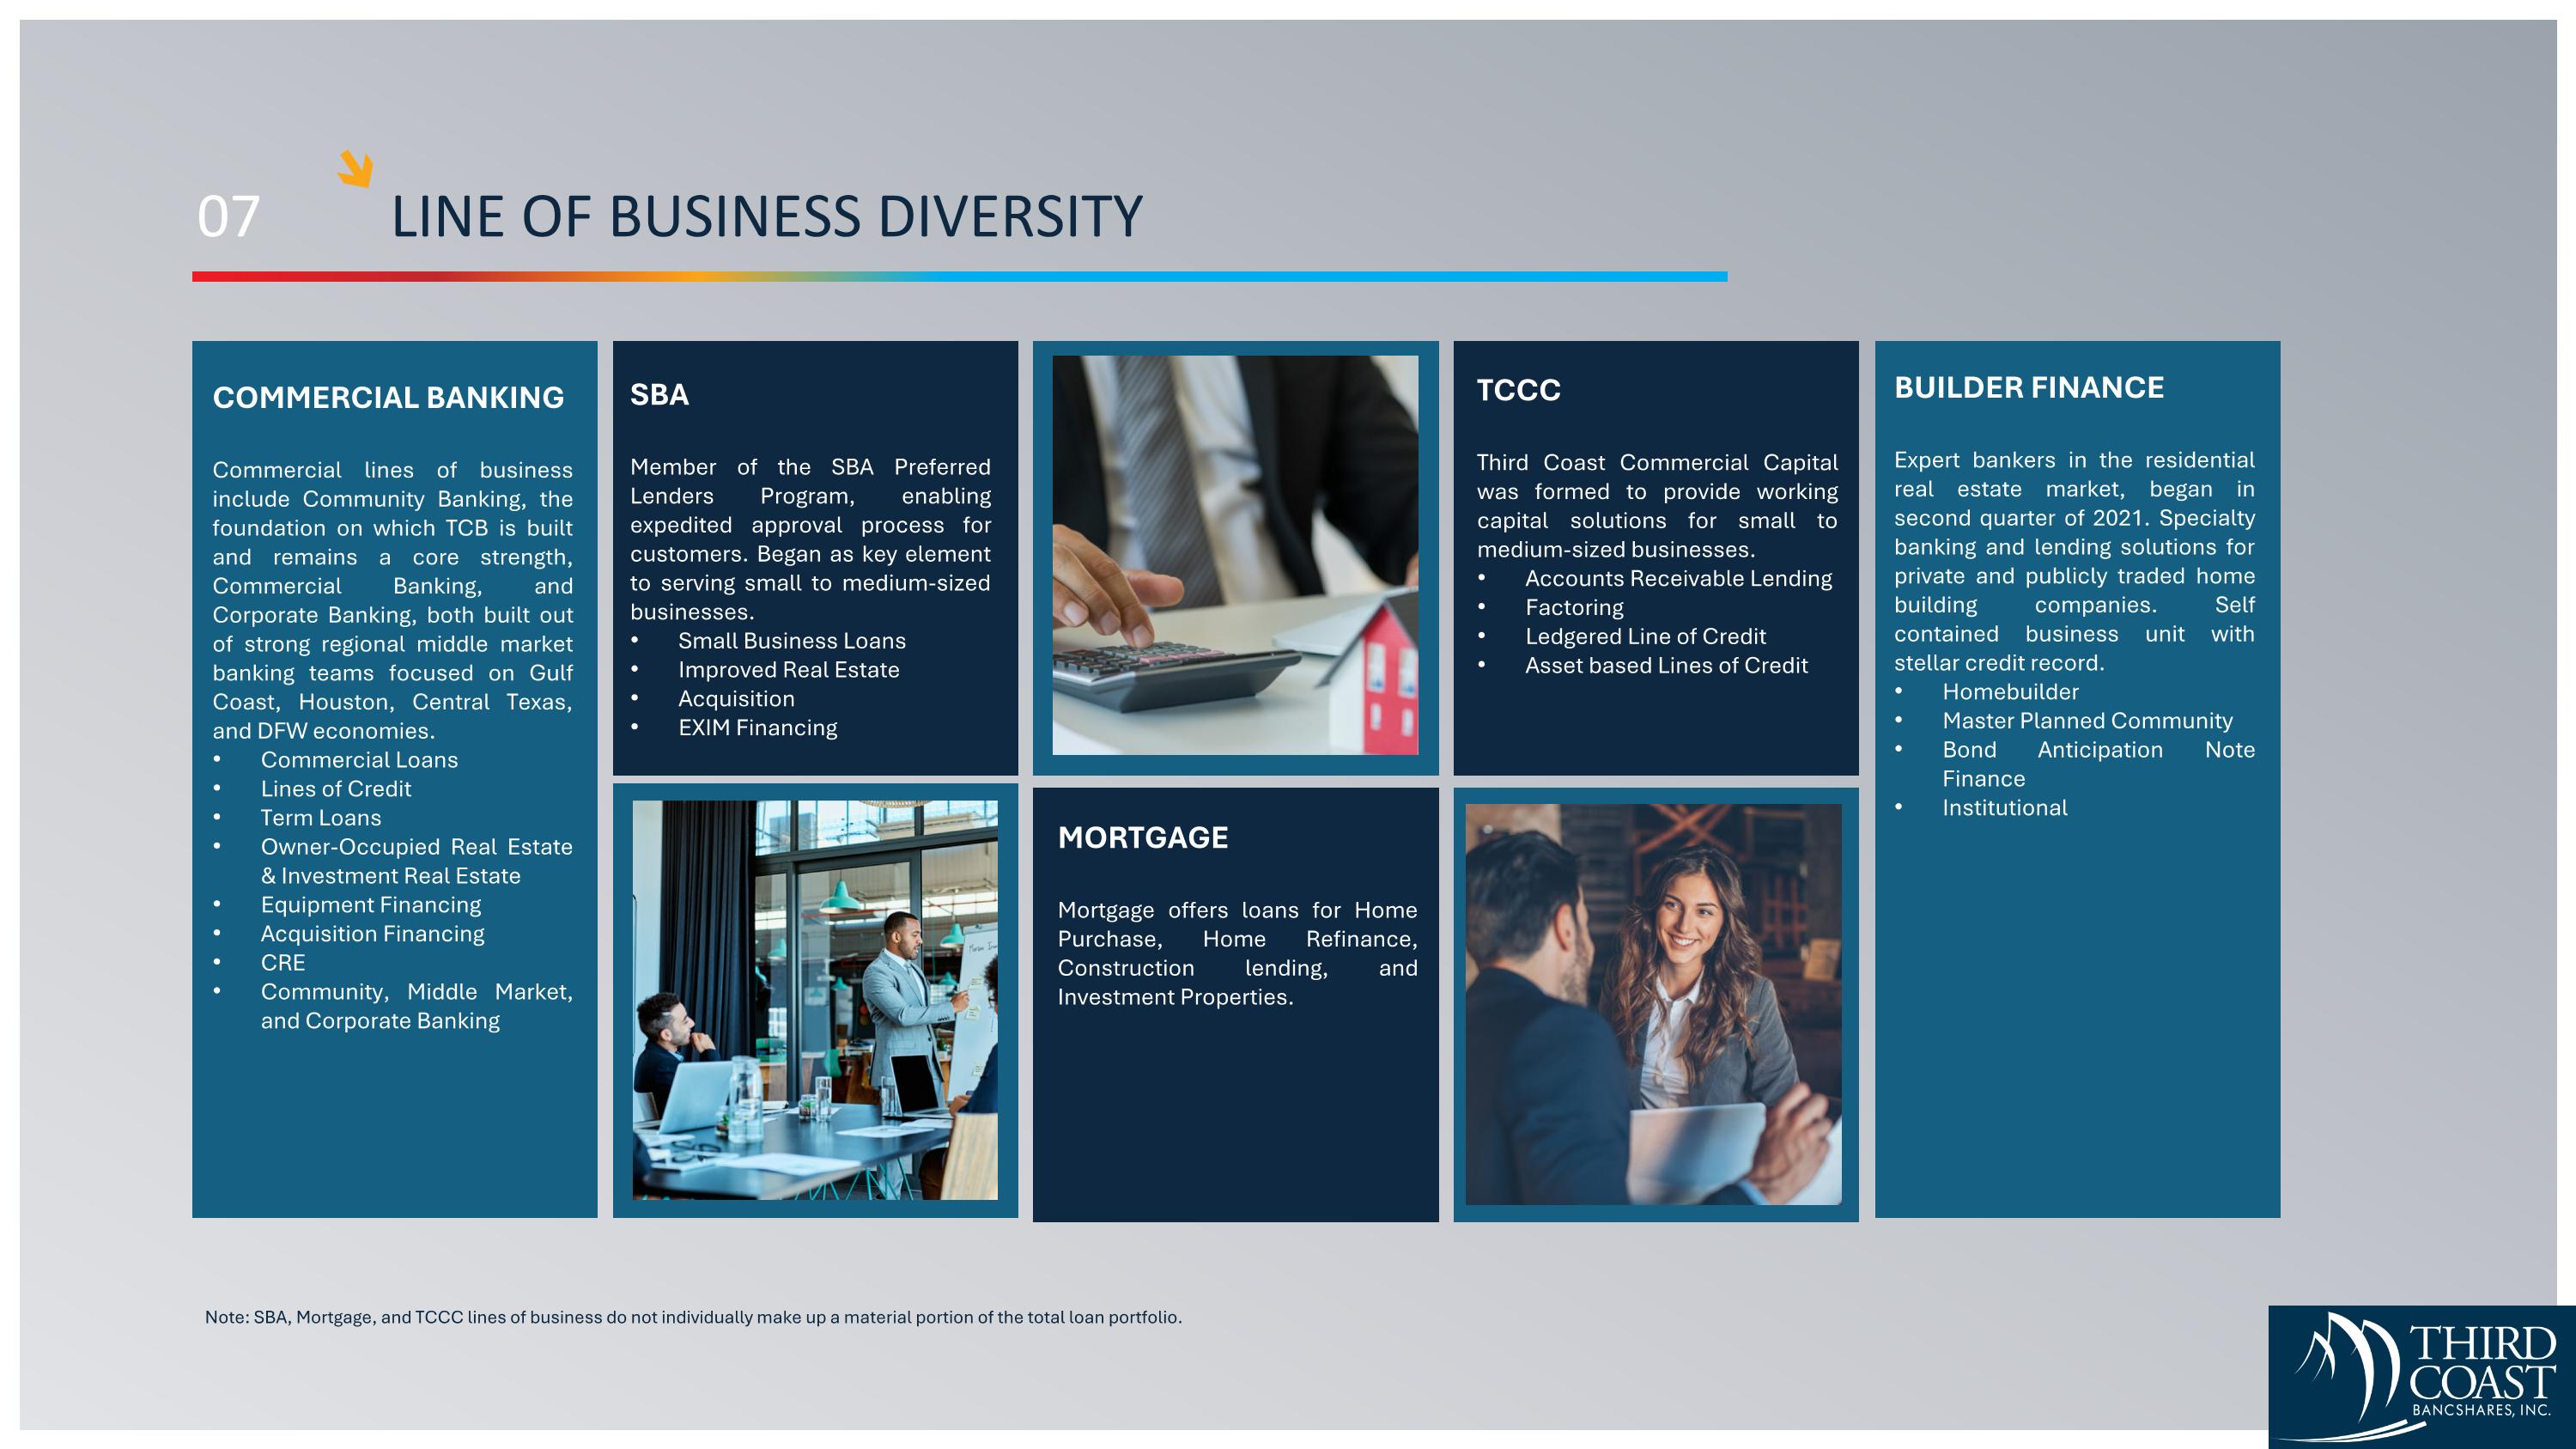
07 LINE OF BUSINESS DIVERSITY COMMERCIAL BANKING Commercial lines of business include Community Banking, the foundation on which TCB is built and remains a core strength, Commercial Banking, and Corporate Banking, both built out of strong regional middle market banking teams focused on Gulf Coast, Houston, Central Texas, and DFW economies. Commercial Loans Lines of Credit Term Loans Owner-Occupied Real Estate & Investment Real Estate Equipment Financing Acquisition Financing CRE Community, Middle Market, and Corporate Banking SBA Member of the SBA Preferred Lenders Program, enabling expedited approval process for customers. Began as key element to serving small to medium-sized businesses. Small Business Loans Improved Real Estate Acquisition EXIM Financing TCCC Third Coast Commercial Capital was formed to provide working capital solutions for small to medium-sized businesses. Accounts Receivable Lending Factoring Ledgered Line of Credit Asset based Lines of Credit BUILDER FINANCE Expert bankers in the residential real estate market, began in second quarter of 2021. Specialty banking and lending solutions for private and publicly traded home building companies. Self contained business unit with stellar credit record. Homebuilder Master Planned Community Bond Anticipation Note Finance Institutional MORTGAGE Mortgage offers loans for Home Purchase, Home Refinance, Construction lending, and Investment Properties. Note: SBA, Mortgage, and TCCC lines of business do not individually make up a material portion of the total loan portfolio.
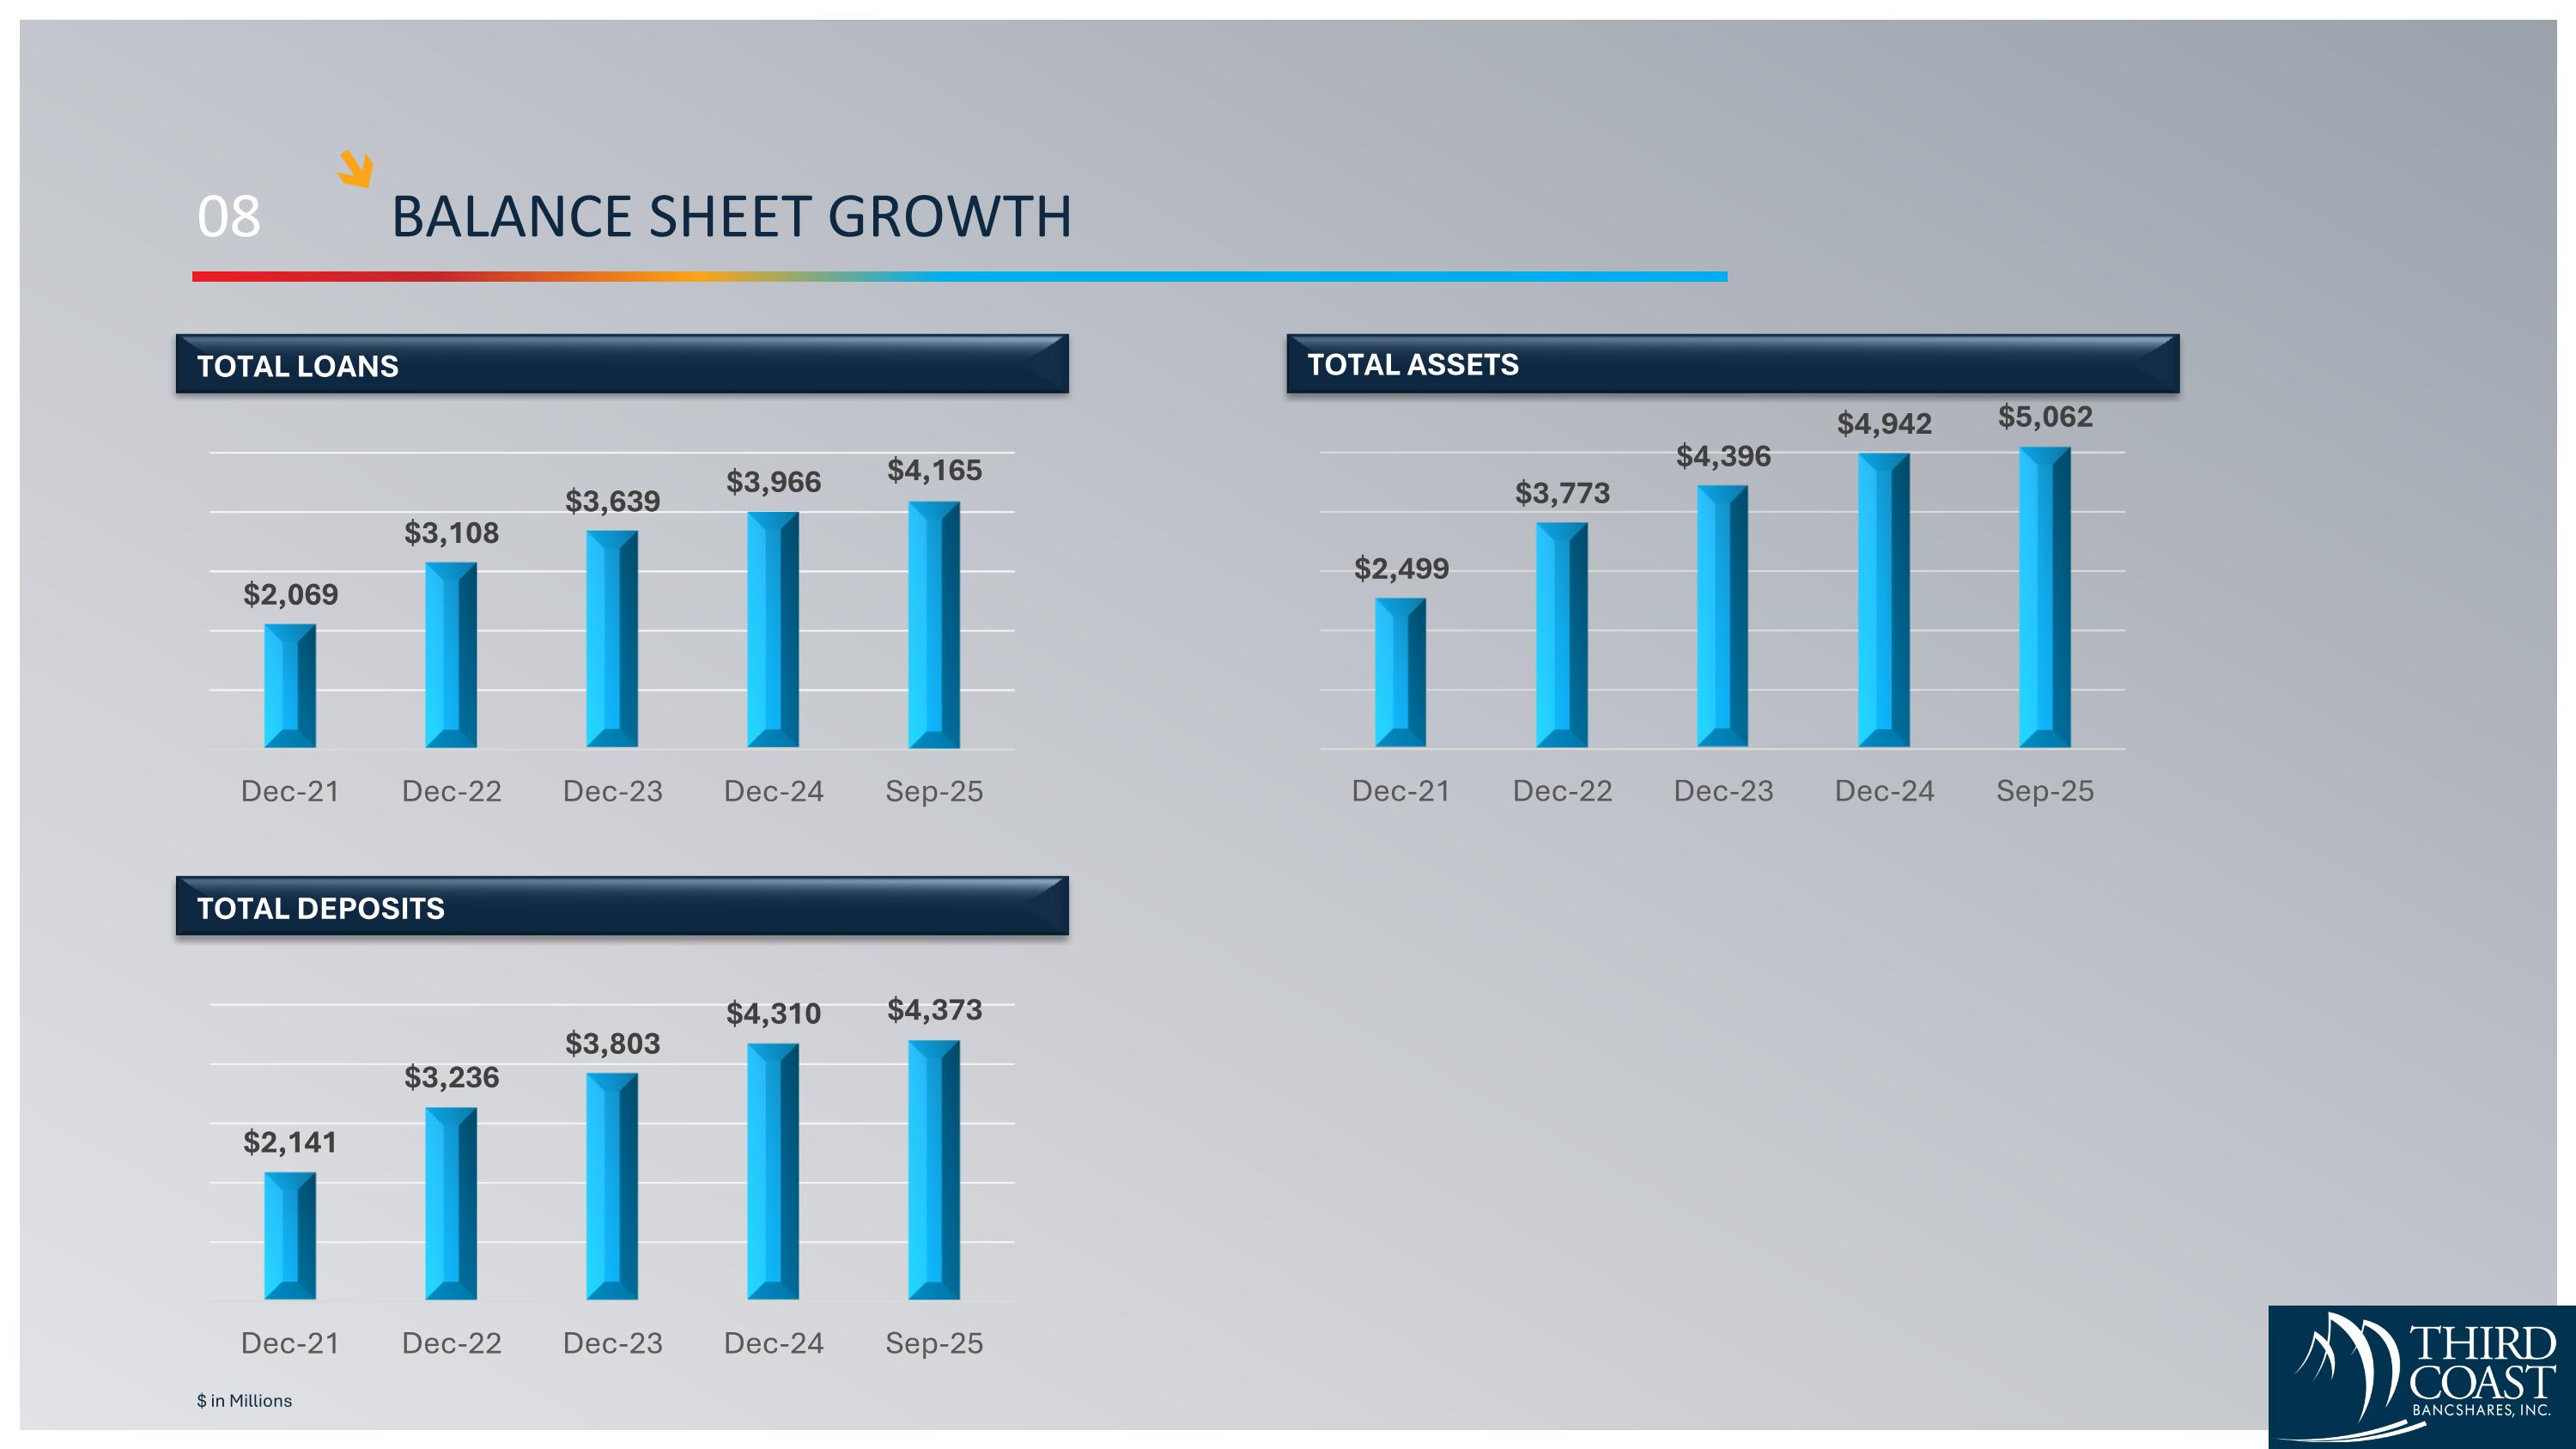
08 BALANCE SHEET GROWTH $ in Millions TOTAL LOANS TOTAL DEPOSITS TOTAL ASSETS
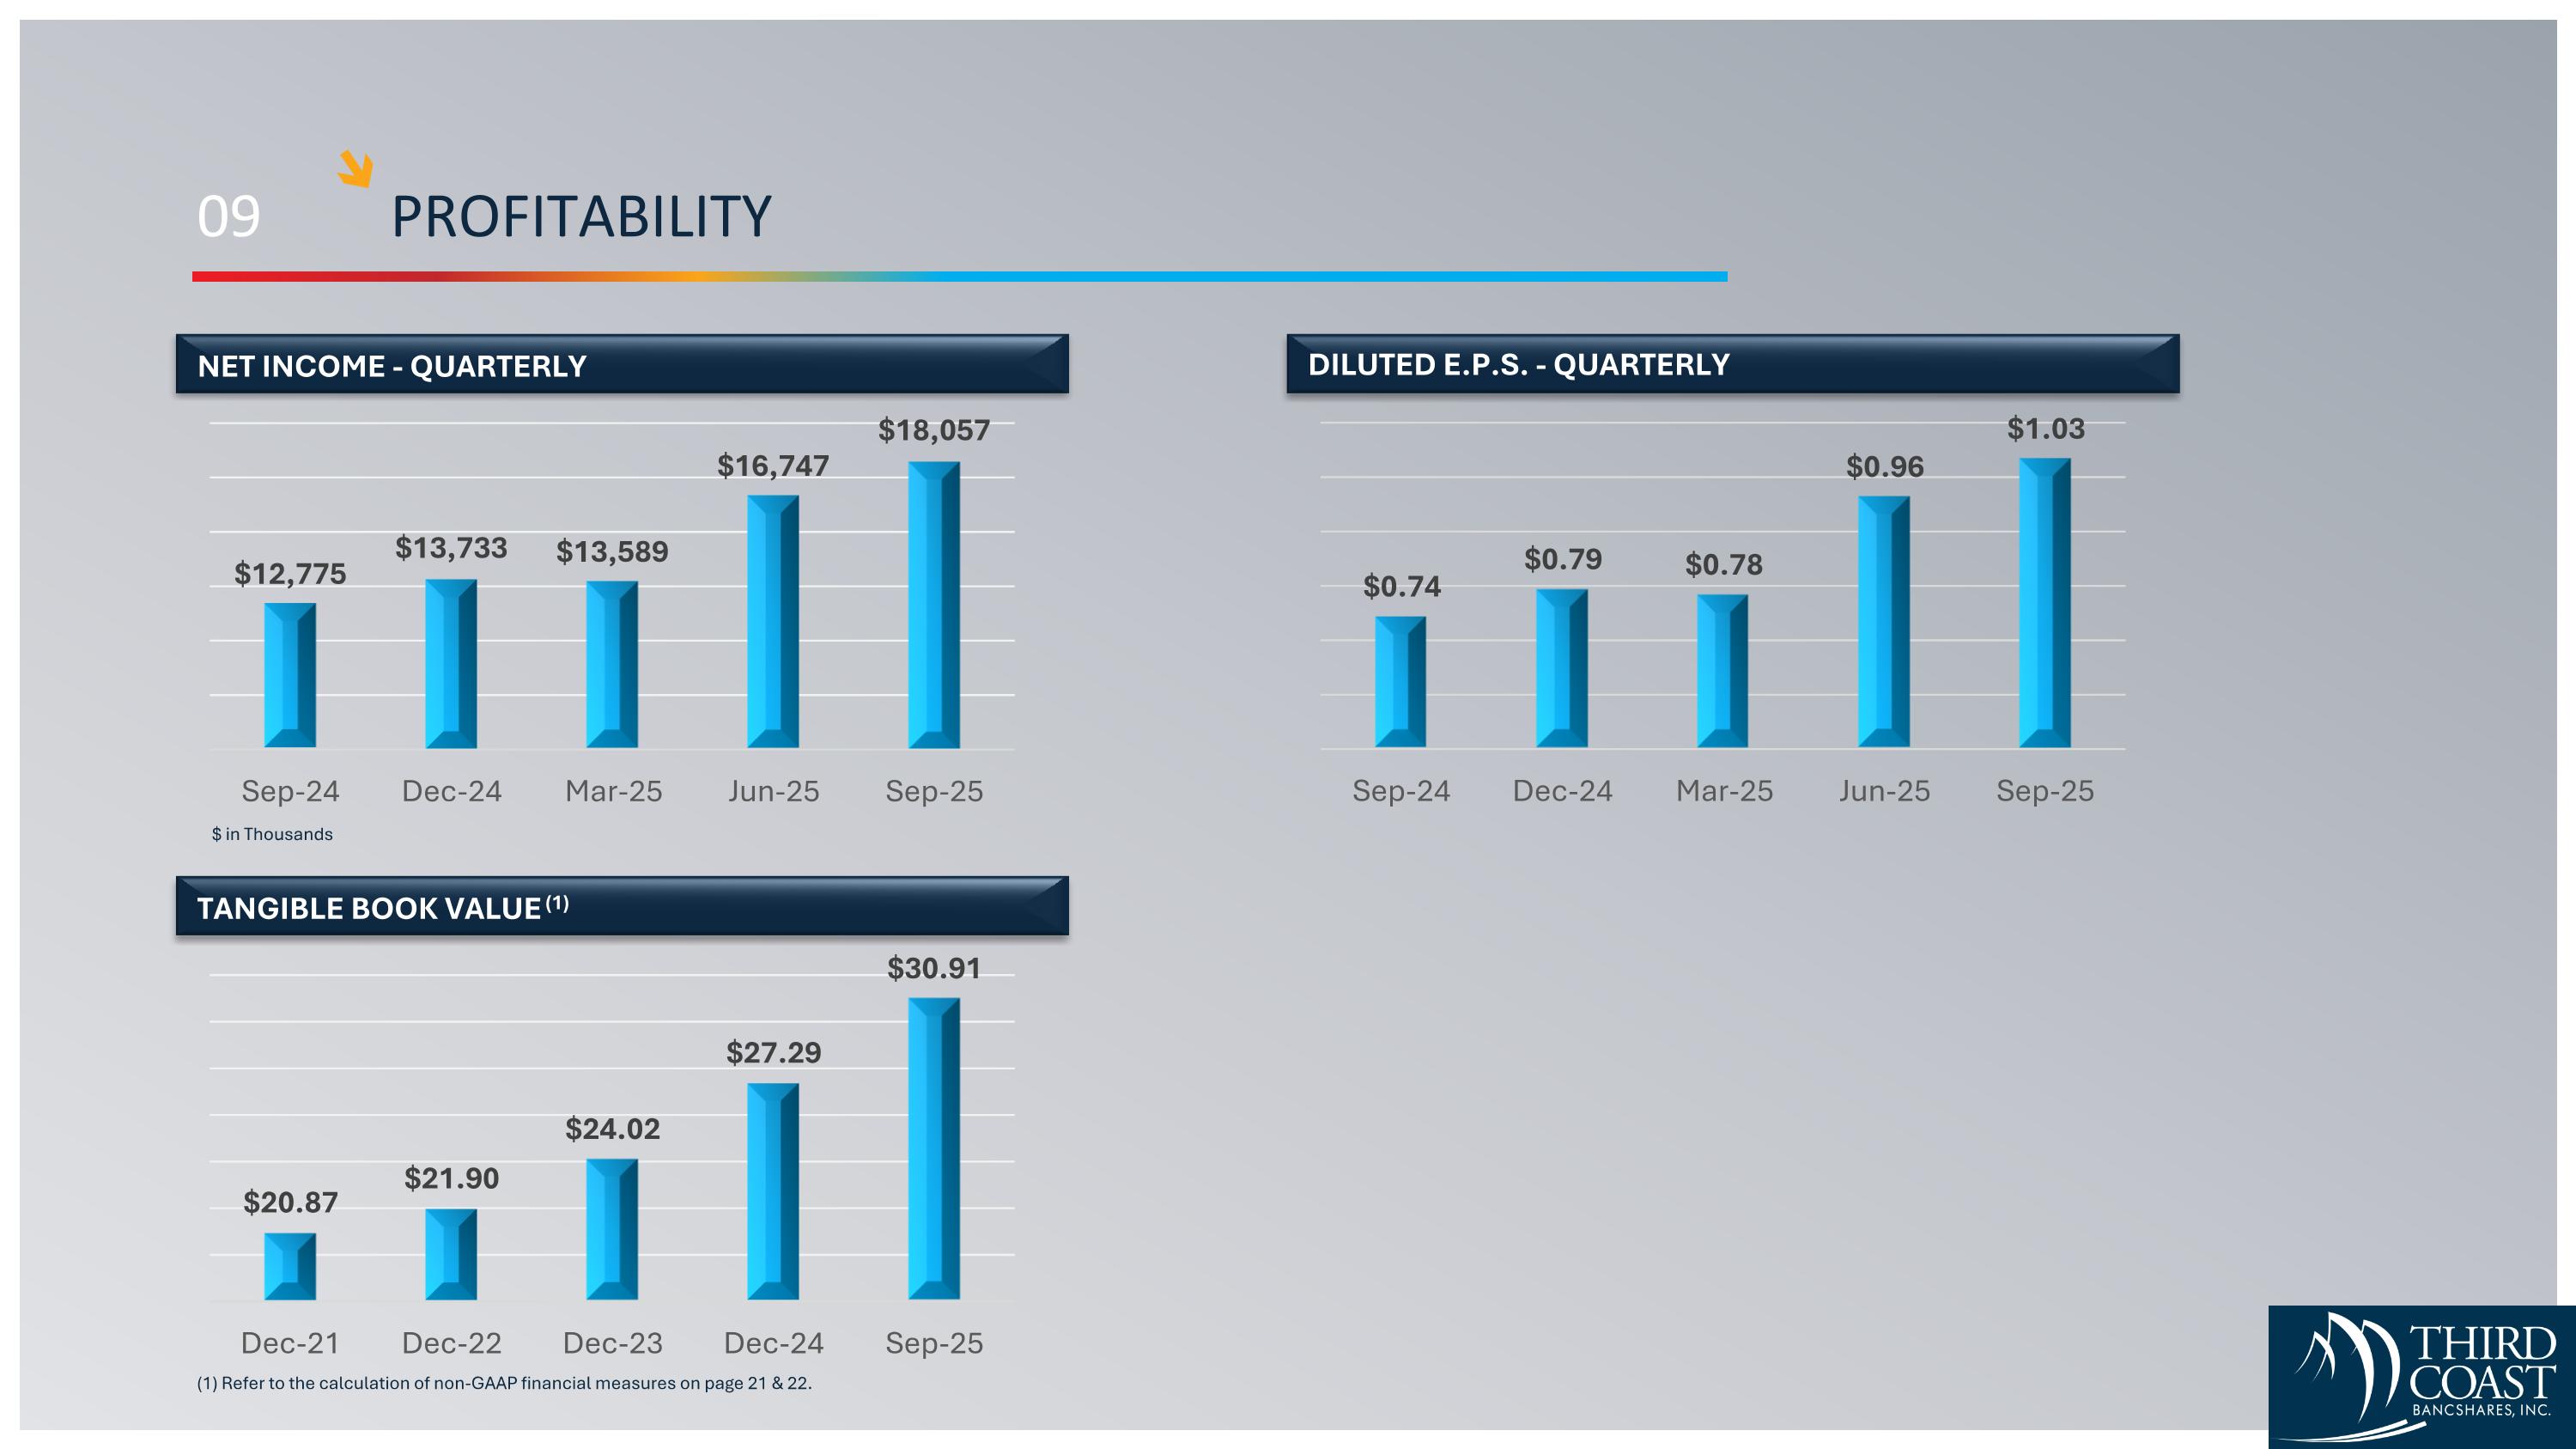
09 PROFITABILITY (1) Refer to the calculation of non-GAAP financial measures on page 21 & 22. NET INCOME - QUARTERLY TANGIBLE BOOK VALUE (1) DILUTED E.P.S. - QUARTERLY $ in Thousands
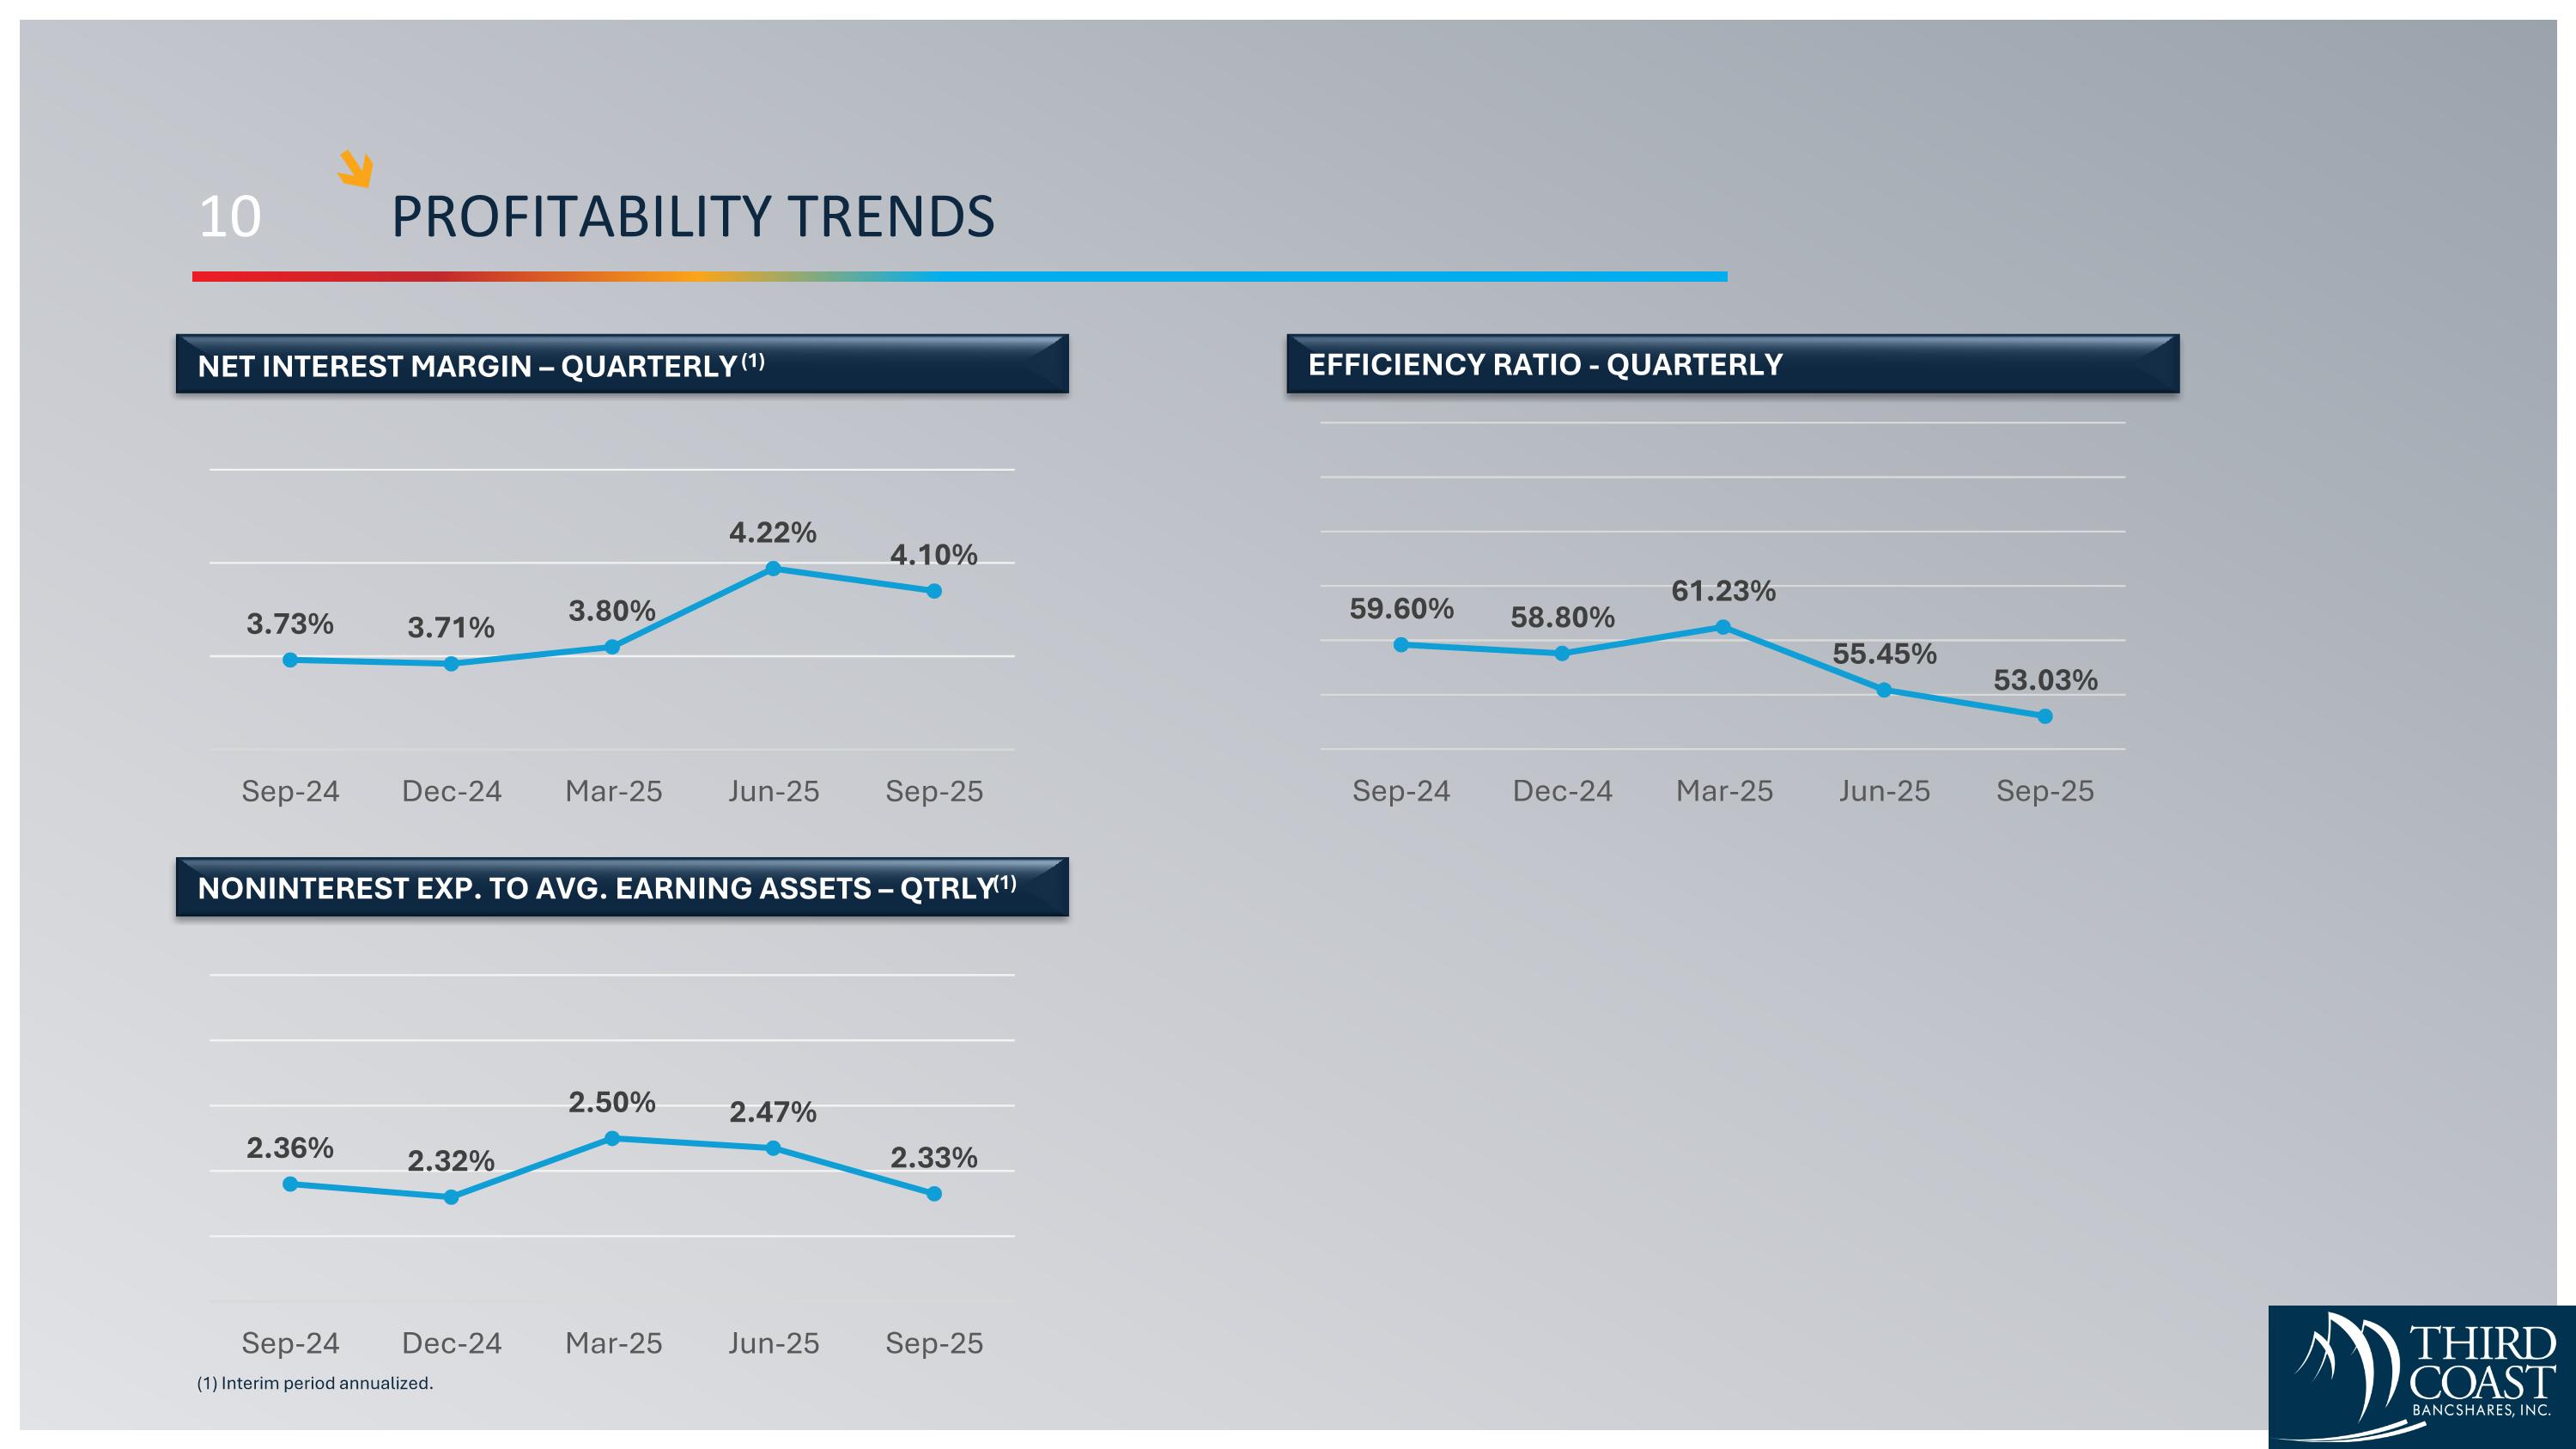
10 PROFITABILITY TRENDS (1) Interim period annualized. NET INTEREST MARGIN – QUARTERLY (1) NONINTEREST EXP. TO AVG. EARNING ASSETS – QTRLY (1) EFFICIENCY RATIO - QUARTERLY
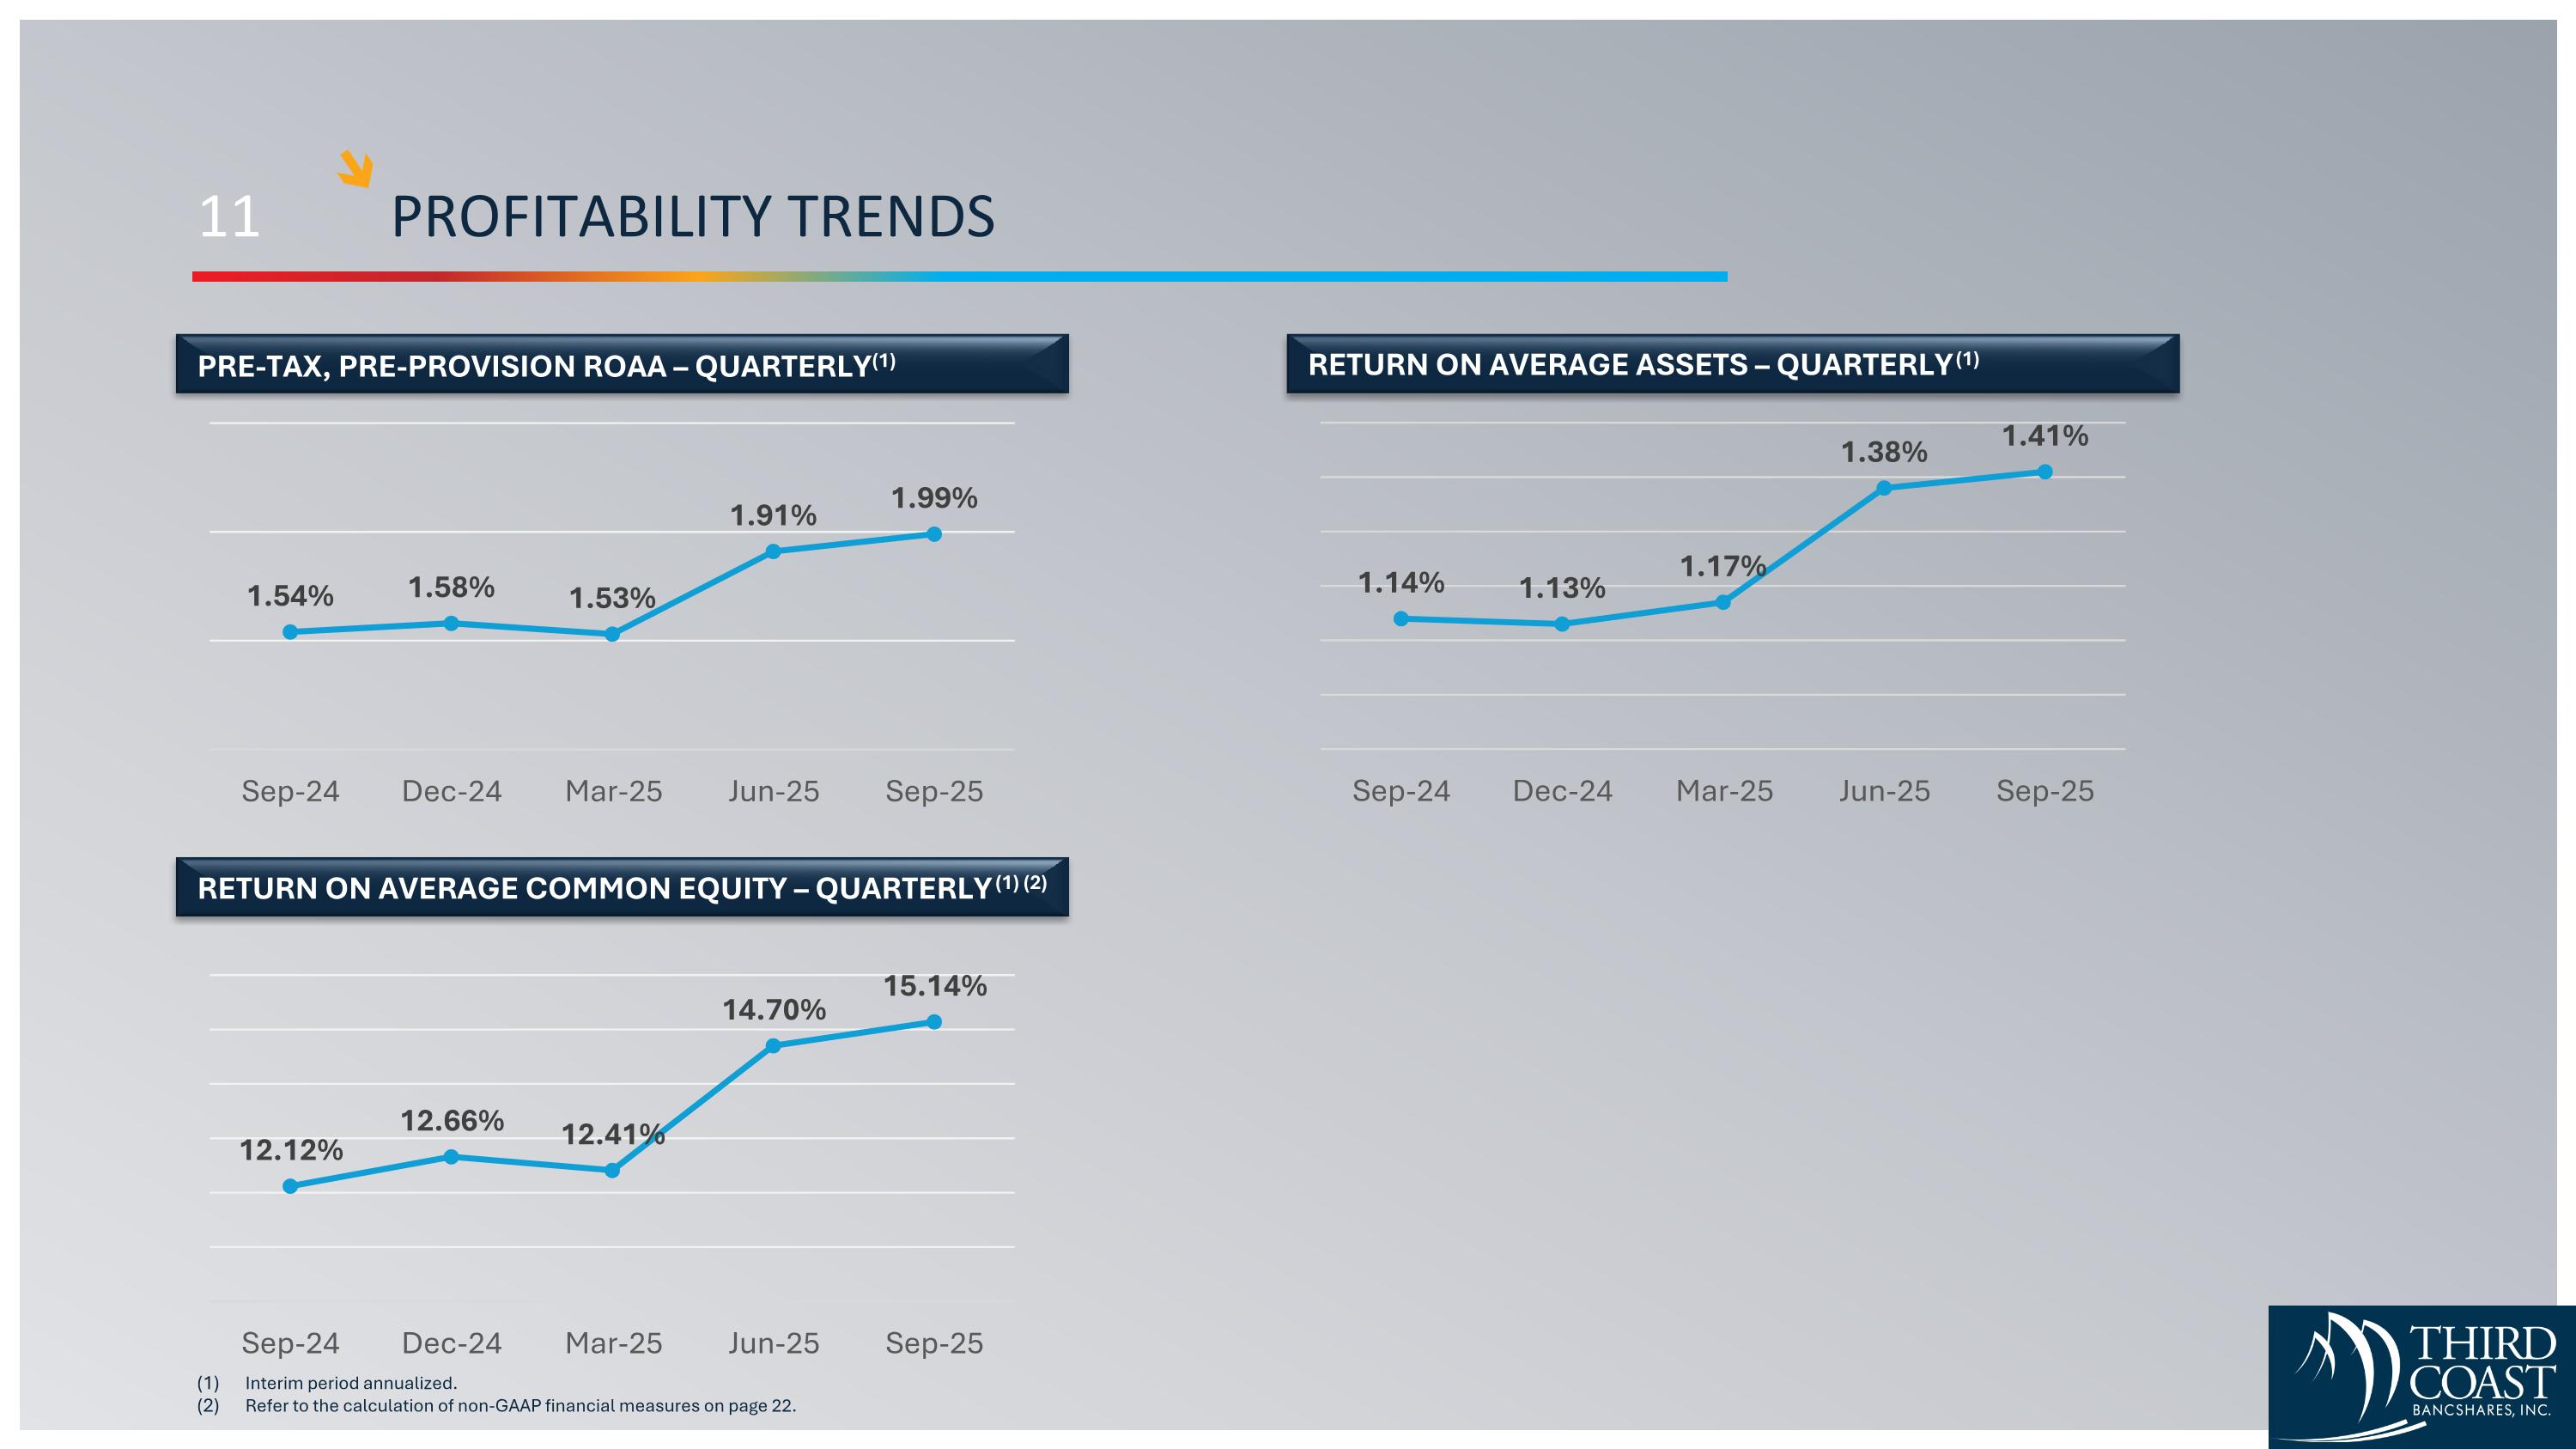
11 PROFITABILITY TRENDS Interim period annualized. Refer to the calculation of non-GAAP financial measures on page 22. PRE-TAX, PRE-PROVISION ROAA – QUARTERLY (1) RETURN ON AVERAGE COMMON EQUITY – QUARTERLY (1) (2) RETURN ON AVERAGE ASSETS – QUARTERLY (1)
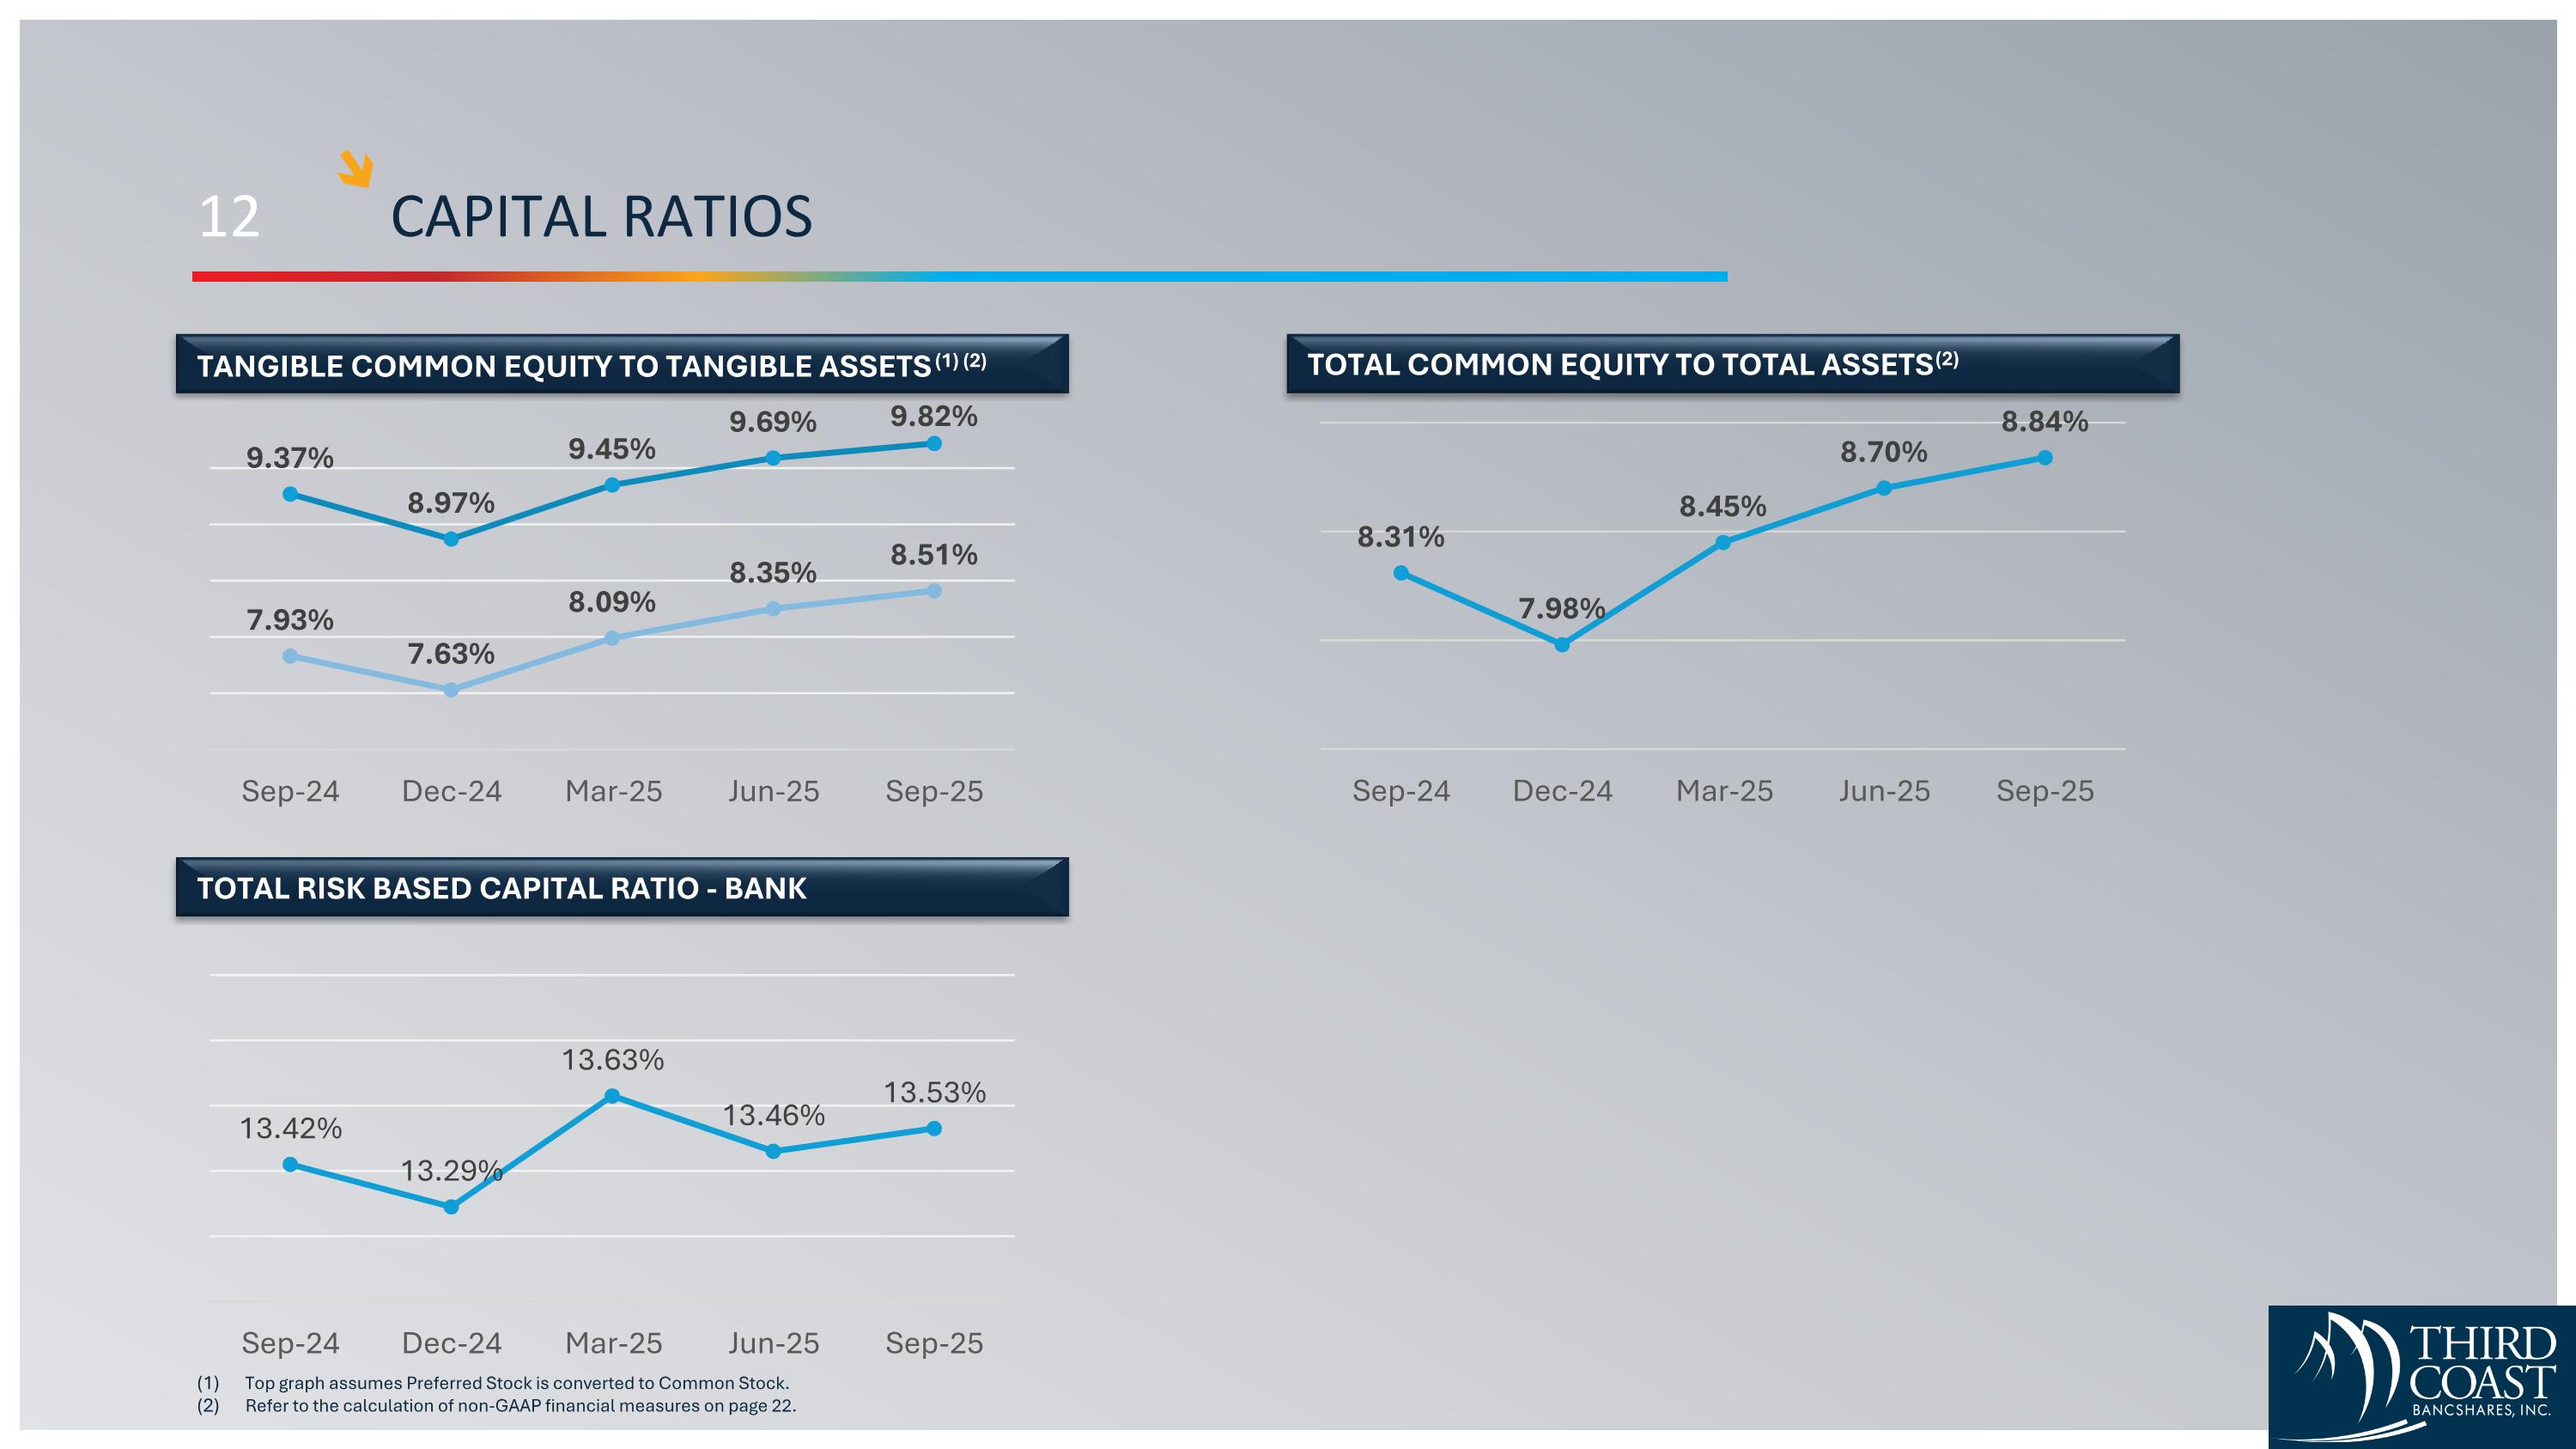
12 CAPITAL RATIOS Top graph assumes Preferred Stock is converted to Common Stock. Refer to the calculation of non-GAAP financial measures on page 22. TANGIBLE COMMON EQUITY TO TANGIBLE ASSETS (1) (2) TOTAL RISK BASED CAPITAL RATIO - BANK TOTAL COMMON EQUITY TO TOTAL ASSETS (2)
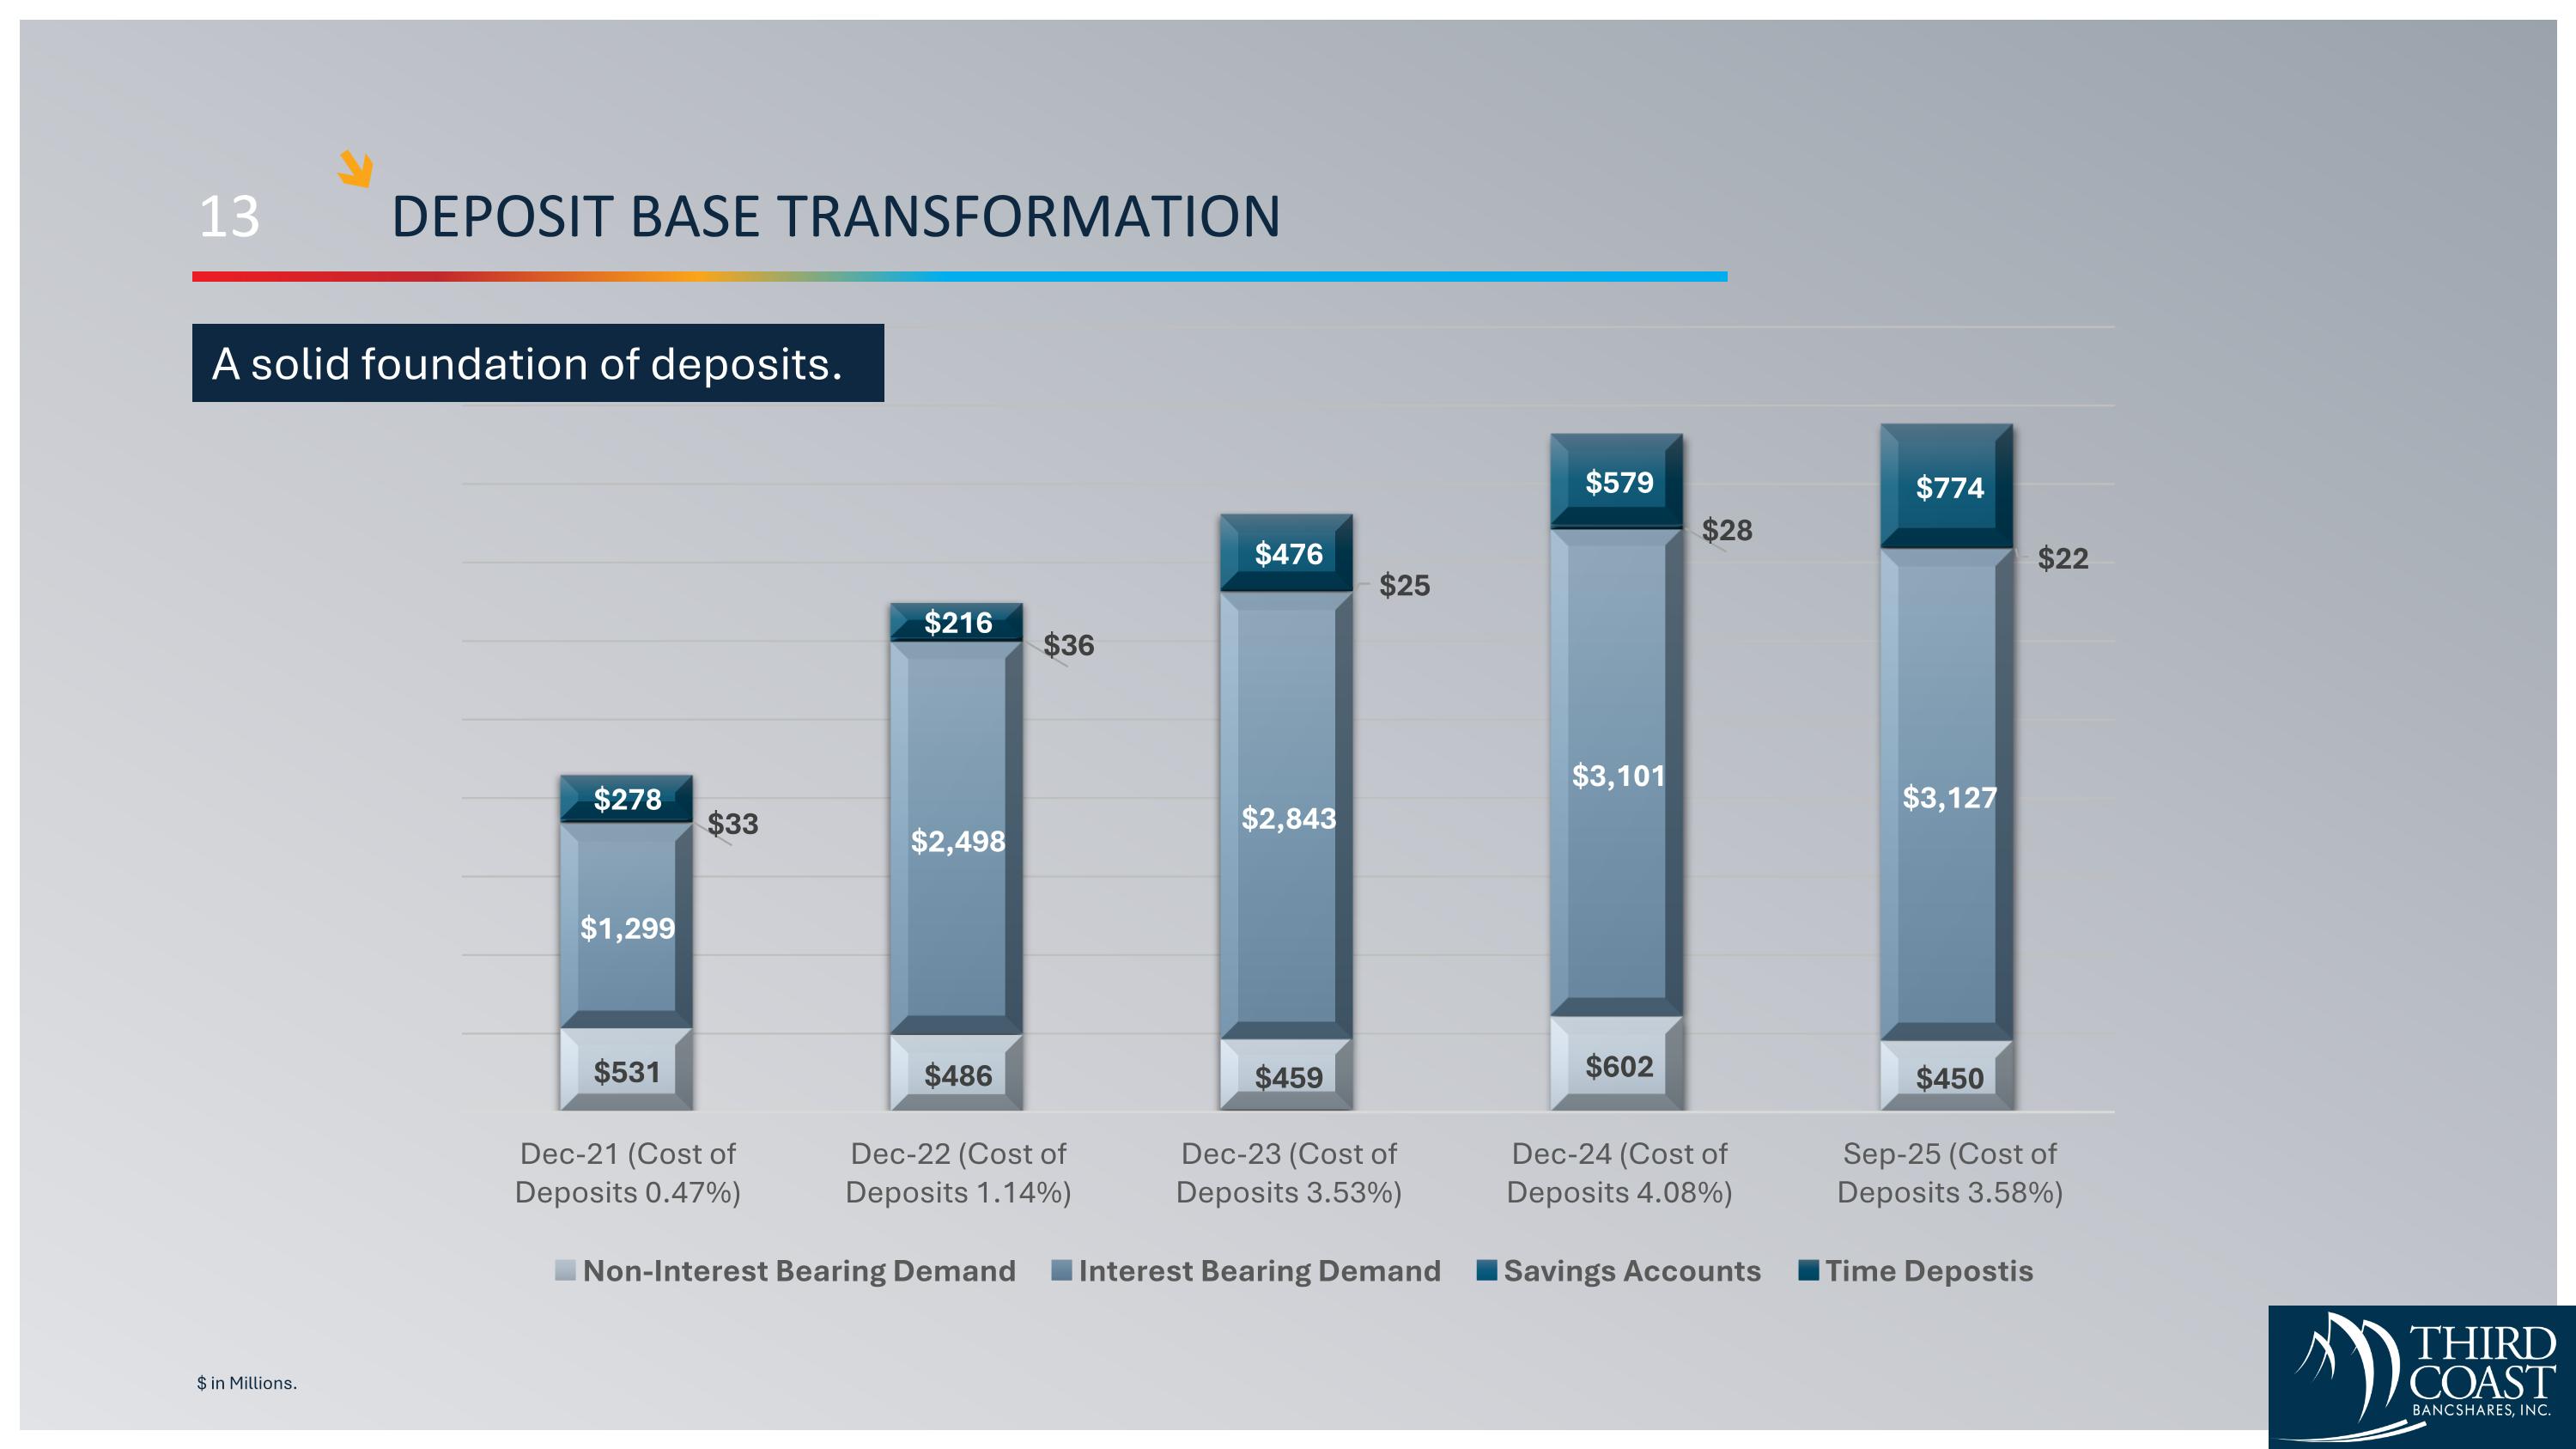
13 DEPOSIT BASE TRANSFORMATION $ in Millions. A solid foundation of deposits.
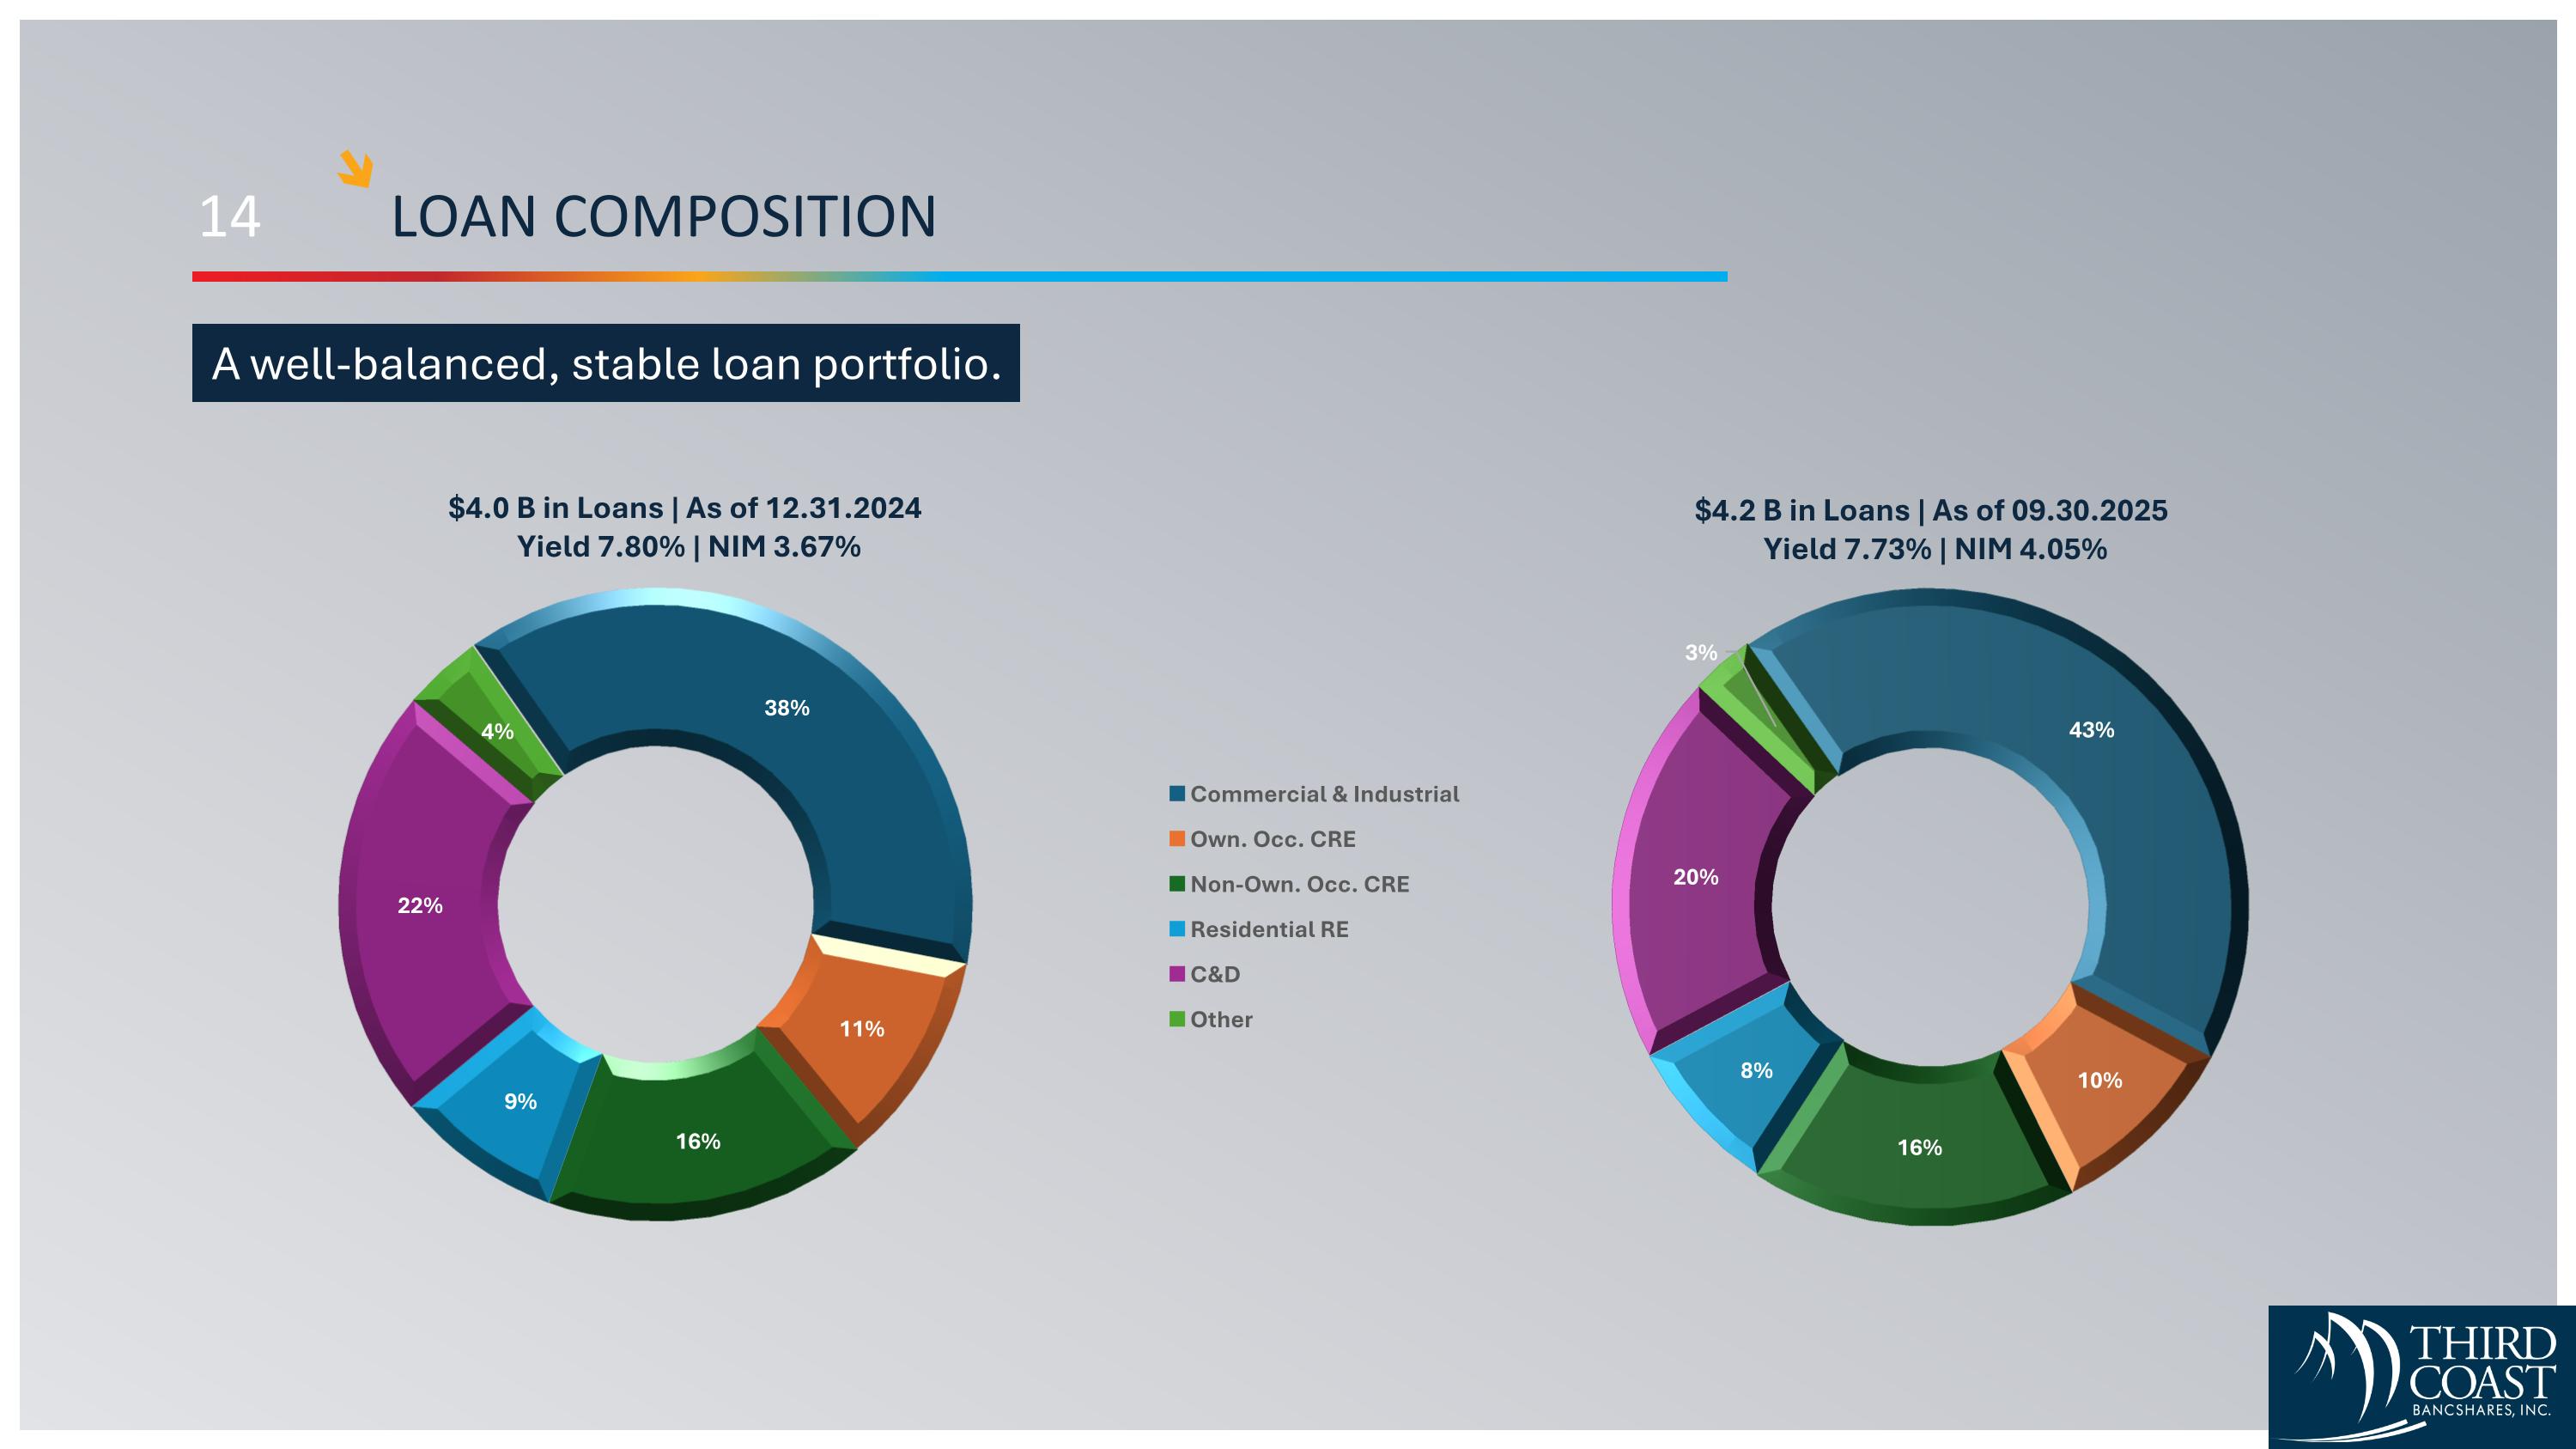
14 LOAN COMPOSITION A well-balanced, stable loan portfolio. $4.0 B in Loans | As of 12.31.2024 Yield 7.80% | NIM 3.67% $4.2 B in Loans | As of 09.30.2025 Yield 7.73% | NIM 4.05%
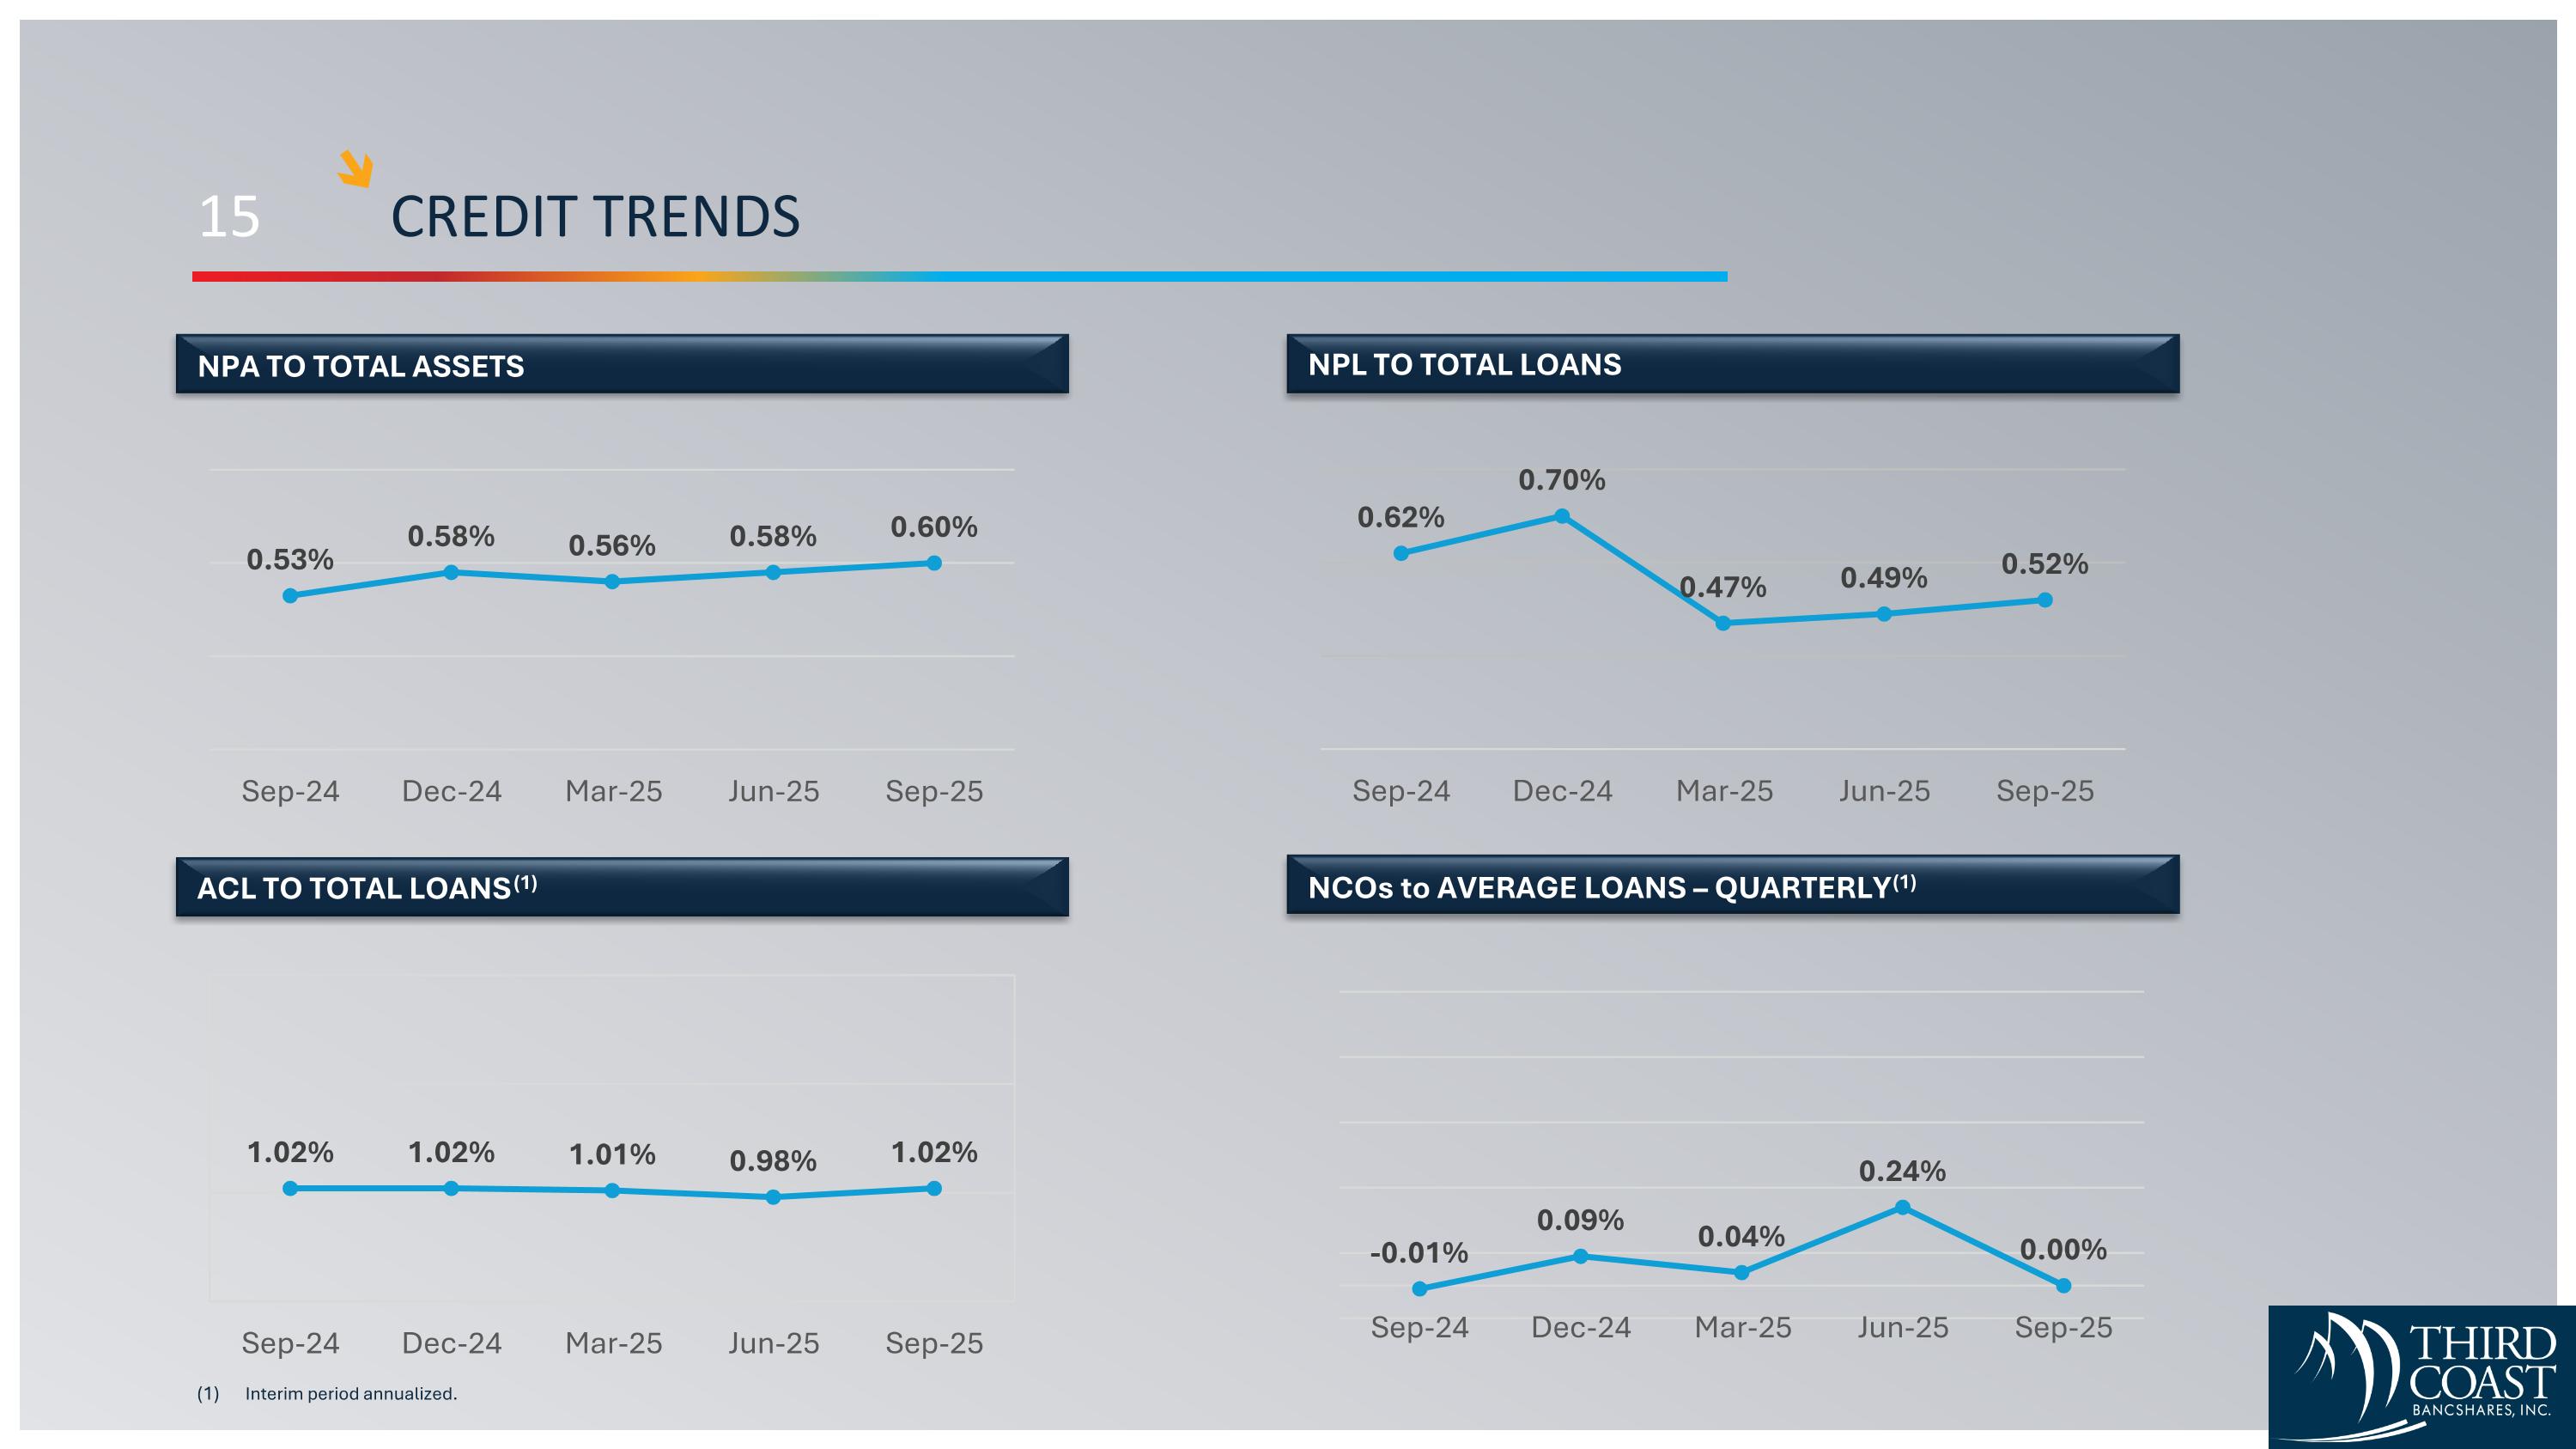
15 CREDIT TRENDS Interim period annualized. NPA TO TOTAL ASSETS ACL TO TOTAL LOANS (1) NPL TO TOTAL LOANS NCOs to AVERAGE LOANS – QUARTERLY (1)
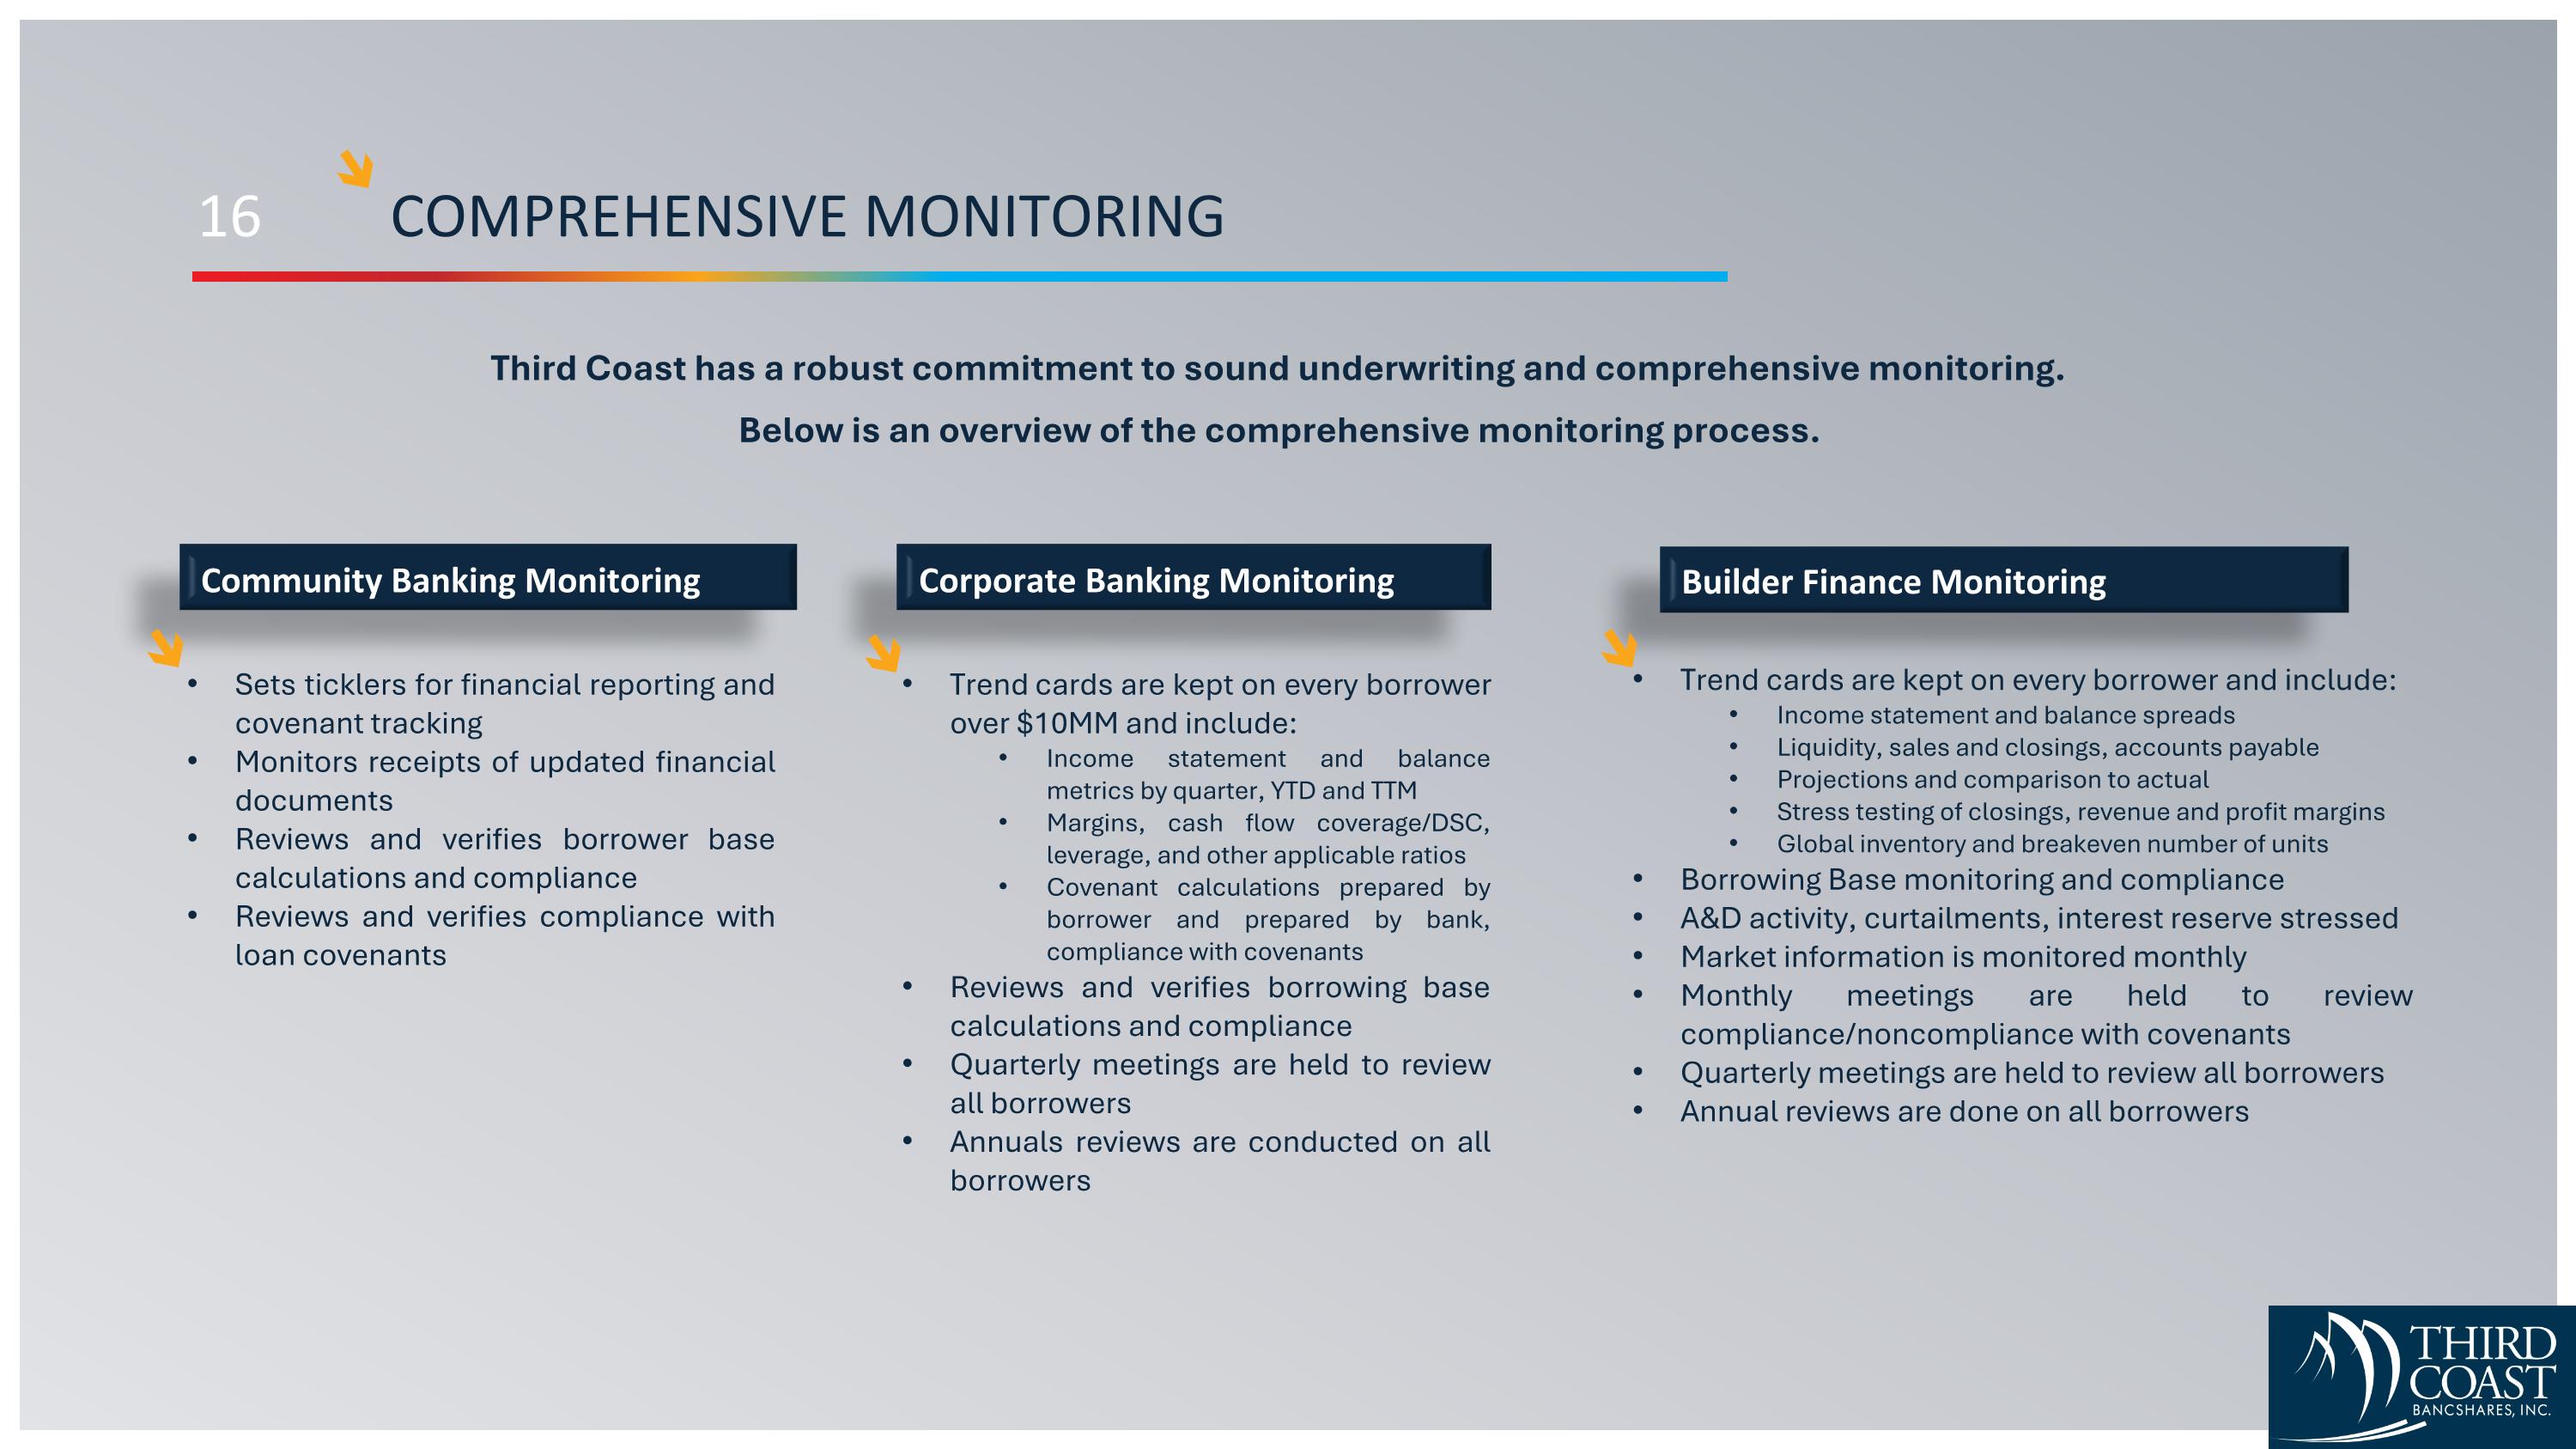
16 COMPREHENSIVE MONITORING Third Coast has a robust commitment to sound underwriting and comprehensive monitoring. Below is an overview of the comprehensive monitoring process. Sets ticklers for financial reporting and covenant tracking Monitors receipts of updated financial documents Reviews and verifies borrower base calculations and compliance Reviews and verifies compliance with loan covenants Trend cards are kept on every borrower over $10MM and include: Income statement and balance metrics by quarter, YTD and TTM Margins, cash flow coverage/DSC, leverage, and other applicable ratios Covenant calculations prepared by borrower and prepared by bank, compliance with covenants Reviews and verifies borrowing base calculations and compliance Quarterly meetings are held to review all borrowers Annuals reviews are conducted on all borrowers Trend cards are kept on every borrower and include: Income statement and balance spreads Liquidity, sales and closings, accounts payable Projections and comparison to actual Stress testing of closings, revenue and profit margins Global inventory and breakeven number of units Borrowing Base monitoring and compliance A&D activity, curtailments, interest reserve stressed Market information is monitored monthly Monthly meetings are held to review compliance/noncompliance with covenants Quarterly meetings are held to review all borrowers Annual reviews are done on all borrowers Community Banking Monitoring Corporate Banking Monitoring Builder Finance Monitoring
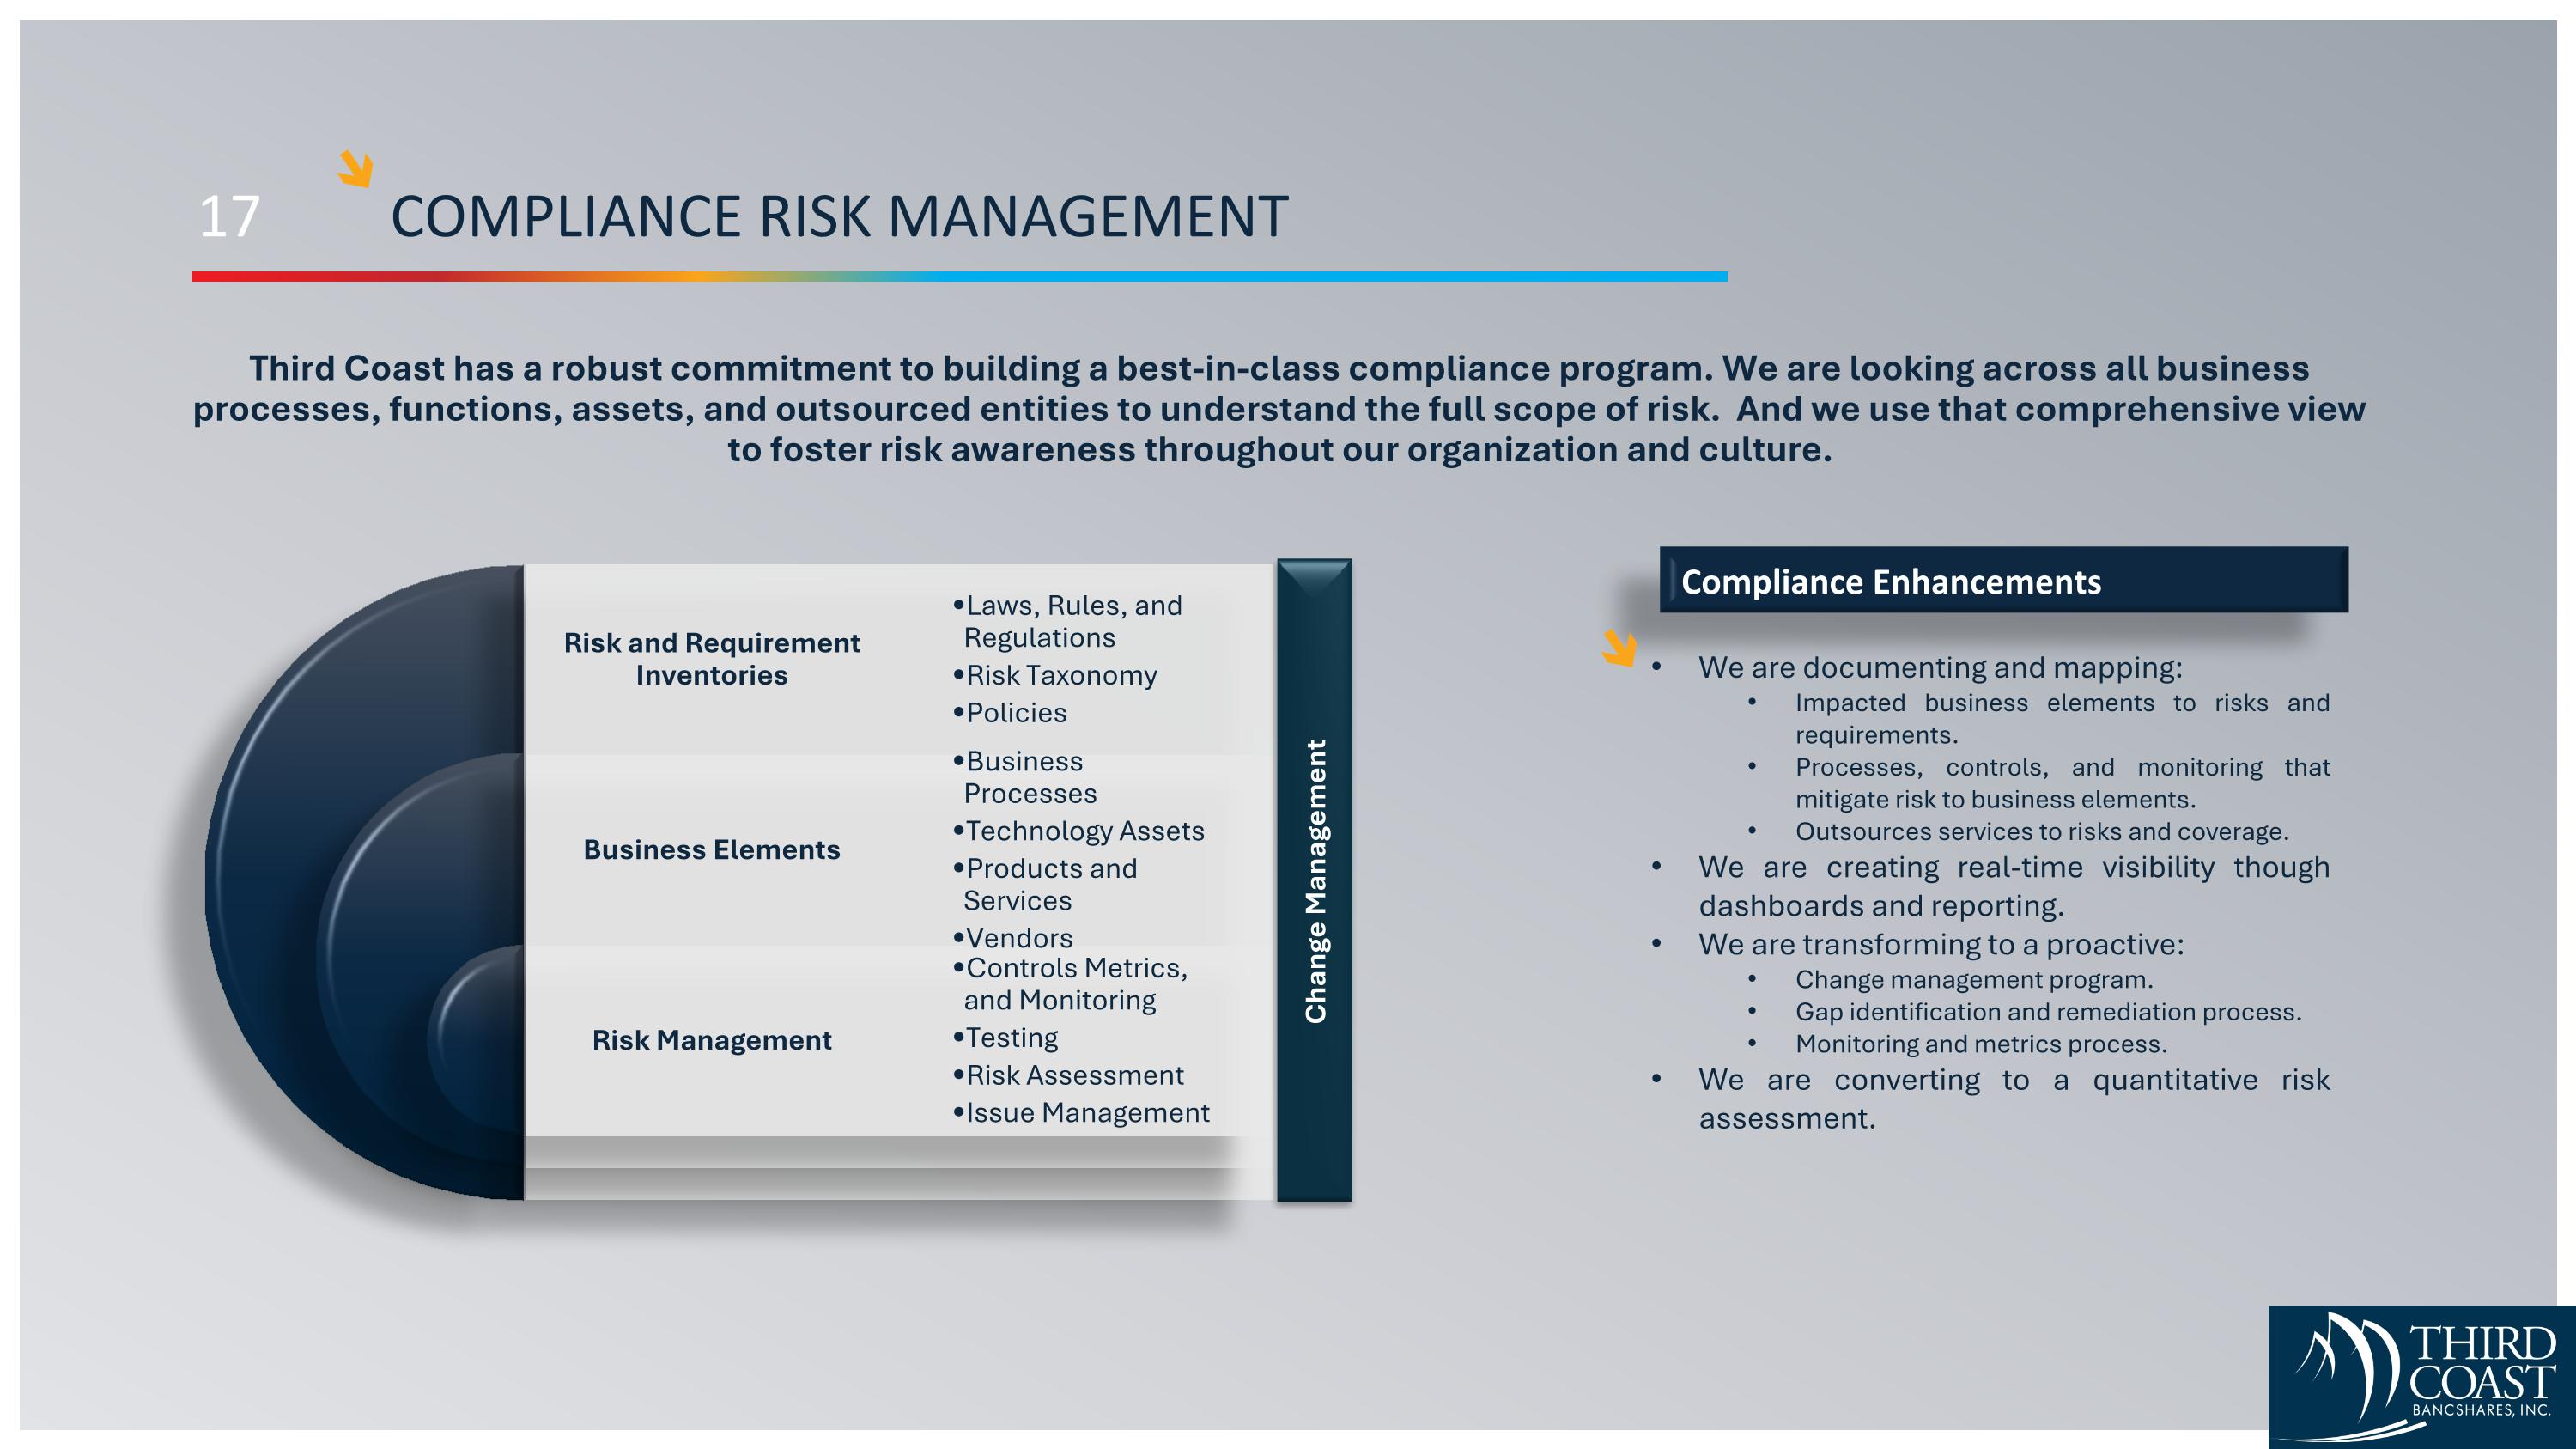
17 COMPLIANCE RISK MANAGEMENT Third Coast has a robust commitment to building a best-in-class compliance program. We are looking across all business processes, functions, assets, and outsourced entities to understand the full scope of risk. And we use that comprehensive view to foster risk awareness throughout our organization and culture. We are documenting and mapping: Impacted business elements to risks and requirements. Processes, controls, and monitoring that mitigate risk to business elements. Outsources services to risks and coverage. We are creating real-time visibility though dashboards and reporting. We are transforming to a proactive: Change management program. Gap identification and remediation process. Monitoring and metrics process. We are converting to a quantitative risk assessment. Compliance Enhancements Risk and Requirement Inventories Laws, Rules, and Regulations Risk Taxonomy Policies Business Elements Business Processes Technology Assets Products and Services Vendors Risk Management Controls Metrics, and Monitoring Testing Risk Assessment Issue Management Change Management
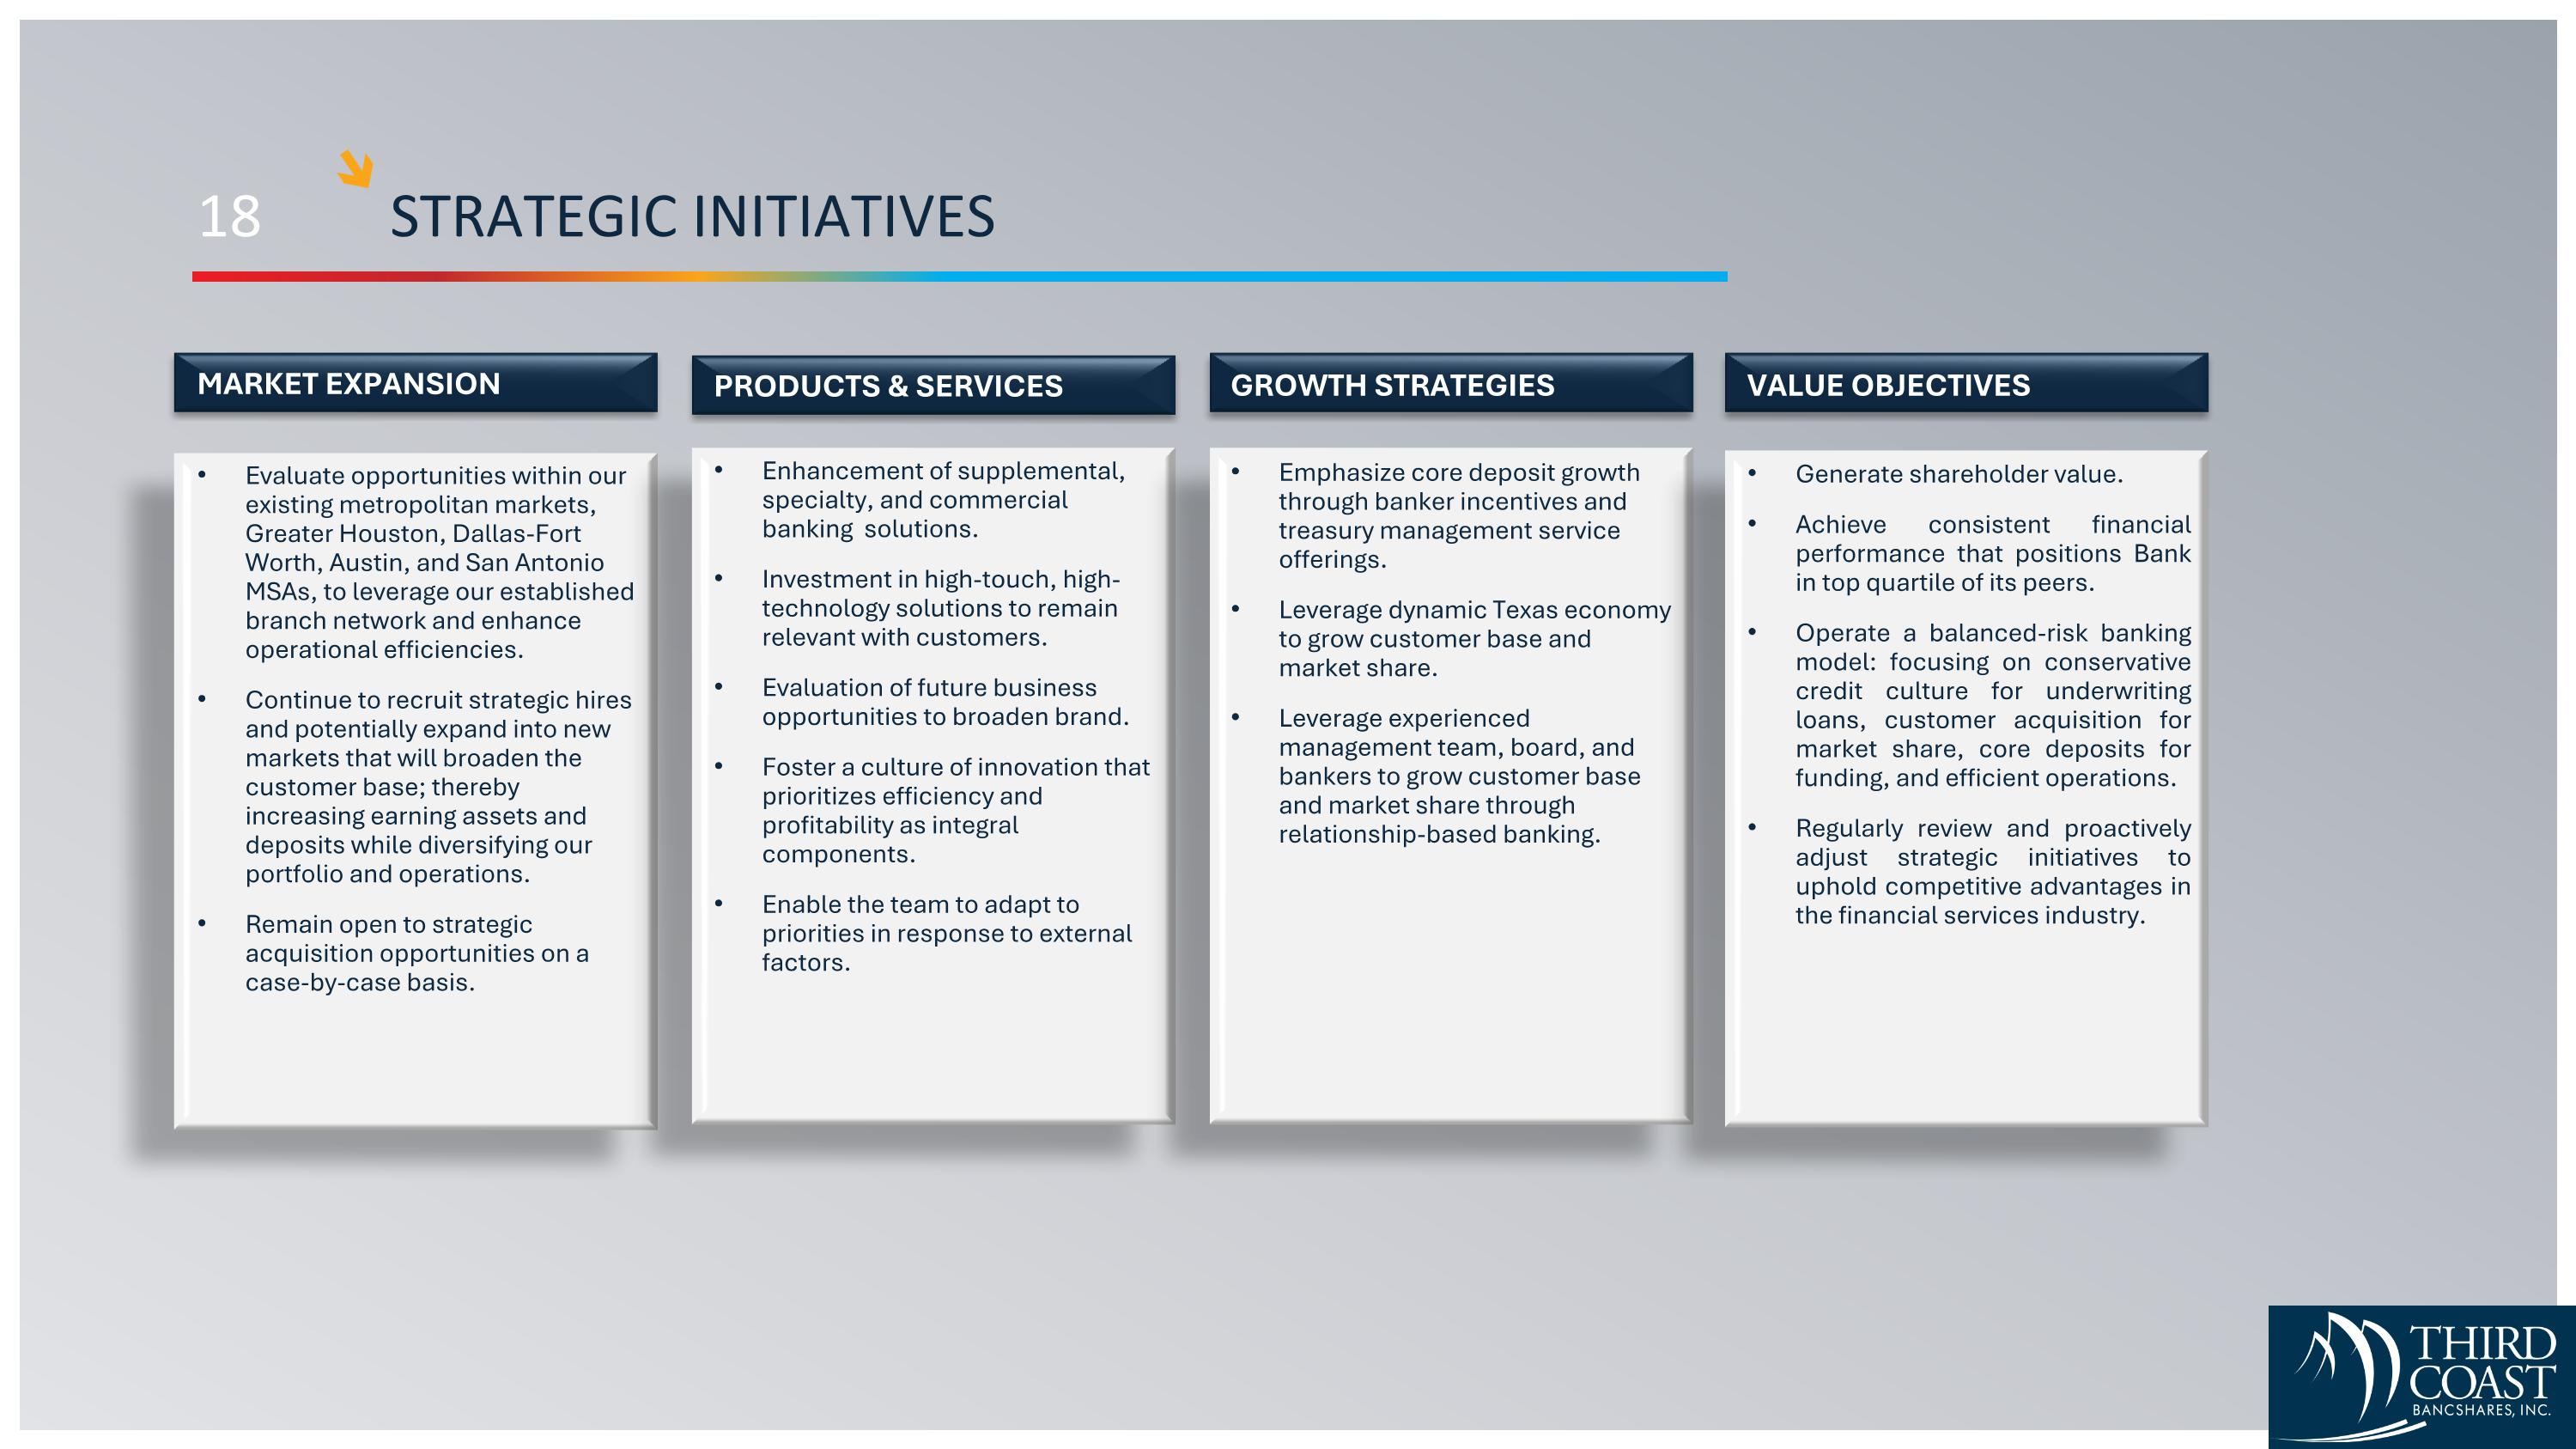
18 STRATEGIC INITIATIVES Evaluate opportunities within our existing metropolitan markets, Greater Houston, Dallas-Fort Worth, Austin, and San Antonio MSAs, to leverage our established branch network and enhance operational efficiencies. Continue to recruit strategic hires and potentially expand into new markets that will broaden the customer base; thereby increasing earning assets and deposits while diversifying our portfolio and operations. Remain open to strategic acquisition opportunities on a case-by-case basis. Enhancement of supplemental, specialty, and commercial banking solutions. Investment in high-touch, high-technology solutions to remain relevant with customers. Evaluation of future business opportunities to broaden brand. Foster a culture of innovation that prioritizes efficiency and profitability as integral components. Enable the team to adapt to priorities in response to external factors. Emphasize core deposit growth through banker incentives and treasury management service offerings. Leverage dynamic Texas economy to grow customer base and market share. Leverage experienced management team, board, and bankers to grow customer base and market share through relationship-based banking. Generate shareholder value. Achieve consistent financial performance that positions Bank in top quartile of its peers. Operate a balanced-risk banking model: focusing on conservative credit culture for underwriting loans, customer acquisition for market share, core deposits for funding, and efficient operations. Regularly review and proactively adjust strategic initiatives to uphold competitive advantages in the financial services industry. MARKET EXPANSION PRODUCTS & SERVICES GROWTH STRATEGIES VALUE OBJECTIVES
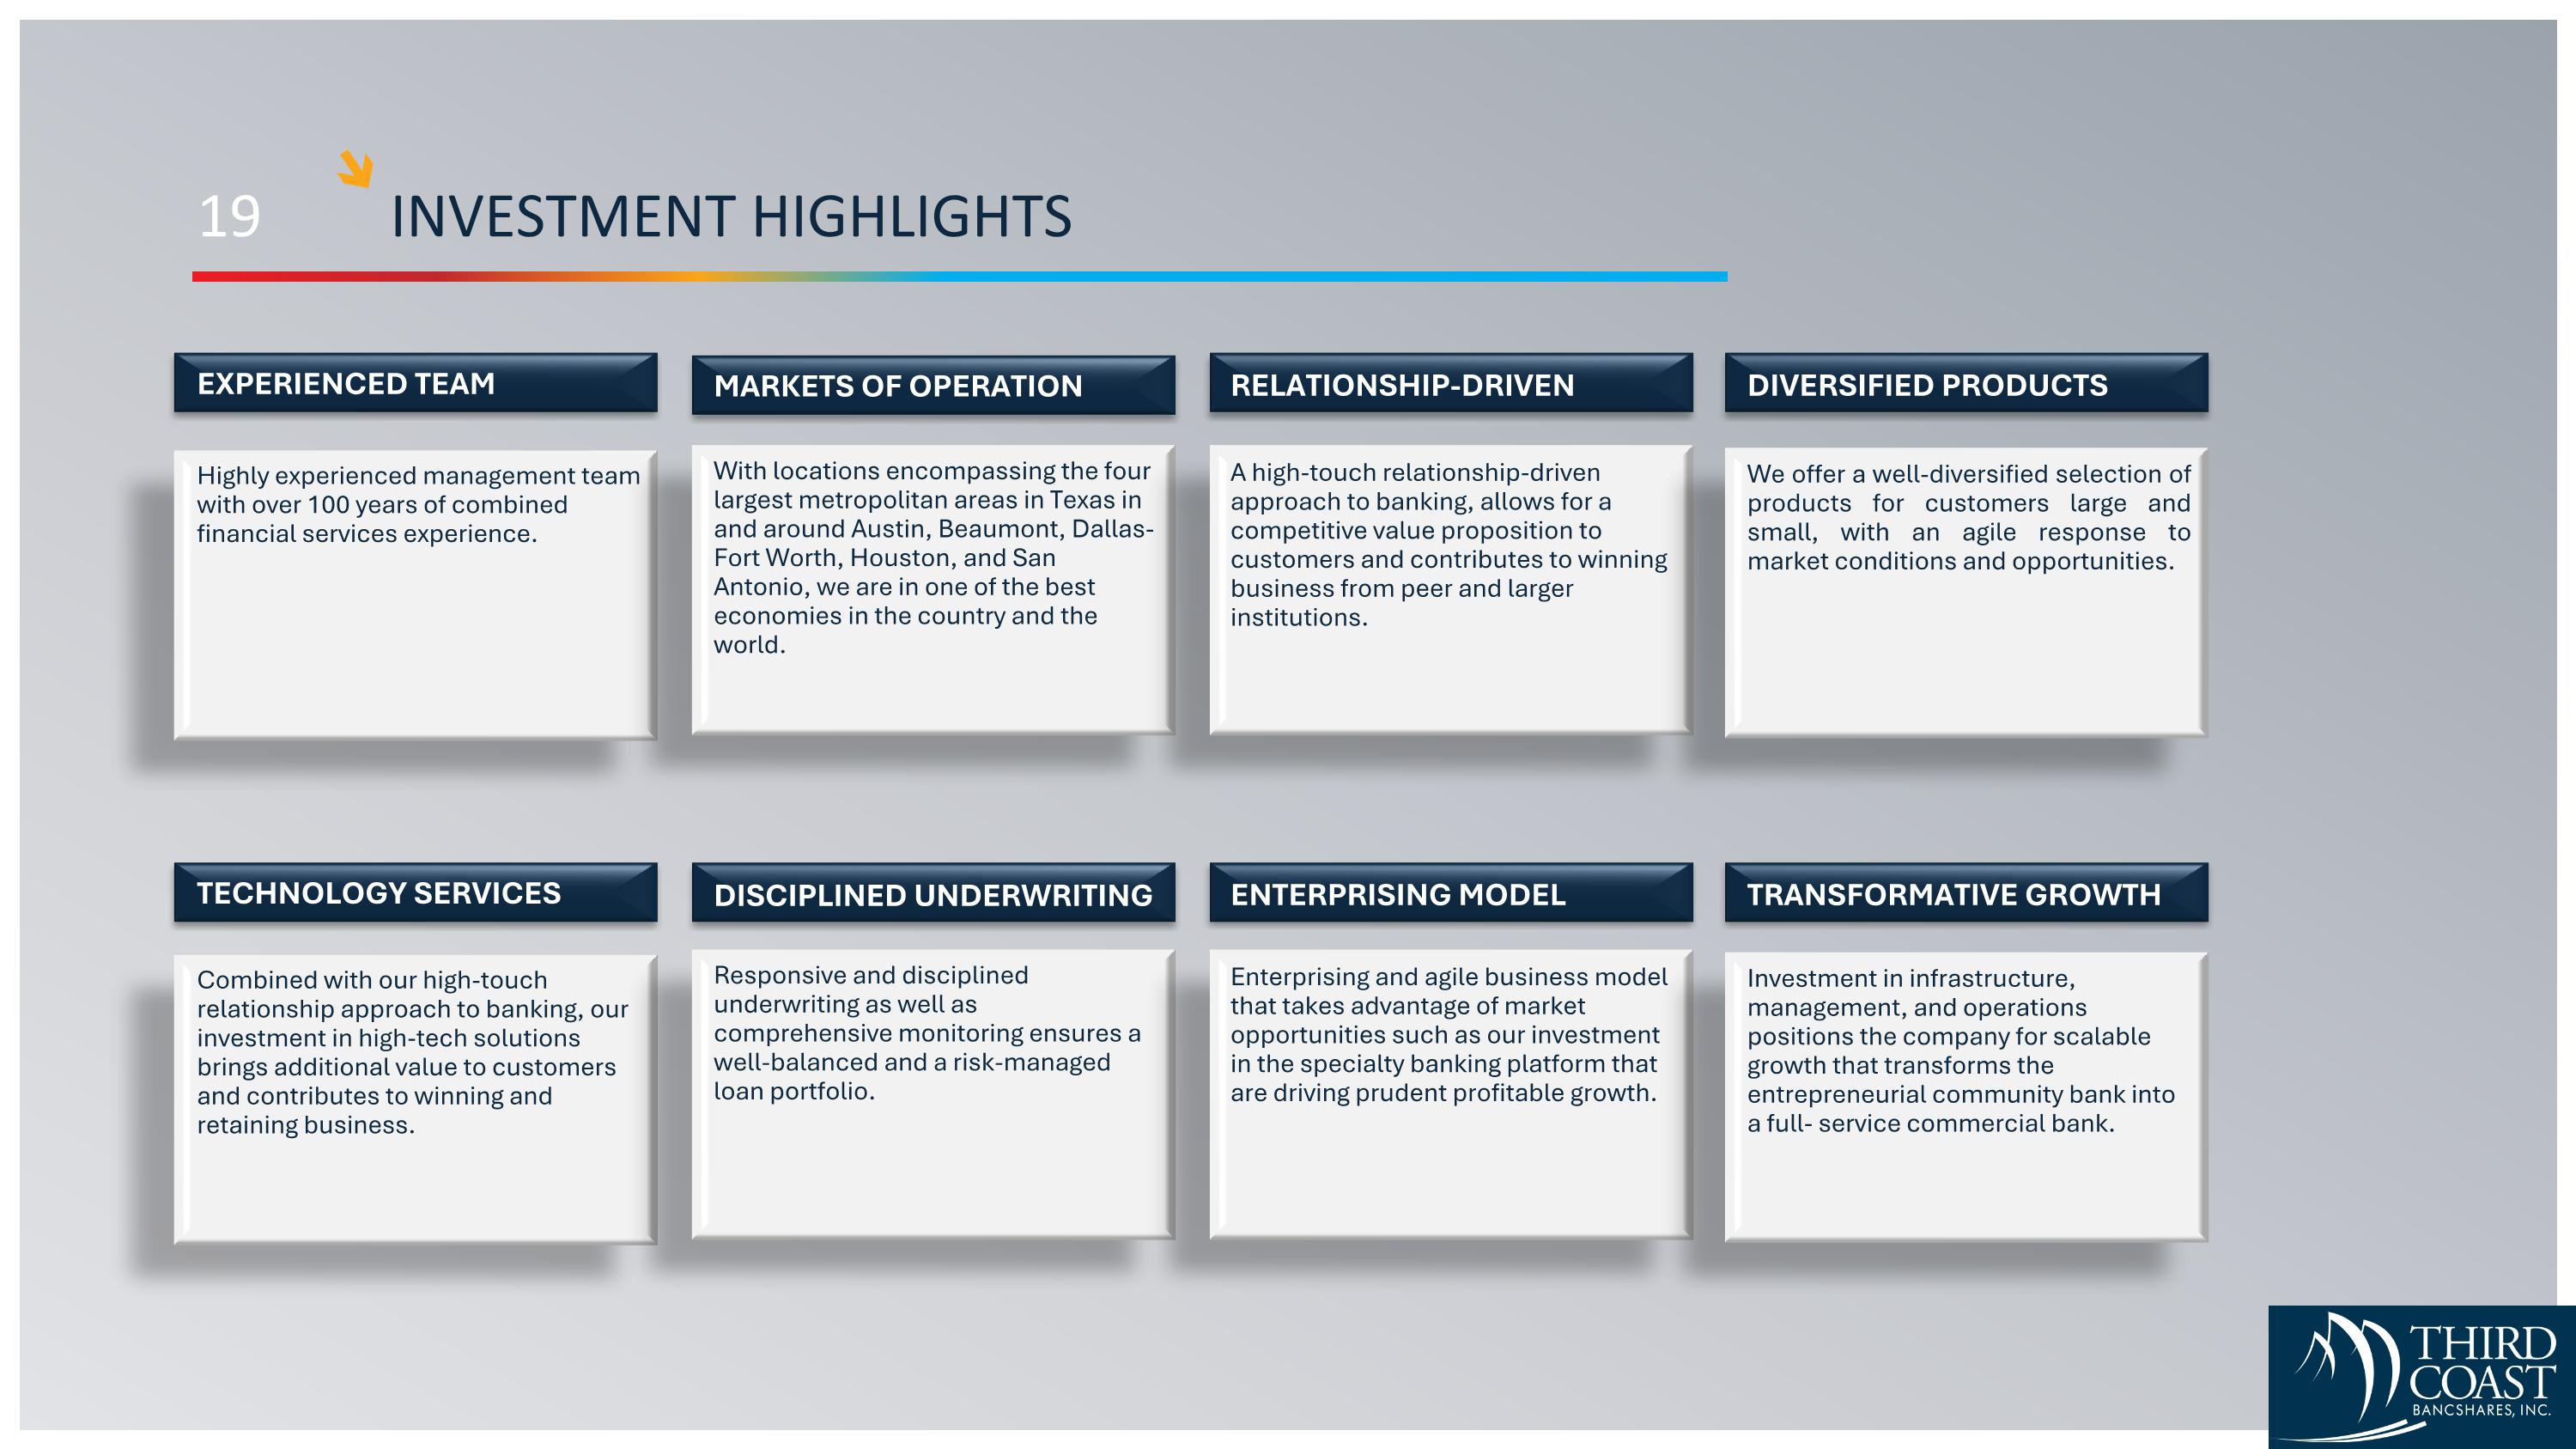
19 INVESTMENT HIGHLIGHTS Highly experienced management team with over 100 years of combined financial services experience. With locations encompassing the four largest metropolitan areas in Texas in and around Austin, Beaumont, Dallas-Fort Worth, Houston, and San Antonio, we are in one of the best economies in the country and the world. A high-touch relationship-driven approach to banking, allows for a competitive value proposition to customers and contributes to winning business from peer and larger institutions. We offer a well-diversified selection of products for customers large and small, with an agile response to market conditions and opportunities. EXPERIENCED TEAM MARKETS OF OPERATION RELATIONSHIP-DRIVEN DIVERSIFIED PRODUCTS TECHNOLOGY SERVICES DISCIPLINED UNDERWRITING ENTERPRISING MODEL TRANSFORMATIVE GROWTH Combined with our high-touch relationship approach to banking, our investment in high-tech solutions brings additional value to customers and contributes to winning and retaining business. Responsive and disciplined underwriting as well as comprehensive monitoring ensures a well-balanced and a risk-managed loan portfolio. Enterprising and agile business model that takes advantage of market opportunities such as our investment in the specialty banking platform that are driving prudent profitable growth. Investment in infrastructure, management, and operations positions the company for scalable growth that transforms the entrepreneurial community bank into a full- service commercial bank.
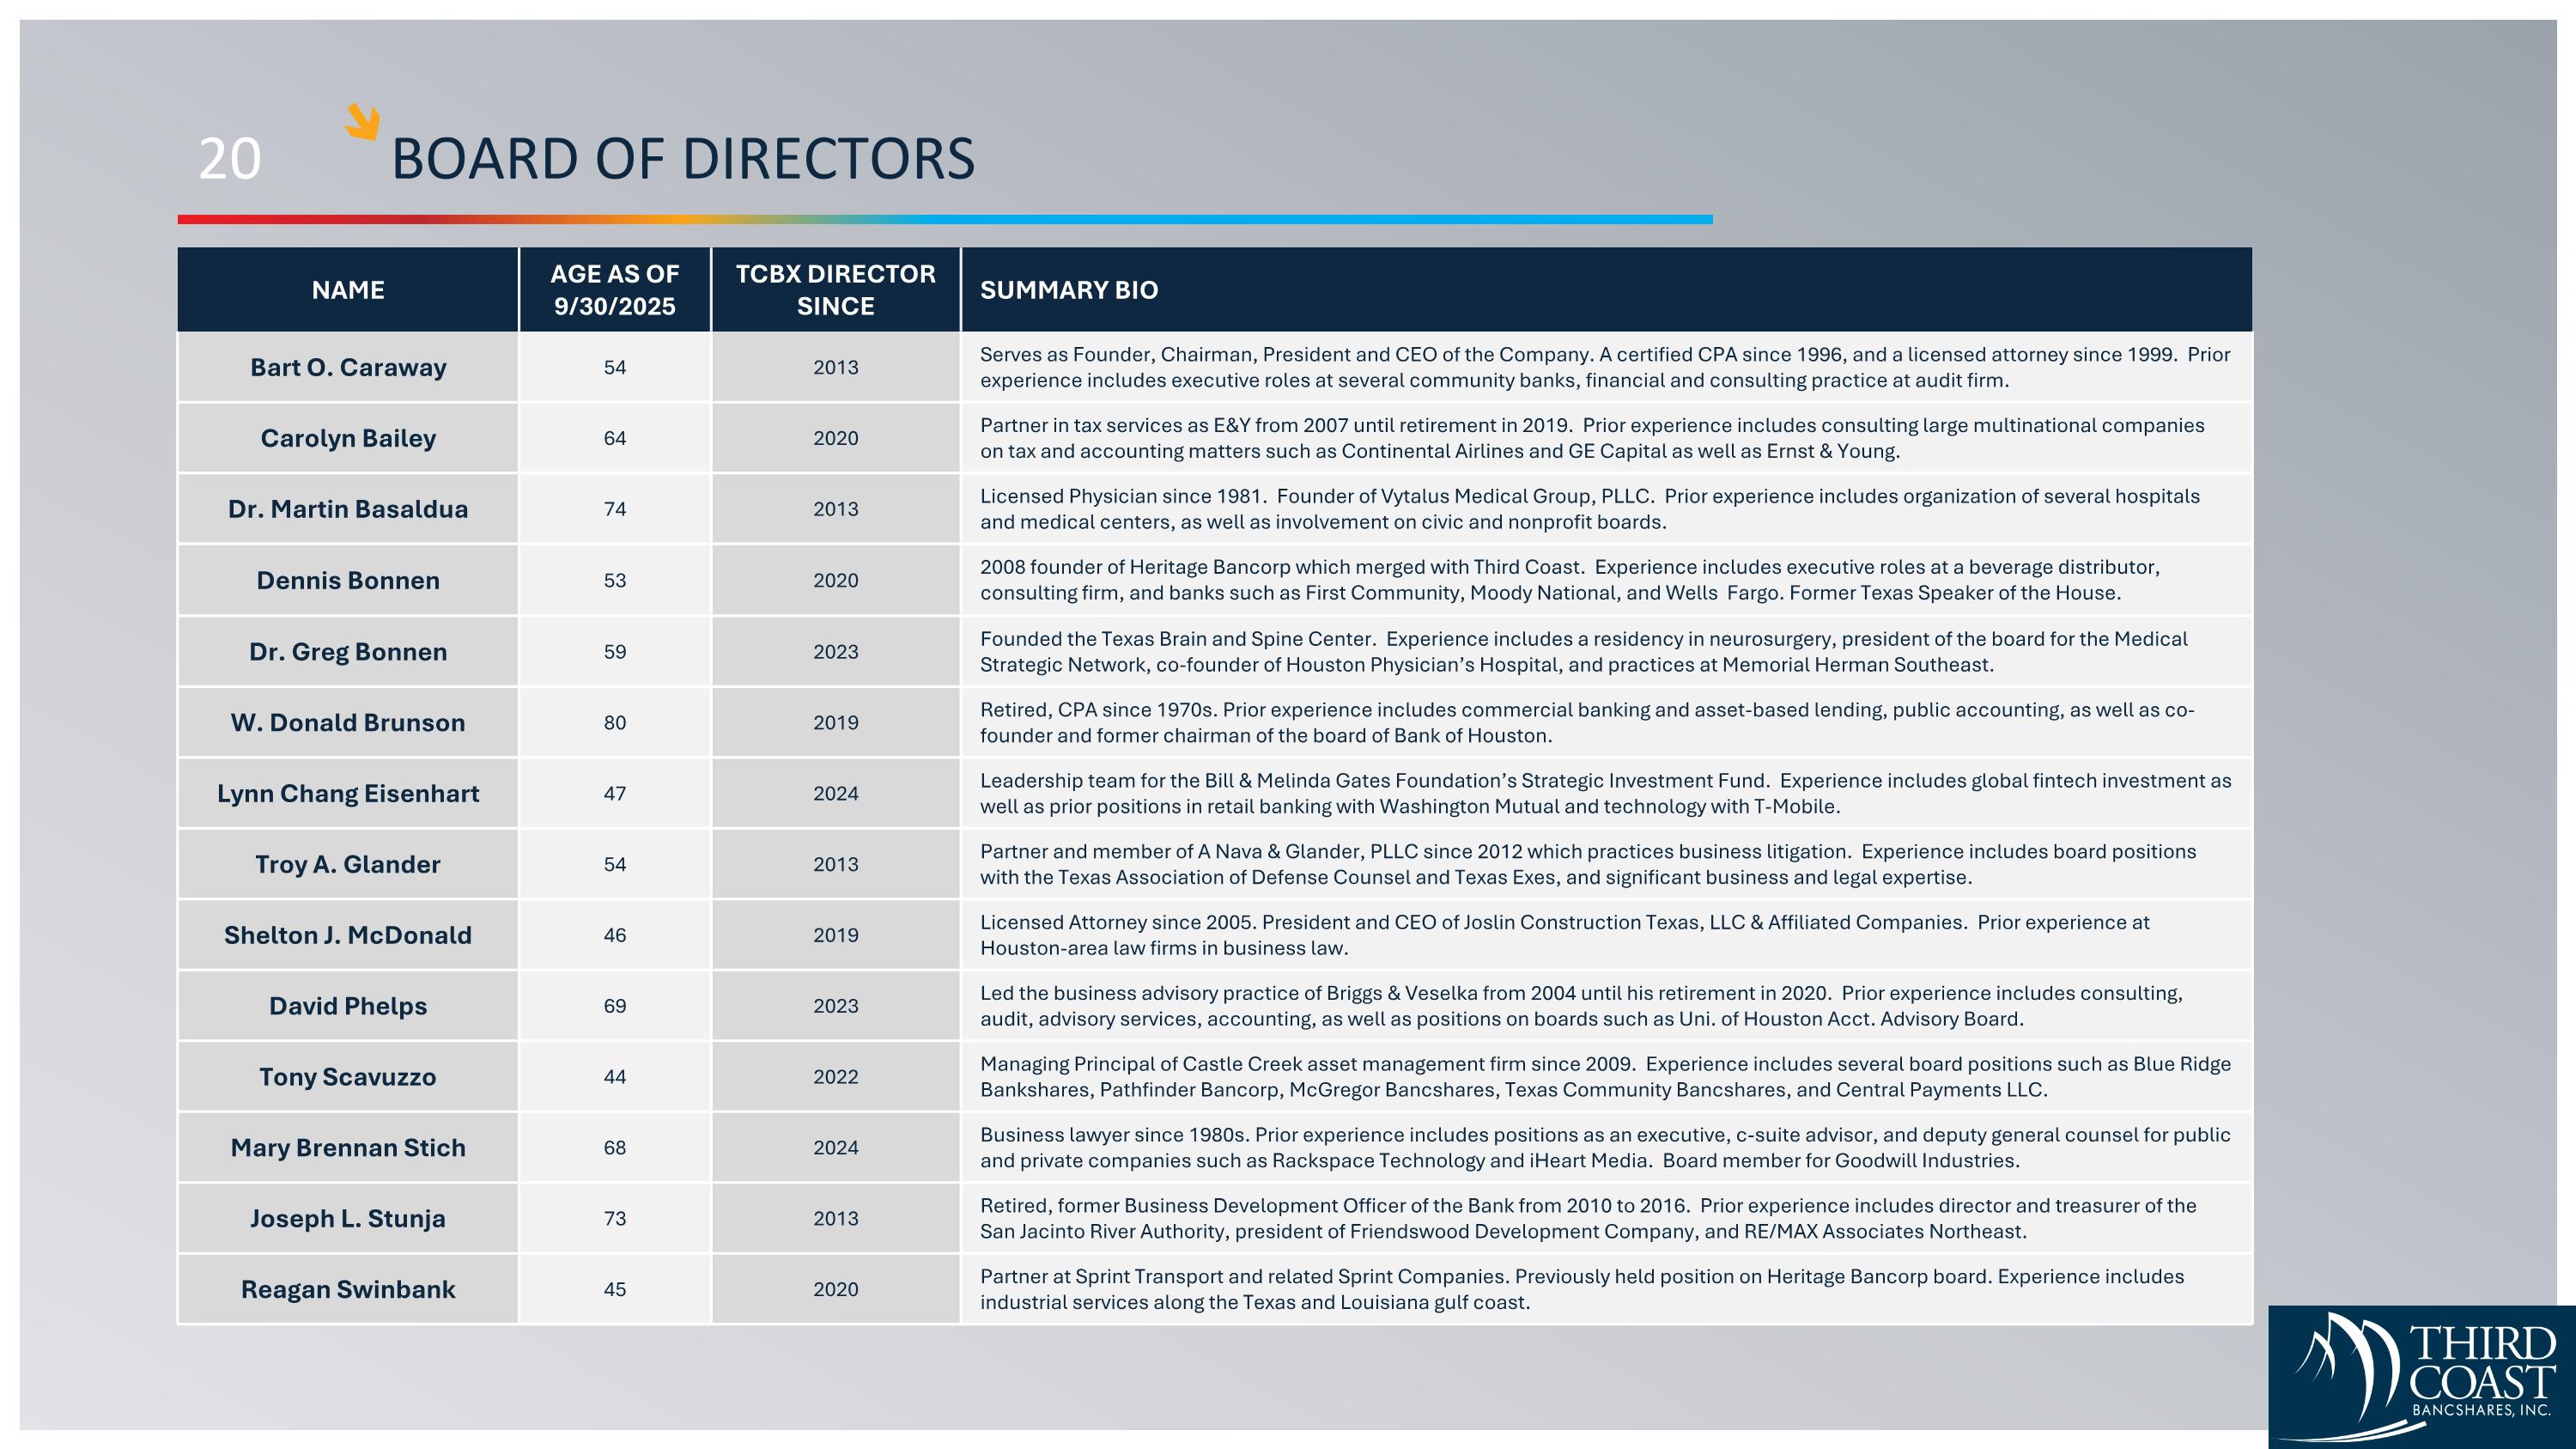
20 BOARD OF DIRECTORS NAME AGE AS OF 9/30/2025 TCBX DIRECTOR SINCE SUMMARY BIO Bart O. Caraway 54 2013 Serves as Founder, Chairman, President and CEO of the Company. A certified CPA since 1996, and a licensed attorney since 1999. Prior experience includes executive roles at several community banks, financial and consulting practice at audit firm. Carolyn Bailey 64 2020 Partner in tax services as E&Y from 2007 until retirement in 2019. Prior experience includes consulting large multinational companies on tax and accounting matters such as Continental Airlines and GE Capital as well as Ernst & Young. Dr. Martin Basaldua 74 2013 Licensed Physician since 1981. Founder of Vytalus Medical Group, PLLC. Prior experience includes organization of several hospitals and medical centers, as well as involvement on civic and nonprofit boards. Dennis Bonnen 53 2020 2008 founder of Heritage Bancorp which merged with Third Coast. Experience includes executive roles at a beverage distributor, consulting firm, and banks such as First Community, Moody National, and Wells Fargo. Former Texas Speaker of the House. Dr. Greg Bonnen 59 2023 Founded the Texas Brain and Spine Center. Experience includes a residency in neurosurgery, president of the board for the Medical Strategic Network, co-founder of Houston Physician’s Hospital, and practices at Memorial Herman Southeast. W. Donald Brunson 80 2019 Retired, CPA since 1970s. Prior experience includes commercial banking and asset-based lending, public accounting, as well as co-founder and former chairman of the board of Bank of Houston. Lynn Chang Eisenhart 47 2024 Leadership team for the Bill & Melinda Gates Foundation’s Strategic Investment Fund. Experience includes global fintech investment as well as prior positions in retail banking with Washington Mutual and technology with T-Mobile. Troy A. Glander 54 2013 Partner and member of A Nava & Glander, PLLC since 2012 which practices business litigation. Experience includes board positions with the Texas Association of Defense Counsel and Texas Exes, and significant business and legal expertise. Shelton J. McDonald 46 2019 Licensed Attorney since 2005. President and CEO of Joslin Construction Texas, LLC & Affiliated Companies. Prior experience at Houston-area law firms in business law. David Phelps 69 2023 Led the business advisory practice of Briggs & Veselka from 2004 until his retirement in 2020. Prior experience includes consulting, audit, advisory services, accounting, as well as positions on boards such as Uni. of Houston Acct. Advisory Board. Tony Scavuzzo 44 2022 Managing Principal of Castle Creek asset management firm since 2009. Experience includes several board positions such as Blue Ridge Bankshares, Pathfinder Bancorp, McGregor Bancshares, Texas Community Bancshares, and Central Payments LLC. Mary Brennan Stich 68 2024 Business lawyer since 1980s. Prior experience includes positions as an executive, c-suite advisor, and deputy general counsel for public and private companies such as Rackspace Technology and iHeart Media. Board member for Goodwill Industries. Joseph L. Stunja 73 2013 Retired, former Business Development Officer of the Bank from 2010 to 2016. Prior experience includes director and treasurer of the San Jacinto River Authority, president of Friendswood Development Company, and RE/MAX Associates Northeast. Reagan Swinbank 45 2020 Partner at Sprint Transport and related Sprint Companies. Previously held position on Heritage Bancorp board. Experience includes industrial services along the Texas and Louisiana gulf coast.
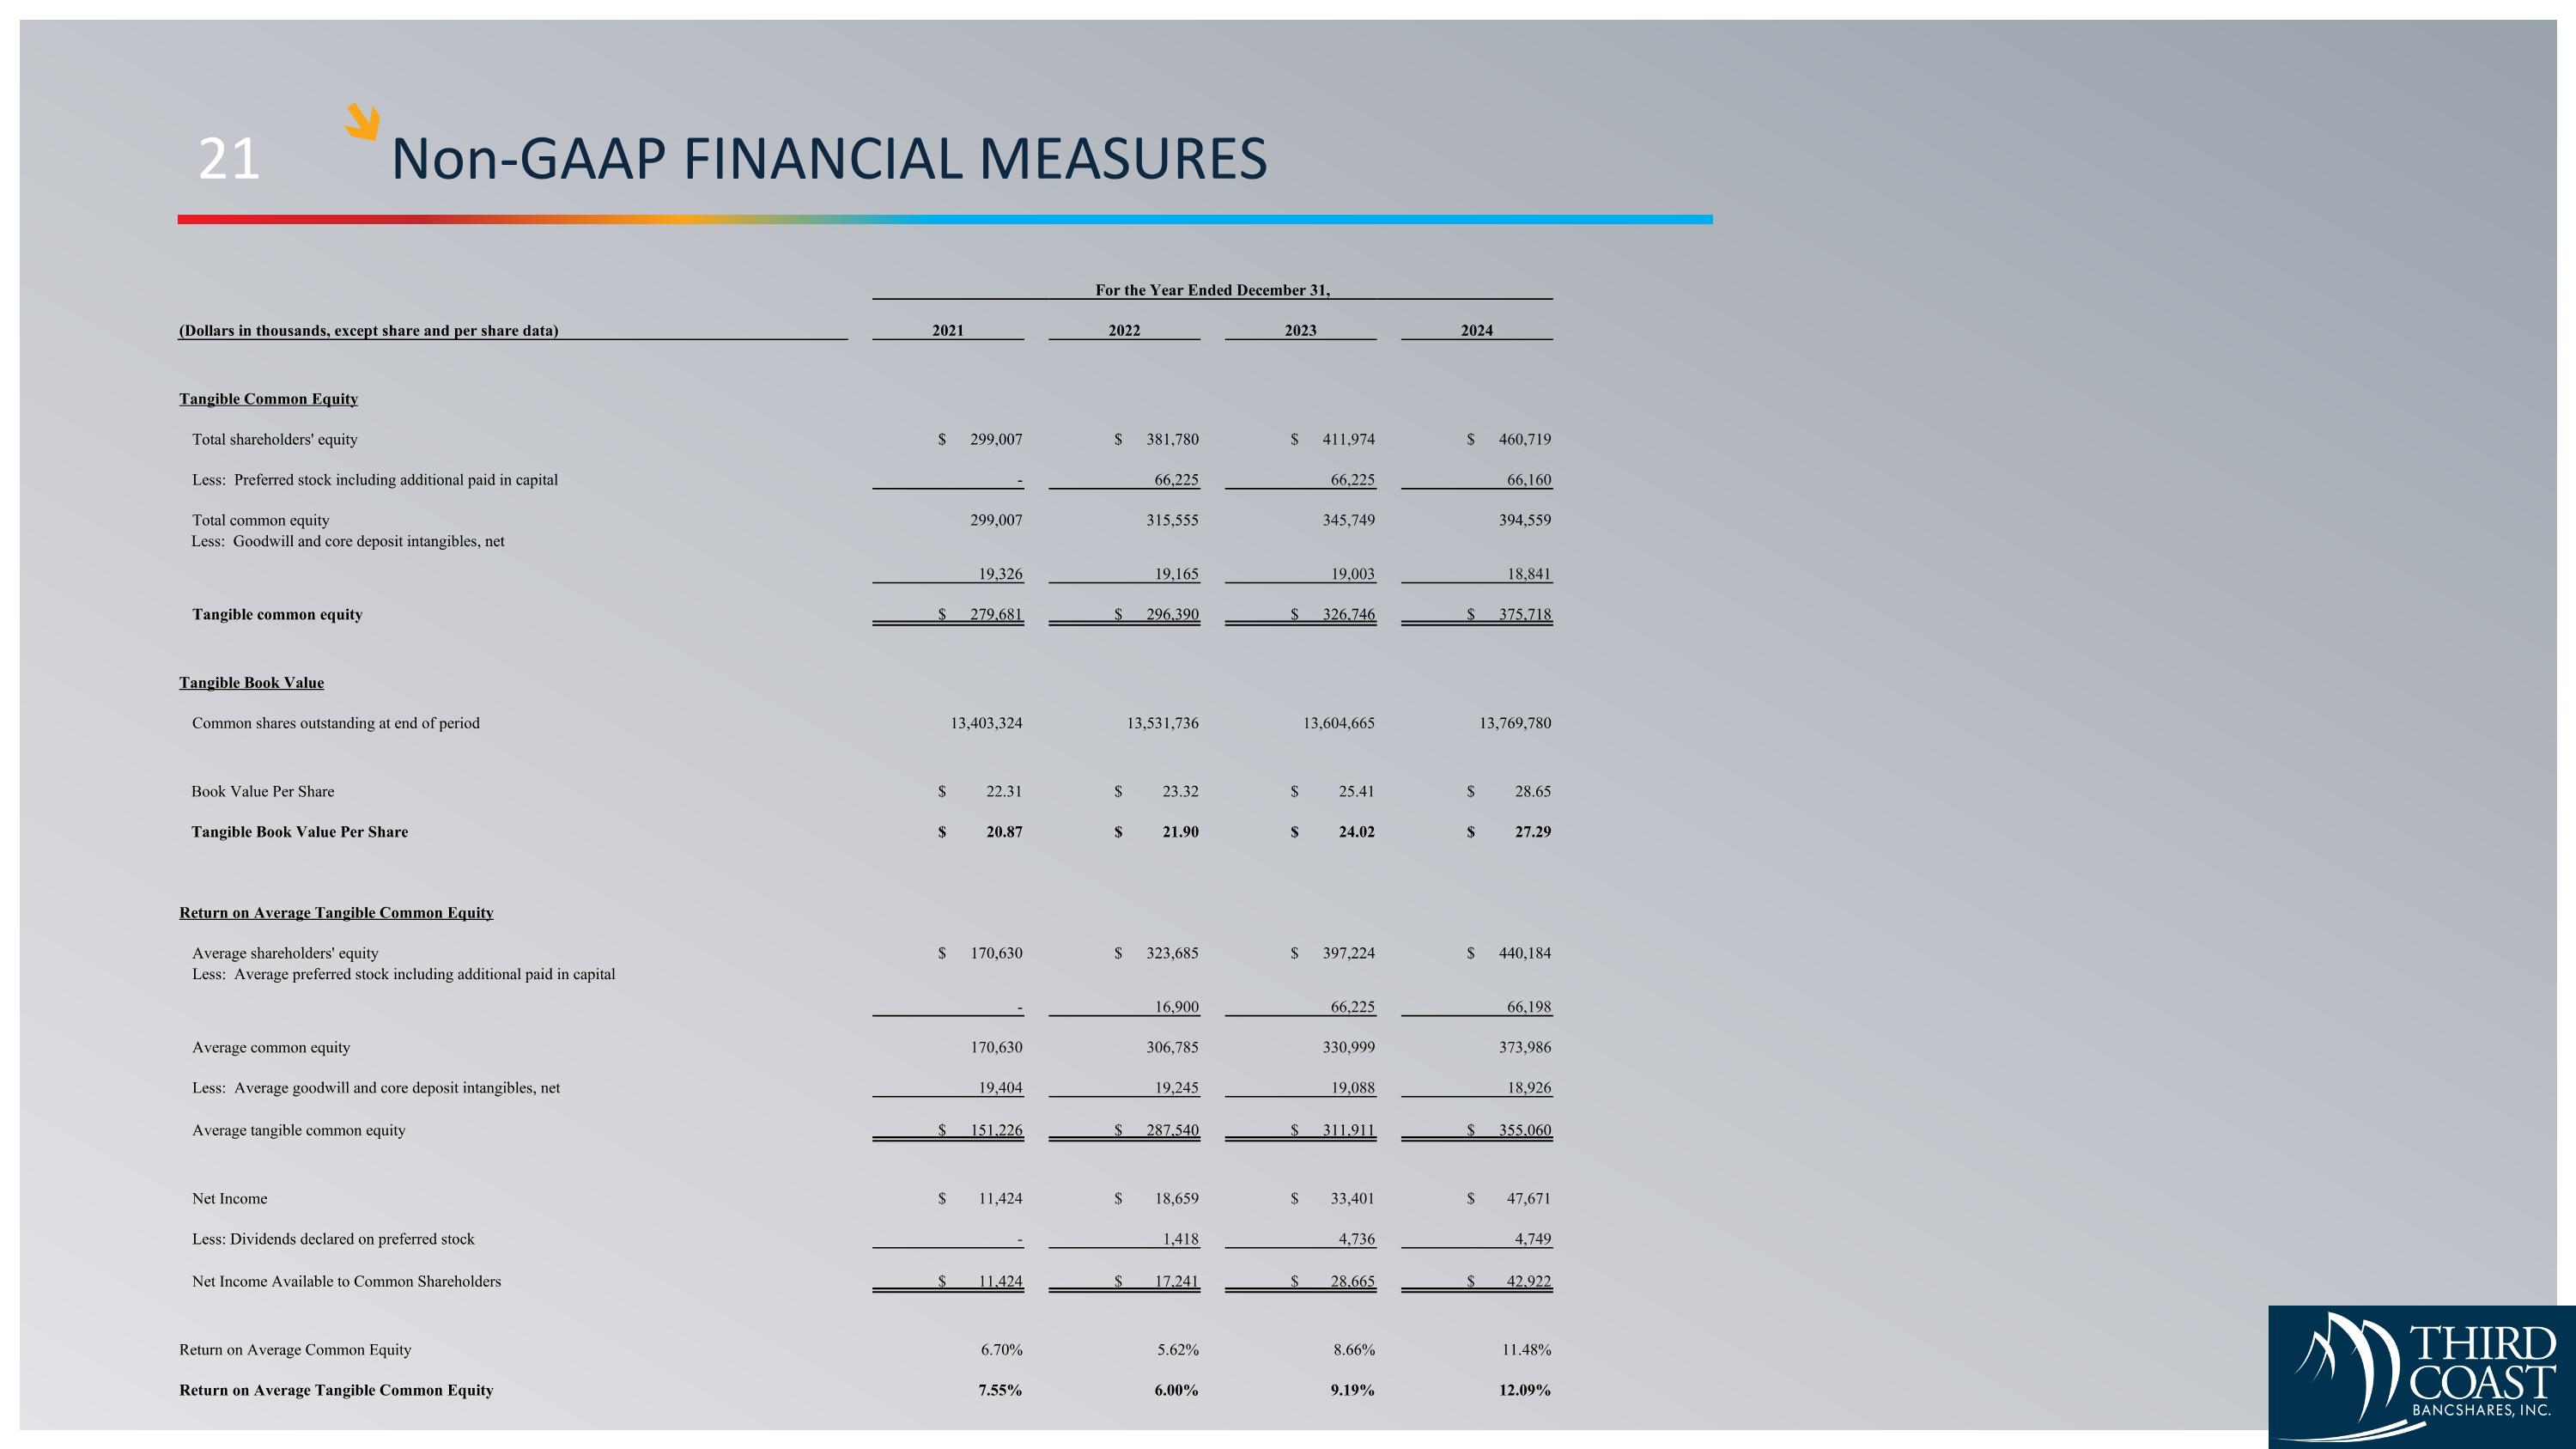
21 Non-GAAP FINANCIAL MEASURES For the Year Ended December 31, (Dollars in thousands, except share and per share data) 2021 2022 2023 2024 Tangible Common Equity Total shareholders' equity $ 299,007 $ 381,780 $ 411,974 $ 460,719 Less: Preferred stock including additional paid in capital - 66,225 66,225 66,160 Total common equity 299,007 315,555 345,749 394,559 Less: Goodwill and core deposit intangibles, net 19,326 19,165 19,003 18,841 Tangible common equity $ 279,681 $ 296,390 $ 326,746 $ 375,718 Tangible Book Value Common shares outstanding at end of period 13,403,324 13,531,736 13,604,665 13,769,780 Book Value Per Share $ 22.31 $ 23.32 $ 25.41 $ 28.65 Tangible Book Value Per Share $ 20.87 $ 21.90 $ 24.02 $ 27.29 Return on Average Tangible Common Equity Average shareholders' equity $ 170,630 $ 323,685 $ 397,224 $ 440,184 Less: Average preferred stock including additional paid in capital - 16,900 66,225 66,198 Average common equity 170,630 306,785 330,999 373,986 Less: Average goodwill and core deposit intangibles, net 19,404 19,245 19,088 18,926 Average tangible common equity $ 151,226 $ 287,540 $ 311,911 $ 355,060 Net Income $ 11,424 $ 18,659 $ 33,401 $ 47,671 Less: Dividends declared on preferred stock - 1,418 4,736 4,749 Net Income Available to Common Shareholders $ 11,424 $ 17,241 $ 28,665 $ 42,922 Return on Average Common Equity 6.70% 5.62% 8.66% 11.48% Return on Average Tangible Common Equity 7.55% 6.00% 9.19% 12.09%
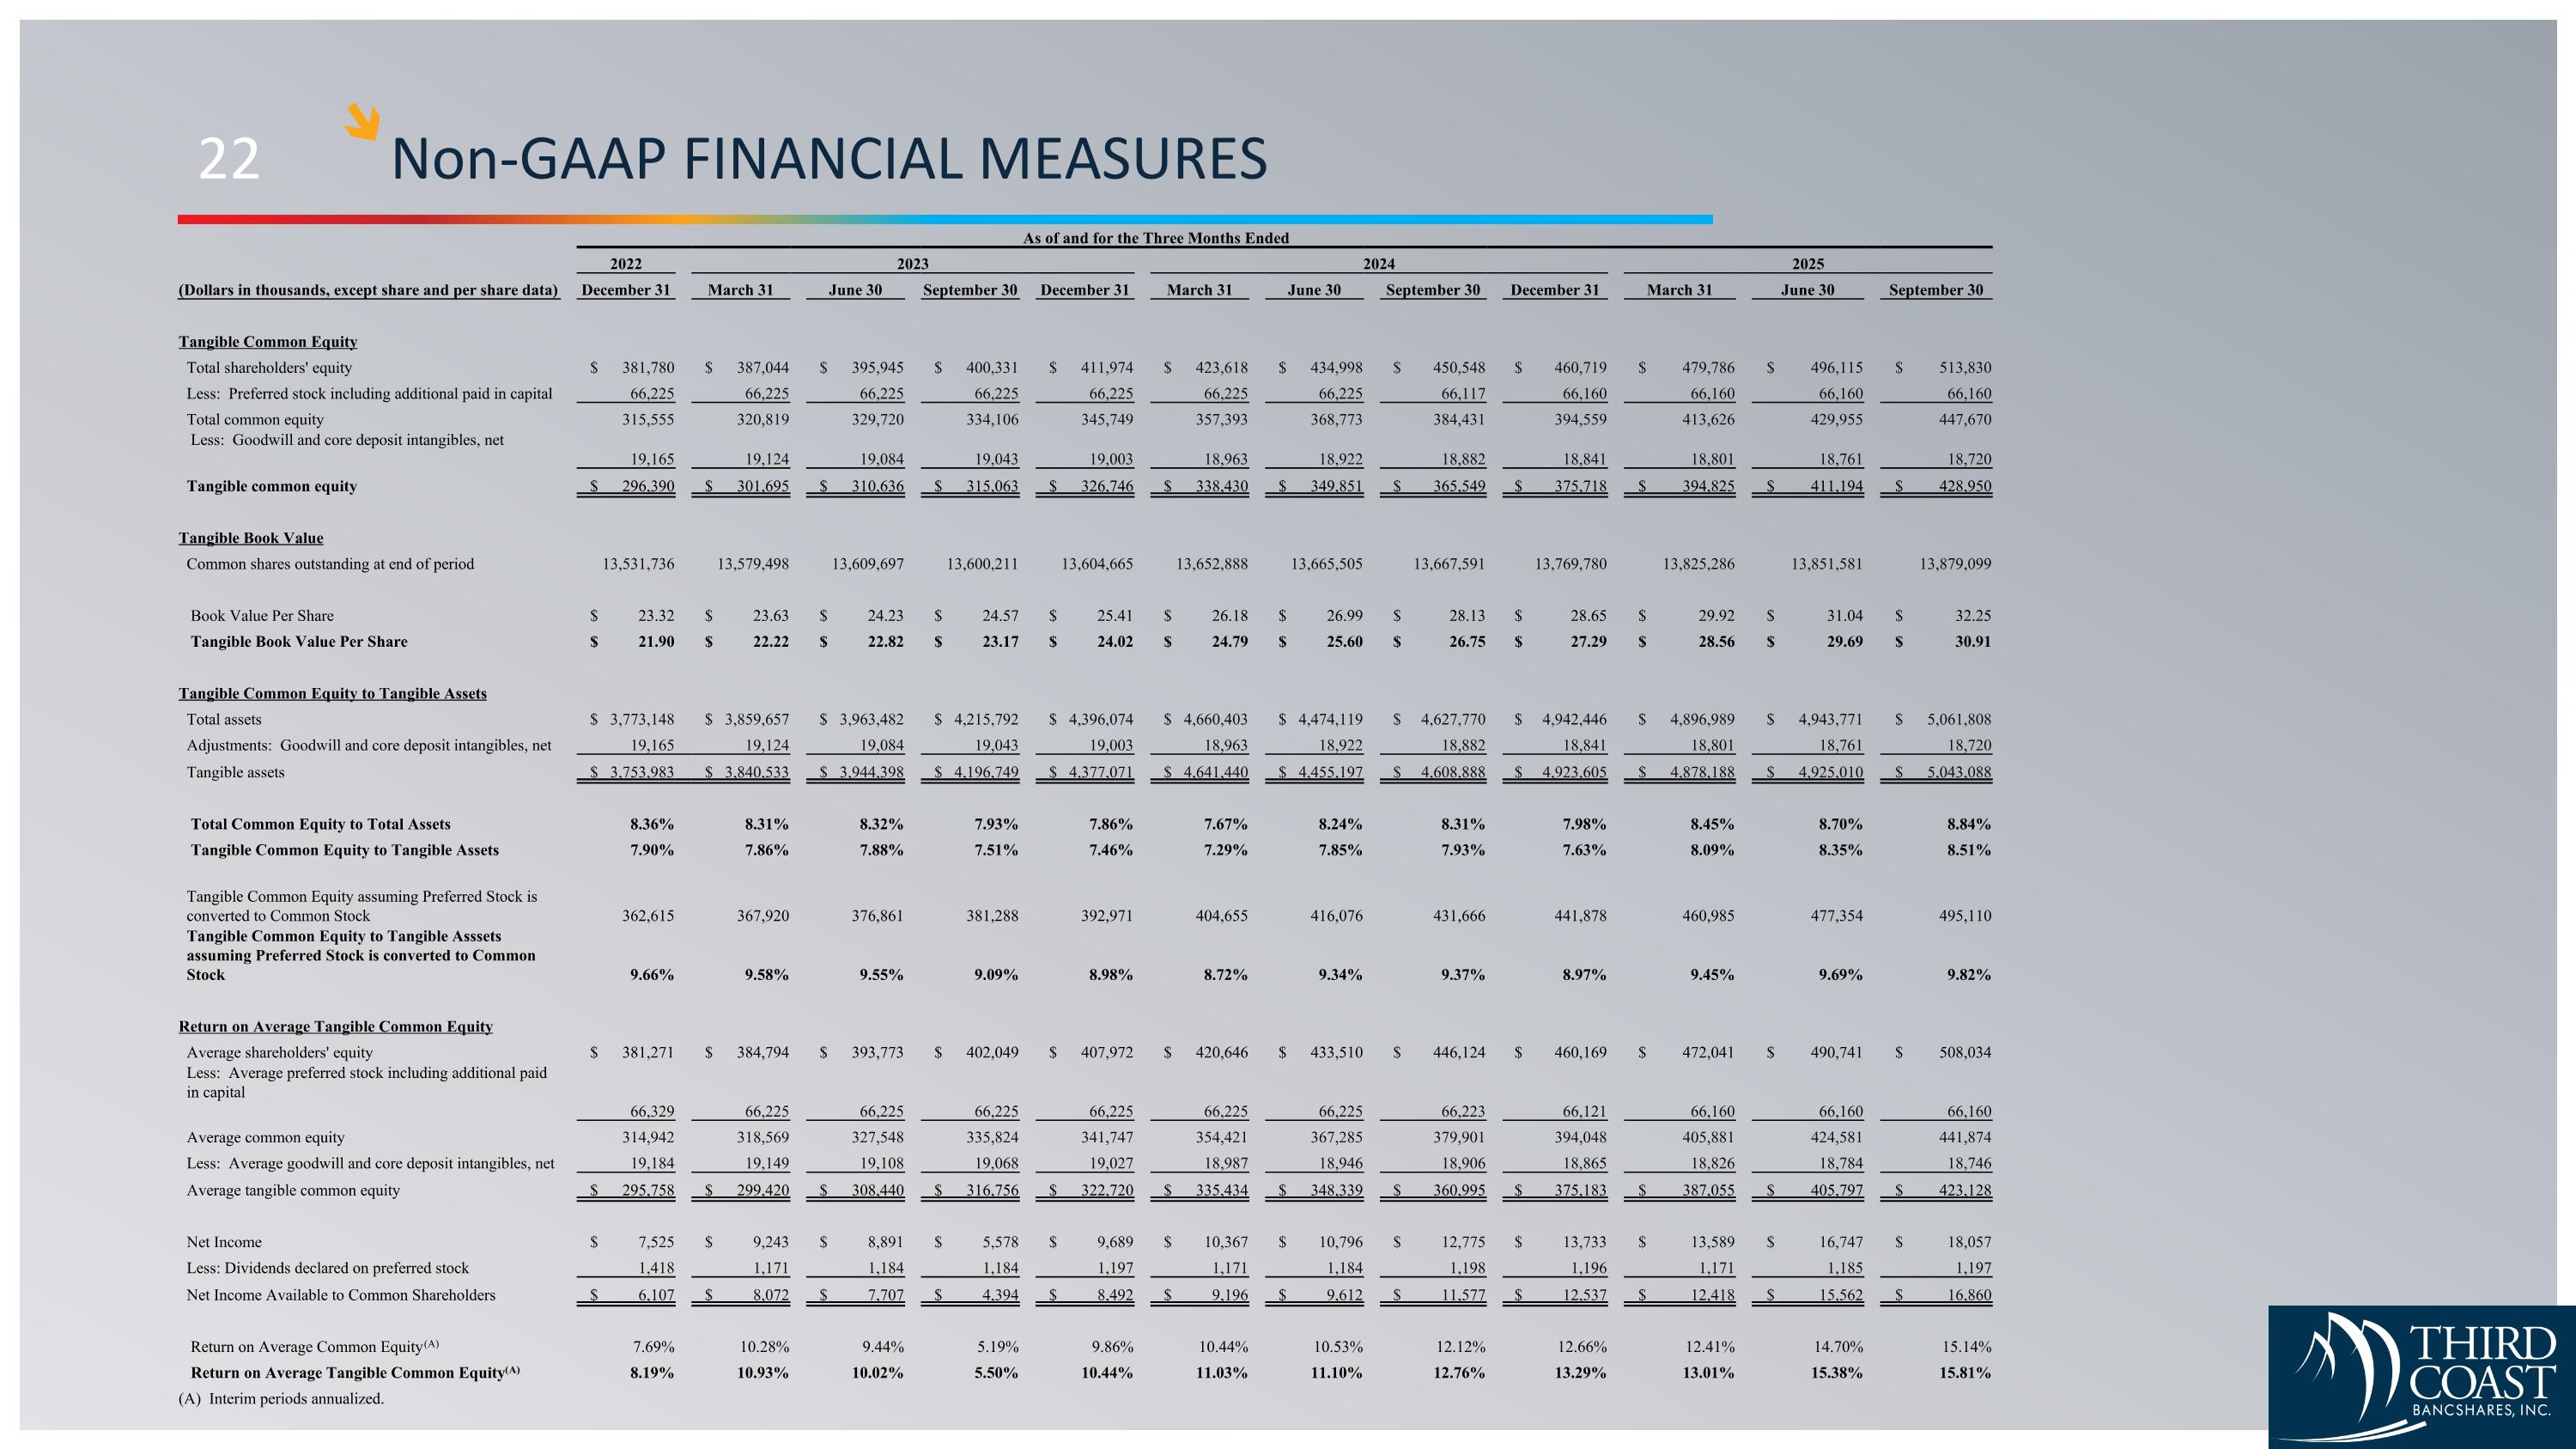
22 Non-GAAP FINANCIAL MEASURES As of and for the Three Months Ended 2022 2023 2024 2025 (Dollars in thousands, except share and per share data) December 31 March 31 June 30 September 30 December 31 March 31 June 30 September 30 December 31 March 31 June 30 September 30 Tangible Common Equity Total shareholders' equity $ 381,780 $ 387,044 $ 395,945 $ 400,331 $ 411,974 $ 423,618 $ 434,998 $ 450,548 $ 460,719 $ 479,786 $ 496,115 $ 513,830 Less: Preferred stock including additional paid in capital 66,225 66,225 66,225 66,225 66,225 66,225 66,225 66,117 66,160 66,160 66,160 66,160 Total common equity 315,555 320,819 329,720 334,106 345,749 357,393 368,773 384,431 394,559 413,626 429,955 447,670 Less: Goodwill and core deposit intangibles, net 19,165 19,124 19,084 19,043 19,003 18,963 18,922 18,882 18,841 18,801 18,761 18,720 Tangible common equity $ 296,390 $ 301,695 $ 310,636 $ 315,063 $ 326,746 $ 338,430 $ 349,851 $ 365,549 $ 375,718 $ 394,825 $ 411,194 $ 428,950 Tangible Book Value Common shares outstanding at end of period 13,531,736 13,579,498 13,609,697 13,600,211 13,604,665 13,652,888 13,665,505 13,667,591 13,769,780 13,825,286 13,851,581 13,879,099 Book Value Per Share $ 23.32 $ 23.63 $ 24.23 $ 24.57 $ 25.41 $ 26.18 $ 26.99 $ 28.13 $ 28.65 $ 29.92 $ 31.04 $ 32.25 Tangible Book Value Per Share $ 21.90 $ 22.22 $ 22.82 $ 23.17 $ 24.02 $ 24.79 $ 25.60 $ 26.75 $ 27.29 $ 28.56 $ 29.69 $ 30.91 Tangible Common Equity to Tangible Assets Total assets $ 3,773,148 $ 3,859,657 $ 3,963,482 $ 4,215,792 $ 4,396,074 $ 4,660,403 $ 4,474,119 $ 4,627,770 $ 4,942,446 $ 4,896,989 $ 4,943,771 $ 5,061,808 Adjustments: Goodwill and core deposit intangibles, net 19,165 19,124 19,084 19,043 19,003 18,963 18,922 18,882 18,841 18,801 18,761 18,720 Tangible assets $ 3,753,983 $ 3,840,533 $ 3,944,398 $ 4,196,749 $ 4,377,071 $ 4,641,440 $ 4,455,197 $ 4,608,888 $ 4,923,605 $ 4,878,188 $ 4,925,010 $ 5,043,088 Total Common Equity to Total Assets 8.36% 8.31% 8.32% 7.93% 7.86% 7.67% 8.24% 8.31% 7.98% 8.45% 8.70% 8.84% Tangible Common Equity to Tangible Assets 7.90% 7.86% 7.88% 7.51% 7.46% 7.29% 7.85% 7.93% 7.63% 8.09% 8.35% 8.51% Tangible Common Equity assuming Preferred Stock is converted to Common Stock 362,615 367,920 376,861 381,288 392,971 404,655 416,076 431,666 441,878 460,985 477,354 495,110 Tangible Common Equity to Tangible Asssets assuming Preferred Stock is converted to Common Stock 9.66% 9.58% 9.55% 9.09% 8.98% 8.72% 9.34% 9.37% 8.97% 9.45% 9.69% 9.82% Return on Average Tangible Common Equity Average shareholders' equity $ 381,271 $ 384,794 $ 393,773 $ 402,049 $ 407,972 $ 420,646 $ 433,510 $ 446,124 $ 460,169 $ 472,041 $ 490,741 $ 508,034 Less: Average preferred stock including additional paid in capital 66,329 66,225 66,225 66,225 66,225 66,225 66,225 66,223 66,121 66,160 66,160 66,160 Average common equity 314,942 318,569 327,548 335,824 341,747 354,421 367,285 379,901 394,048 405,881 424,581 441,874 Less: Average goodwill and core deposit intangibles, net 19,184 19,149 19,108 19,068 19,027 18,987 18,946 18,906 18,865 18,826 18,784 18,746 Average tangible common equity $ 295,758 $ 299,420 $ 308,440 $ 316,756 $ 322,720 $ 335,434 $ 348,339 $ 360,995 $ 375,183 $ 387,055 $ 405,797 $ 423,128 Net Income $ 7,525 $ 9,243 $ 8,891 $ 5,578 $ 9,689 $ 10,367 $ 10,796 $ 12,775 $ 13,733 $ 13,589 $ 16,747 $ 18,057 Less: Dividends declared on preferred stock 1,418 1,171 1,184 1,184 1,197 1,171 1,184 1,198 1,196 1,171 1,185 1,197 Net Income Available to Common Shareholders $ 6,107 $ 8,072 $ 7,707 $ 4,394 $ 8,492 $ 9,196 $ 9,612 $ 11,577 $ 12,537 $ 12,418 $ 15,562 $ 16,860 Return on Average Common Equity(A) 7.69% 10.28% 9.44% 5.19% 9.86% 10.44% 10.53% 12.12% 12.66% 12.41% 14.70% 15.14% Return on Average Tangible Common Equity(A) 8.19% 10.93% 10.02% 5.50% 10.44% 11.03% 11.10% 12.76% 13.29% 13.01% 15.38% 15.81% (A) Interim periods annualized.
THIRD COAST BANCSHARES, INC. NYSE & NYSE Texas: TCBX Thank you. © 2025 Third Coast Bancshares, Inc.