
Exhibit 99.2 Investor Presentation Third Quarter 2025
Cautionary Note Regarding Forward-Looking Statements This presentation contains “forward-looking statements” within the meaning of the U.S. Private Securities Litigation Reform Act of 1995, including without limitation those regarding Popular’s business, financial condition, results of operations and objectives, performance, earnings and expenses. These statements are not guarantees of future performance, are based on the current expectations of Popular, Inc.’s management and, by their nature, involve risks, uncertainties, estimates and assumptions. Potential factors, some of which are beyond our control, could cause actual results to differ materially from those expressed in, or implied by, such forward-looking statements. More information on the risks and important factors that could affect our future results and financial condition is included in our Form 10-K for the year ended December 31, 2024, our Form 10-Q for the quarter ended June 30, 2025 and our Form 10-Q for the quarter ended September 30, 2025, to be filed with the Securities and Exchange Commission. Our filings are available on our website (www.popular.com) and on the Securities and Exchange Commission website (www.sec.gov). We assume no obligation to update or revise any forward-looking statements which speak as of their respective dates. 2
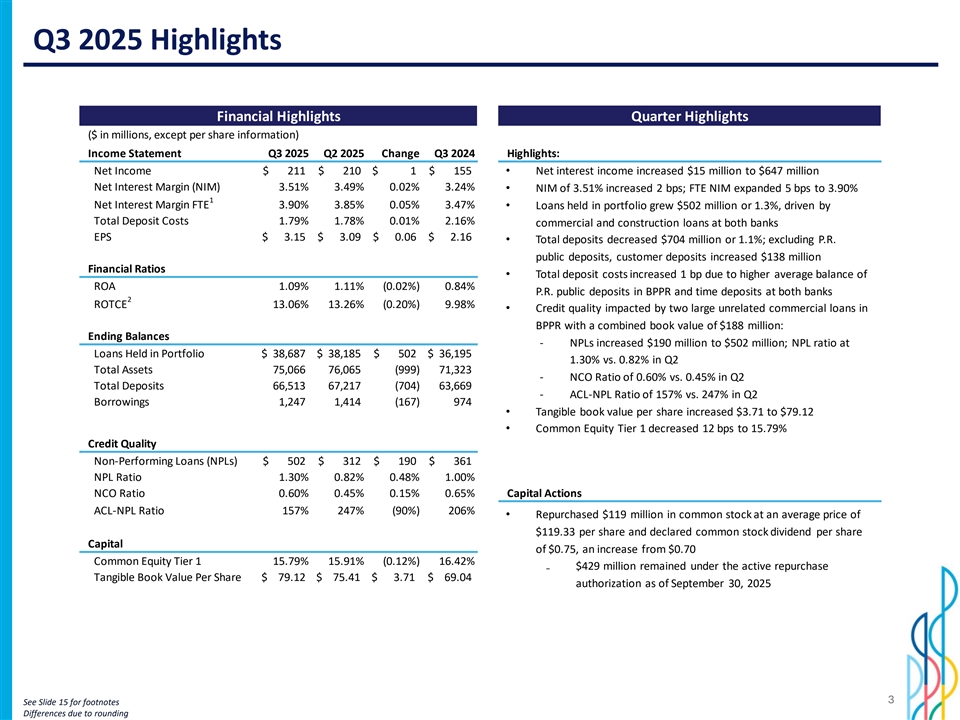
Q3 2025 Highlights Financial Highlights Quarter Highlights ($ in millions, except per share information) Income Statement Q3 2025 Q2 2025 Change Q3 2024 Highlights: Net Income $ 211 $ 210 $ 1 $ 155 • Net interest income increased $15 million to $647 million Net Interest Margin (NIM) 3.51% 3.49% 0.02% 3.24% • NIM of 3.51% increased 2 bps; FTE NIM expanded 5 bps to 3.90% 1 Net Interest Margin FTE 3.90% 3.85% 0.05% 3.47%• Loans held in portfolio grew $502 million or 1.3%, driven by Total Deposit Costs 1.79% 1.78% 0.01% 2.16% commercial and construction loans at both banks EPS $ 3 .15 $ 3.09 $ 0 .06 $ 2.16 • Total deposits decreased $704 million or 1.1%; excluding P.R. public deposits, customer deposits increased $138 million Financial Ratios • Total deposit costs increased 1 bp due to higher average balance of ROA 1.09% 1.11% (0.02%) 0.84% P.R. public deposits in BPPR and time deposits at both banks 2 ROTCE 13.06% 13.26% (0.20%) 9.98% • Credit quality impacted by two large unrelated commercial loans in BPPR with a combined book value of $188 million: Ending Balances ‐ NPLs increased $190 million to $502 million; NPL ratio at Loans Held in Portfolio $ 3 8,687 $ 38,185 $ 502 $ 3 6,195 1.30% vs. 0.82% in Q2 Total Assets 75,066 76,065 ( 999) 7 1,323 ‐ NCO Ratio of 0.60% vs. 0.45% in Q2 Total Deposits 6 6,513 6 7,217 (704) 63,669 ‐ ACL-NPL Ratio of 157% vs. 247% in Q2 Borrowings 1,247 1,414 (167) 974 • Tangible book value per share increased $3.71 to $79.12 • Common Equity Tier 1 decreased 12 bps to 15.79% Credit Quality Non-Performing Loans (NPLs) $ 502 $ 312 $ 190 $ 361 NPL Ratio 1.30% 0.82% 0.48% 1.00% NCO Ratio 0.60% 0.45% 0.15% 0.65% Capital Actions ACL-NPL Ratio 157% 247% (90%) 206% • Repurchased $119 million in common stock at an average price of $119.33 per share and declared common stock dividend per share Capital of $0.75, an increase from $0.70 Common Equity Tier 1 15.79% 15.91% (0.12%) 16.42% ₋ $429 million remained under the active repurchase Tangible Book Value Per Share $ 7 9.12 $ 75.41 $ 3.71 $ 69.04 authorization as of September 30, 2025 3 See Slide 15 for footnotes Differences due to rounding
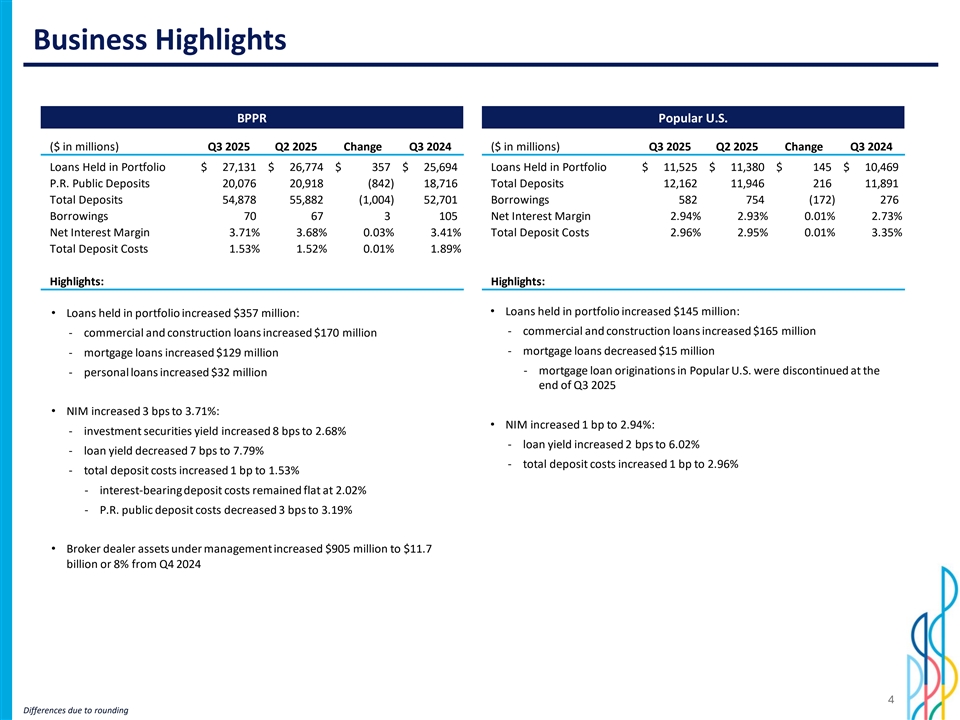
Business Highlights BPPR Popular U.S. ($ in millions) Q3 2025 Q2 2025 Change Q3 2024 ($ in millions) Q3 2025 Q2 2025 Change Q3 2024 Loans Held in Portfolio $ 27,131 $ 26,774 $ 357 $ 25,694 Loans Held in Portfolio $ 11,525 $ 11,380 $ 145 $ 10,469 P.R. Public Deposits 20,076 20,918 (842) 18,716 Total Deposits 12,162 11,946 216 11,891 Total Deposits 54,878 55,882 (1,004) 52,701 Borrowings 582 754 (172) 276 Borrowings 70 67 3 105 Net Interest Margin 2.94% 2.93% 0.01% 2.73% Net Interest Margin 3.71% 3.68% 0.03% 3.41% Total Deposit Costs 2.96% 2.95% 0.01% 3.35% Total Deposit Costs 1.53% 1.52% 0.01% 1.89% Highlights: Highlights: • Loans held in portfolio increased $145 million: • Loans held in portfolio increased $357 million: ‐ commercial and construction loans increased $165 million ‐ commercial and construction loans increased $170 million ‐ mortgage loans decreased $15 million ‐ mortgage loans increased $129 million ‐ mortgage loan originations in Popular U.S. were discontinued at the ‐ personal loans increased $32 million end of Q3 2025 • NIM increased 3 bps to 3.71%: • NIM increased 1 bp to 2.94%: ‐ investment securities yield increased 8 bps to 2.68% ‐ loan yield increased 2 bps to 6.02% ‐ loan yield decreased 7 bps to 7.79% ‐ total deposit costs increased 1 bp to 2.96% ‐ total deposit costs increased 1 bp to 1.53% ‐ interest-bearing deposit costs remained flat at 2.02% ‐ P.R. public deposit costs decreased 3 bps to 3.19% • Broker dealer assets under management increased $905 million to $11.7 billion or 8% from Q4 2024 4 Differences due to rounding
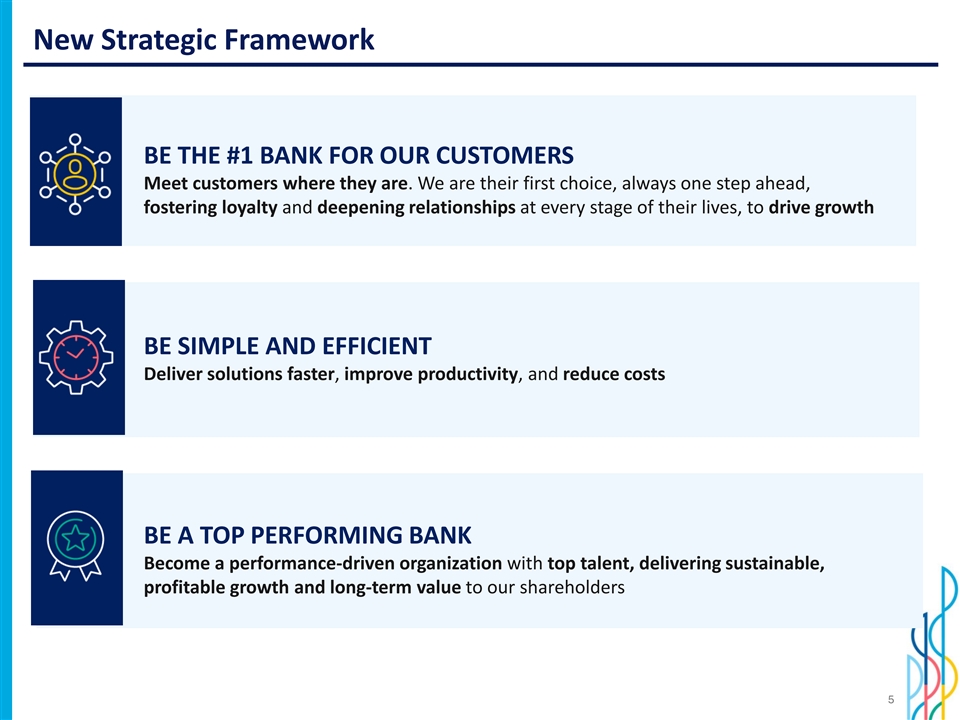
New Strategic Framework BE THE #1 BANK FOR OUR CUSTOMERS Meet customers where they are. We are their first choice, always one step ahead, fostering loyalty and deepening relationships at every stage of their lives, to drive growth BE SIMPLE AND EFFICIENT Deliver solutions faster, improve productivity, and reduce costs BE A TOP PERFORMING BANK Become a performance-driven organization with top talent, delivering sustainable, profitable growth and long-term value to our shareholders 5
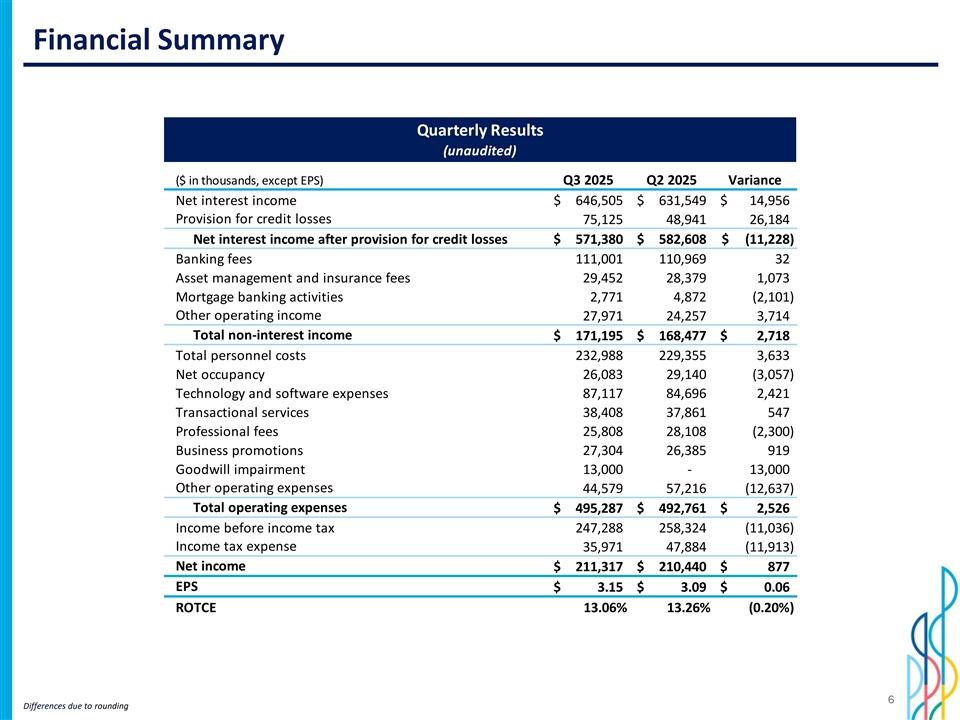
Financial Summary Quarterly Results (unaudited) ($ in thousands, except EPS) Q3 2025 Q2 2025 Variance Net interest income $ 646,505 $ 6 31,549 $ 1 4,956 Provision for credit losses 7 5,125 48,941 2 6,184 Net interest income after provision for credit losses $ 571,380 $ 582,608 $ (11,228) Banking fees 1 11,001 110,969 32 Asset management and insurance fees 29,452 2 8,379 1 ,073 Mortgage banking activities 2 ,771 4 ,872 (2,101) Other operating income 2 7,971 24,257 3,714 Total non-interest income $ 171,195 $ 168,477 $ 2,718 Total personnel costs 2 32,988 229,355 3 ,633 Net occupancy 2 6,083 29,140 (3,057) Technology and software expenses 87,117 84,696 2 ,421 Transactional services 38,408 37,861 547 Professional fees 25,808 2 8,108 (2,300) Business promotions 2 7,304 26,385 919 Goodwill impairment 13,000 - 1 3,000 Other operating expenses 4 4,579 57,216 (12,637) Total operating expenses $ 495,287 $ 492,761 $ 2,526 Income before income tax 247,288 2 58,324 (11,036) Income tax expense 35,971 47,884 (11,913) Net income $ 211,317 $ 210,440 $ 877 EPS $ 3 .15 $ 3.09 $ 0 .06 ROTCE 13.06% 13.26% (0.20%) 6 Differences due to rounding
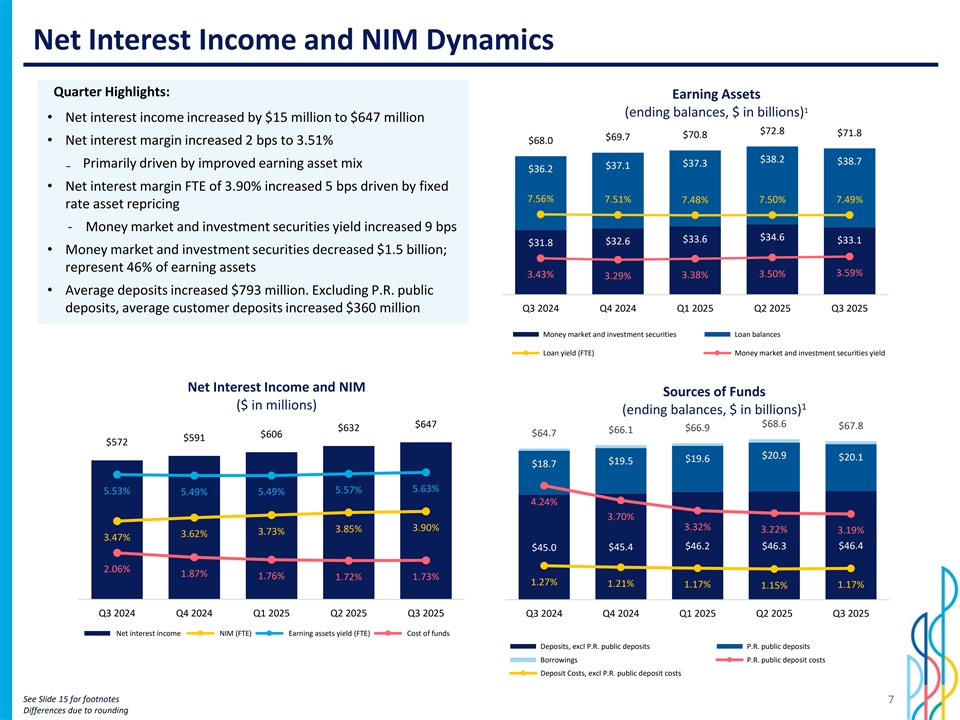
Net Interest Income and NIM Dynamics Quarter Highlights: Earning Assets 1 (ending balances, $ in billions) • Net interest income increased by $15 million to $647 million $72.8 $71.8 $70.8 $69.7 $68.0 • Net interest margin increased 2 bps to 3.51% 0.1 4 70.0 0 $38.2 $38.7 $37.3 ₋ Primarily driven by improved earning asset mix 0.1 2 $37.1 $36.2 60.0 0 0.1 • Net interest margin FTE of 3.90% increased 5 bps driven by fixed 50.0 0 7.56% 7.51% 7.50% 7.49% 7.48% rate asset repricing 0.0 8 40.0 0 ‐ Money market and investment securities yield increased 9 bps 0.0 6 30.0 0 $34.6 $33.6 $33.1 $32.6 $31.8 0.0 4 • Money market and investment securities decreased $1.5 billion; 20.0 0 represent 46% of earning assets 10.0 0 0.0 2 3.59% 3.50% 3.43% 3.38% 3.29% • Average deposits increased $793 million. Excluding P.R. public - 0 deposits, average customer deposits increased $360 million Q3 2024 Q4 2024 Q1 2025 Q2 2025 Q3 2025 Money market and investment securities Loan balances Loan yield (FTE) Money market and investment securities yield Net Interest Income and NIM Sources of Funds ($ in millions) 1 (ending balances, $ in billions) $647 $68.6 $67.8 $632 $66.9 $66.1 $64.7 $606 0.06 00 $591 0.0 7 $572 600 $20.9 60.0 0 $20.1 $19.6 $19.5 0.0 6 $18.7 0.05 00 500 50.0 0 0.0 5 5.63% 5.57% 0.04 00 5.53% 5.49% 5.49% 400 4.24% 40.0 0 0.0 4 3.70% 0.03 00 300 3.90% 30.0 0 3.32% 3.85% 0.0 3 3.22% 3.19% 3.73% 3.62% 3.47% 0.02 00 $46.2 $46.3 $46.4 $45.0 $45.4 200 20.0 0 0.0 2 2.06% 0.01 00 100 1.87% 0.0 1 10.0 0 1.76% 1.72% 1.73% 1.27% 1.21% 1.17% 1.17% 1.15% - 0 - - Q3 2024 Q4 2024 Q1 2025 Q2 2025 Q3 2025 Q3 2024 Q4 2024 Q1 2025 Q2 2025 Q3 2025 Net interest income NIM (FTE) Earning assets yield (FTE) Cost of funds Deposits, excl P.R. public deposits P.R. public deposits Borrowings P.R. public deposit costs Deposit Costs, excl P.R. public deposit costs See Slide 15 for footnotes 7 Differences due to rounding
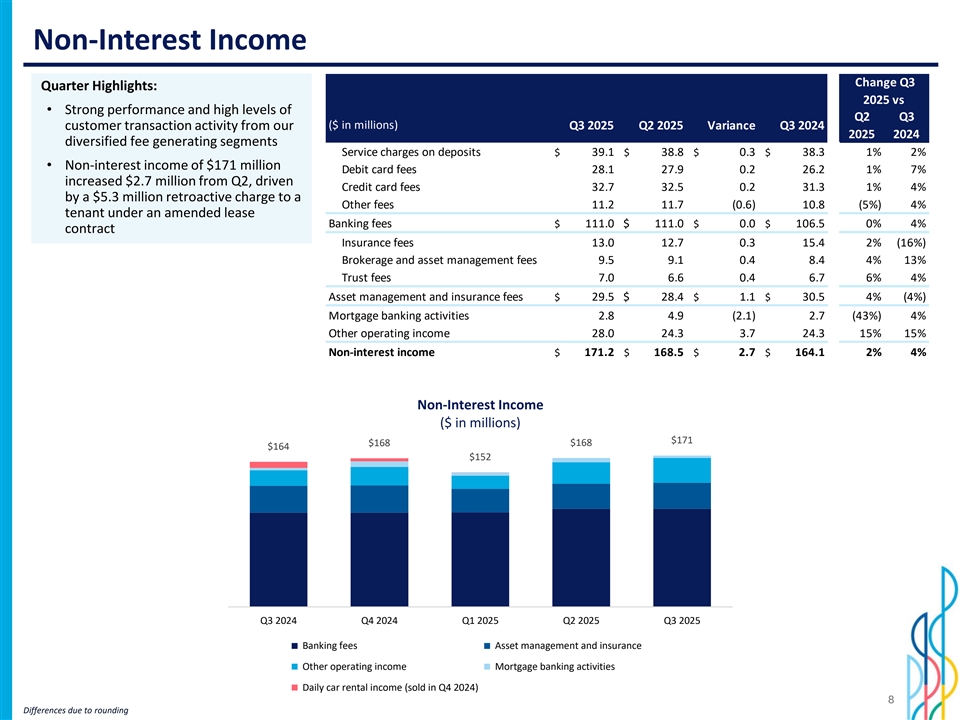
Non-Interest Income Change Q3 Quarter Highlights: 2025 vs • Strong performance and high levels of Q2 Q3 ($ in millions) Q3 2025 Q2 2025 Variance Q3 2024 customer transaction activity from our 2025 2024 diversified fee generating segments Service charges on deposits $ 39.1 $ 38.8 $ 0.3 $ 38.3 1% 2% • Non-interest income of $171 million Debit card fees 28.1 27.9 0.2 26.2 1% 7% increased $2.7 million from Q2, driven Credit card fees 32.7 32.5 0.2 31.3 1% 4% by a $5.3 million retroactive charge to a Other fees 11.2 11.7 (0.6) 10.8 (5%) 4% tenant under an amended lease Banking fees $ 111.0 $ 111.0 $ 0.0 $ 106.5 0% 4% contract Insurance fees 13.0 12.7 0.3 15.4 2% (16%) Brokerage and asset management fees 9.5 9.1 0.4 8.4 4% 13% Trust fees 7.0 6.6 0.4 6.7 6% 4% Asset management and insurance fees $ 29.5 $ 28.4 $ 1.1 $ 30.5 4% (4%) Mortgage banking activities 2.8 4.9 (2.1) 2.7 (43%) 4% Other operating income 28.0 24.3 3.7 24.3 15% 15% Non-interest income $ 171.2 $ 168.5 $ 2.7 $ 164.1 2% 4% Non-Interest Income ($ in millions) $171 $168 $168 180 .00 180 .00 $164 $152 160 .00 160 .00 140 .00 140 .00 120 .00 120 .00 100 .00 100 .00 80.0 0 80.0 0 60.0 0 60.0 0 40.0 0 40.0 0 20.0 0 20.0 0 - - Q3 2024 Q4 2024 Q1 2025 Q2 2025 Q3 2025 Banking fees Asset management and insurance Other operating income Mortgage banking activities Daily car rental income (sold in Q4 2024) 8 Differences due to rounding
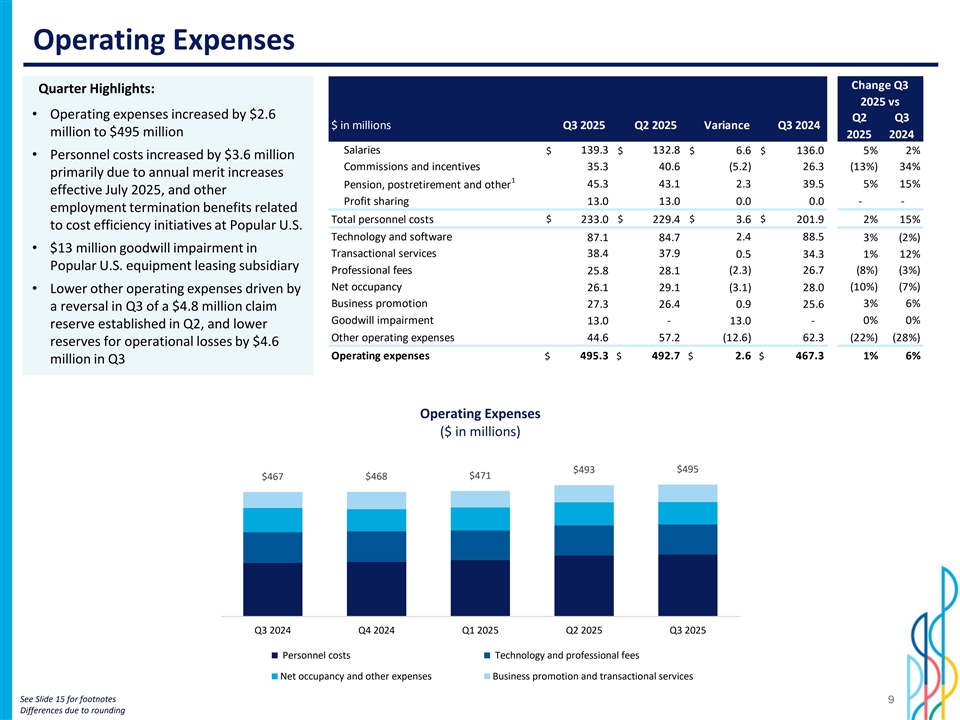
Operating Expenses Change Q3 Quarter Highlights: 2025 vs • Operating expenses increased by $2.6 Q2 Q3 $ in millions Q3 2025 Q2 2025 Variance Q3 2024 million to $495 million 2025 2024 Salaries 139.3 132.8 $ $ $ 6.6 $ 136.0 5% 2% • Personnel costs increased by $3.6 million Commissions and incentives 35.3 40.6 (5.2) 26.3 (13%) 34% primarily due to annual merit increases 1 Pension, postretirement and other 45.3 43.1 2.3 39.5 5% 15% effective July 2025, and other Profit sharing 13.0 13.0 0.0 0.0 - - employment termination benefits related Total personnel costs $ 233.0 $ 229.4 $ 3.6 $ 201.9 2% 15% to cost efficiency initiatives at Popular U.S. Technology and software 87.1 84.7 2.4 88.5 3% (2%) • $13 million goodwill impairment in Transactional services 38.4 37.9 0.5 34.3 1% 12% Popular U.S. equipment leasing subsidiary Professional fees 25.8 28.1 (2.3) 26.7 (8%) (3%) Net occupancy (10%) (7%) 26.1 29.1 (3.1) 28.0 • Lower other operating expenses driven by Business promotion 27.3 26.4 0.9 25.6 3% 6% a reversal in Q3 of a $4.8 million claim Goodwill impairment 0% 0% 13.0 - 13.0 - reserve established in Q2, and lower Other operating expenses 44.6 57.2 (12.6) 62.3 (22%) (28%) reserves for operational losses by $4.6 Operating expenses $ 495.3 $ 492.7 $ 2.6 $ 467.3 1% 6% million in Q3 Operating Expenses ($ in millions) 600 .00 600 .00 $495 $493 $471 $467 $468 500 .00 500 .00 400 .00 400 .00 300 .00 300 .00 200 .00 200 .00 100 .00 100 .00 - - Q3 2024 Q4 2024 Q1 2025 Q2 2025 Q3 2025 Personnel costs Technology and professional fees Net occupancy and other expenses Business promotion and transactional services See Slide 15 for footnotes 9 Differences due to rounding
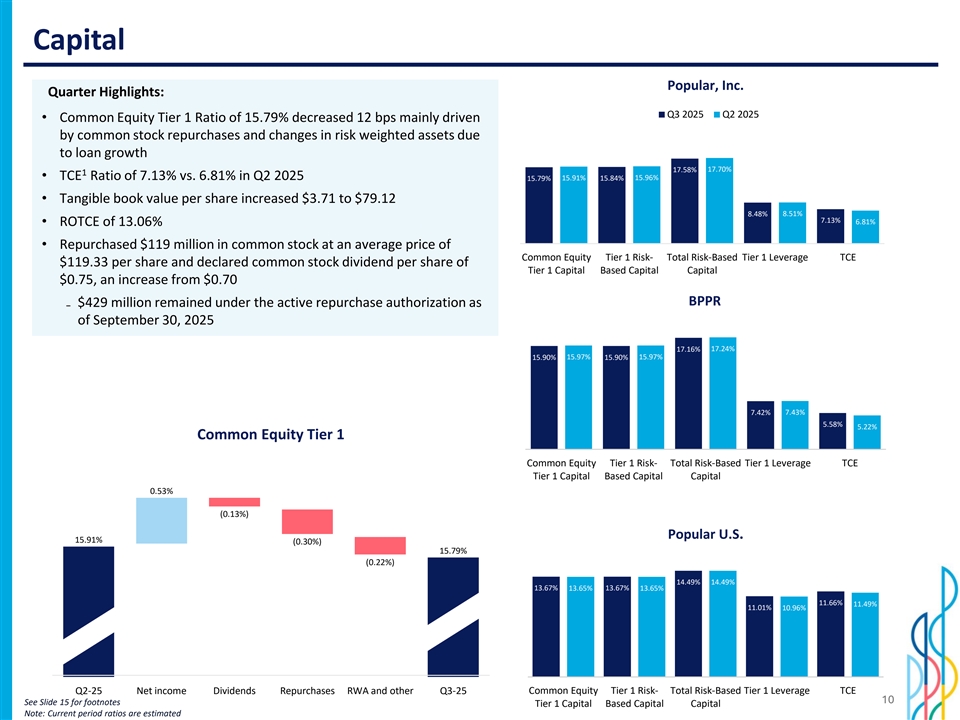
Capital Popular, Inc. Quarter Highlights: Q3 2025 Q2 2025 • Common Equity Tier 1 Ratio of 15.79% decreased 12 bps mainly driven by common stock repurchases and changes in risk weighted assets due 0.2 to loan growth 0.1 8 0.1 6 17.58% 17.70% 1 0.1 4 • TCE Ratio of 7.13% vs. 6.81% in Q2 2025 15.91% 15.96% 15.79% 15.84% 0.1 2 0.1 • Tangible book value per share increased $3.71 to $79.12 0.0 8 0.0 6 8.48% 8.51% 7.13% 6.81% 0.0 4 • ROTCE of 13.06% 0.0 2 0 • Repurchased $119 million in common stock at an average price of Common Equity Tier 1 Risk- Total Risk-Based Tier 1 Leverage TCE $119.33 per share and declared common stock dividend per share of Tier 1 Capital Based Capital Capital $0.75, an increase from $0.70 BPPR ₋ $429 million remained under the active repurchase authorization as 0.2 of September 30, 2025 0.1 8 0.1 6 17.16% 17.24% 0.1 4 15.90% 15.97% 15.90% 15.97% 0.1 2 0.1 0.0 8 0.0 6 7.42% 7.43% 0.0 4 5.58% 5.22% 0.0 2 Common Equity Tier 1 0 Common Equity Tier 1 Risk- Total Risk-Based Tier 1 Leverage TCE Tier 1 Capital Based Capital Capital 0.53% (0.13%) Popular U.S. 15.91% (0.30%) 15.79% 0.1 6 (0.22%) 0.1 4 14.49% 14.49% 0.1 2 13.67% 13.65% 13.67% 13.65% 0.1 11.66% 11.49% 11.01% 10.96% 0.0 8 0.0 6 0.0 4 0.0 2 0 Q2-25 Net income Dividends Repurchases RWA and other Q3-25 Common Equity Tier 1 Risk- Total Risk-Based Tier 1 Leverage TCE 10 See Slide 15 for footnotes Tier 1 Capital Based Capital Capital Note: Current period ratios are estimated
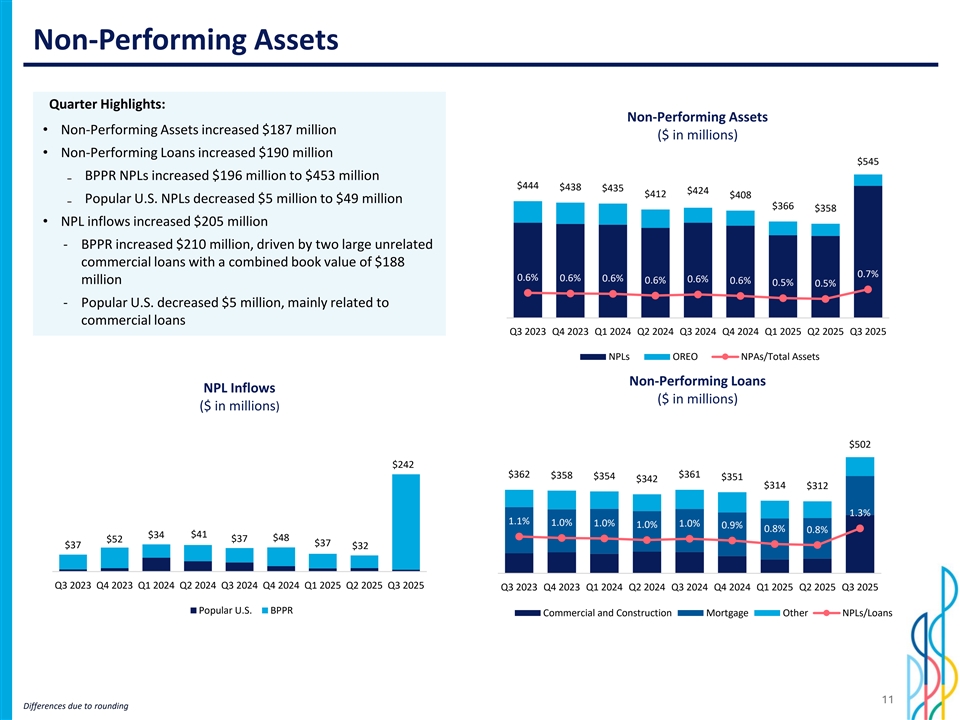
Non-Performing Assets Quarter Highlights: Non-Performing Assets • Non-Performing Assets increased $187 million ($ in millions) • Non-Performing Loans increased $190 million 600 0.04 $545 ₋ BPPR NPLs increased $196 million to $453 million 0.035 500 $444 $438 $435 $424 $412 $408 0.03 ₋ Popular U.S. NPLs decreased $5 million to $49 million $366 $358 400 0.025 • NPL inflows increased $205 million 300 0.02 ‐ BPPR increased $210 million, driven by two large unrelated 0.015 commercial loans with a combined book value of $188 200 0.7% 0.01 0.6% 0.6% 0.6% 0.6% million 0.6% 0.6% 0.5% 0.5% 100 0.005 ‐ Popular U.S. decreased $5 million, mainly related to 0 0 commercial loans Q3 2023 Q4 2023 Q1 2024 Q2 2024 Q3 2024 Q4 2024 Q1 2025 Q2 2025 Q3 2025 NPLs OREO NPAs/Total Assets Non-Performing Loans NPL Inflows ($ in millions) ($ in millions) 600 0.04 $502 0.035 300 500 $242 0.03 $362 $361 $358 $354 $351 400 $342 0.025 $314 $312 200 300 0.02 1.3% 0.015 1.1% 1.0% 1.0% 1.0% 200 1.0% 0.9% 0.8% 100 0.8% $41 $34 0.01 $48 $52 $37 $37 $37 $32 100 0.005 0 0 0 Q3 2023 Q4 2023 Q1 2024 Q2 2024 Q3 2024 Q4 2024 Q1 2025 Q2 2025 Q3 2025 Q3 2023 Q4 2023 Q1 2024 Q2 2024 Q3 2024 Q4 2024 Q1 2025 Q2 2025 Q3 2025 Popular U.S. BPPR Commercial and Construction Mortgage Other NPLs/Loans 11 Differences due to rounding
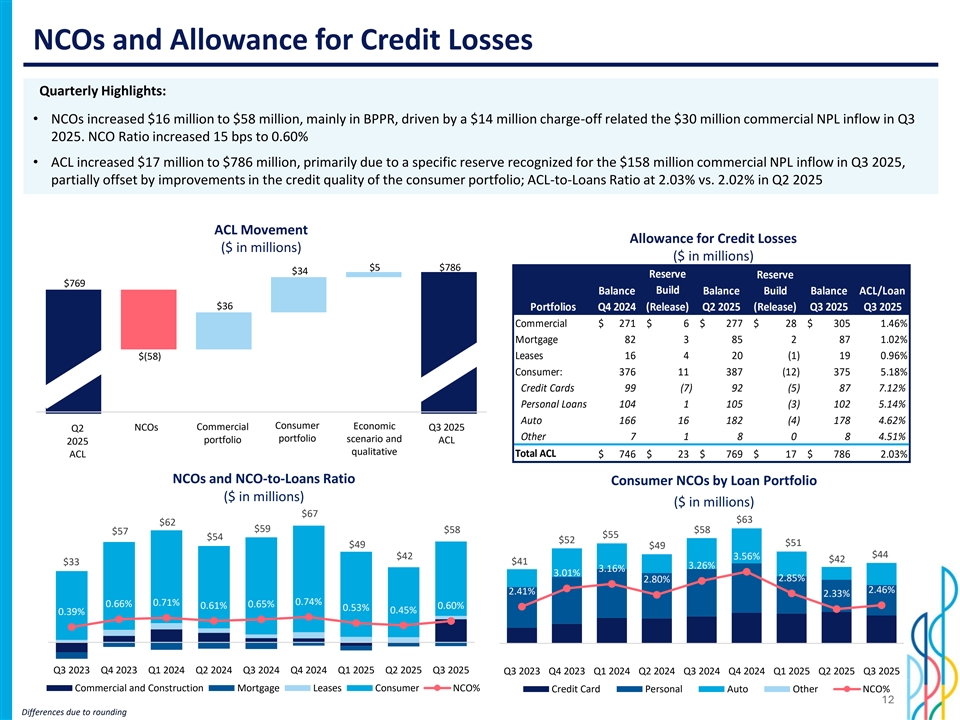
NCOs and Allowance for Credit Losses Quarterly Highlights: • NCOs increased $16 million to $58 million, mainly in BPPR, driven by a $14 million charge-off related the $30 million commercial NPL inflow in Q3 2025. NCO Ratio increased 15 bps to 0.60% • ACL increased $17 million to $786 million, primarily due to a specific reserve recognized for the $158 million commercial NPL inflow in Q3 2025, partially offset by improvements in the credit quality of the consumer portfolio; ACL-to-Loans Ratio at 2.03% vs. 2.02% in Q2 2025 ACL Movement Allowance for Credit Losses ($ in millions) ($ in millions) $5 $786 $34 Reserve Reserve $769 Balance Build Balance Build Balance ACL/Loan $36 Portfolios Q4 2024 (Release) Q2 2025 (Release) Q3 2025 Q3 2025 Commercial $ 271 $ 6 $ 277 $ 28 $ 305 1.46% Mortgage 82 3 85 2 87 1.02% $(58) Leases 16 4 20 (1) 19 0.96% Consumer: 376 11 387 (12) 375 5.18% Credit Cards 99 (7) 92 (5) 87 7.12% Personal Loans 104 1 105 (3) 102 5.14% Auto 166 16 182 (4) 178 4.62% NCOs Consumer Changes Q3 2025 ACL Consumer Economic NCOs Commercial Q3 2025 Q2 Q2 2025 ACL Commercial Changes Economic Scenarios and… Other 7 1 8 0 8 4.51% portfolio portfolio scenario and ACL 2025 qualitative ACL Total ACL $ 746 $ 23 $ 769 $ 17 $ 786 2.03% NCOs and NCO-to-Loans Ratio Consumer NCOs by Loan Portfolio ($ in millions) ($ in millions) 75 $67 70 4.0 0% $63 $62 5.0 0% $59 65 $58 $58 $57 60 $55 $54 $52 $51 $49 $49 55 3.0 0% 50 $44 4.0 0% $42 3.56% $42 $33 $41 45 3.26% 3.16% 40 3.01% 2.0 0% 2.85% 2.80% 35 3.0 0% 30 2.46% 2.41% 2.33% 25 0.71% 0.74% 0.66% 0.65% 0.61% 0.60% 0.53% 20 1.0 0% 0.45% 0.39% 15 2.0 0% 10 5 0.0 0% - 1.0 0% (5 ) (10) (1 5) -1.00% Q3 2023 Q4 2023 Q1 2024 Q2 2024 Q3 2024 Q4 2024 Q1 2025 Q2 2025 Q3 2025 Q3 2023 Q4 2023 Q1 2024 Q2 2024 Q3 2024 Q4 2024 Q1 2025 Q2 2025 Q3 2025 0.0 0% (20) Commercial and Construction Mortgage Leases Consumer NCO% Credit Card Personal Auto Other NCO% 12 Differences due to rounding
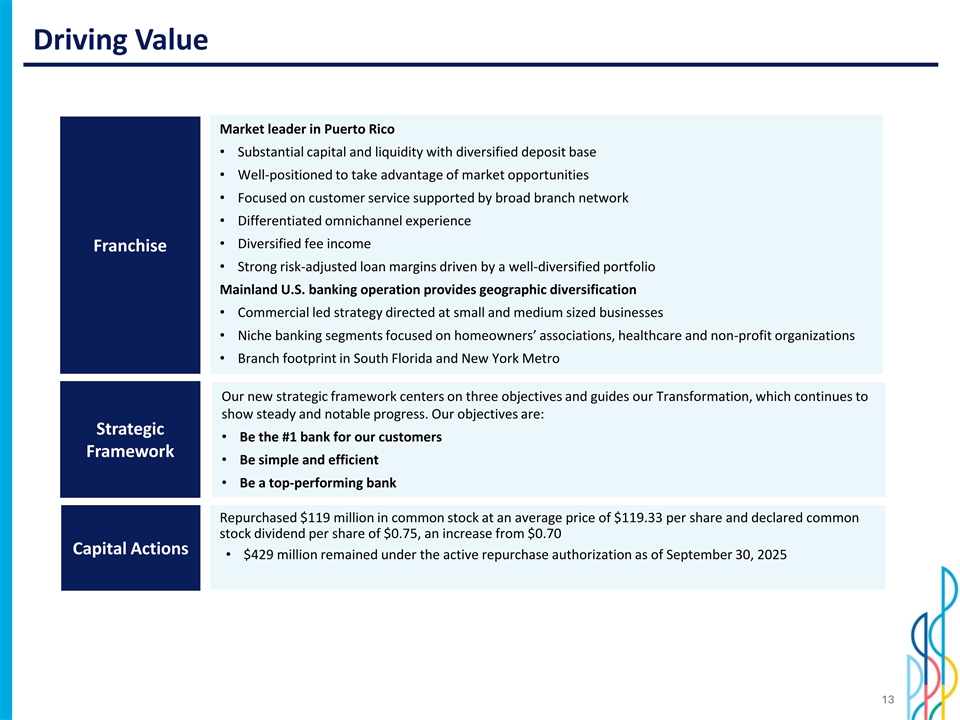
Driving Value Market leader in Puerto Rico • Substantial capital and liquidity with diversified deposit base • Well-positioned to take advantage of market opportunities • Focused on customer service supported by broad branch network • Differentiated omnichannel experience • Diversified fee income Franchise • Strong risk-adjusted loan margins driven by a well-diversified portfolio Mainland U.S. banking operation provides geographic diversification • Commercial led strategy directed at small and medium sized businesses • Niche banking segments focused on homeowners’ associations, healthcare and non-profit organizations • Branch footprint in South Florida and New York Metro Our new strategic framework centers on three objectives and guides our Transformation, which continues to show steady and notable progress. Our objectives are: Strategic • Be the #1 bank for our customers Framework • Be simple and efficient • Be a top-performing bank Repurchased $119 million in common stock at an average price of $119.33 per share and declared common stock dividend per share of $0.75, an increase from $0.70 Capital Actions • $429 million remained under the active repurchase authorization as of September 30, 2025 13
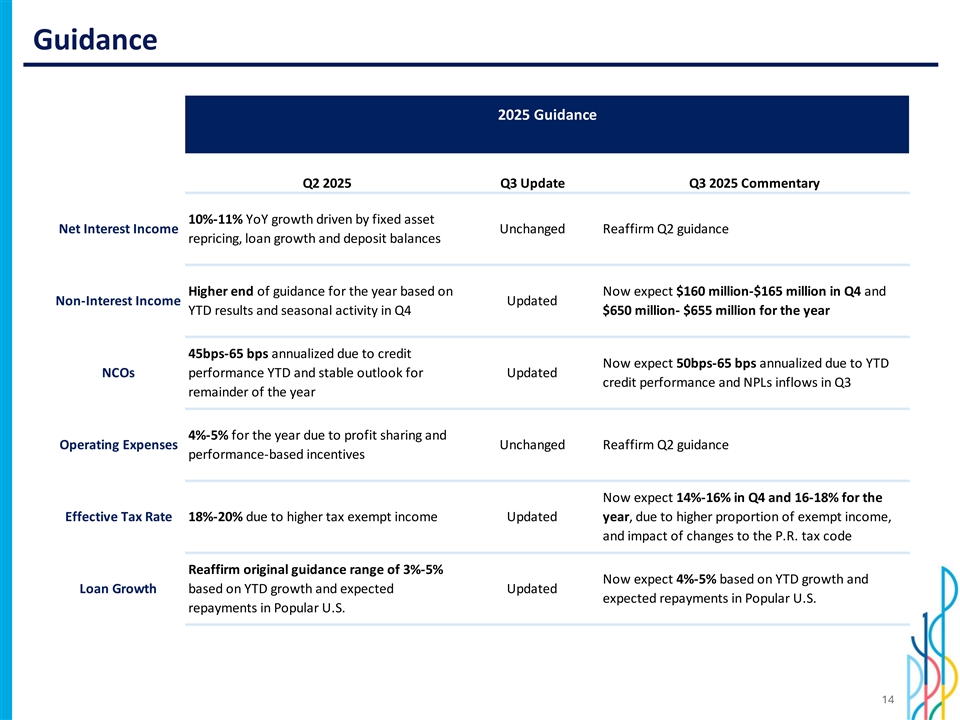
Guidance 2025 Guidance Q2 2025 Q3 Update Q3 2025 Commentary 10%-11% YoY growth driven by fixed asset Net Interest Income Unchanged Reaffirm Q2 guidance repricing, loan growth and deposit balances Higher end of guidance for the year based on Now expect $160 million-$165 million in Q4 and Non-Interest Income Updated YTD results and seasonal activity in Q4 $650 million- $655 million for the year 45bps-65 bps annualized due to credit Now expect 50bps-65 bps annualized due to YTD NCOs performance YTD and stable outlook for Updated credit performance and NPLs inflows in Q3 remainder of the year 4%-5% for the year due to profit sharing and Operating Expenses Unchanged Reaffirm Q2 guidance performance-based incentives Now expect 14%-16% in Q4 and 16-18% for the Effective Tax Rate 18%-20% due to higher tax exempt income Updated year, due to higher proportion of exempt income, and impact of changes to the P.R. tax code Reaffirm original guidance range of 3%-5% Now expect 4%-5% based on YTD growth and Loan Growth based on YTD growth and expected Updated expected repayments in Popular U.S. repayments in Popular U.S. 14
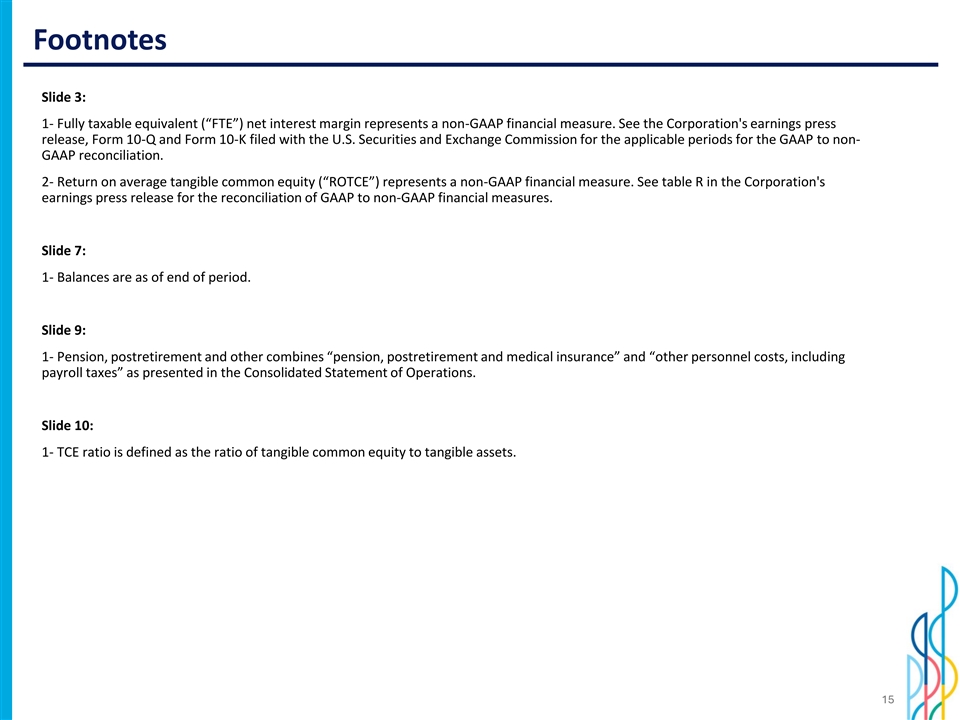
Footnotes Slide 3: 1- Fully taxable equivalent (“FTE”) net interest margin represents a non-GAAP financial measure. See the Corporation's earnings press release, Form 10-Q and Form 10-K filed with the U.S. Securities and Exchange Commission for the applicable periods for the GAAP to non- GAAP reconciliation. 2- Return on average tangible common equity (“ROTCE”) represents a non-GAAP financial measure. See table R in the Corporation's earnings press release for the reconciliation of GAAP to non-GAAP financial measures. Slide 7: 1- Balances are as of end of period. Slide 9: 1- Pension, postretirement and other combines “pension, postretirement and medical insurance” and “other personnel costs, including payroll taxes” as presented in the Consolidated Statement of Operations. Slide 10: 1- TCE ratio is defined as the ratio of tangible common equity to tangible assets. 15

Investor Presentation Third Quarter 2025 Appendix
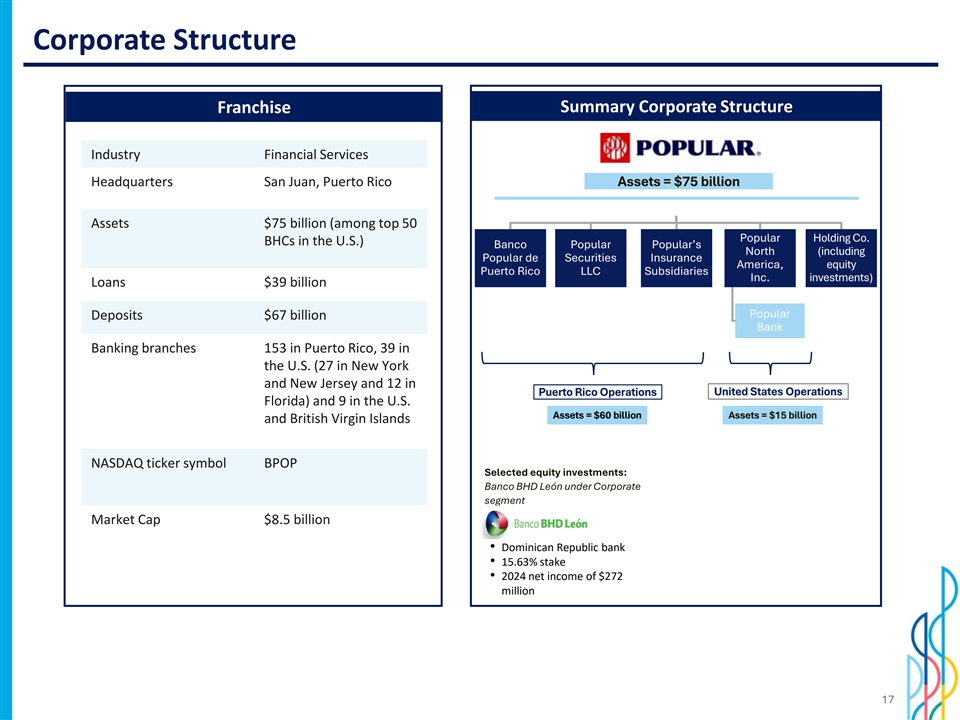
Corporate Structure Summary Corporate Structure Franchise Industry Financial Services Headquarters San Juan, Puerto Rico Assets = $75 billion Assets $75 billion (among top 50 Popular Holding Co. BHCs in the U.S.) Banco Popular Popular’s North (including Popular de Securities Insurance America, equity Puerto Rico LLC Subsidiaries Inc. investments) Loans $39 billion Popular Deposits $67 billion Bank Earnings Earnings Banking branches 153 in Puerto Rico, 39 in the U.S. (27 in New York and New Jersey and 12 in Puerto Rico Operations United States Operations Florida) and 9 in the U.S. Assets = $60 billion Assets = $15 billion and British Virgin Islands NASDAQ ticker symbol BPOP Selected equity investments: Banco BHD León under Corporate segment Market Cap $8.5 billion • Dominican Republic bank • 15.63% stake • 2024 net income of $272 million 17
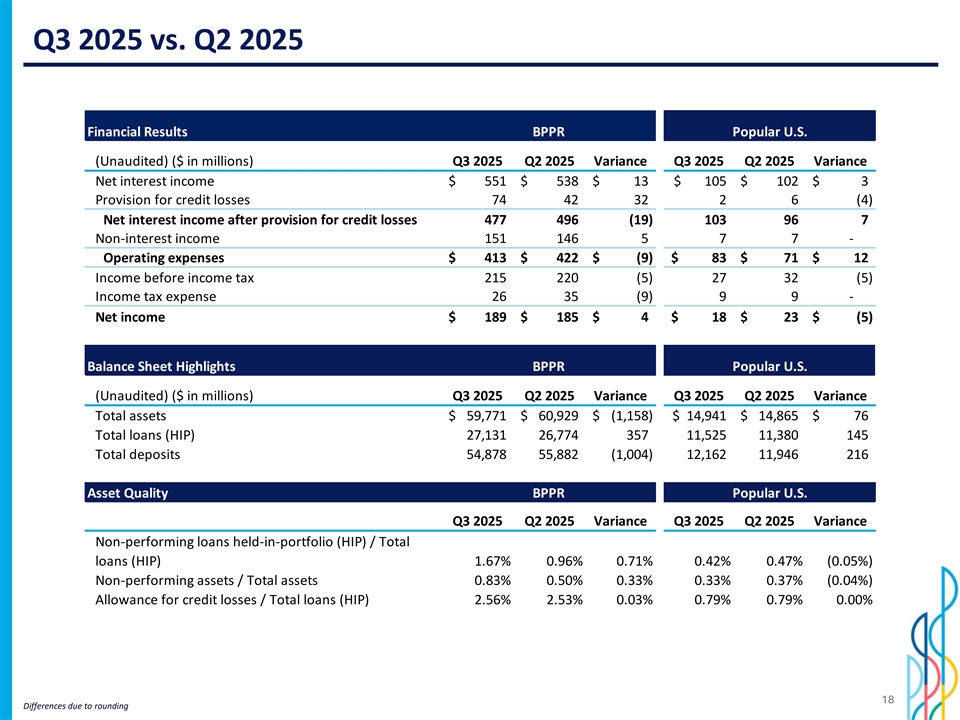
Q3 2025 vs. Q2 2025 Financial Results BPPR Popular U.S. (Unaudited) ($ in millions) Q3 2025 Q2 2025 Variance Q3 2025 Q2 2025 Variance Net interest income $ 551 $ 538 $ 13 $ 105 $ 102 $ 3 Provision for credit losses 74 42 32 2 6 (4) Net interest income after provision for credit losses 477 496 ( 19) 103 96 7 Non-interest income 151 146 5 7 7 - Operating expenses $ 413 $ 422 $ ( 9) $ 83 $ 71 $ 12 Income before income tax 215 220 (5) 27 32 (5) Income tax expense 26 35 (9) 9 9 - Net income $ 189 $ 185 $ 4 $ 18 $ 23 $ (5) Balance Sheet Highlights BPPR Popular U.S. (Unaudited) ($ in millions) Q3 2025 Q2 2025 Variance Q3 2025 Q2 2025 Variance Total assets $ 59,771 $ 60,929 $ (1,158) $ 14,941 $ 14,865 $ 76 Total loans (HIP) 27,131 26,774 357 1 1,525 11,380 145 Total deposits 54,878 55,882 (1,004) 1 2,162 11,946 216 Asset Quality BPPR Popular U.S. Q3 2025 Q2 2025 Variance Q3 2025 Q2 2025 Variance Non-performing loans held-in-portfolio (HIP) / Total loans (HIP) 1.67% 0.96% 0.71% 0.42% 0.47% (0.05%) Non-performing assets / Total assets 0.83% 0.50% 0.33% 0.33% 0.37% (0.04%) Allowance for credit losses / Total loans (HIP) 2.56% 2.53% 0.03% 0.79% 0.79% 0.00% 18 Differences due to rounding
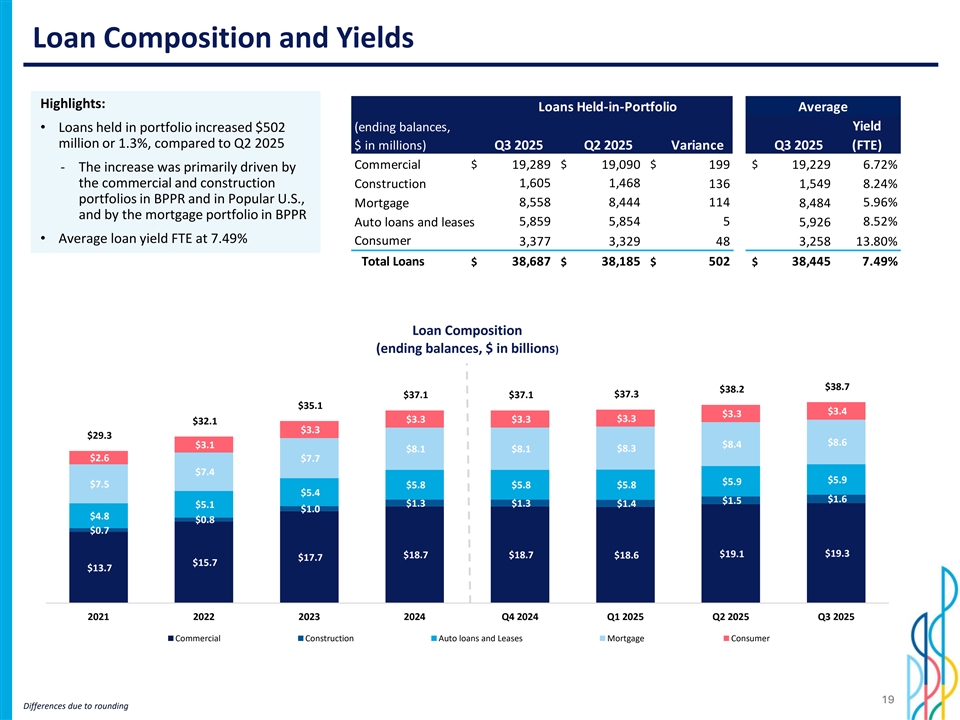
Loan Composition and Yields Highlights: Loans Held-in-Portfolio Average Yield • Loans held in portfolio increased $502 (ending balances, million or 1.3%, compared to Q2 2025 $ in millions) Q3 2025 Q2 2025 Variance Q3 2025 (FTE) $ $ $ $ Commercial 19,289 19,090 199 19,229 6.72% ‐ The increase was primarily driven by the commercial and construction Construction 1,605 1,468 136 1,549 8.24% portfolios in BPPR and in Popular U.S., 8,558 8,444 114 5.96% Mortgage 8,484 and by the mortgage portfolio in BPPR 5,859 5,854 5 8.52% Auto loans and leases 5,926 • Average loan yield FTE at 7.49% Consumer 3,377 3,329 48 3,258 13.80% Total Loans $ 38,687 $ 38,185 $ 502 $ 38,445 7.49% Loan Composition (ending balances, $ in billions) 45.0 0 $38.7 $38.2 40.0 0 $37.3 $37.1 $37.1 $35.1 $3.4 $3.3 35.0 0 $3.3 $3.3 $3.3 $32.1 $3.3 $29.3 $8.6 30.0 0 $3.1 $8.4 $8.1 $8.1 $8.3 $2.6 $7.7 25.0 0 $7.4 $5.9 $5.9 $7.5 $5.8 $5.8 $5.8 $5.4 20.0 0 $1.6 $1.5 $1.3 $1.3 $1.4 $5.1 $1.0 $4.8 $0.8 15.0 0 $0.7 10.0 0 $19.1 $19.3 $18.7 $18.7 $18.6 $17.7 $15.7 $13.7 5.00 - 2021 2022 2023 2024 Q4 2024 Q1 2025 Q2 2025 Q3 2025 Commercial Construction Auto loans and Leases Mortgage Consumer 19 Differences due to rounding
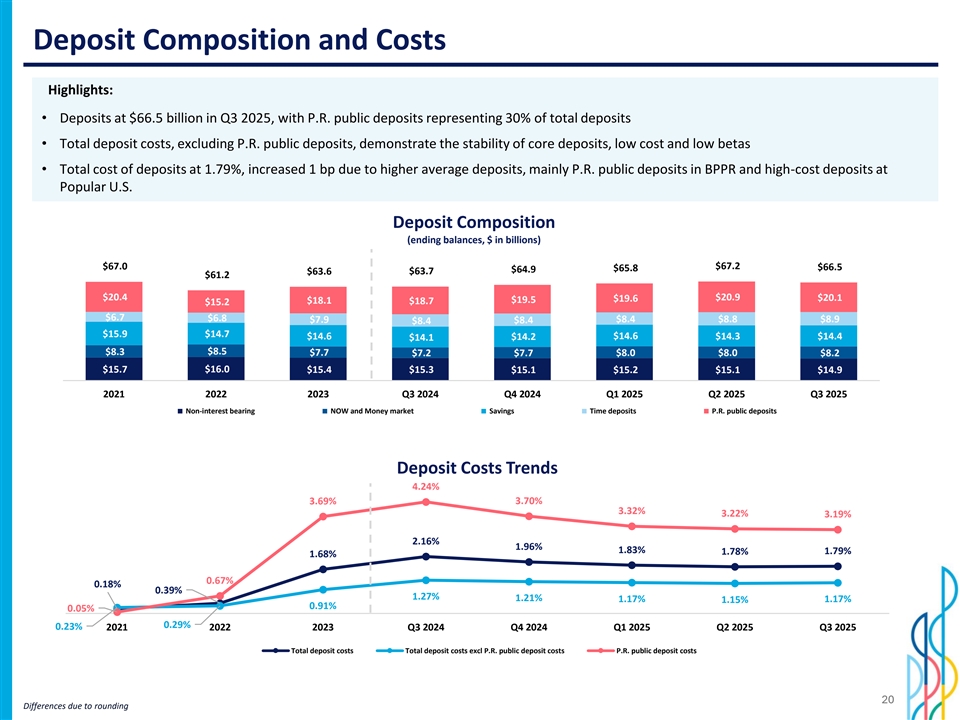
Deposit Composition and Costs Highlights: • Deposits at $66.5 billion in Q3 2025, with P.R. public deposits representing 30% of total deposits • Total deposit costs, excluding P.R. public deposits, demonstrate the stability of core deposits, low cost and low betas • Total cost of deposits at 1.79%, increased 1 bp due to higher average deposits, mainly P.R. public deposits in BPPR and high-cost deposits at Popular U.S. Deposit Composition (ending balances, $ in billions) 80.0 0 $67.0 $67.2 $66.5 $65.8 $64.9 $63.6 $63.7 70.0 0 $61.2 60.0 0 $20.4 $19.6 $20.9 $20.1 $19.5 $18.1 $18.7 $15.2 50.0 0 $6.7 $6.8 40.0 0 $7.9 $8.4 $8.8 $8.9 $8.4 $8.4 30.0 0 $15.9 $14.7 $14.6 $14.2 $14.6 $14.3 $14.4 $14.1 20.0 0 $8.3 $8.5 $7.7 $7.2 $7.7 $8.0 $8.0 $8.2 10.0 0 $15.7 $16.0 $15.4 $15.3 $15.1 $15.2 $15.1 $14.9 - 2021 2022 2023 Q3 2024 Q4 2024 Q1 2025 Q2 2025 Q3 2025 Non-interest bearing NOW and Money market Savings Time deposits P.R. public deposits Deposit Costs Trends 4.24% 0.045 3.69% 3.70% 0.04 3.32% 3.22% 3.19% 0.035 0.03 2.16% 0.025 1.96% 1.83% 1.78% 1.79% 1.68% 0.02 0.015 0.67% 0.01 0.18% 0.39% 1.27% 0.005 1.21% 1.17% 1.15% 1.17% 0.91% 0.05% 0 0.29% 0.23% 2021 2022 2023 Q3 2024 Q4 2024 Q1 2025 Q2 2025 Q3 2025 Total deposit costs Total deposit costs excl P.R. public deposit costs P.R. public deposit costs 20 Differences due to rounding
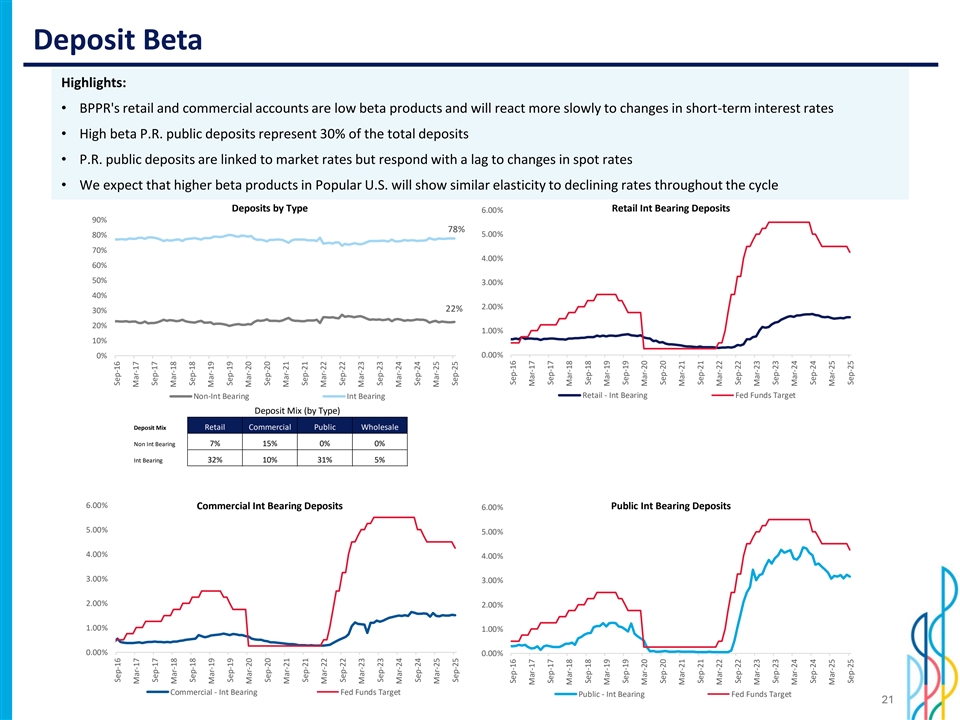
Deposit Beta Highlights: • BPPR's retail and commercial accounts are low beta products and will react more slowly to changes in short-term interest rates • High beta P.R. public deposits represent 30% of the total deposits • P.R. public deposits are linked to market rates but respond with a lag to changes in spot rates • We expect that higher beta products in Popular U.S. will show similar elasticity to declining rates throughout the cycle Deposits by Type Retail Int Bearing Deposits 6.00% 90% 78% 80% 5.00% 70% 4.00% 60% 50% 3.00% 40% 2.00% 22% 30% 20% 1.00% 10% 0.00% 0% Non-Int Bearing Int Bearing Retail - Int Bearing Fed Funds Target Deposit Mix (by Type) Deposit Mix Retail Commercial Public Wholesale Non Int Bearing 7% 15% 0% 0% Int Bearing 32% 10% 31% 5% 6.00% Commercial Int Bearing Deposits Public Int Bearing Deposits 6.00% 5.00% 5.00% 4.00% 4.00% 3.00% 3.00% 2.00% 2.00% 1.00% 1.00% 0.00% 0.00% Commercial - Int Bearing Fed Funds Target Public - Int Bearing Fed Funds Target 21 Sep-16 Sep-16 Mar-17 Mar-17 Sep-17 Sep-17 Mar-18 Mar-18 Sep-18 Sep-18 Mar-19 Mar-19 Sep-19 Sep-19 Mar-20 Mar-20 Sep-20 Sep-20 Mar-21 Mar-21 Sep-21 Sep-21 Mar-22 Mar-22 Sep-22 Sep-22 Mar-23 Mar-23 Sep-23 Sep-23 Mar-24 Mar-24 Sep-24 Sep-24 Mar-25 Mar-25 Sep-25 Sep-25 Sep-16 Sep-16 Mar-17 Mar-17 Sep-17 Sep-17 Mar-18 Mar-18 Sep-18 Sep-18 Mar-19 Mar-19 Sep-19 Sep-19 Mar-20 Mar-20 Sep-20 Sep-20 Mar-21 Mar-21 Sep-21 Sep-21 Mar-22 Mar-22 Sep-22 Sep-22 Mar-23 Mar-23 Sep-23 Sep-23 Mar-24 Mar-24 Sep-24 Sep-24 Mar-25 Mar-25 Sep-25 Sep-25
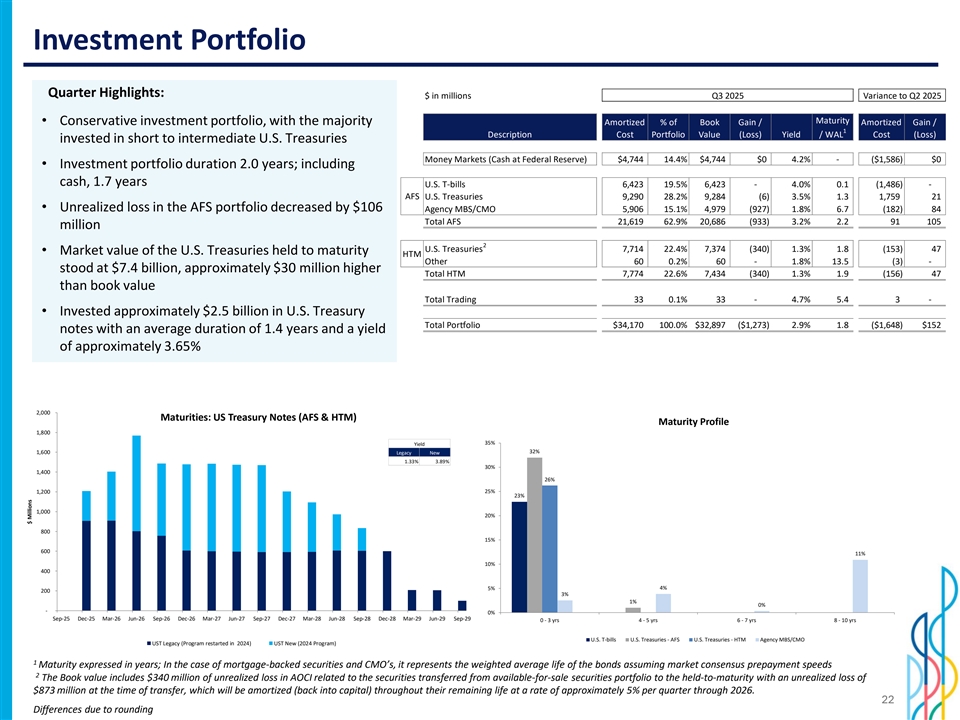
Investment Portfolio Quarter Highlights: $ in millions Q3 2025 Variance to Q2 2025 Maturity • Conservative investment portfolio, with the majority Amortized % of Book Gain / Amortized Gain / 1 Description Cost Portfolio Value (Loss) Yield / WAL Cost (Loss) invested in short to intermediate U.S. Treasuries Money Markets (Cash at Federal Reserve) $4,744 14.4% $4,744 $0 4.2% - ($1,586) $0 • Investment portfolio duration 2.0 years; including cash, 1.7 years U.S. T-bills 6,423 19.5% 6,423 - 4.0% 0.1 ( 1,486) - AFS U.S. Treasuries 9,290 28.2% 9,284 (6) 3.5% 1.3 1,759 21 • Unrealized loss in the AFS portfolio decreased by $106 Agency MBS/CMO 5,906 15.1% 4,979 ( 927) 1.8% 6.7 (182) 84 Total AFS 21,619 62.9% 20,686 (933) 3.2% 2.2 91 105 million 2 U.S. Treasuries 7,714 22.4% 7,374 ( 340) 1.3% 1.8 (153) 47 • Market value of the U.S. Treasuries held to maturity HTM Other 60 0.2% 60 - 1.8% 13.5 (3) - stood at $7.4 billion, approximately $30 million higher Total HTM 7,774 22.6% 7,434 ( 340) 1.3% 1.9 (156) 47 than book value Total Trading 33 0.1% 33 - 4.7% 5.4 3 - • Invested approximately $2.5 billion in U.S. Treasury Total Portfolio $34,170 100.0% $32,897 ($1,273) 2.9% 1.8 ($1,648) $152 notes with an average duration of 1.4 years and a yield of approximately 3.65% 2,000 Maturities: US Treasury Notes (AFS & HTM) Maturity Profile 1,800 35% Yield 32% 1,600 Legacy New 1.33% 3.89% 30% 1,400 26% 25% 1,200 23% 1,000 20% 800 15% 600 11% 10% 400 4% 5% 200 3% 1% 0% 0% 0% 0% 0% 0% 0% 0% 0% 0% 0% 0% 0% - 0% Sep-25 Dec-25 Mar-26 Jun-26 Sep-26 Dec-26 Mar-27 Jun-27 Sep-27 Dec-27 Mar-28 Jun-28 Sep-28 Dec-28 Mar-29 Jun-29 Sep-29 0 - 3 yrs 4 - 5 yrs 6 - 7 yrs 8 - 10 yrs U.S. T-bills U.S. Treasuries - AFS U.S. Treasuries - HTM Agency MBS/CMO UST Legacy (Program restarted in 2024) UST New (2024 Program) 1 Maturity expressed in years; In the case of mortgage-backed securities and CMO’s, it represents the weighted average life of the bonds assuming market consensus prepayment speeds 2 The Book value includes $340 million of unrealized loss in AOCI related to the securities transferred from available-for-sale securities portfolio to the held-to-maturity with an unrealized loss of $873 million at the time of transfer, which will be amortized (back into capital) throughout their remaining life at a rate of approximately 5% per quarter through 2026. 22 Differences due to rounding $ Millions
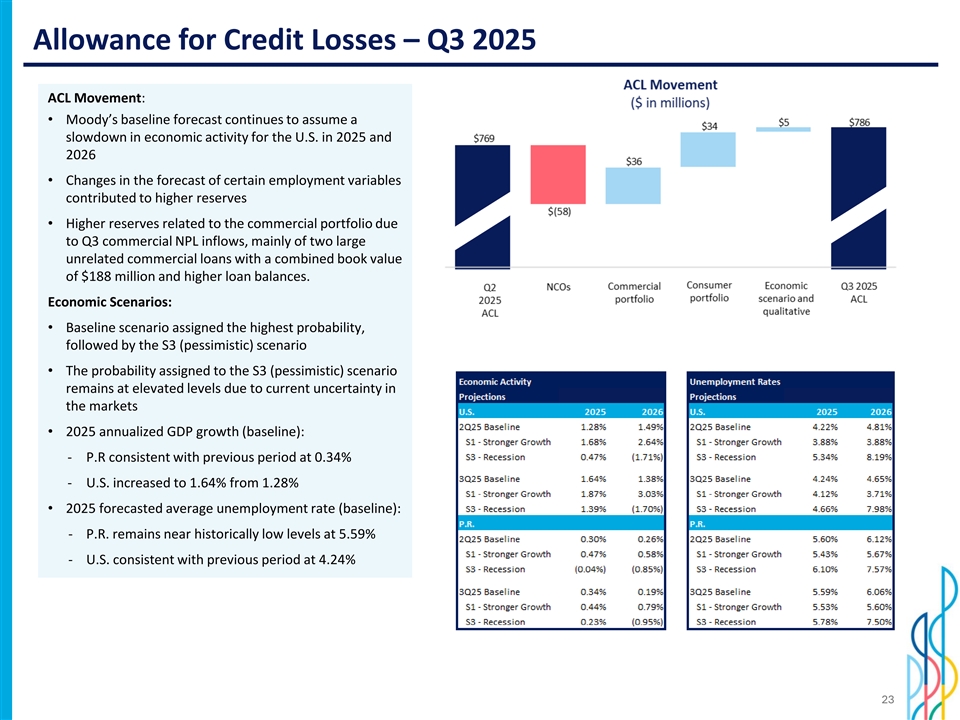
Allowance for Credit Losses – Q3 2025 ACL Movement: • Moody’s baseline forecast continues to assume a slowdown in economic activity for the U.S. in 2025 and 2026 • Changes in the forecast of certain employment variables contributed to higher reserves • Higher reserves related to the commercial portfolio due to Q3 commercial NPL inflows, mainly of two large unrelated commercial loans with a combined book value of $188 million and higher loan balances. Economic Scenarios: • Baseline scenario assigned the highest probability, followed by the S3 (pessimistic) scenario • The probability assigned to the S3 (pessimistic) scenario remains at elevated levels due to current uncertainty in the markets • 2025 annualized GDP growth (baseline): ‐ P.R consistent with previous period at 0.34% ‐ U.S. increased to 1.64% from 1.28% • 2025 forecasted average unemployment rate (baseline): ‐ P.R. remains near historically low levels at 5.59% ‐ U.S. consistent with previous period at 4.24% 23
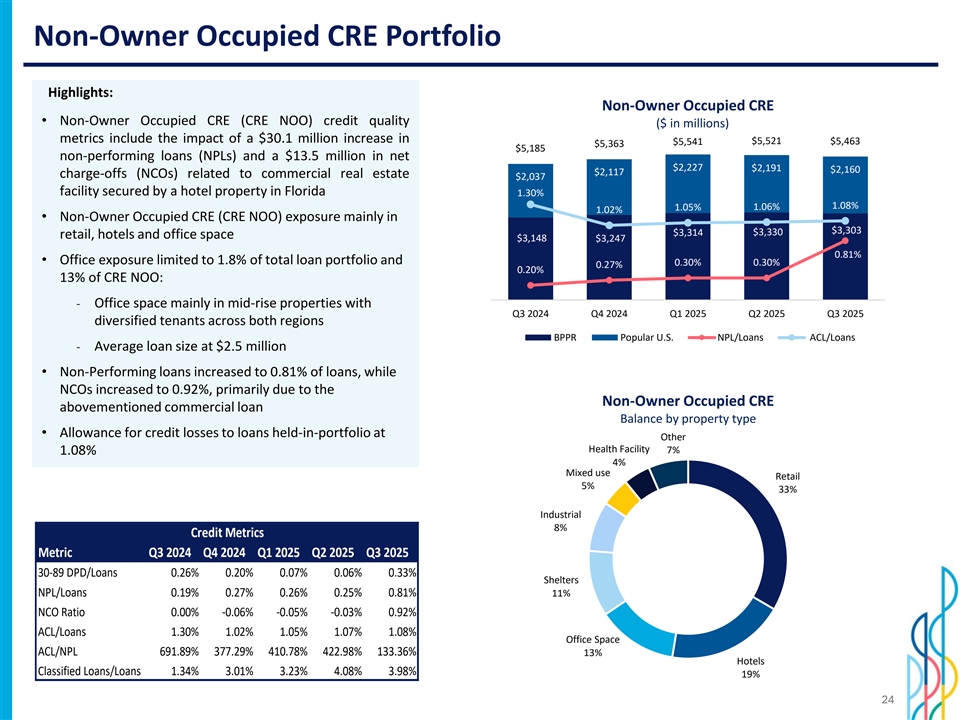
Non-Owner Occupied CRE Portfolio Highlights: Non-Owner Occupied CRE • Non-Owner Occupied CRE (CRE NOO) credit quality ($ in millions) metrics include the impact of a $30.1 million increase in $5,521 $5,463 $5,541 $5,363 $5,185 non-performing loans (NPLs) and a $13.5 million in net 5,000 $2,227 $2,191 $2,160 $2,117 charge-offs (NCOs) related to commercial real estate $2,037 facility secured by a hotel property in Florida 4,000 1.30% 1.08% 1.05% 1.06% 1.02% • Non-Owner Occupied CRE (CRE NOO) exposure mainly in 3,000 $3,303 $3,314 $3,330 retail, hotels and office space $3,148 $3,247 2,000 0.81% • Office exposure limited to 1.8% of total loan portfolio and 0.30% 0.30% 0.27% 0.20% 1,000 13% of CRE NOO: 0 0.0% ‐ Office space mainly in mid-rise properties with Q3 2024 Q4 2024 Q1 2025 Q2 2025 Q3 2025 diversified tenants across both regions BPPR Popular U.S. NPL/Loans ACL/Loans ‐ Average loan size at $2.5 million • Non-Performing loans increased to 0.81% of loans, while NCOs increased to 0.92%, primarily due to the Non-Owner Occupied CRE abovementioned commercial loan Balance by property type • Allowance for credit losses to loans held-in-portfolio at Other Health Facility 7% 1.08% 4% Mixed use Retail 5% 33% Industrial 8% Credit Metrics Metric Q3 2024 Q4 2024 Q1 2025 Q2 2025 Q3 2025 30-89 DPD/Loans 0.26% 0.20% 0.07% 0.06% 0.33% Shelters NPL/Loans 0.19% 0.27% 0.26% 0.25% 0.81% 11% NCO Ratio 0.00% -0.06% -0.05% -0.03% 0.92% ACL/Loans 1.30% 1.02% 1.05% 1.07% 1.08% Office Space ACL/NPL 691.89% 377.29% 410.78% 422.98% 133.36% 13% Hotels Classified Loans/Loans 1.34% 3.01% 3.23% 4.08% 3.98% 19% 24
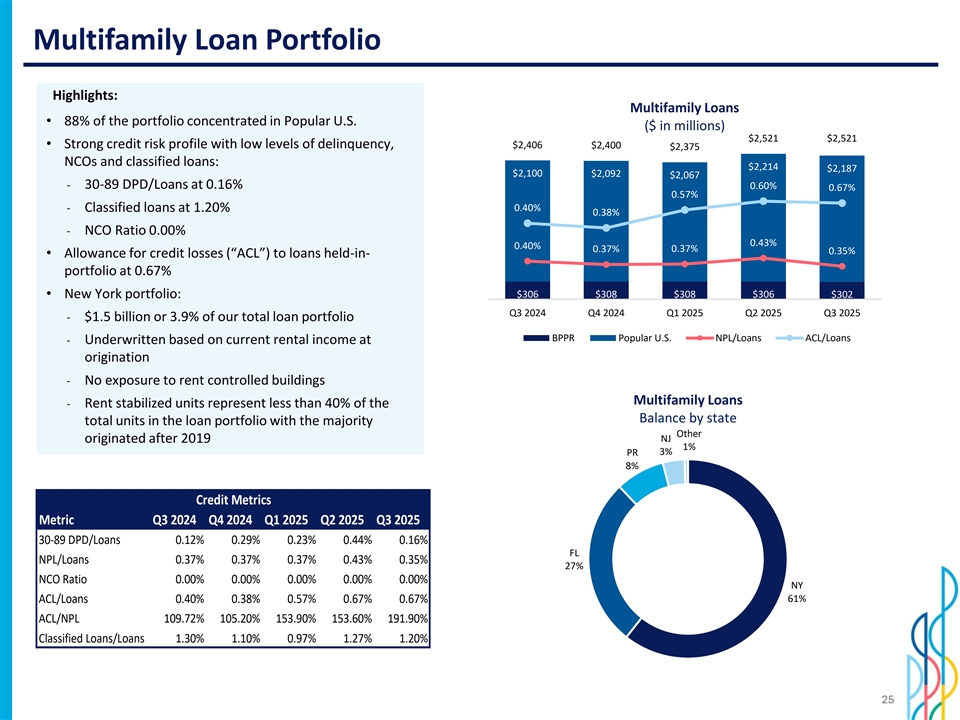
Multifamily Loan Portfolio Highlights: Multifamily Loans • 88% of the portfolio concentrated in Popular U.S. ($ in millions) $2,521 $2,521 • Strong credit risk profile with low levels of delinquency, $2,406 $2,400 $2,375 2,500 NCOs and classified loans: 1.4% $2,214 $2,187 $2,100 $2,092 $2,067 2,000 1.2% ‐ 30-89 DPD/Loans at 0.16% 0.60% 0.67% 0.57% 1.0% ‐ Classified loans at 1.20% 0.40% 1,500 0.38% 0.8% ‐ NCO Ratio 0.00% 1,000 0.6% 0.43% 0.40% 0.37% 0.37% 0.35% • Allowance for credit losses (“ACL”) to loans held-in- 0.4% 500 portfolio at 0.67% 0.2% $306 $308 $308 $306 • New York portfolio: $302 0 0.0% Q3 2024 Q4 2024 Q1 2025 Q2 2025 Q3 2025 ‐ $1.5 billion or 3.9% of our total loan portfolio BPPR Popular U.S. NPL/Loans ACL/Loans ‐ Underwritten based on current rental income at origination ‐ No exposure to rent controlled buildings Multifamily Loans ‐ Rent stabilized units represent less than 40% of the Balance by state total units in the loan portfolio with the majority Other originated after 2019 NJ 1% 3% PR 8% Credit Metrics Metric Q3 2024 Q4 2024 Q1 2025 Q2 2025 Q3 2025 30-89 DPD/Loans 0.12% 0.29% 0.23% 0.44% 0.16% FL NPL/Loans 0.37% 0.37% 0.37% 0.43% 0.35% 27% NCO Ratio 0.00% 0.00% 0.00% 0.00% 0.00% NY ACL/Loans 0.40% 0.38% 0.57% 0.67% 0.67% 61% ACL/NPL 109.72% 105.20% 153.90% 153.60% 191.90% Classified Loans/Loans 1.30% 1.10% 0.97% 1.27% 1.20% 25
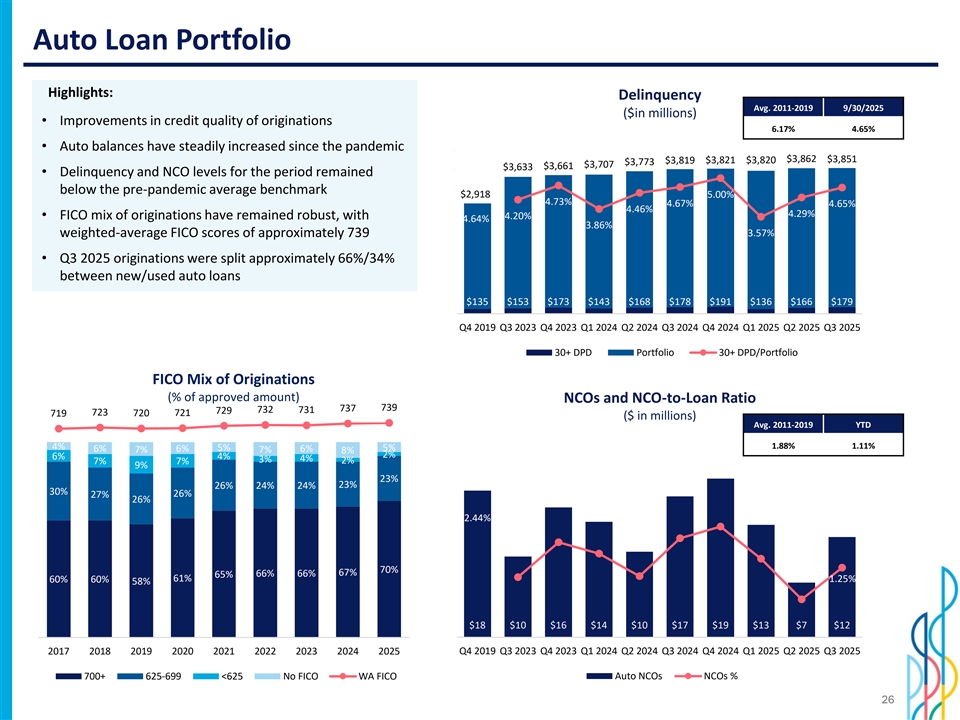
Auto Loan Portfolio Highlights: Delinquency Avg. 2011-2019 9/30/2025 ($in millions) • Improvements in credit quality of originations 6.17% 4.65% • Auto balances have steadily increased since the pandemic 4500 0.06 $3,862 $3,851 $3,819 $3,821 $3,820 $3,773 $3,707 4000 $3,661 $3,633 • Delinquency and NCO levels for the period remained 0.05 3500 below the pre-pandemic average benchmark $2,918 5.00% 4.73% 3000 4.67% 4.65% 0.04 4.46% 4.29% • FICO mix of originations have remained robust, with 4.20% 4.64% 2500 3.86% 0.03 3.57% weighted-average FICO scores of approximately 739 2000 1500 0.02 • Q3 2025 originations were split approximately 66%/34% 1000 between new/used auto loans 0.01 500 $135 $153 $173 $143 $168 $178 $191 $136 $166 $179 0 0 Q4 2019 Q3 2023 Q4 2023 Q1 2024 Q2 2024 Q3 2024 Q4 2024 Q1 2025 Q2 2025 Q3 2025 30+ DPD Portfolio 30+ DPD/Portfolio FICO Mix of Originations (% of approved amount) NCOs and NCO-to-Loan Ratio 739 737 729 732 731 723 720 721 719 ($ in millions) Avg. 2011-2019 YTD 700 100% 1.88% 1.11% 4% 5% 5% 6% 6% 6% 7% 7% 8% 2% 6% 4% 4% 3% 2% 600 7% 7% 9% 20 0.03 80% 23% 23% 18 26% 24% 24% 500 30% 27% 26% 0.025 26% 16 60% 14 2.44% 400 0.02 12 300 10 0.015 40% 8 70% 67% 65% 66% 66% 200 61% 60% 60% 1.25% 0.01 58% 6 20% 4 100 0.005 2 $18 $10 $16 $14 $10 $17 $19 $13 $7 $12 0% 0 0 0 2017 2018 2019 2020 2021 2022 2023 2024 2025 Q4 2019 Q3 2023 Q4 2023 Q1 2024 Q2 2024 Q3 2024 Q4 2024 Q1 2025 Q2 2025 Q3 2025 700+ 625-699 <625 No FICO WA FICO Auto NCOs NCOs % 26
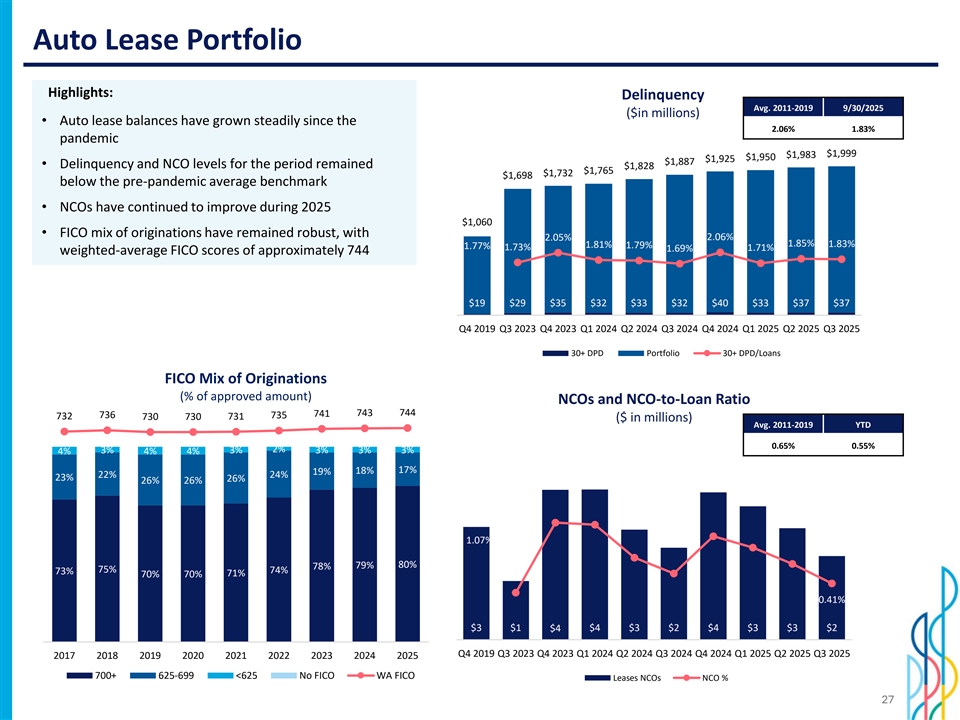
Auto Lease Portfolio Highlights: Delinquency Avg. 2011-2019 9/30/2025 ($in millions) • Auto lease balances have grown steadily since the 2.06% 1.83% 2500 0.06 pandemic $1,999 $1,983 $1,950 $1,925 0.05 $1,887 • Delinquency and NCO levels for the period remained 2000 $1,828 $1,765 $1,732 $1,698 below the pre-pandemic average benchmark 0.04 1500 • NCOs have continued to improve during 2025 0.03 $1,060 • FICO mix of originations have remained robust, with 2.06% 2.05% 1000 1.85% 1.81% 1.79% 1.83% 1.77% 1.73% 1.71% 1.69% weighted-average FICO scores of approximately 744 0.02 500 0.01 $19 $29 $35 $32 $33 $32 $40 $33 $37 $37 0 0 Q4 2019 Q3 2023 Q4 2023 Q1 2024 Q2 2024 Q3 2024 Q4 2024 Q1 2025 Q2 2025 Q3 2025 30+ DPD Portfolio 30+ DPD/Loans FICO Mix of Originations (% of approved amount) NCOs and NCO-to-Loan Ratio 743 744 741 736 735 732 730 730 731 ($ in millions) Avg. 2011-2019 YTD 700 100% 0.65% 0.55% 2% 3% 3% 3% 3% 3% 4% 4% 4% 600 17% 19% 18% 4 0.012 22% 24% 23% 26% 26% 26% 80% 3.5 500 0.01 3 60% 400 0.008 2.5 1.07% 300 2 0.006 40% 80% 78% 79% 75% 74% 73% 71% 70% 70% 1.5 200 0.004 1 0.41% 20% 0.002 100 0.5 $3 $1 $4 $3 $2 $4 $3 $3 $2 $4 0 0 0% 0 Q4 2019 Q3 2023 Q4 2023 Q1 2024 Q2 2024 Q3 2024 Q4 2024 Q1 2025 Q2 2025 Q3 2025 2017 2018 2019 2020 2021 2022 2023 2024 2025 700+ 625-699 <625 No FICO WA FICO Leases NCOs NCO % 27
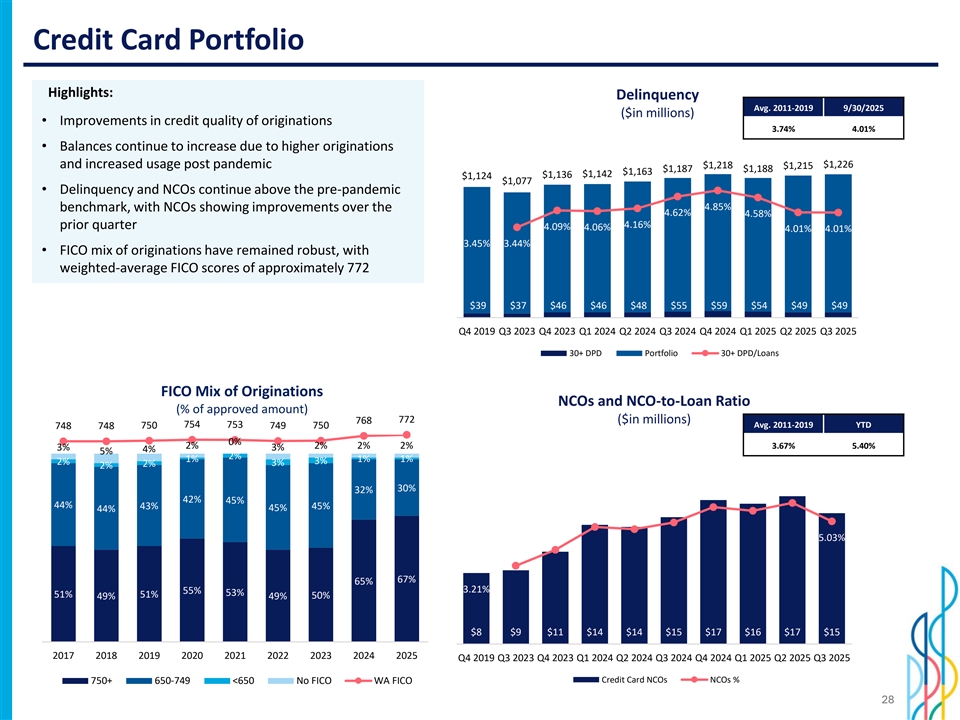
Credit Card Portfolio Highlights: Delinquency Avg. 2011-2019 9/30/2025 ($in millions) • Improvements in credit quality of originations 3.74% 4.01% • Balances continue to increase due to higher originations 1400 0.06 and increased usage post pandemic $1,226 $1,218 $1,215 $1,187 $1,188 $1,163 0.055 $1,142 $1,136 $1,124 1200 $1,077 0.05 • Delinquency and NCOs continue above the pre-pandemic 0.045 1000 4.85% benchmark, with NCOs showing improvements over the 0.04 4.62% 4.58% 0.035 800 4.16% prior quarter 4.09% 4.06% 4.01% 4.01% 0.03 3.45% 3.44% 600 0.025 • FICO mix of originations have remained robust, with 0.02 weighted-average FICO scores of approximately 772 400 0.015 0.01 200 0.005 $39 $37 $46 $46 $48 $55 $59 $54 $49 $49 0 0 Q4 2019 Q3 2023 Q4 2023 Q1 2024 Q2 2024 Q3 2024 Q4 2024 Q1 2025 Q2 2025 Q3 2025 30+ DPD Portfolio 30+ DPD/Loans FICO Mix of Originations NCOs and NCO-to-Loan Ratio (% of approved amount) 772 768 ($in millions) 754 753 Avg. 2011-2019 YTD 748 748 750 749 750 0% 2% 2% 2% 2% 3.67% 5.40% 3% 3% 4% 100% 5% 700 2% 1% 1% 1% 3% 2% 2% 3% 2% 20 0.07 600 18 80% 30% 32% 0.06 42% 45% 44% 500 16 43% 45% 45% 44% 0.05 14 60% 400 5.03% 12 0.04 10 300 40% 0.03 8 67% 65% 200 6 3.21% 55% 53% 0.02 51% 51% 50% 49% 49% 20% 4 100 0.01 2 $8 $9 $11 $14 $14 $15 $17 $16 $17 $15 0% 0 0 0 2017 2018 2019 2020 2021 2022 2023 2024 2025 Q4 2019 Q3 2023 Q4 2023 Q1 2024 Q2 2024 Q3 2024 Q4 2024 Q1 2025 Q2 2025 Q3 2025 Credit Card NCOs NCOs % 750+ 650-749 <650 No FICO WA FICO 28
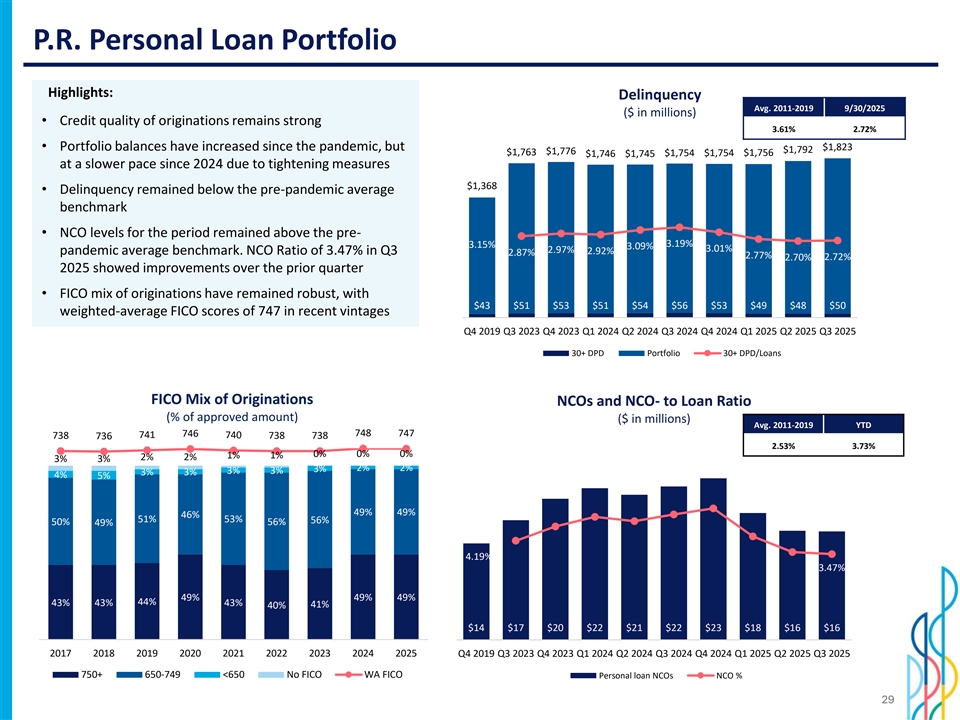
P.R. Personal Loan Portfolio Highlights: Delinquency Avg. 2011-2019 9/30/2025 ($ in millions) • Credit quality of originations remains strong 3.61% 2.72% 200 0 0.06 • Portfolio balances have increased since the pandemic, but $1,823 $1,792 $1,776 $1,763 $1,754 $1,754 $1,756 $1,746 $1,745 180 0 at a slower pace since 2024 due to tightening measures 0.05 160 0 $1,368 • Delinquency remained below the pre-pandemic average 140 0 0.04 benchmark 120 0 100 0 0.03 • NCO levels for the period remained above the pre- 3.19% 3.15% 3.09% 800 3.01% 2.97% pandemic average benchmark. NCO Ratio of 3.47% in Q3 2.92% 2.87% 2.77% 2.72% 2.70% 0.02 600 2025 showed improvements over the prior quarter 400 0.01 • FICO mix of originations have remained robust, with 200 $43 $51 $53 $51 $54 $56 $53 $49 $48 $50 weighted-average FICO scores of 747 in recent vintages 0 0 Q4 2019 Q3 2023 Q4 2023 Q1 2024 Q2 2024 Q3 2024 Q4 2024 Q1 2025 Q2 2025 Q3 2025 30+ DPD Portfolio 30+ DPD/Loans FICO Mix of Originations NCOs and NCO- to Loan Ratio (% of approved amount) ($ in millions) Avg. 2011-2019 YTD 748 746 747 738 741 740 738 738 736 2.53% 3.73% 0% 0% 0% 1% 1% 2% 2% 700 3% 3% 100% 25 0.07 2% 2% 3% 3% 3% 3% 3% 4% 5% 600 0.06 80% 20 500 49% 49% 0.05 46% 51% 53% 56% 50% 56% 49% 60% 15 400 0.04 4.19% 300 0.03 40% 3.47% 10 200 0.02 49% 49% 49% 20% 44% 43% 43% 43% 5 41% 40% 100 0.01 $14 $17 $20 $22 $21 $22 $23 $18 $16 $16 0% 0 0 0 2017 2018 2019 2020 2021 2022 2023 2024 2025 Q4 2019 Q3 2023 Q4 2023 Q1 2024 Q2 2024 Q3 2024 Q4 2024 Q1 2025 Q2 2025 Q3 2025 750+ 650-749 <650 No FICO WA FICO Personal loan NCOs NCO % 29
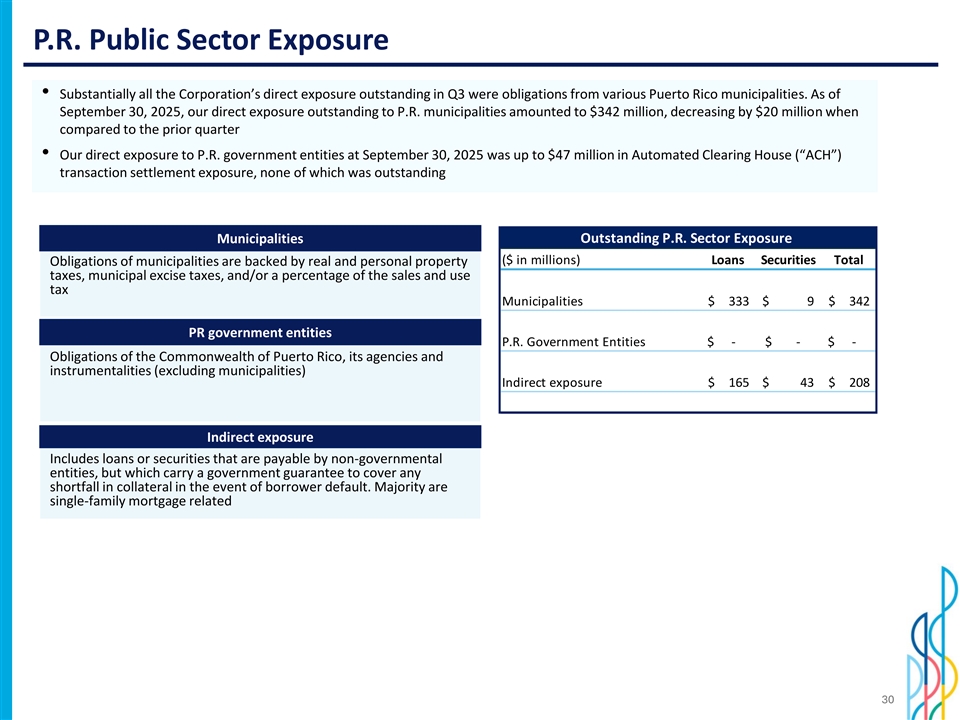
P.R. Public Sector Exposure • Substantially all the Corporation’s direct exposure outstanding in Q3 were obligations from various Puerto Rico municipalities. As of September 30, 2025, our direct exposure outstanding to P.R. municipalities amounted to $342 million, decreasing by $20 million when compared to the prior quarter • Our direct exposure to P.R. government entities at September 30, 2025 was up to $47 million in Automated Clearing House (“ACH”) transaction settlement exposure, none of which was outstanding Outstanding P.R. Sector Exposure Municipalities ($ in millions) Loans Securities Total Obligations of municipalities are backed by real and personal property taxes, municipal excise taxes, and/or a percentage of the sales and use tax Municipalities $ 333 $ 9 $ 342 PR government entities P.R. Government Entities $ - $ - $ - Obligations of the Commonwealth of Puerto Rico, its agencies and instrumentalities (excluding municipalities) Indirect exposure $ 165 $ 43 $ 208 Indirect exposure Includes loans or securities that are payable by non-governmental entities, but which carry a government guarantee to cover any shortfall in collateral in the event of borrower default. Majority are single-family mortgage related 30
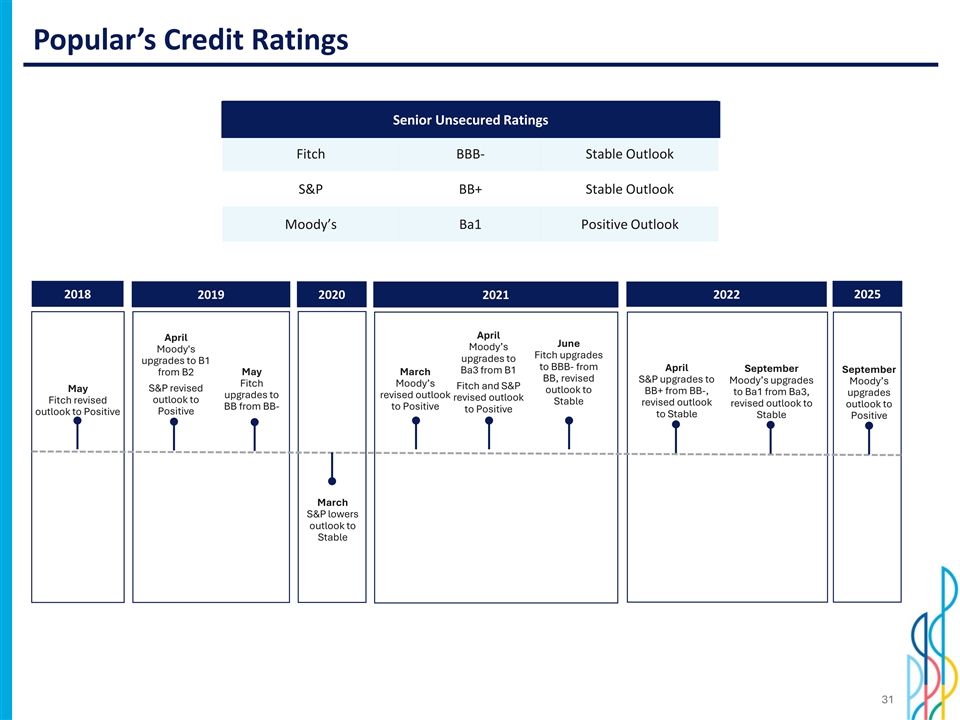
Popular’s Credit Ratings Senior Uns Senior Unsec ecur ured ed Ratings Ratings Fitch BBB- Stable Outlook S&P BB+ Stable Outlook Moody’s Ba1 Positive Outlook 2018 2019 2020 2021 2022 2025 April April June Moody’s Moody's Fitch upgrades upgrades to upgrades to B1 to BBB- from April September Ba3 from B1 September from B2 May March BB, revised S&P upgrades to Moody’s upgrades Moody’s Fitch Moody’s Fitch and S&P May S&P revised outlook to BB+ from BB-, to Ba1 from Ba3, upgrades upgrades to revised outlook revised outlook Fitch revised outlook to Stable revised outlook revised outlook to outlook to BB from BB- to Positive to Positive outlook to Positive Positive to Stable Stable Positive March S&P lowers outlook to Stable 31

Investor Presentation Third Quarter 2025