The following performance information provides some indication of the risks of investing in the Fund by showing changes in the Fund’s performance over time. The bar chart shows the annual returns for the Fund year over year. The table illustrates how the Fund’s average annual returns for the 1-year, 5-year, and since inception periods compare with those of a broad measure of market performance and additional benchmarks that are more representative of the Fund’s investment strategy. The Fund’s past performance, before and after taxes, does not necessarily indicate how it will perform in the future. Updated information about the Fund’s performance can be found by visiting the Fund’s website at www.impactetfs.org or by calling (844) 954-7733.
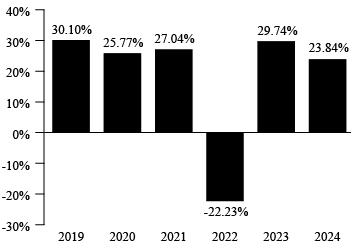
Through September 30, 2025 (the most recently ended quarter for which data is available), the year-to-date return of the Fund was 17.45%.
During the period of time shown in the bar chart, the Fund’s highest quarterly return was 20.79% for the quarter ended June 30, 2020, and the lowest quarterly return was -17.18% for the quarter ended March 31, 2020.
| 1 Year | 5 Years | Since Inception (July 18, 2018) | |
| Return Before Taxes | 23.84% | 14.83% | 14.32% |
| Return After Taxes on Distributions | 22.99% | 13.83% | 13.40% |
| Return After Taxes on Distributions and Sale of Fund Shares | 14.72% | 11.51% | 11.26% |
| Russell 1000® Index (reflects no deduction for fees, expenses, or taxes)(1) | 24.51% | 14.28% | 13.69% |
| Morningstar Minority Empowerment Index (reflects no deduction for fees, expenses, or taxes)(2) | 20.31% | 11.80% | 11.45% |
| Morningstar US Large-Mid Cap Index (reflects no deduction for fees, expenses, or taxes)(3) | 25.07% | 14.34% | 13.79% |
| (1) | The Russell 1000® Index measures the performance of the large-cap segment of the U.S. equity universe. It includes approximately 1,000 of the largest securities based on a combination of their market cap and current index membership. The Fund’s broad-based index benchmark was changed to Russell 1000® Index so that the Fund’s performance can be evaluated against a benchmark that represents the overall U.S. equity market. |
| (2) | The Morningstar Minority Empowerment Index is designed to provide exposure to US companies that have embedded strong racial and ethnic diversification policies into their corporate culture and that ensure equal opportunities to employees irrespective of their race or nationality. |
| (3) | The Morningstar US Large-Mid Cap Index measures the performance of large- and mid-cap stocks in the U.S., representing the top 90% of the investable universe by market capitalization. |
After-tax returns are calculated using the historical highest individual federal marginal income tax rates and do not reflect the impact of state and local taxes. Actual after-tax returns depend on an investor’s tax situation and may differ from those shown, and the after-tax returns shown are not relevant to investors who hold their Fund shares through tax advantaged arrangements such as 401(k) plans or individual retirement accounts (“IRAs”).
The following performance information provides some indication of the risks of investing in the Fund by showing changes in the Fund’s performance over time. The bar chart shows the annual returns for the Fund year over year. The table illustrates how the Fund’s average annual returns for the 1-year, 5-year, and since inception periods compare with those of a broad measure of market performance and additional benchmarks that are more representative of the Fund’s investment strategy. The Fund’s past performance, before and after taxes, does not necessarily indicate how it will perform in the future. Updated information about the Fund’s performance can be found by visiting the Fund’s website at www.impactetfs.org or by calling (844) 954-7733.
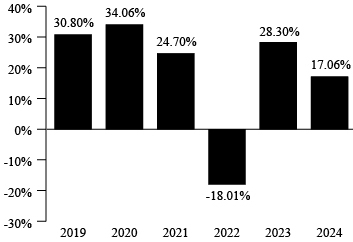
Through September 30, 2025 (the most recently ended quarter for which data is available) year-to-date return of the Fund was 6.19%.
During the period of time shown in the bar chart, the Fund’s highest quarterly return was 21.25% for the quarter ended June 30, 2020, and the lowest quarterly return was -17.91% for the quarter ended March 31, 2020.
| 1 Year | 5 Years | Since
Inception (August 24, 2018) | |
| Return Before Taxes | 17.06% | 15.54% | 14.95% |
| Return After Taxes on Distributions | 16.76% | 13.94% | 13.55% |
| Return After Taxes on Distributions and Sale of Fund Shares | 10.31% | 11.80% | 11.54% |
| Russell 1000® Index (reflects no deduction for fees, expenses, or taxes) (1) | 24.51% | 14.28% | 13.62% |
| Morningstar Women’s Empowerment Index (reflects no deduction for fees, expenses, or taxes)(2) | 15.38% | 11.20% | 10.76% |
| Morningstar US Large-Mid Cap Index (reflects no deduction for fees, expenses, or taxes)(3) | 25.07% | 14.34% | 13.52% |
| (1) | The Russell 1000® Index measures the performance of the large-cap segment of the U.S. equity universe. It includes approximately 1,000 of the largest securities based on a combination of their market cap and current index membership. The Fund’s broad-based index benchmark was changed to Russell 1000® Index so that the Fund’s performance can be evaluated against a benchmark that represents the overall U.S. equity market. |
| (2) | The Morningstar® Women's Empowerment Index is designed to deliver exposure to large- and mid-cap U.S. companies that have strong gender diversity and equal opportunity employment policies embedded in their corporate culture, as measured by Equileap’s data and scoring methodology. |
| (3) | The Morningstar US Large-Mid Cap Index measures the performance of large- and mid-cap stocks in the U.S., representing the top 90% of the investable universe by market capitalization. |
After-tax returns are calculated using the historical highest individual federal marginal income tax rates and do not reflect the impact of state and local taxes. Actual after-tax returns depend on an investor’s tax situation and may differ from those shown, and the after-tax returns shown are not relevant to investors who hold their Fund shares through tax advantaged arrangements such as 401(k) plans or individual retirement accounts (“IRAs”).