
Third Quarter 2025 Earnings Presentation Exhibit 99.2
Disclaimer This disclaimer applies to this document and the verbal comments of any person presenting it. This presentation, together with any such oral or written comments, is referred to herein as the “Presentation.” Forward-Looking Statements This Presentation relating to Millrose Properties, Inc. (“Millrose,” “we,” “our,” “us,” “MRP,” or the “Company”) contains certain “forward-looking statements” within the meaning of Section 27A of the Securities Act of 1934, as amended, and Section 21E of the Securities Exchange Act of 1934, as amended, including, without limitation, statements about Millrose’s plans, strategies and objectives, as well as statements about Millrose’s business (including MPH Parent LLC (“MPH Parent”), Millrose Properties Holdings, LLC (“Millrose Holdings”) and any of the other Millrose subsidiaries), Millrose’s future plans, strategies and objectives. You can generally identify forward-looking statements by the words “may”, “can”, “will”, “expect”, “intend”, “anticipate”, “estimate”, “believe”, “continue” or other similar words or negatives thereof. These statements include those relating to Millrose’s plans and objectives for future operations, including plans and objectives relating to future growth of our business and the Homesite Option Purchase Platform (“HOPP’R”); the availability of capital at any given time to finance the various endeavors, projects and acquisitions that are expected or planned for Millrose, as well as the availability of capital that needs to be reserved for specified uses (whether contractually or by law); expectations about the quality and value of our homesites and the existence of any liabilities attached to the homesites, and the adequacy of the protection; expectations and assumptions around our ongoing relationship with Lennar Corporation (“Lennar”), including expectations that Lennar will fully perform on all its obligations pursuant to its agreements with Millrose (and that there will be regular and timely exercises of its purchase options) and expectations that Lennar will continue to provide us with ongoing transactions and refer other builders who may be interested in the HOPP’R to us as potential new customers; our expected business, operations, and financial position; the possibility of providing the HOPP’R to future new customers, and the nature of any such future arrangements; the planned use, development and sales of the assets transferred to us in connection with the Spin-Off (as defined below); any expected acquisitions, uses, development and sales of future assets; expectations and assumptions around our relationship with our external manager, Kennedy Lewis Land and Residential Advisors LLC, an affiliate and wholly-owned subsidiary of Kennedy Lewis Investment Management LLC; our real estate investment trust (“REIT”) status and MPH Parent’s and Millrose Holdings’ taxable REIT subsidiary status; our emerging growth company status; expectations around ownership limits of our common stock; and expectation and assumptions around our sources of revenue, expected income, ability to secure financing or incur and repay indebtedness and our ability to comply with restrictions contained in our debt covenants, as well as other forward-looking statements, are all based on currently known or available information, which may not be indicative of future results (particularly as we are a recently-formed company and have had limited historical operations as a standalone company), as well as assumptions and expectations that involve numerous risks and uncertainties. All forward-looking statements included in this Presentation are qualified in their entirety by, and should be read in the context of, the risk factors and other factors disclosed in the Company’s filings with the Securities and Exchange Commission, including the Company’s Annual Report on Form 10-K for the year ended December 31, 2024, which can be obtained free of charge on the Securities and Exchange Commission’s web site at http://www.sec.gov. Assumptions related to these statements involve judgements with respect to, among other things, future macroeconomic, competitive and market conditions, future land values, future business decisions, future environmental conditions and relationships with our customers, all of which are difficult or impossible to accurately predict and many of which are beyond our control. Some of the assumptions are based on experiences of management without any formal analyses. Although we believe the assumptions underlying the forward-looking statements, and the forward-looking statements themselves, are reasonable, any of the assumptions could be inaccurate, and, therefore, there can be no assurance that these forward-looking statements will prove to be accurate and our actual results, performance and achievements may be materially different from that expressed or implied by these forward-looking statements. In light of the significant uncertainties inherent in these forward-looking statements, this information should not be regarded as a representation by Millrose or any other person that our objectives and plans, which we consider to be reasonable, will be achieved. Industry and Market Information This Presentation includes market and industry data and forecasts that the Company has derived from independent consultant reports, publicly available information, various industry publications, other published industry sources, and its internal data and estimates. Independent consultant reports, industry publications and other published industry sources generally indicate that the information contained therein was obtained from sources believed to be reliable. Although the Company believes that these third-party sources are reliable, it does not guarantee the accuracy or completeness of this information, and the Company has not independently verified this information. The Company’s internal data and estimates are based upon information obtained from trade and business organizations and other contacts in the markets in which the Company operates and management's understanding of industry conditions. Although the Company believes that such information is reliable, it has not had this information verified by any independent sources. In addition, the information contained in this Presentation is as of the date hereof (except where otherwise indicated), and the Company has no obligation to update such information, including in the event that such information becomes inaccurate or if estimates change. Subsequent materials may be provided by or on behalf of the Company in its discretion and such information may supplement, modify or supersede the information in these materials. Neither the Company, nor any of its respective affiliates, advisors or representatives shall have any liability whatsoever (in negligence or otherwise) for any loss or damage howsoever arising from any use of these materials or their contents or otherwise arising in connection with these materials.
Disclaimer (Cont’d) Basis of Presentation The financial information presented herein (i) for the periods prior to the February 7, 2025 spin-off from Lennar (the “Spin-Off”) is that of the business assets that were spun off to Millrose (the “Predecessor Millrose Business”) and is derived from the consolidated financial statements and accounting records of Lennar, and (ii) for the periods after the February 7, 2025 Spin-Off is that of Millrose and its subsidiaries. Millrose was formed on March 19, 2024 and has operated as an independent company since the Spin-Off on February 7, 2025. The Predecessor Millrose Business financial statements reflect the expenses directly attributable to the Predecessor Millrose Business, and, land inventory assets and liabilities included in the Spin-Off, at Lennar’s historical basis. The financial statements of the Predecessor Millrose Business may not be indicative of Millrose’s future performance as an independent, publicly traded company following the Spin-Off and do not necessarily reflect what the financial position, results of operations, and cash flows would have been had Millrose operated as a separate, publicly traded company during the periods presented. The financial information of the Predecessor Millrose Business prior to the Spin-Off also presents a combination of entities under common control that have been “carved out” from Lennar’s consolidated financial statements. Historically, financial statements of the Predecessor Millrose Business have not been prepared as it was not operated separately from Lennar. This financial information reflects the expenses of the Predecessor Millrose Business and includes certain assets and liabilities that have been included in the Spin-Off, which have been reflected at Lennar’s historical basis. Non-GAAP Measures This Presentation contains both financial measures prepared and presented in accordance with generally accepted accounting principles (“GAAP”) and non-GAAP financial measures, such as Invested Capital and Adjusted Funds from Operations (“AFFO”), which are measurements of financial performance that are not prepared and presented in accordance with GAAP. Accordingly, these measures should not be considered as substitutes for data prepared and presented in accordance with GAAP. Non-GAAP financial measures should not be construed as being more important than comparable GAAP measures. Although we use or have used these non-GAAP financial measures to assess the performance of our business and for the other purposes, the use of these non-GAAP financial measures as an analytical tool has limitations, and you should not consider them in isolation, or as a substitute for analysis of our results of operations as reported in accordance with GAAP. In addition, because not all companies use identical calculations, the non-GAAP financial measures included in this Presentation may not be comparable to similarly titled measures disclosed by other companies, including our peers or other companies in our industry. Please see “Appendix” within the Presentation for reconciliation of the non-GAAP financial measures included in this Presentation to our most directly comparable financial measure calculated and presented in accordance with GAAP.
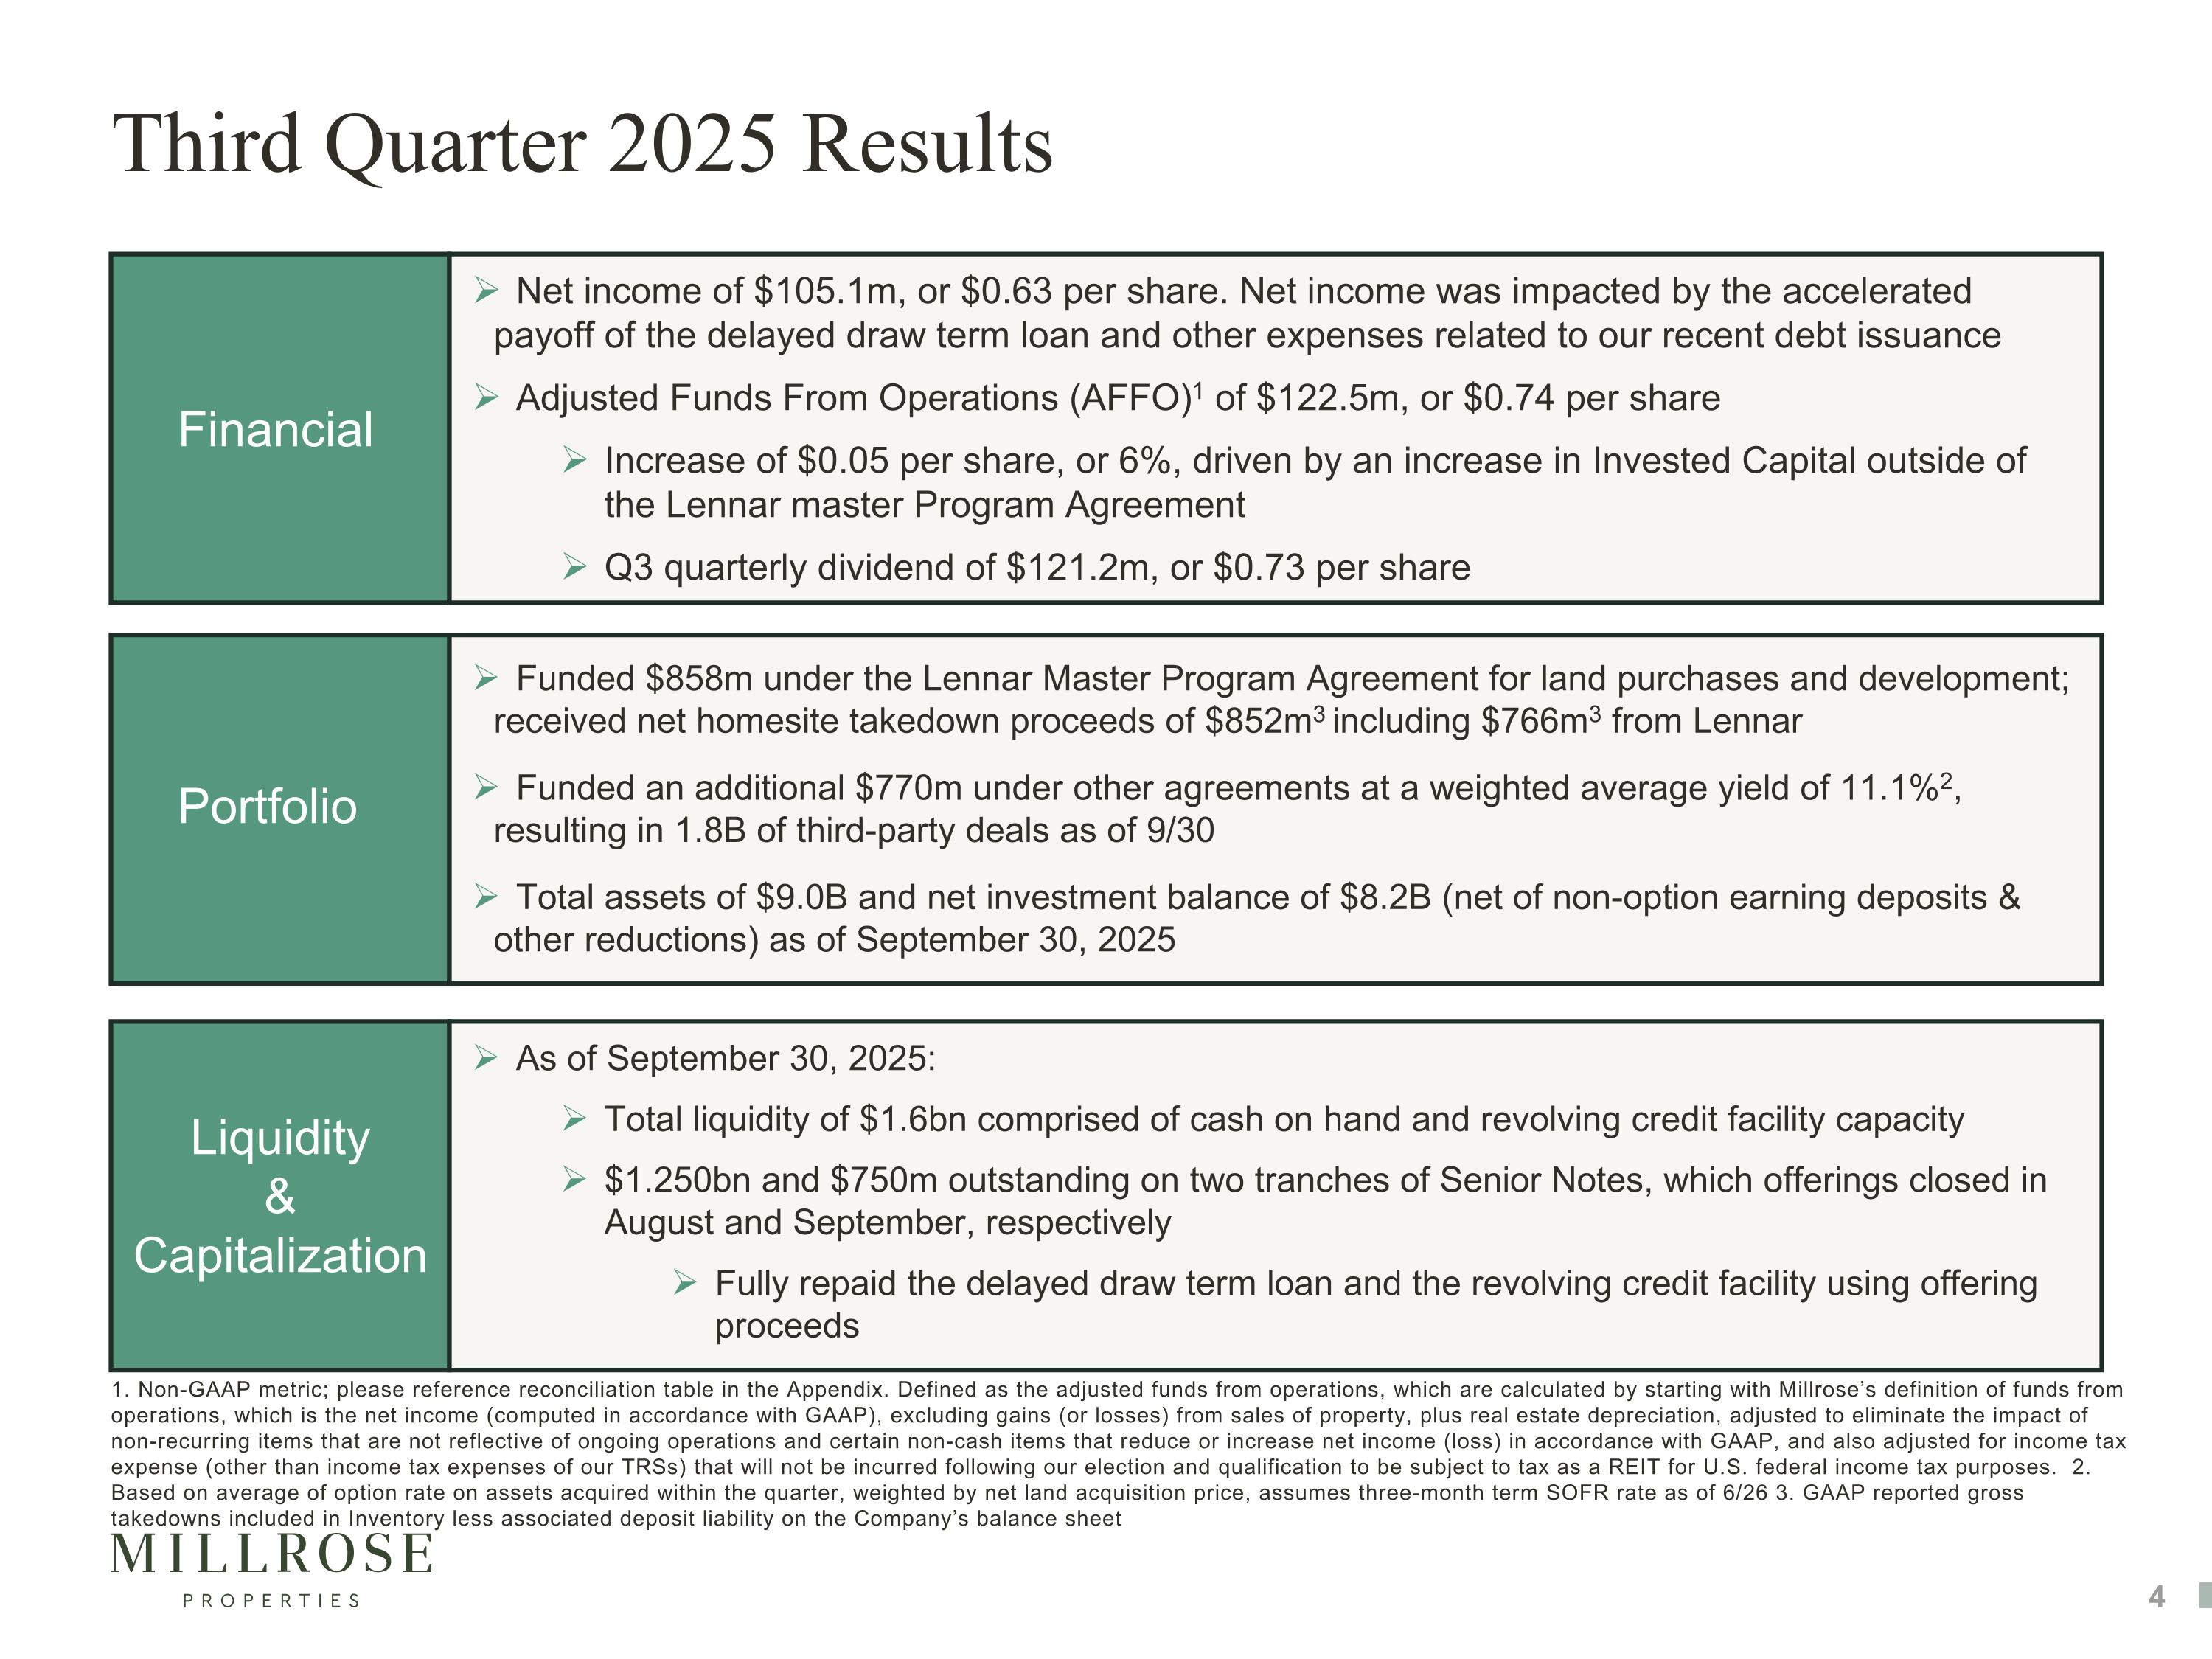
Third Quarter 2025 Results Financial Portfolio Liquidity & Capitalization Net income of $105.1m, or $0.63 per share. Net income was impacted by the accelerated payoff of the delayed draw term loan and other expenses related to our recent debt issuance Adjusted Funds From Operations (AFFO)1 of $122.5m, or $0.74 per share Increase of $0.05 per share, or 6%, driven by an increase in Invested Capital outside of the Lennar master Program Agreement Q3 quarterly dividend of $121.2m, or $0.73 per share Funded $858m under the Lennar Master Program Agreement for land purchases and development; received net homesite takedown proceeds of $852m3 including $766m3 from Lennar Funded an additional $770m under other agreements at a weighted average yield of 11.1%2, resulting in 1.8B of third-party deals as of 9/30 Total assets of $9.0B and net investment balance of $8.2B (net of non-option earning deposits & other reductions) as of September 30, 2025 As of September 30, 2025: Total liquidity of $1.6bn comprised of cash on hand and revolving credit facility capacity $1.250bn and $750m outstanding on two tranches of Senior Notes, which offerings closed in August and September, respectively Fully repaid the delayed draw term loan and the revolving credit facility using offering proceeds 1. Non-GAAP metric; please reference reconciliation table in the Appendix. Defined as the adjusted funds from operations, which are calculated by starting with Millrose’s definition of funds from operations, which is the net income (computed in accordance with GAAP), excluding gains (or losses) from sales of property, plus real estate depreciation, adjusted to eliminate the impact of non-recurring items that are not reflective of ongoing operations and certain non-cash items that reduce or increase net income (loss) in accordance with GAAP, and also adjusted for income tax expense (other than income tax expenses of our TRSs) that will not be incurred following our election and qualification to be subject to tax as a REIT for U.S. federal income tax purposes. 2. Based on average of option rate on assets acquired within the quarter, weighted by net land acquisition price, assumes three-month term SOFR rate as of 6/26 3. GAAP reported gross takedowns included in Inventory less associated deposit liability on the Company’s balance sheet
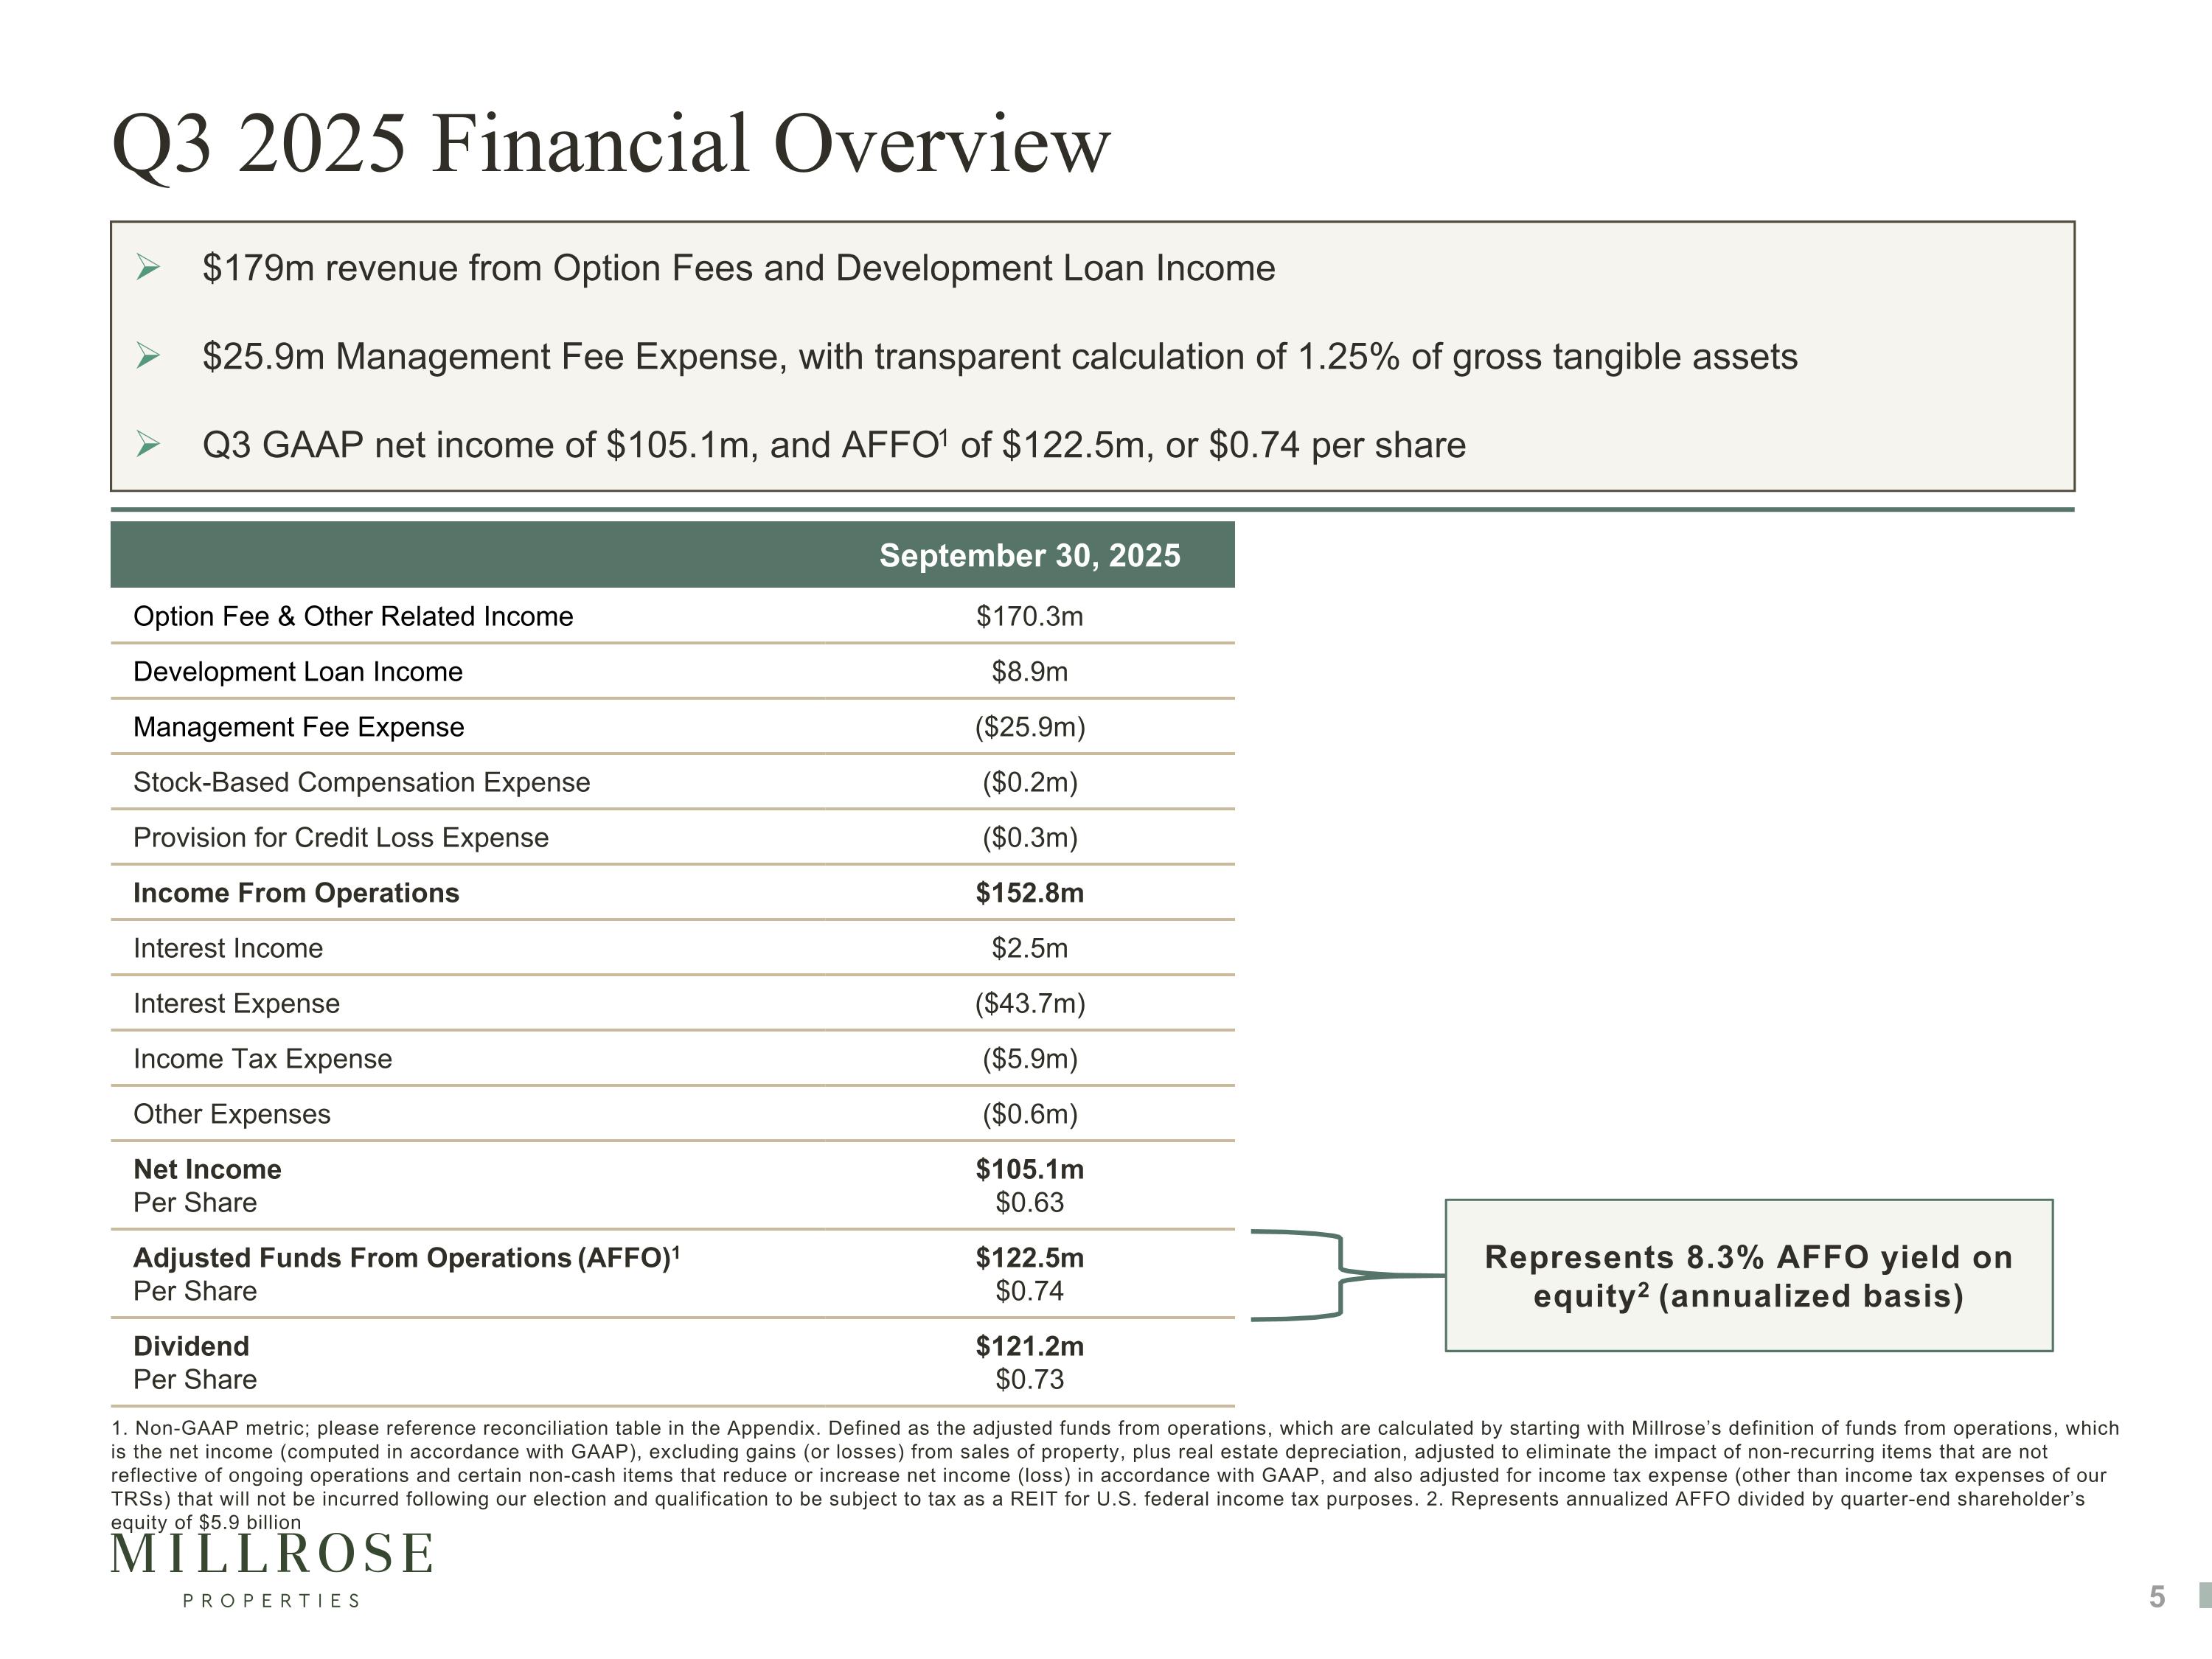
Q3 2025 Financial Overview September 30, 2025 Option Fee & Other Related Income $170.3m Development Loan Income $8.9m Management Fee Expense ($25.9m) Stock-Based Compensation Expense ($0.2m) Provision for Credit Loss Expense ($0.3m) Income From Operations $152.8m Interest Income $2.5m Interest Expense ($43.7m) Income Tax Expense ($5.9m) Other Expenses ($0.6m) Net Income Per Share $105.1m $0.63 Adjusted Funds From Operations (AFFO)1 Per Share $122.5m $0.74 Dividend Per Share $121.2m $0.73 $179m revenue from Option Fees and Development Loan Income $25.9m Management Fee Expense, with transparent calculation of 1.25% of gross tangible assets Q3 GAAP net income of $105.1m, and AFFO1 of $122.5m, or $0.74 per share 1. Non-GAAP metric; please reference reconciliation table in the Appendix. Defined as the adjusted funds from operations, which are calculated by starting with Millrose’s definition of funds from operations, which is the net income (computed in accordance with GAAP), excluding gains (or losses) from sales of property, plus real estate depreciation, adjusted to eliminate the impact of non-recurring items that are not reflective of ongoing operations and certain non-cash items that reduce or increase net income (loss) in accordance with GAAP, and also adjusted for income tax expense (other than income tax expenses of our TRSs) that will not be incurred following our election and qualification to be subject to tax as a REIT for U.S. federal income tax purposes. 2. Represents annualized AFFO divided by quarter-end shareholder’s equity of $5.9 billion Represents 8.3% AFFO yield on equity2 (annualized basis)
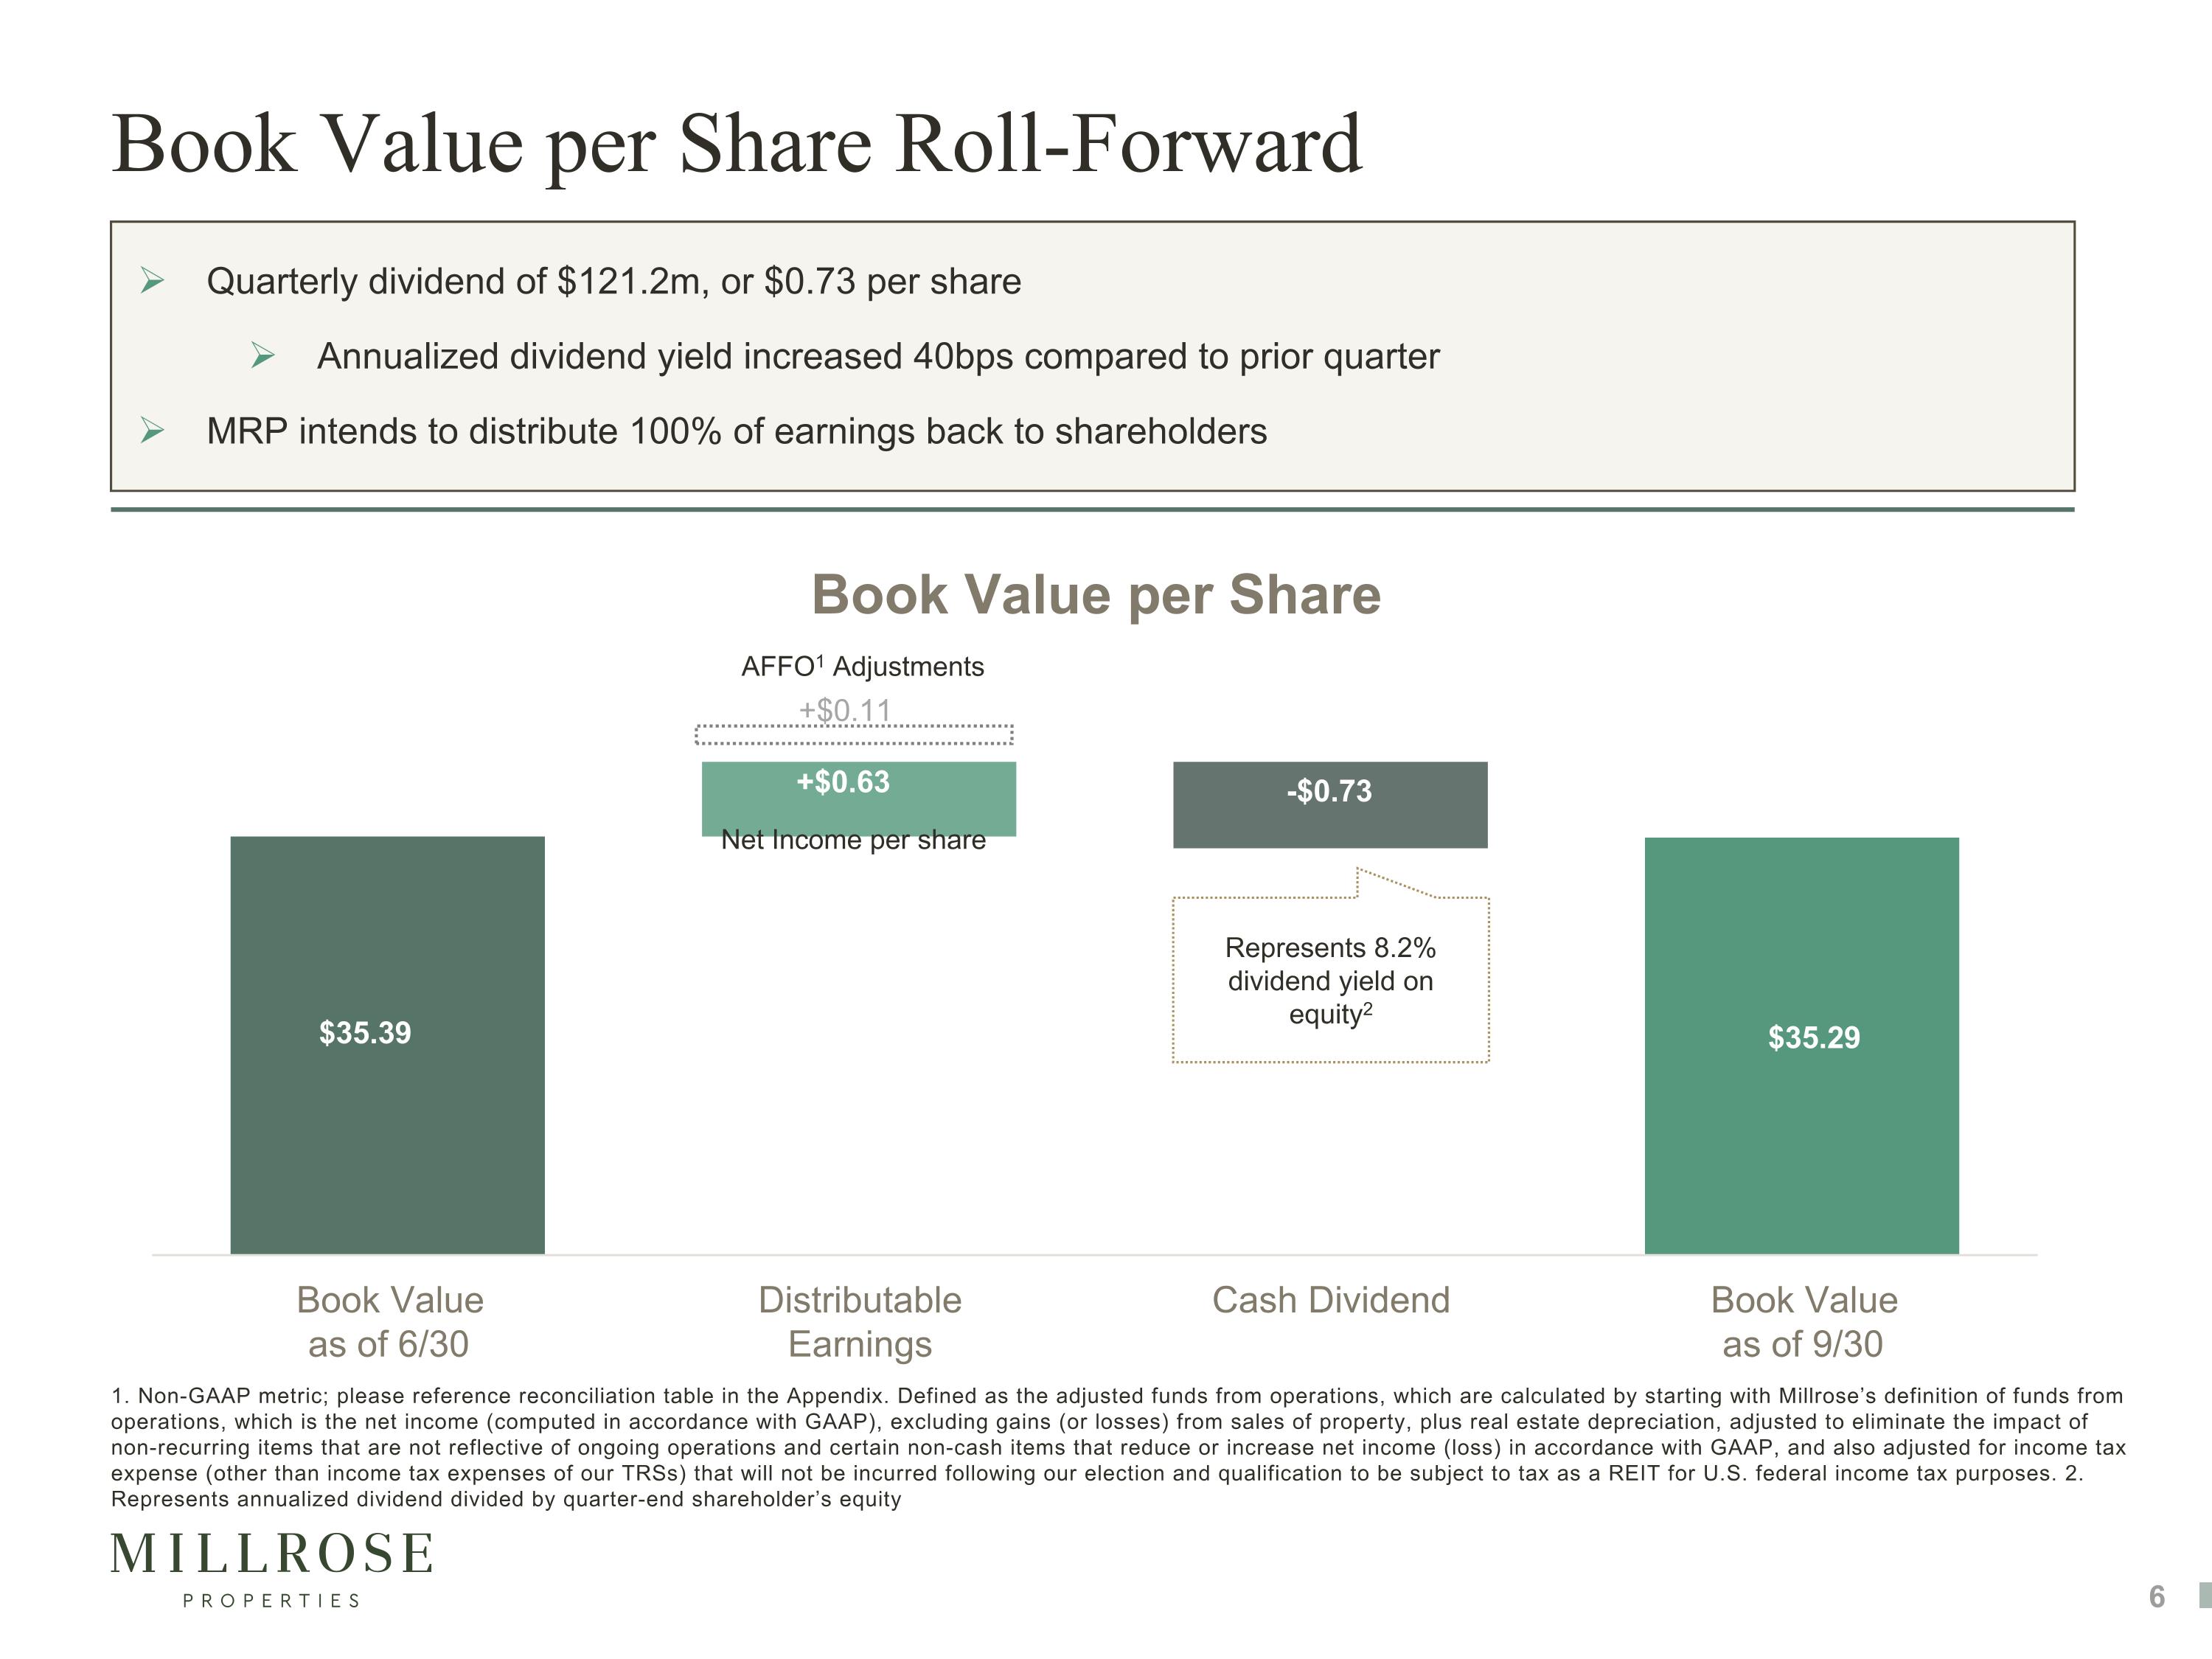
Book Value per Share Roll-Forward Quarterly dividend of $121.2m, or $0.73 per share Annualized dividend yield increased 40bps compared to prior quarter MRP intends to distribute 100% of earnings back to shareholders $35.39 +$0.63 -$0.73 $35.29 Represents 8.2% dividend yield on equity2 1. Non-GAAP metric; please reference reconciliation table in the Appendix. Defined as the adjusted funds from operations, which are calculated by starting with Millrose’s definition of funds from operations, which is the net income (computed in accordance with GAAP), excluding gains (or losses) from sales of property, plus real estate depreciation, adjusted to eliminate the impact of non-recurring items that are not reflective of ongoing operations and certain non-cash items that reduce or increase net income (loss) in accordance with GAAP, and also adjusted for income tax expense (other than income tax expenses of our TRSs) that will not be incurred following our election and qualification to be subject to tax as a REIT for U.S. federal income tax purposes. 2. Represents annualized dividend divided by quarter-end shareholder’s equity +$0.11 AFFO1 Adjustments Net Income per share
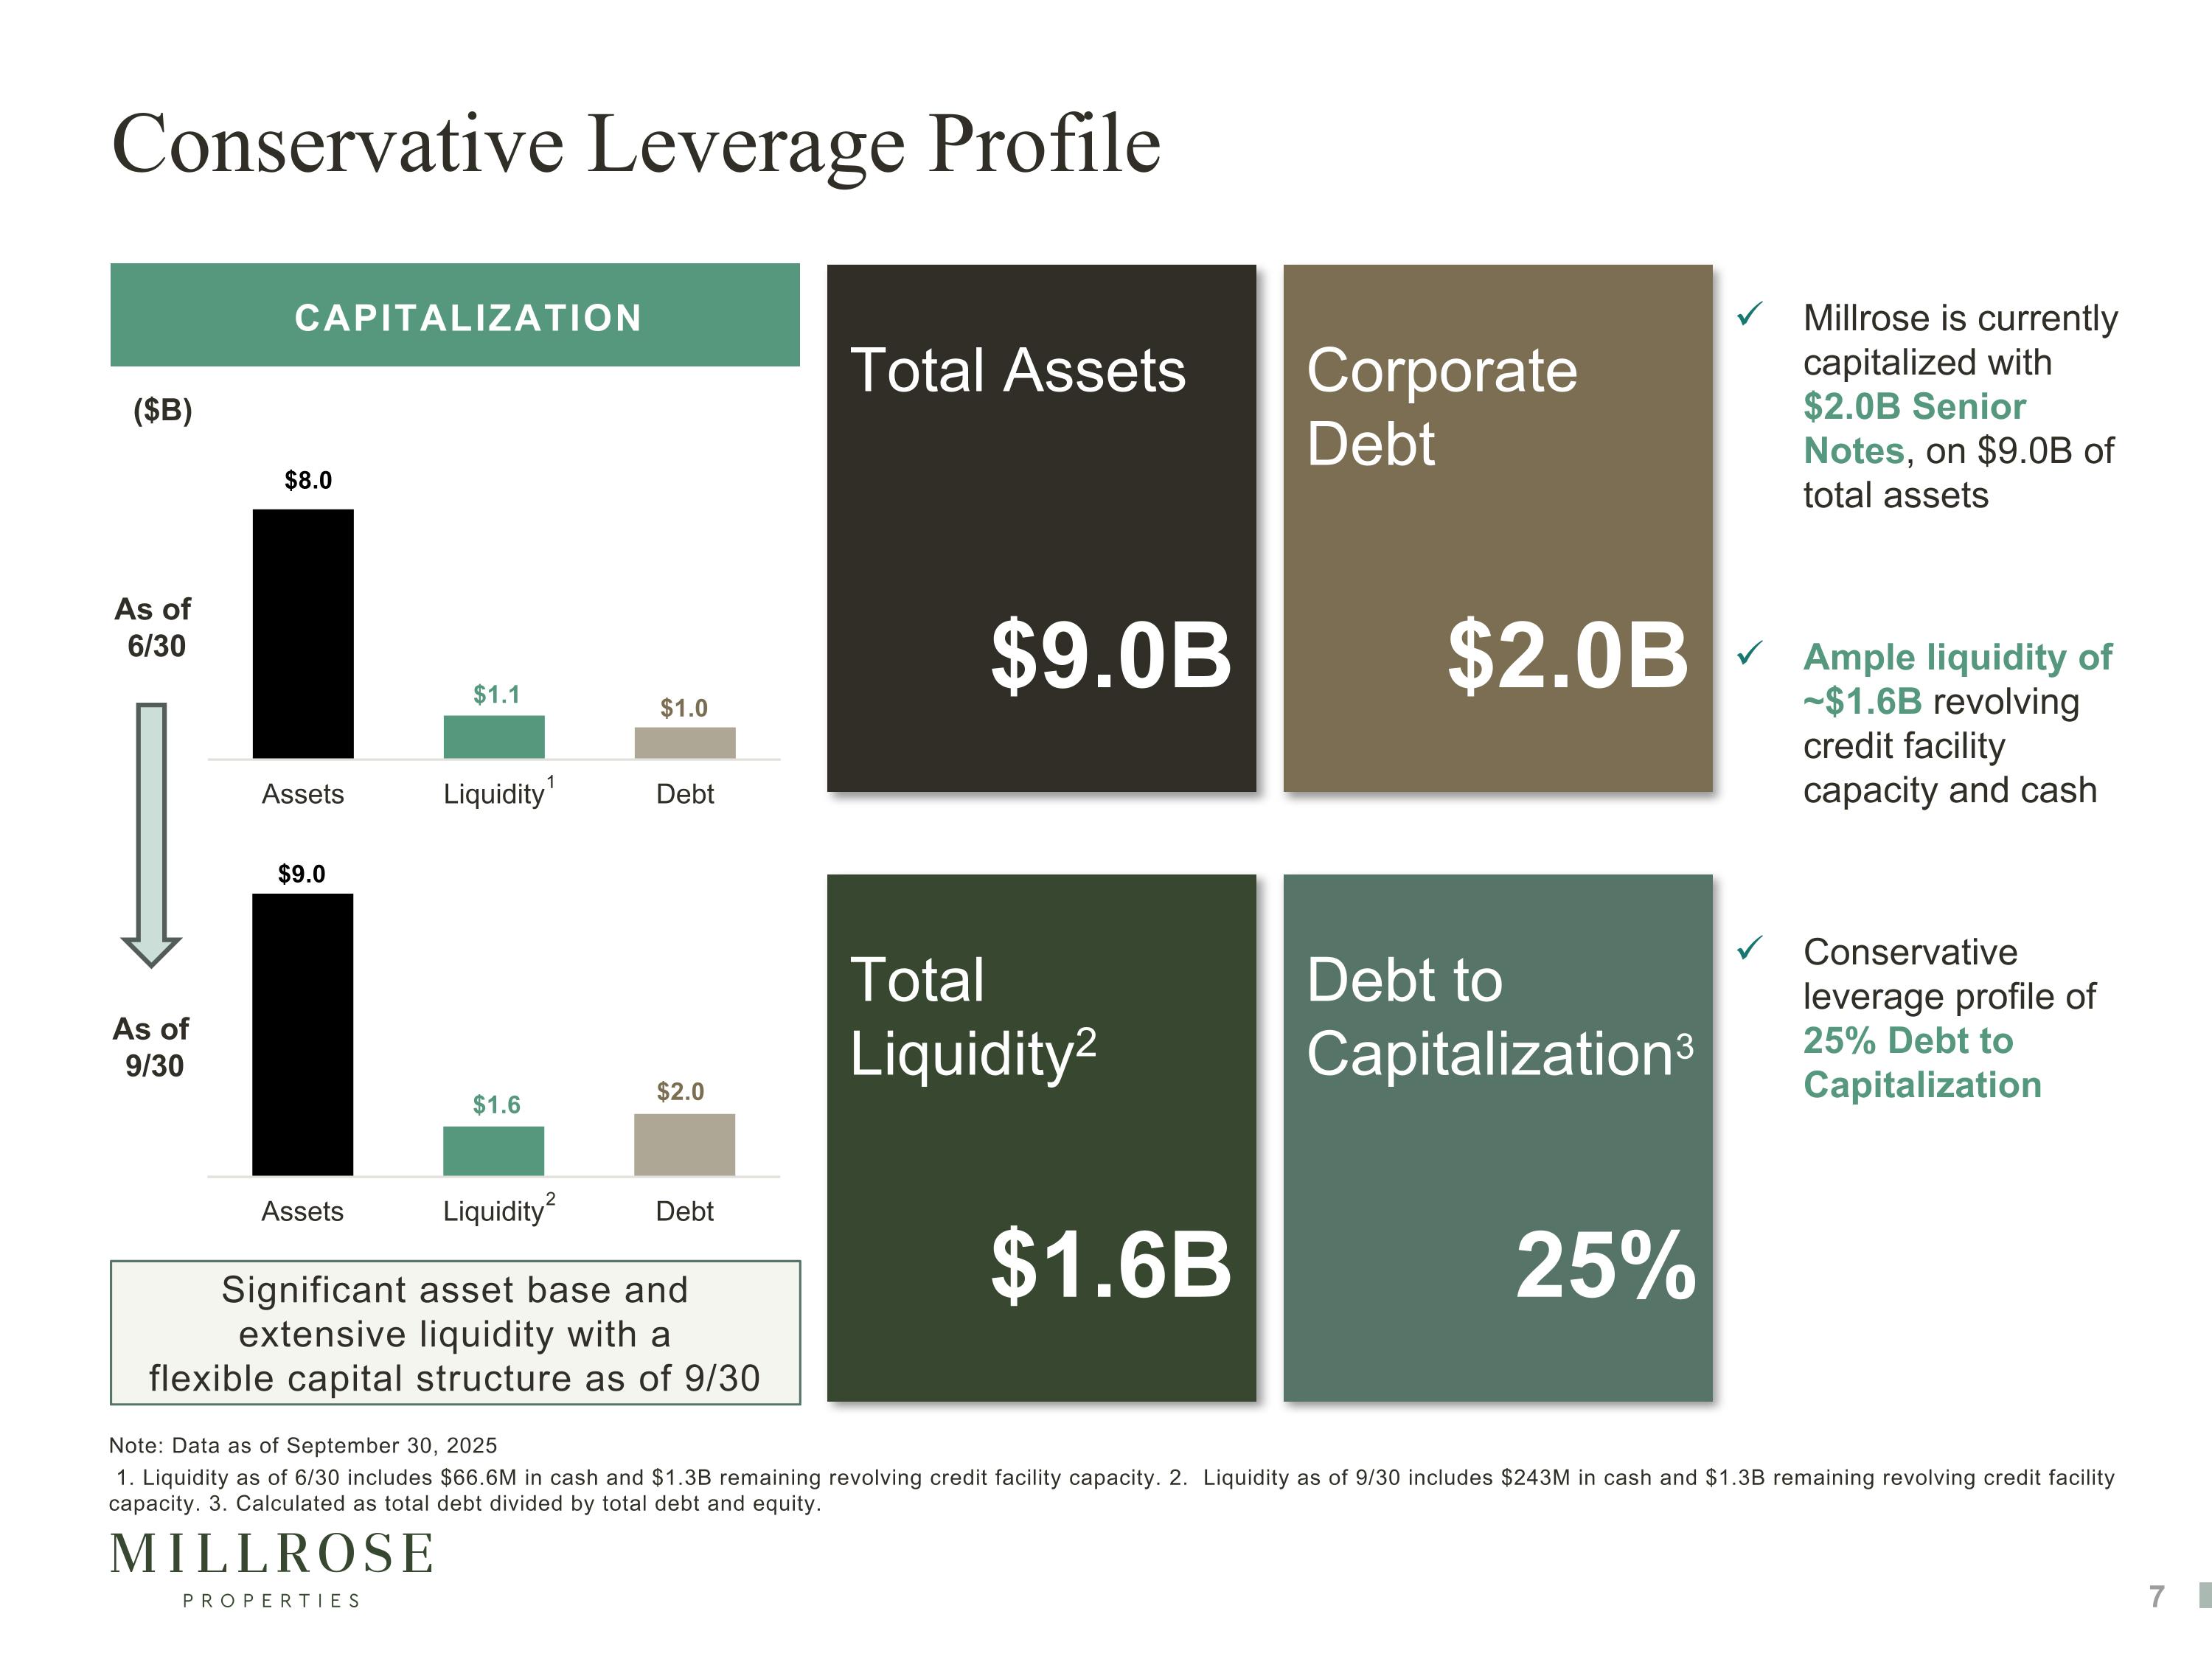
7 Millrose is currently capitalized with $2.0B Senior Notes, on $9.0B of total assets Ample liquidity of ~$1.6B revolving credit facility capacity and cash Conservative leverage profile of 25% Debt to Capitalization CAPITALIZATION Significant asset base and extensive liquidity with a flexible capital structure as of 9/30 ($B) Note: Data as of September 30, 2025 1. Liquidity as of 6/30 includes $66.6M in cash and $1.3B remaining revolving credit facility capacity. 2. Liquidity as of 9/30 includes $243M in cash and $1.3B remaining revolving credit facility capacity. 3. Calculated as total debt divided by total debt and equity. As of 9/30 2 Conservative Leverage Profile Total Assets Corporate Debt Total Liquidity2 Debt to Capitalization3 $2.0B 25% $9.0B $1.6B As of 6/30 1
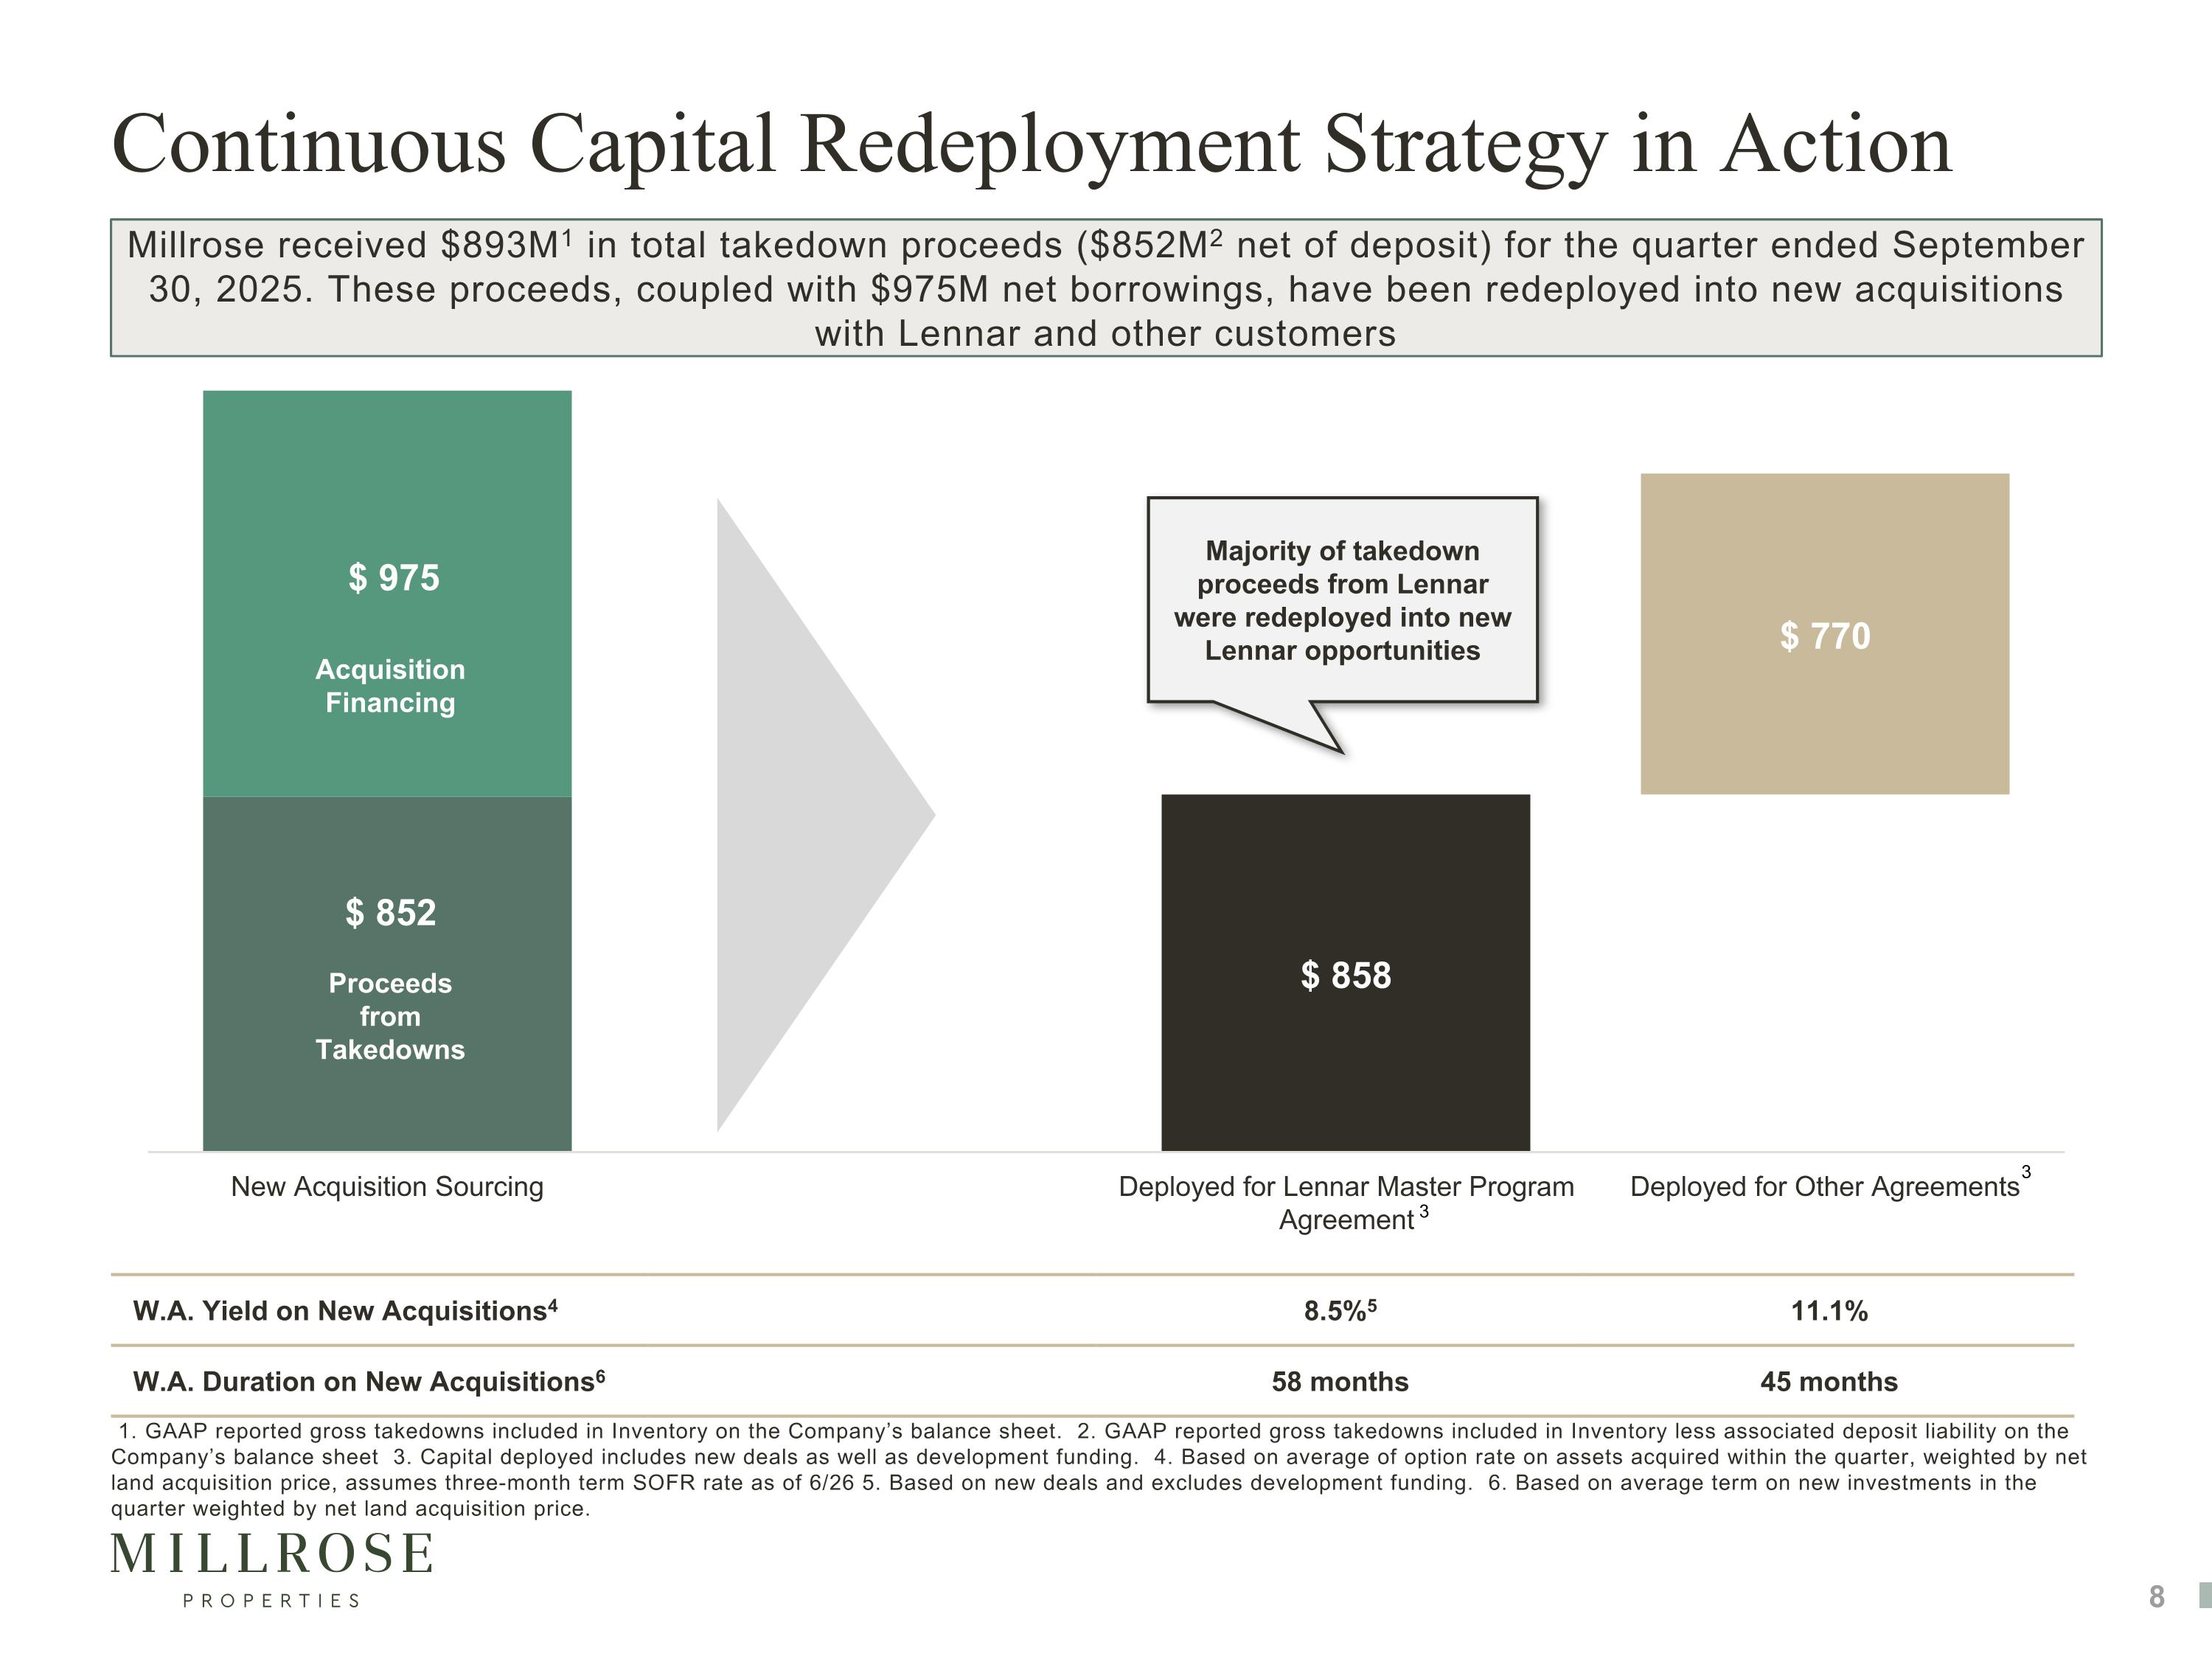
1. GAAP reported gross takedowns included in Inventory on the Company’s balance sheet. 2. GAAP reported gross takedowns included in Inventory less associated deposit liability on the Company’s balance sheet 3. Capital deployed includes new deals as well as development funding. 4. Based on average of option rate on assets acquired within the quarter, weighted by net land acquisition price, assumes three-month term SOFR rate as of 6/26 5. Based on new deals and excludes development funding. 6. Based on average term on new investments in the quarter weighted by net land acquisition price. Continuous Capital Redeployment Strategy in Action Millrose received $893M1 in total takedown proceeds ($852M2 net of deposit) for the quarter ended September 30, 2025. These proceeds, coupled with $975M net borrowings, have been redeployed into new acquisitions with Lennar and other customers W.A. Yield on New Acquisitions4 8.5%5 11.1% W.A. Duration on New Acquisitions6 58 months 45 months Majority of takedown proceeds from Lennar were redeployed into new Lennar opportunities Acquisition Financing Proceeds from Takedowns 3 3
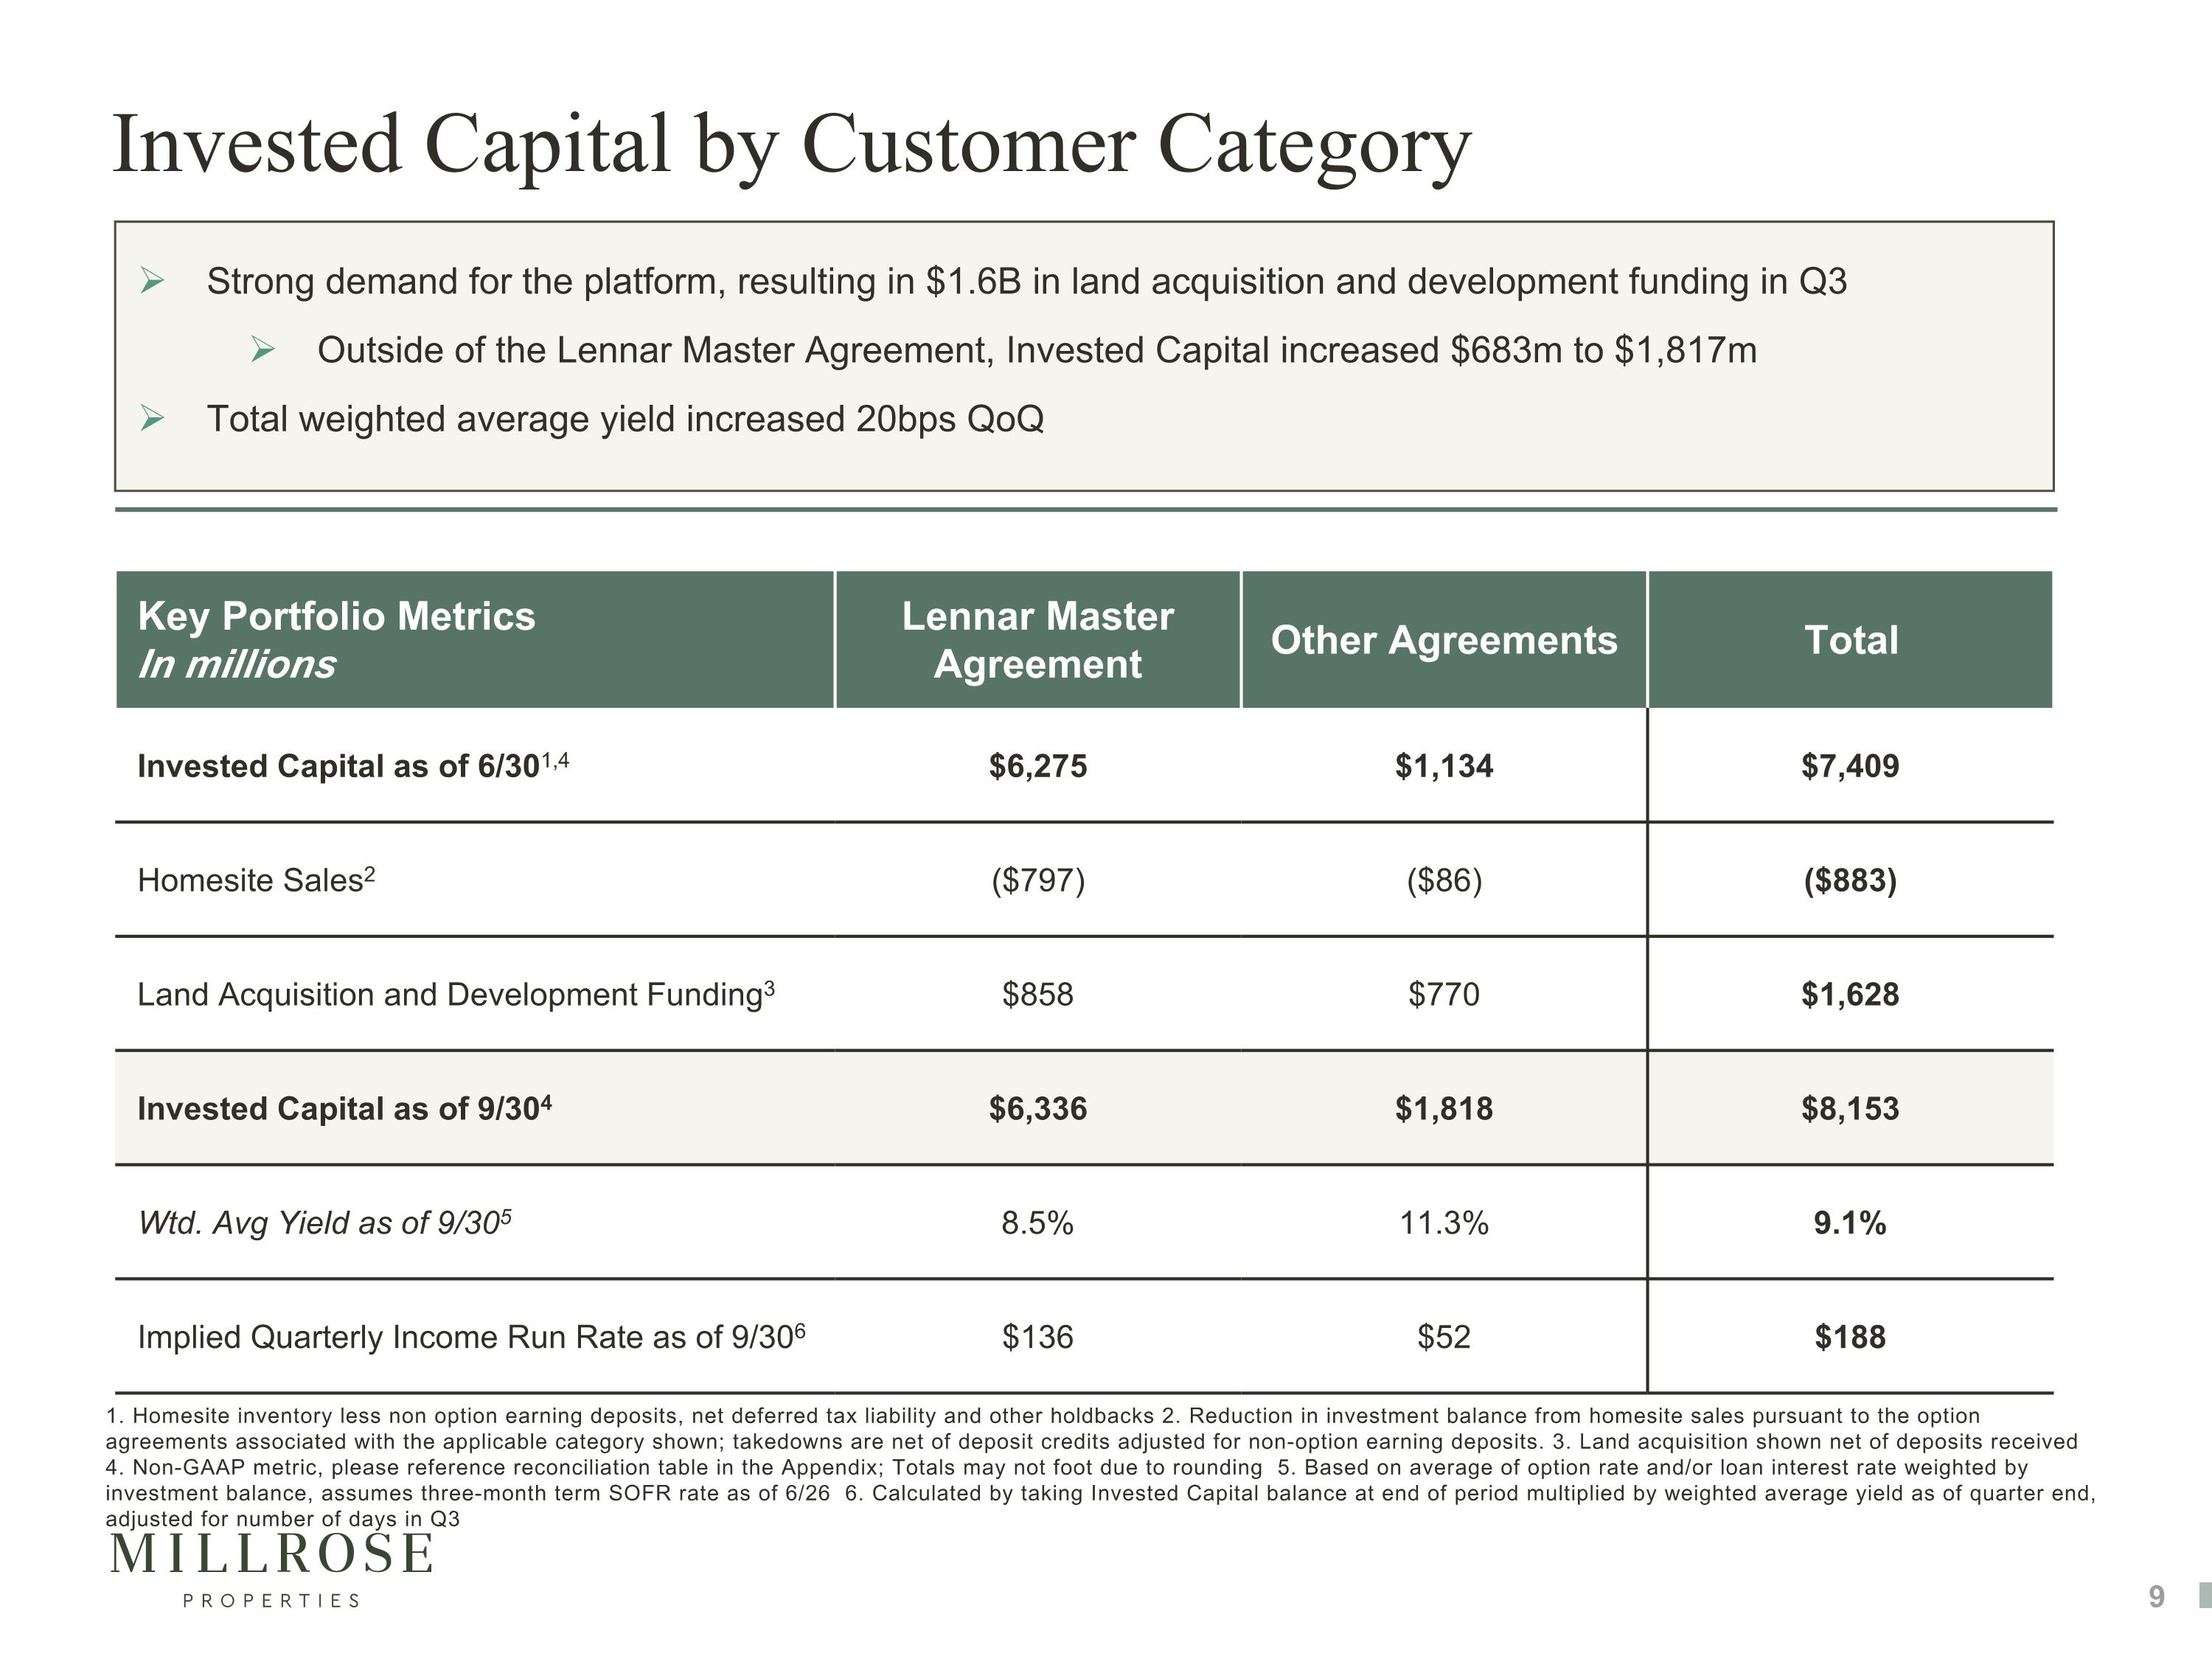
Invested Capital by Customer Category Key Portfolio Metrics In millions Lennar Master Agreement Other Agreements Total Invested Capital as of 6/301,4 $6,275 $1,134 $7,409 Homesite Sales2 ($797) ($86) ($883) Land Acquisition and Development Funding3 $858 $770 $1,628 Invested Capital as of 9/304 $6,336 $1,818 $8,153 Wtd. Avg Yield as of 9/305 8.5% 11.3% 9.1% Implied Quarterly Income Run Rate as of 9/306 $136 $52 $188 Strong demand for the platform, resulting in $1.6B in land acquisition and development funding in Q3 Outside of the Lennar Master Agreement, Invested Capital increased $683m to $1,817m Total weighted average yield increased 20bps QoQ 1. Homesite inventory less non option earning deposits, net deferred tax liability and other holdbacks 2. Reduction in investment balance from homesite sales pursuant to the option agreements associated with the applicable category shown; takedowns are net of deposit credits adjusted for non-option earning deposits. 3. Land acquisition shown net of deposits received 4. Non-GAAP metric, please reference reconciliation table in the Appendix; Totals may not foot due to rounding 5. Based on average of option rate and/or loan interest rate weighted by investment balance, assumes three-month term SOFR rate as of 6/26 6. Calculated by taking Invested Capital balance at end of period multiplied by weighted average yield as of quarter end, adjusted for number of days in Q3
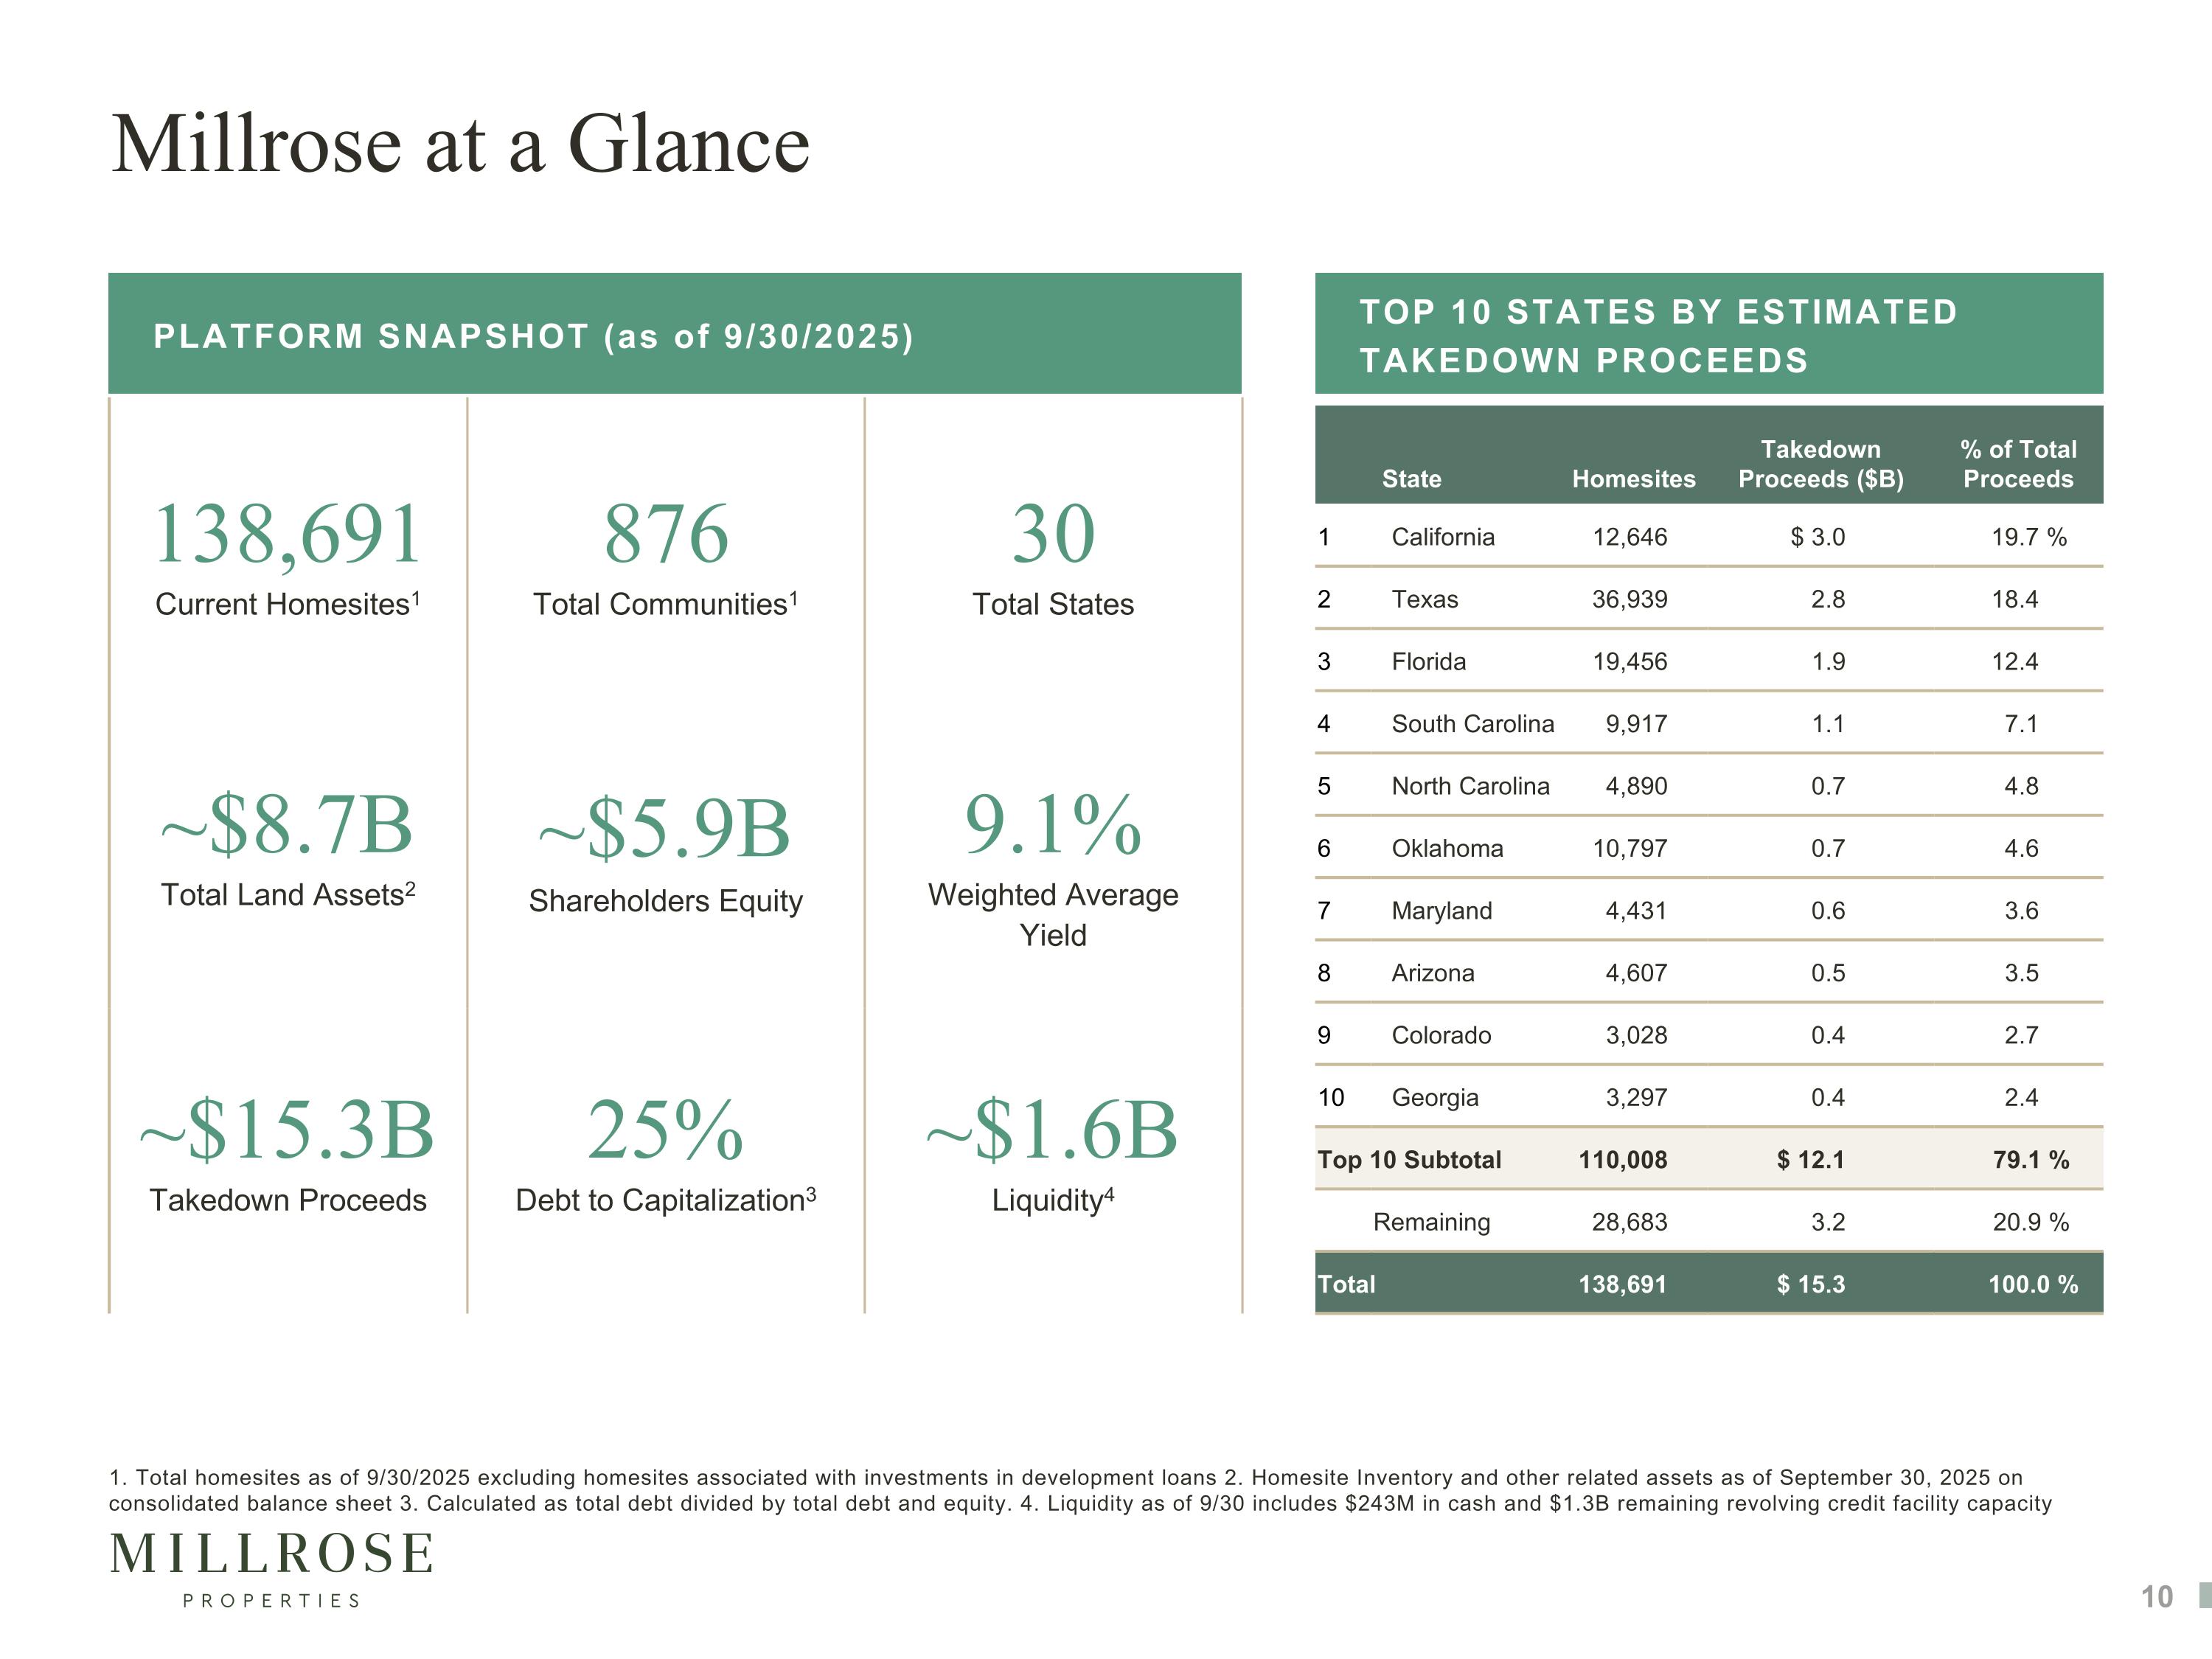
138,691 Current Homesites1 876 Total Communities1 30 Total States ~$8.7B Total Land Assets2 ~$5.9B Shareholders Equity 9.1% Weighted Average Yield ~$15.3B Takedown Proceeds 25% Debt to Capitalization3 ~$1.6B Liquidity4 1. Total homesites as of 9/30/2025 excluding homesites associated with investments in development loans 2. Homesite Inventory and other related assets as of September 30, 2025 on consolidated balance sheet 3. Calculated as total debt divided by total debt and equity. 4. Liquidity as of 9/30 includes $243M in cash and $1.3B remaining revolving credit facility capacity PLATFORM SNAPSHOT (as of 9/30/2025) Millrose at a Glance State Homesites Takedown Proceeds ($B) % of Total Proceeds 1 California 12,646 $ 3.0 19.7 % 2 Texas 36,939 2.8 18.4 3 Florida 19,456 1.9 12.4 4 South Carolina 9,917 1.1 7.1 5 North Carolina 4,890 0.7 4.8 6 Oklahoma 10,797 0.7 4.6 7 Maryland 4,431 0.6 3.6 8 Arizona 4,607 0.5 3.5 9 Colorado 3,028 0.4 2.7 10 Georgia 3,297 0.4 2.4 Top 10 Subtotal 110,008 $ 12.1 79.1 % Remaining 28,683 3.2 20.9 % Total 138,691 $ 15.3 100.0 % TOP 10 STATES BY ESTIMATED TAKEDOWN PROCEEDS
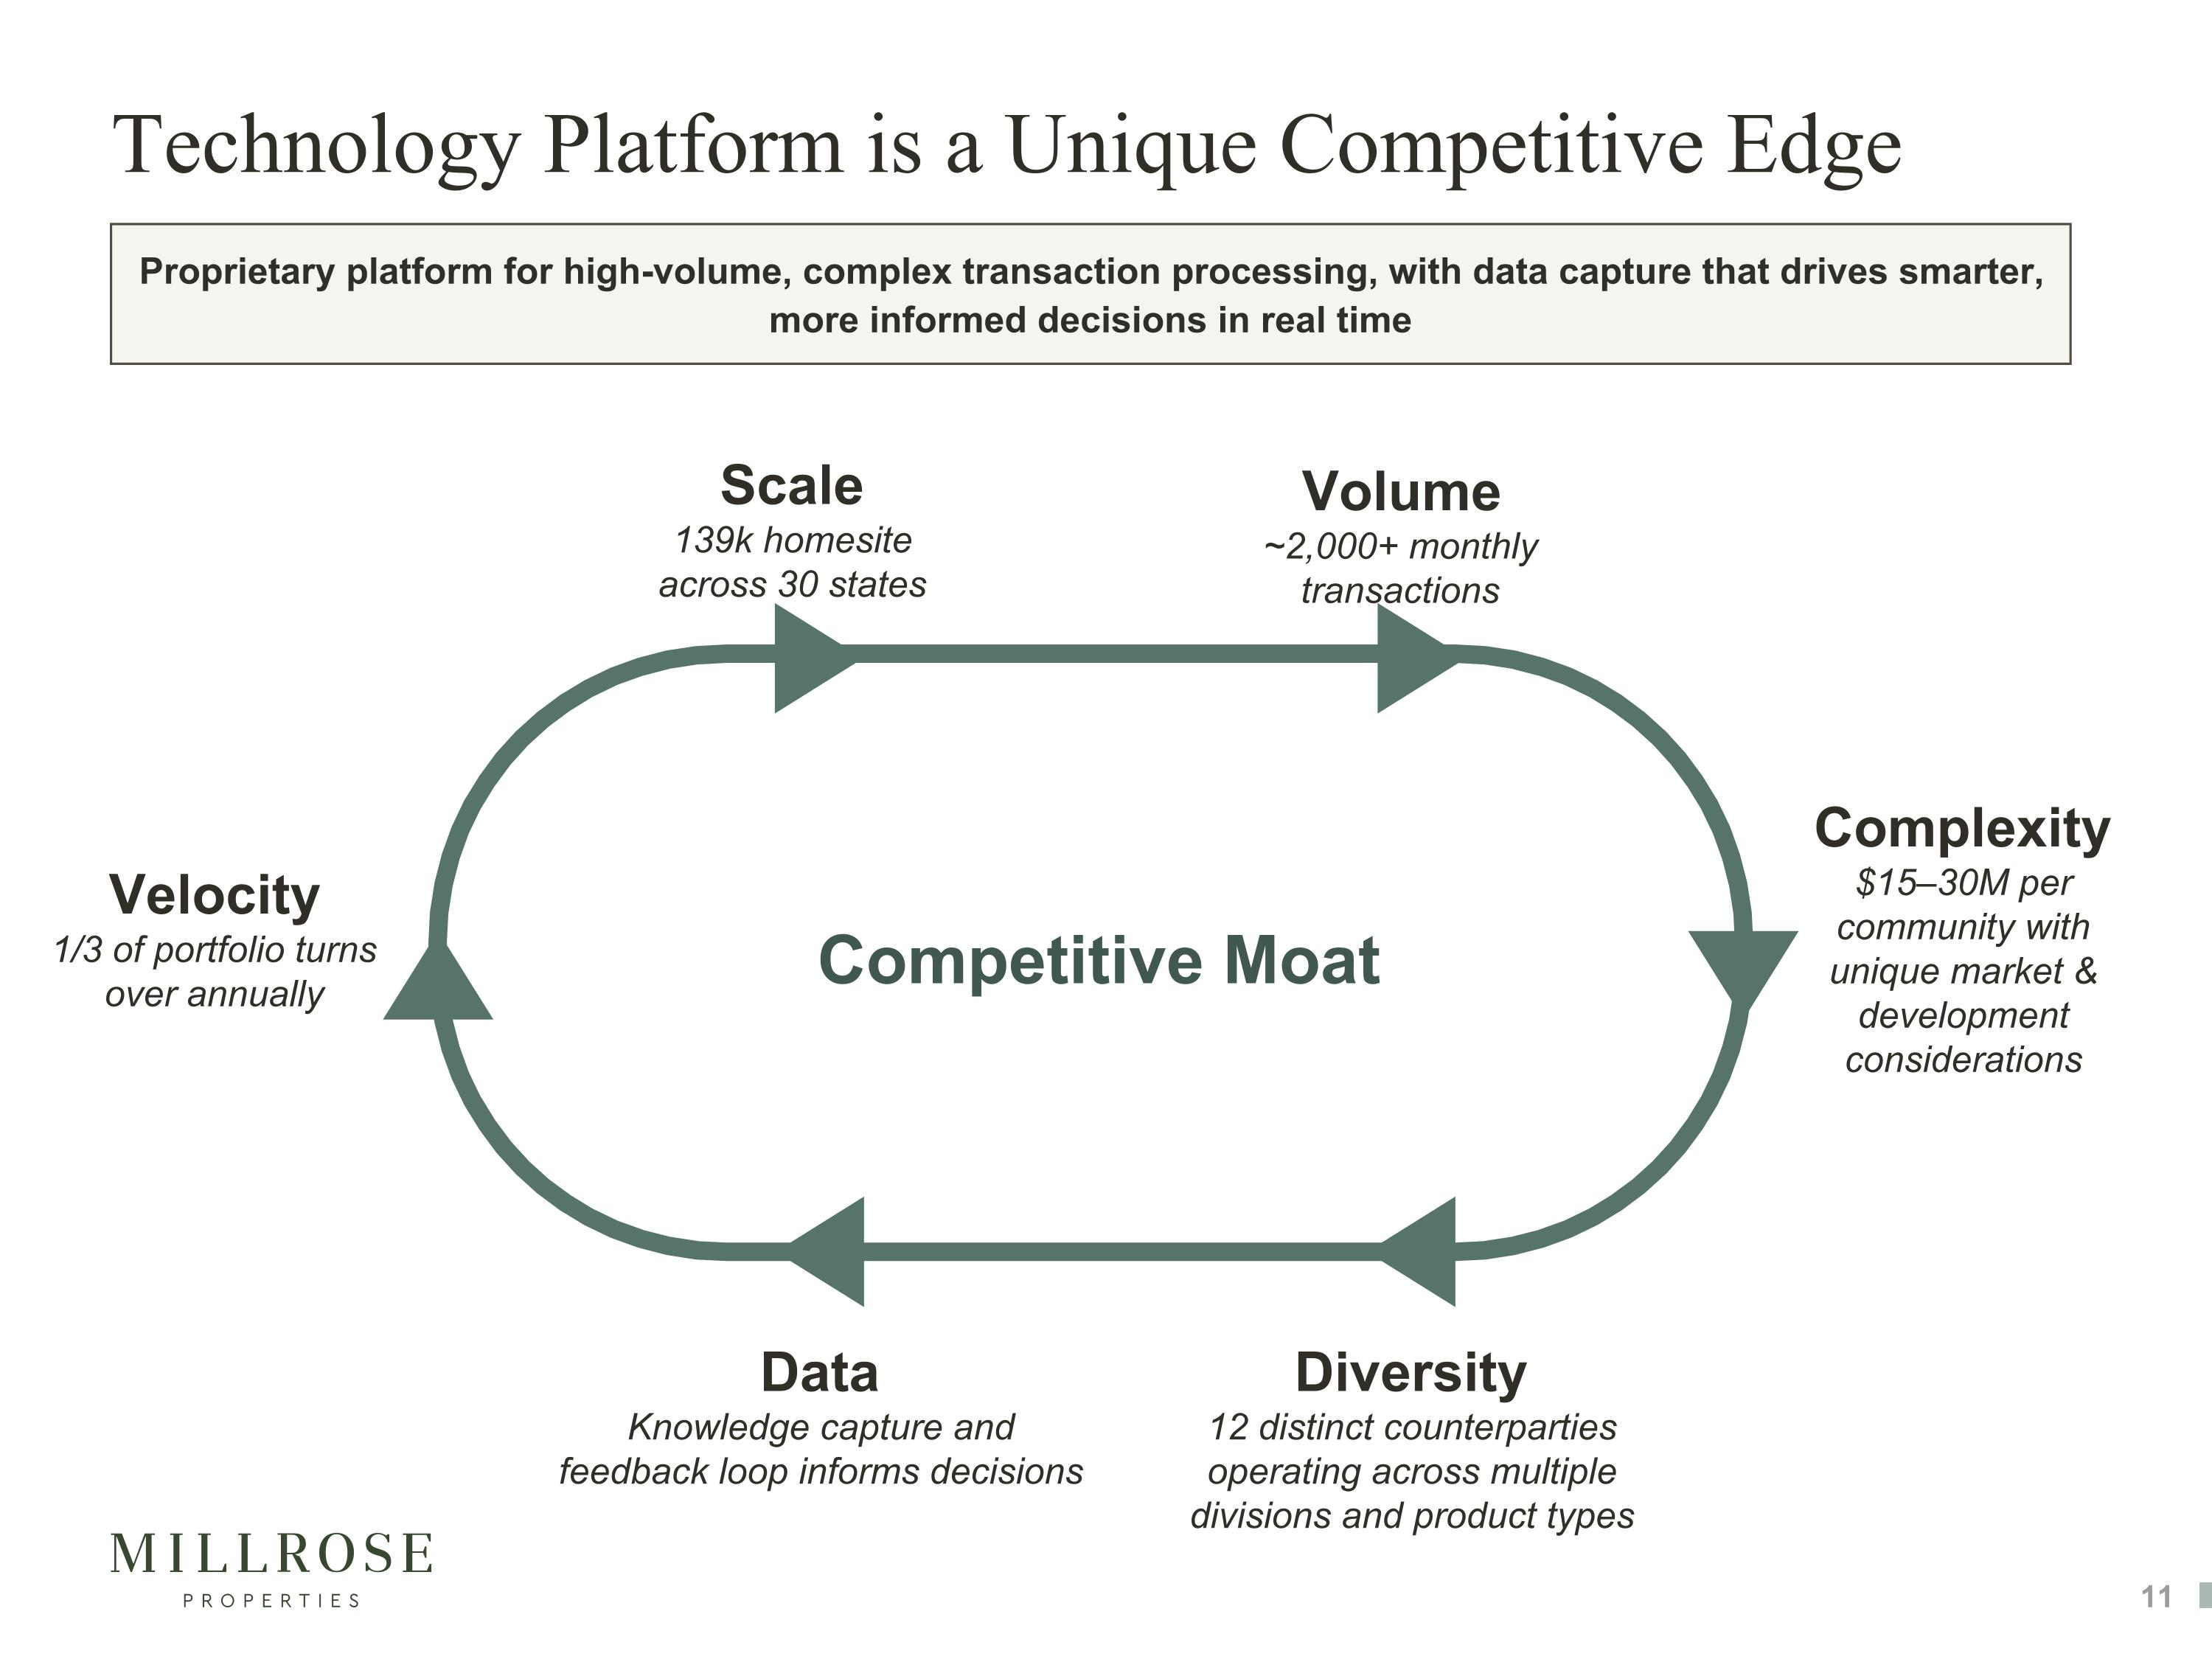
Technology Platform is a Unique Competitive Edge Proprietary platform for high-volume, complex transaction processing, with data capture that drives smarter, more informed decisions in real time Volume ~2,000+ monthly transactions Velocity 1/3 of portfolio turns over annually Complexity $15–30M per community with unique market & development considerations Diversity 12 distinct counterparties operating across multiple divisions and product types Scale 139k homesite across 30 states Competitive Moat Data Knowledge capture and feedback loop informs decisions
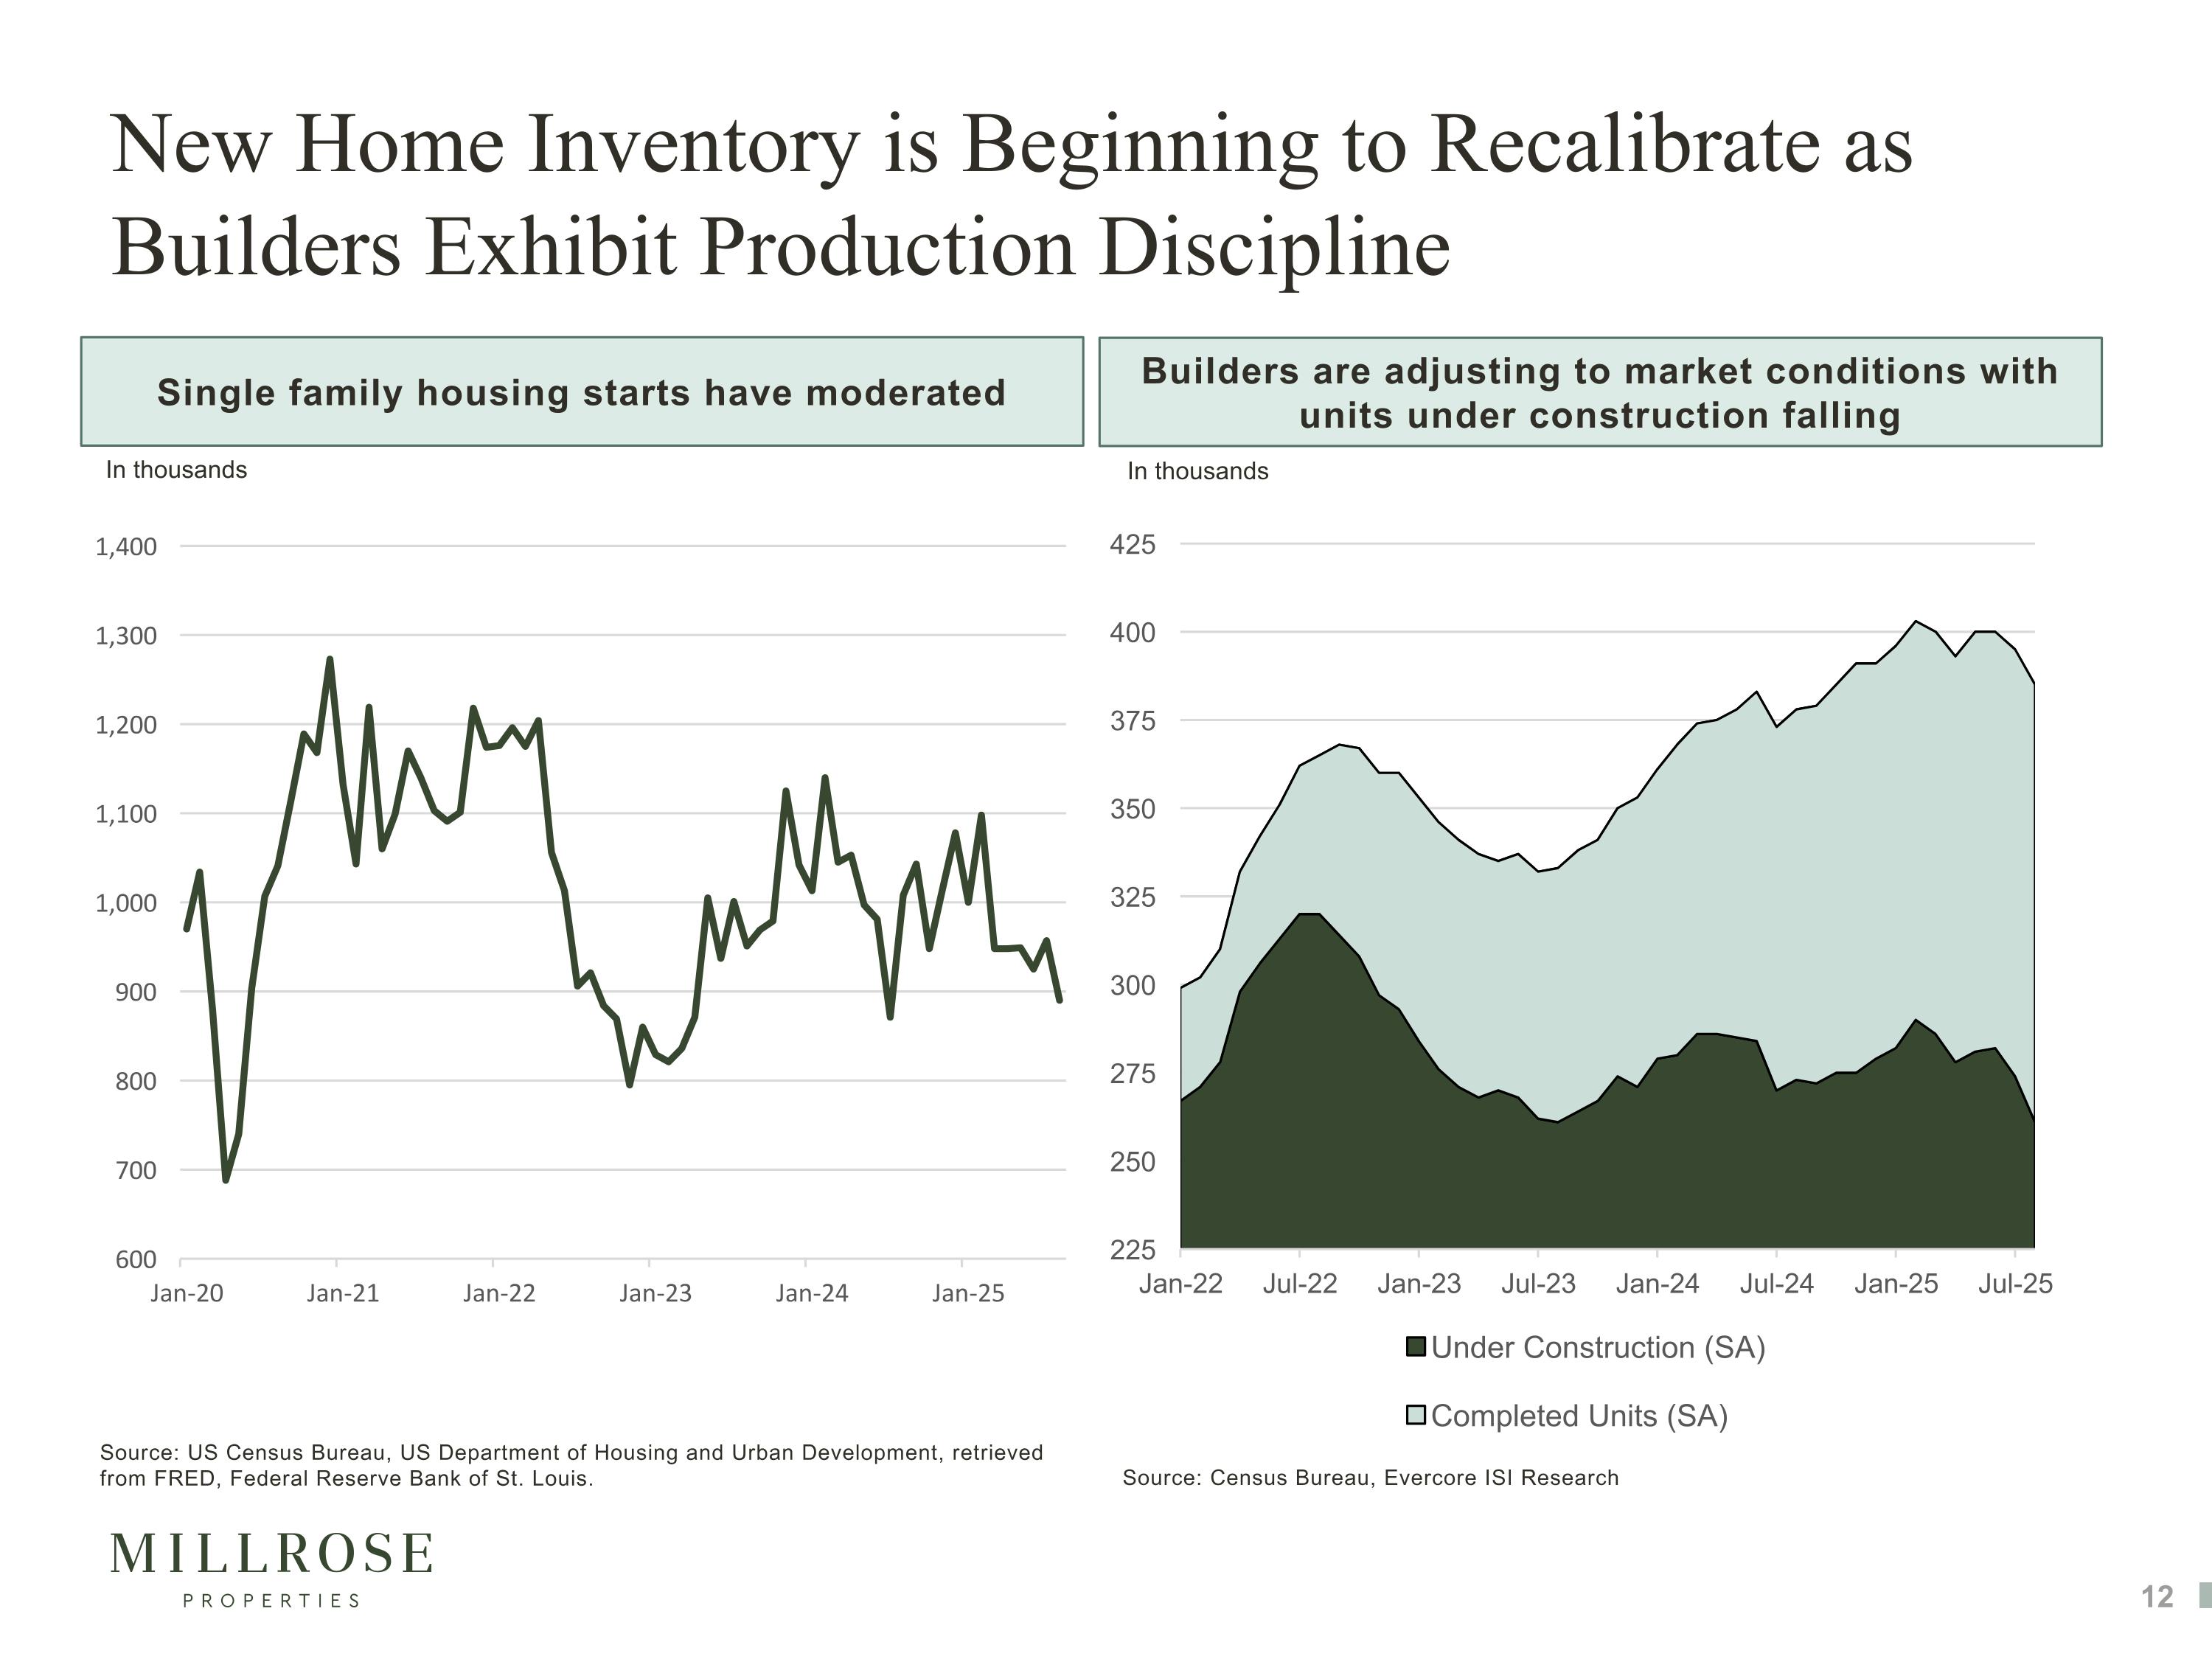
New Home Inventory is Beginning to Recalibrate as Builders Exhibit Production Discipline Single family housing starts have moderated Builders are adjusting to market conditions with units under construction falling Source: Census Bureau, Evercore ISI Research In thousands In thousands Source: US Census Bureau, US Department of Housing and Urban Development, retrieved from FRED, Federal Reserve Bank of St. Louis.
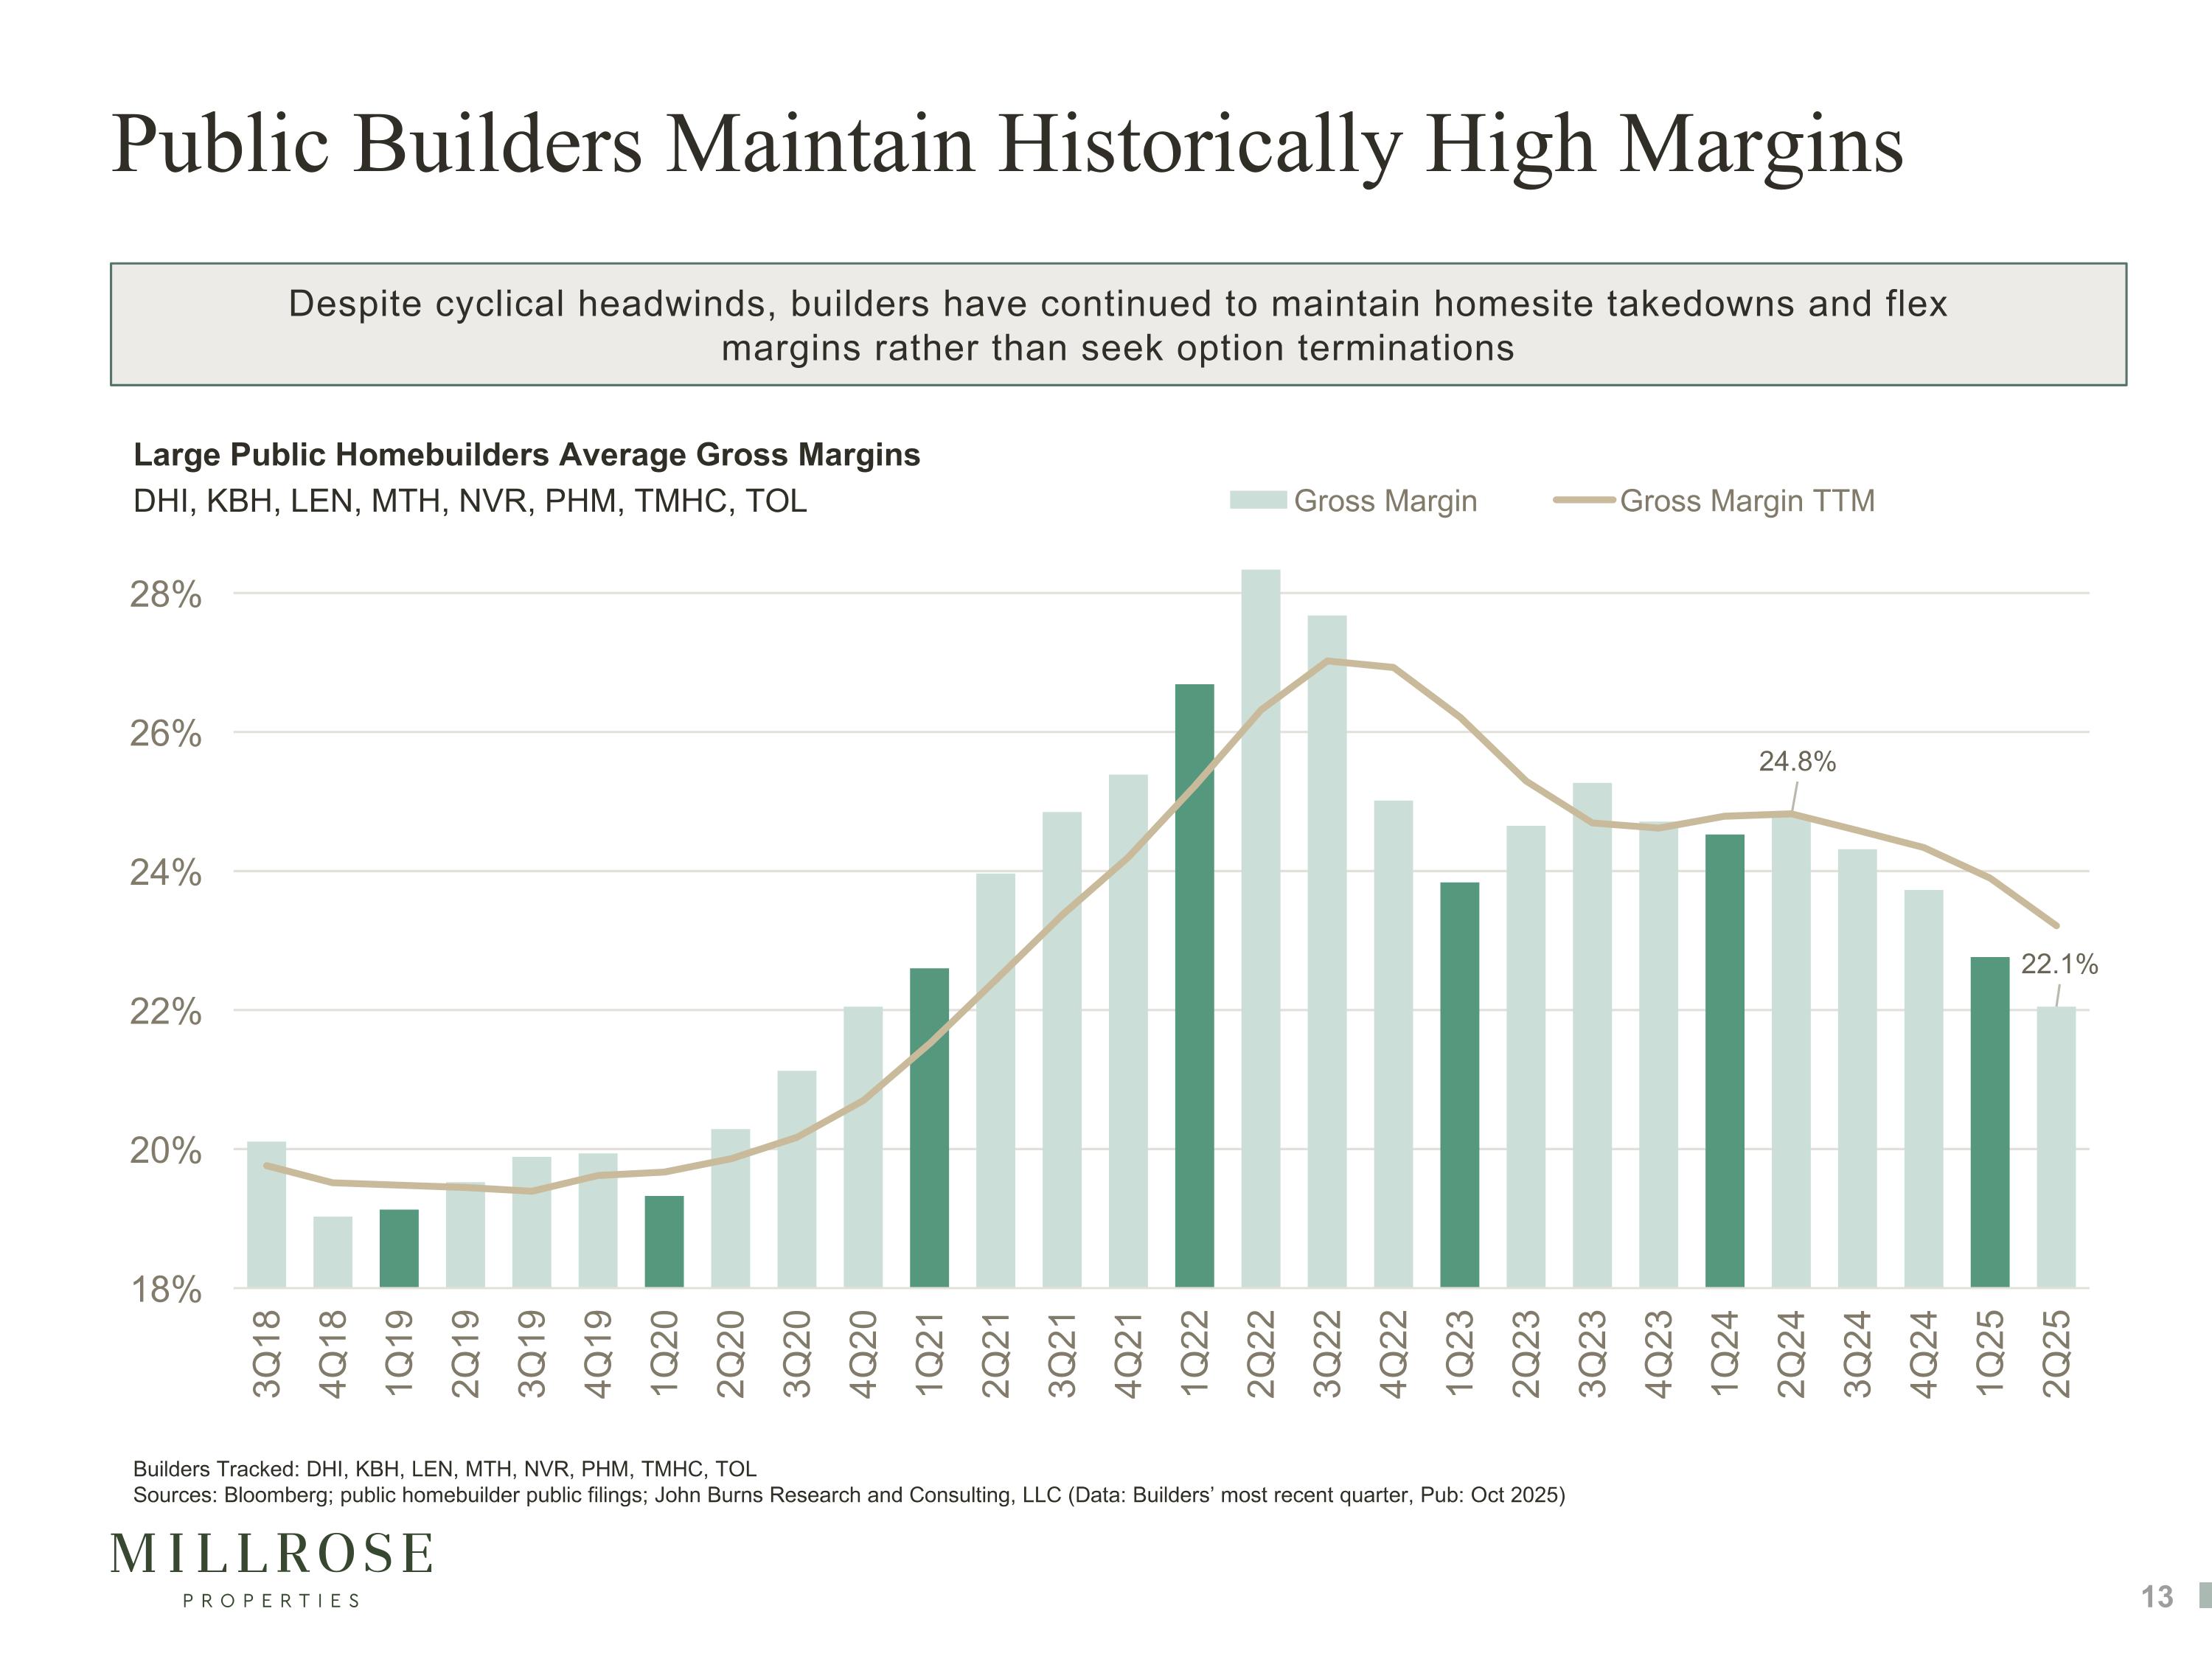
Public Builders Maintain Historically High Margins Despite cyclical headwinds, builders have continued to maintain homesite takedowns and flex margins rather than seek option terminations Large Public Homebuilders Average Gross Margins DHI, KBH, LEN, MTH, NVR, PHM, TMHC, TOL Builders Tracked: DHI, KBH, LEN, MTH, NVR, PHM, TMHC, TOL Sources: Bloomberg; public homebuilder public filings; John Burns Research and Consulting, LLC (Data: Builders’ most recent quarter, Pub: Oct 2025)
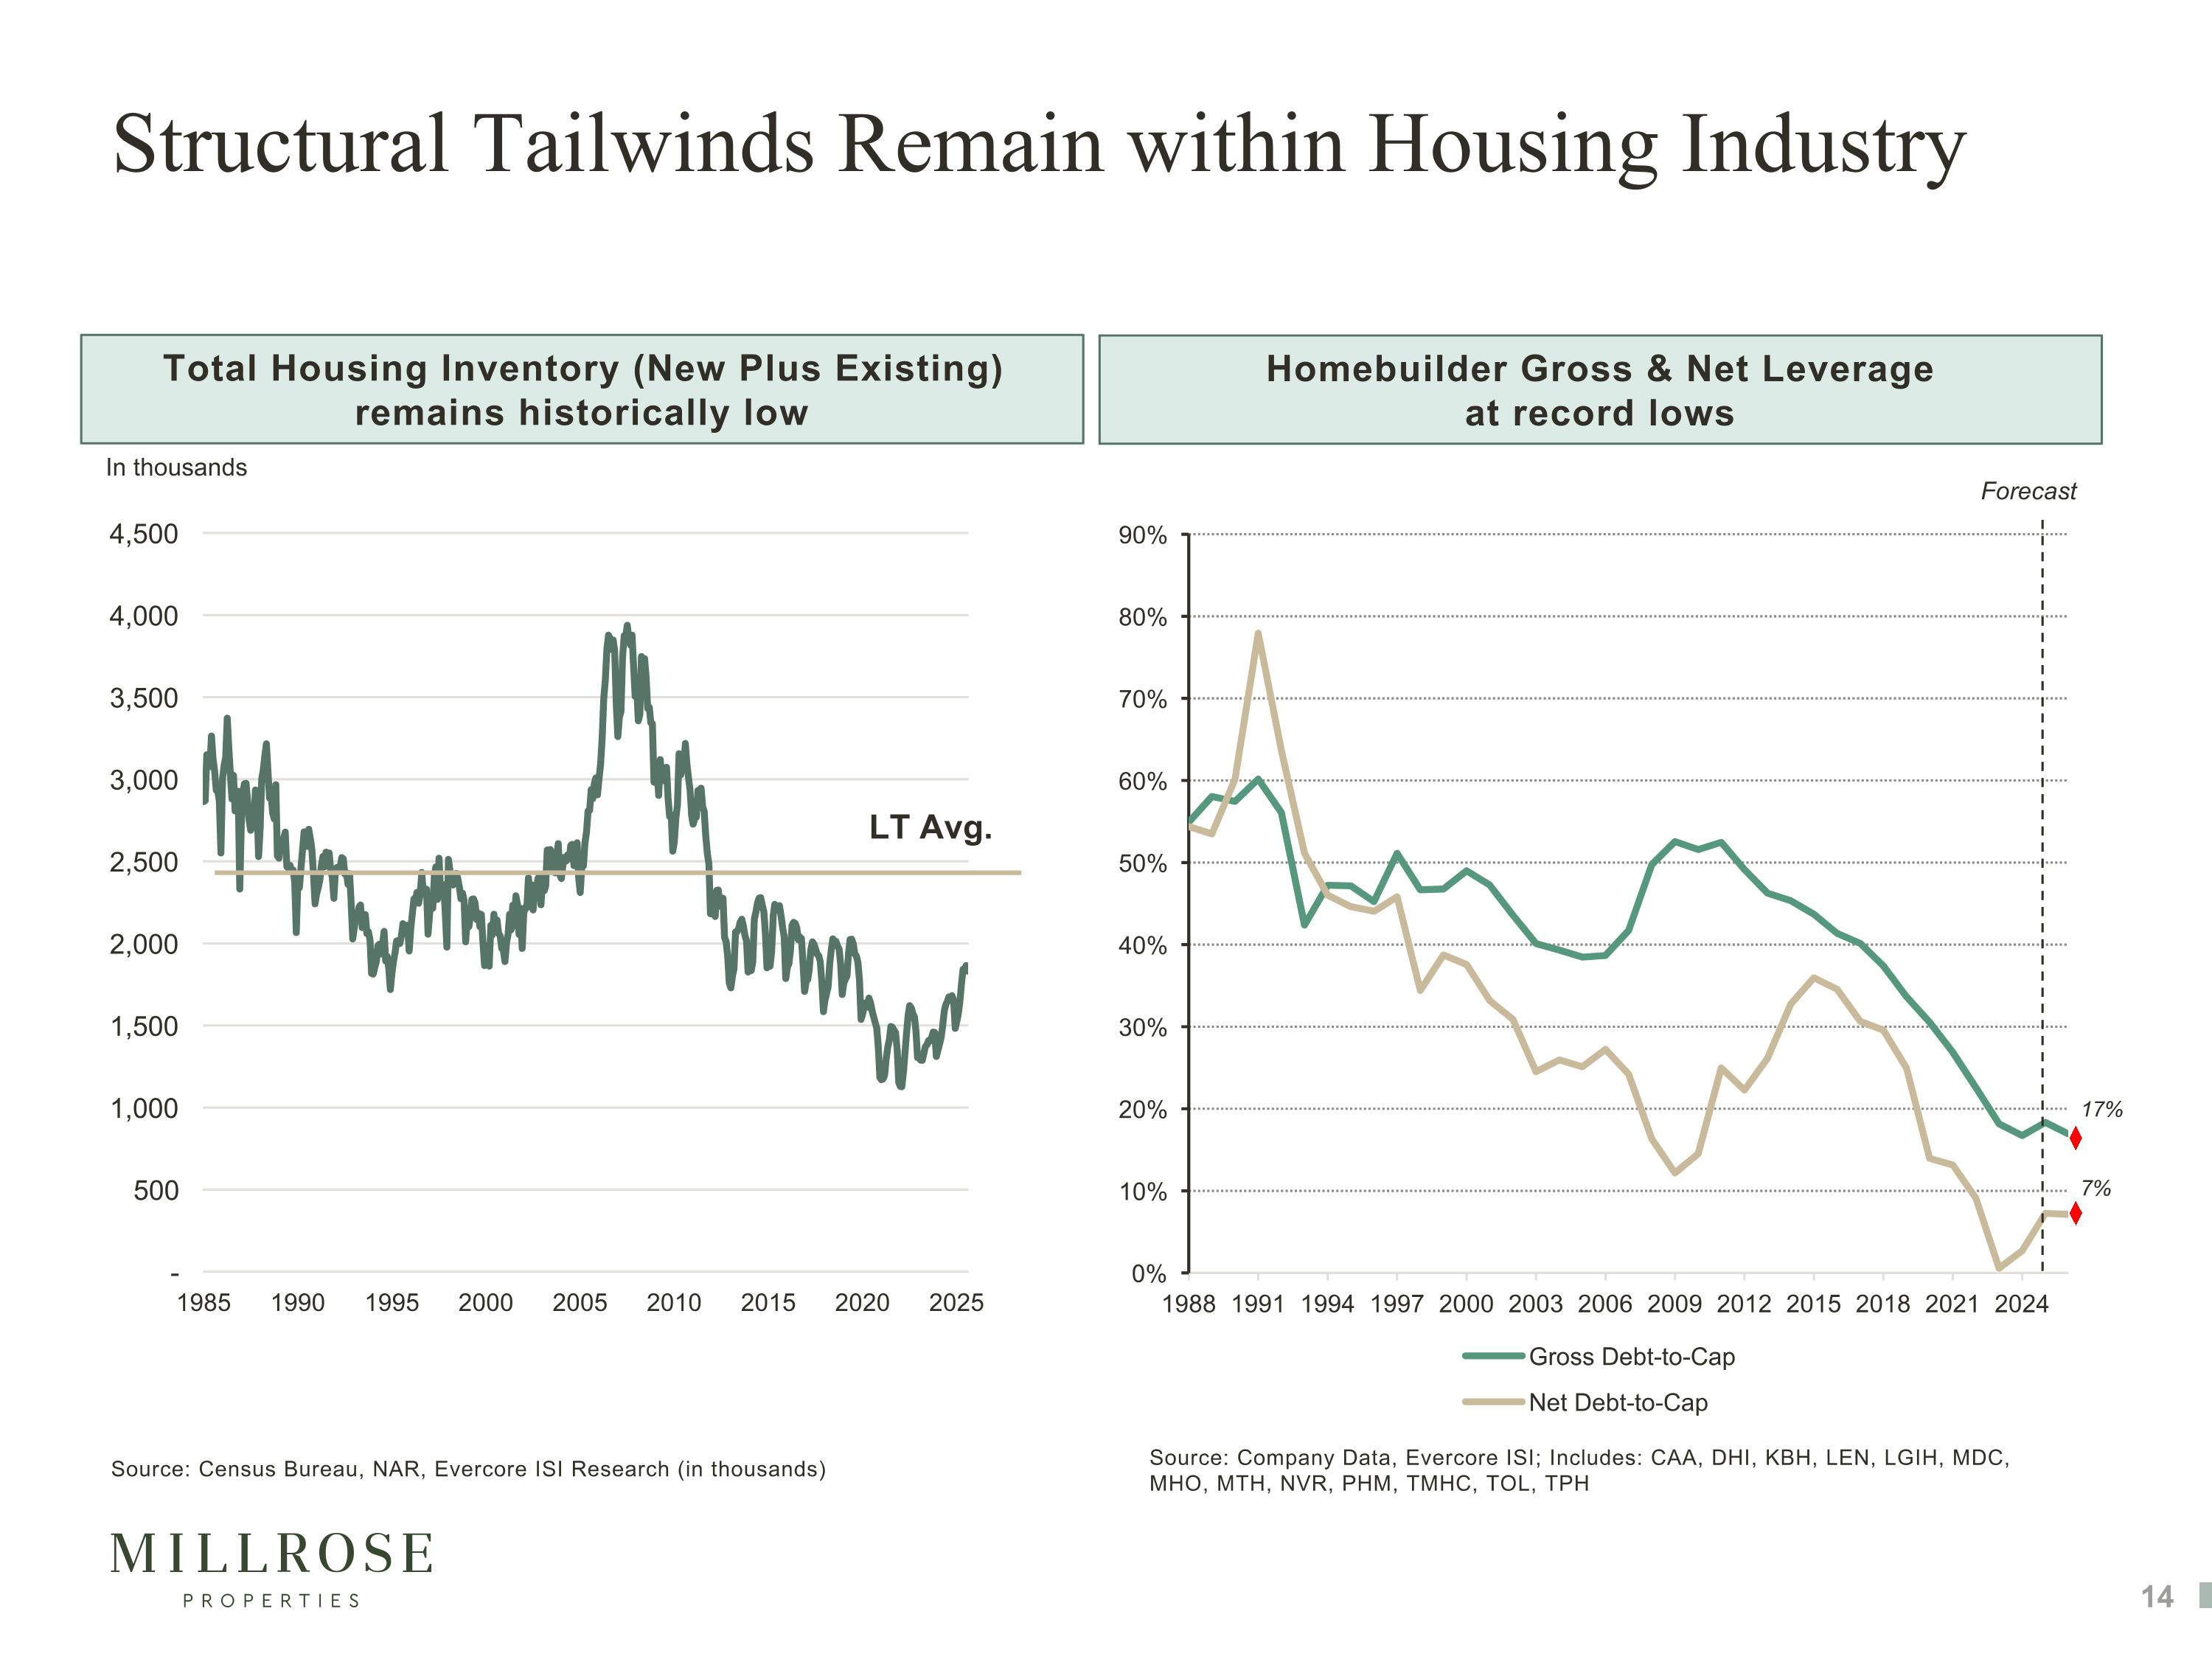
Structural Tailwinds Remain within Housing Industry Total Housing Inventory (New Plus Existing) remains historically low Homebuilder Gross & Net Leverage at record lows LT Avg. Source: Census Bureau, NAR, Evercore ISI Research (in thousands) In thousands Source: Company Data, Evercore ISI; Includes: CAA, DHI, KBH, LEN, LGIH, MDC, MHO, MTH, NVR, PHM, TMHC, TOL, TPH Forecast 17% 7%

Appendix
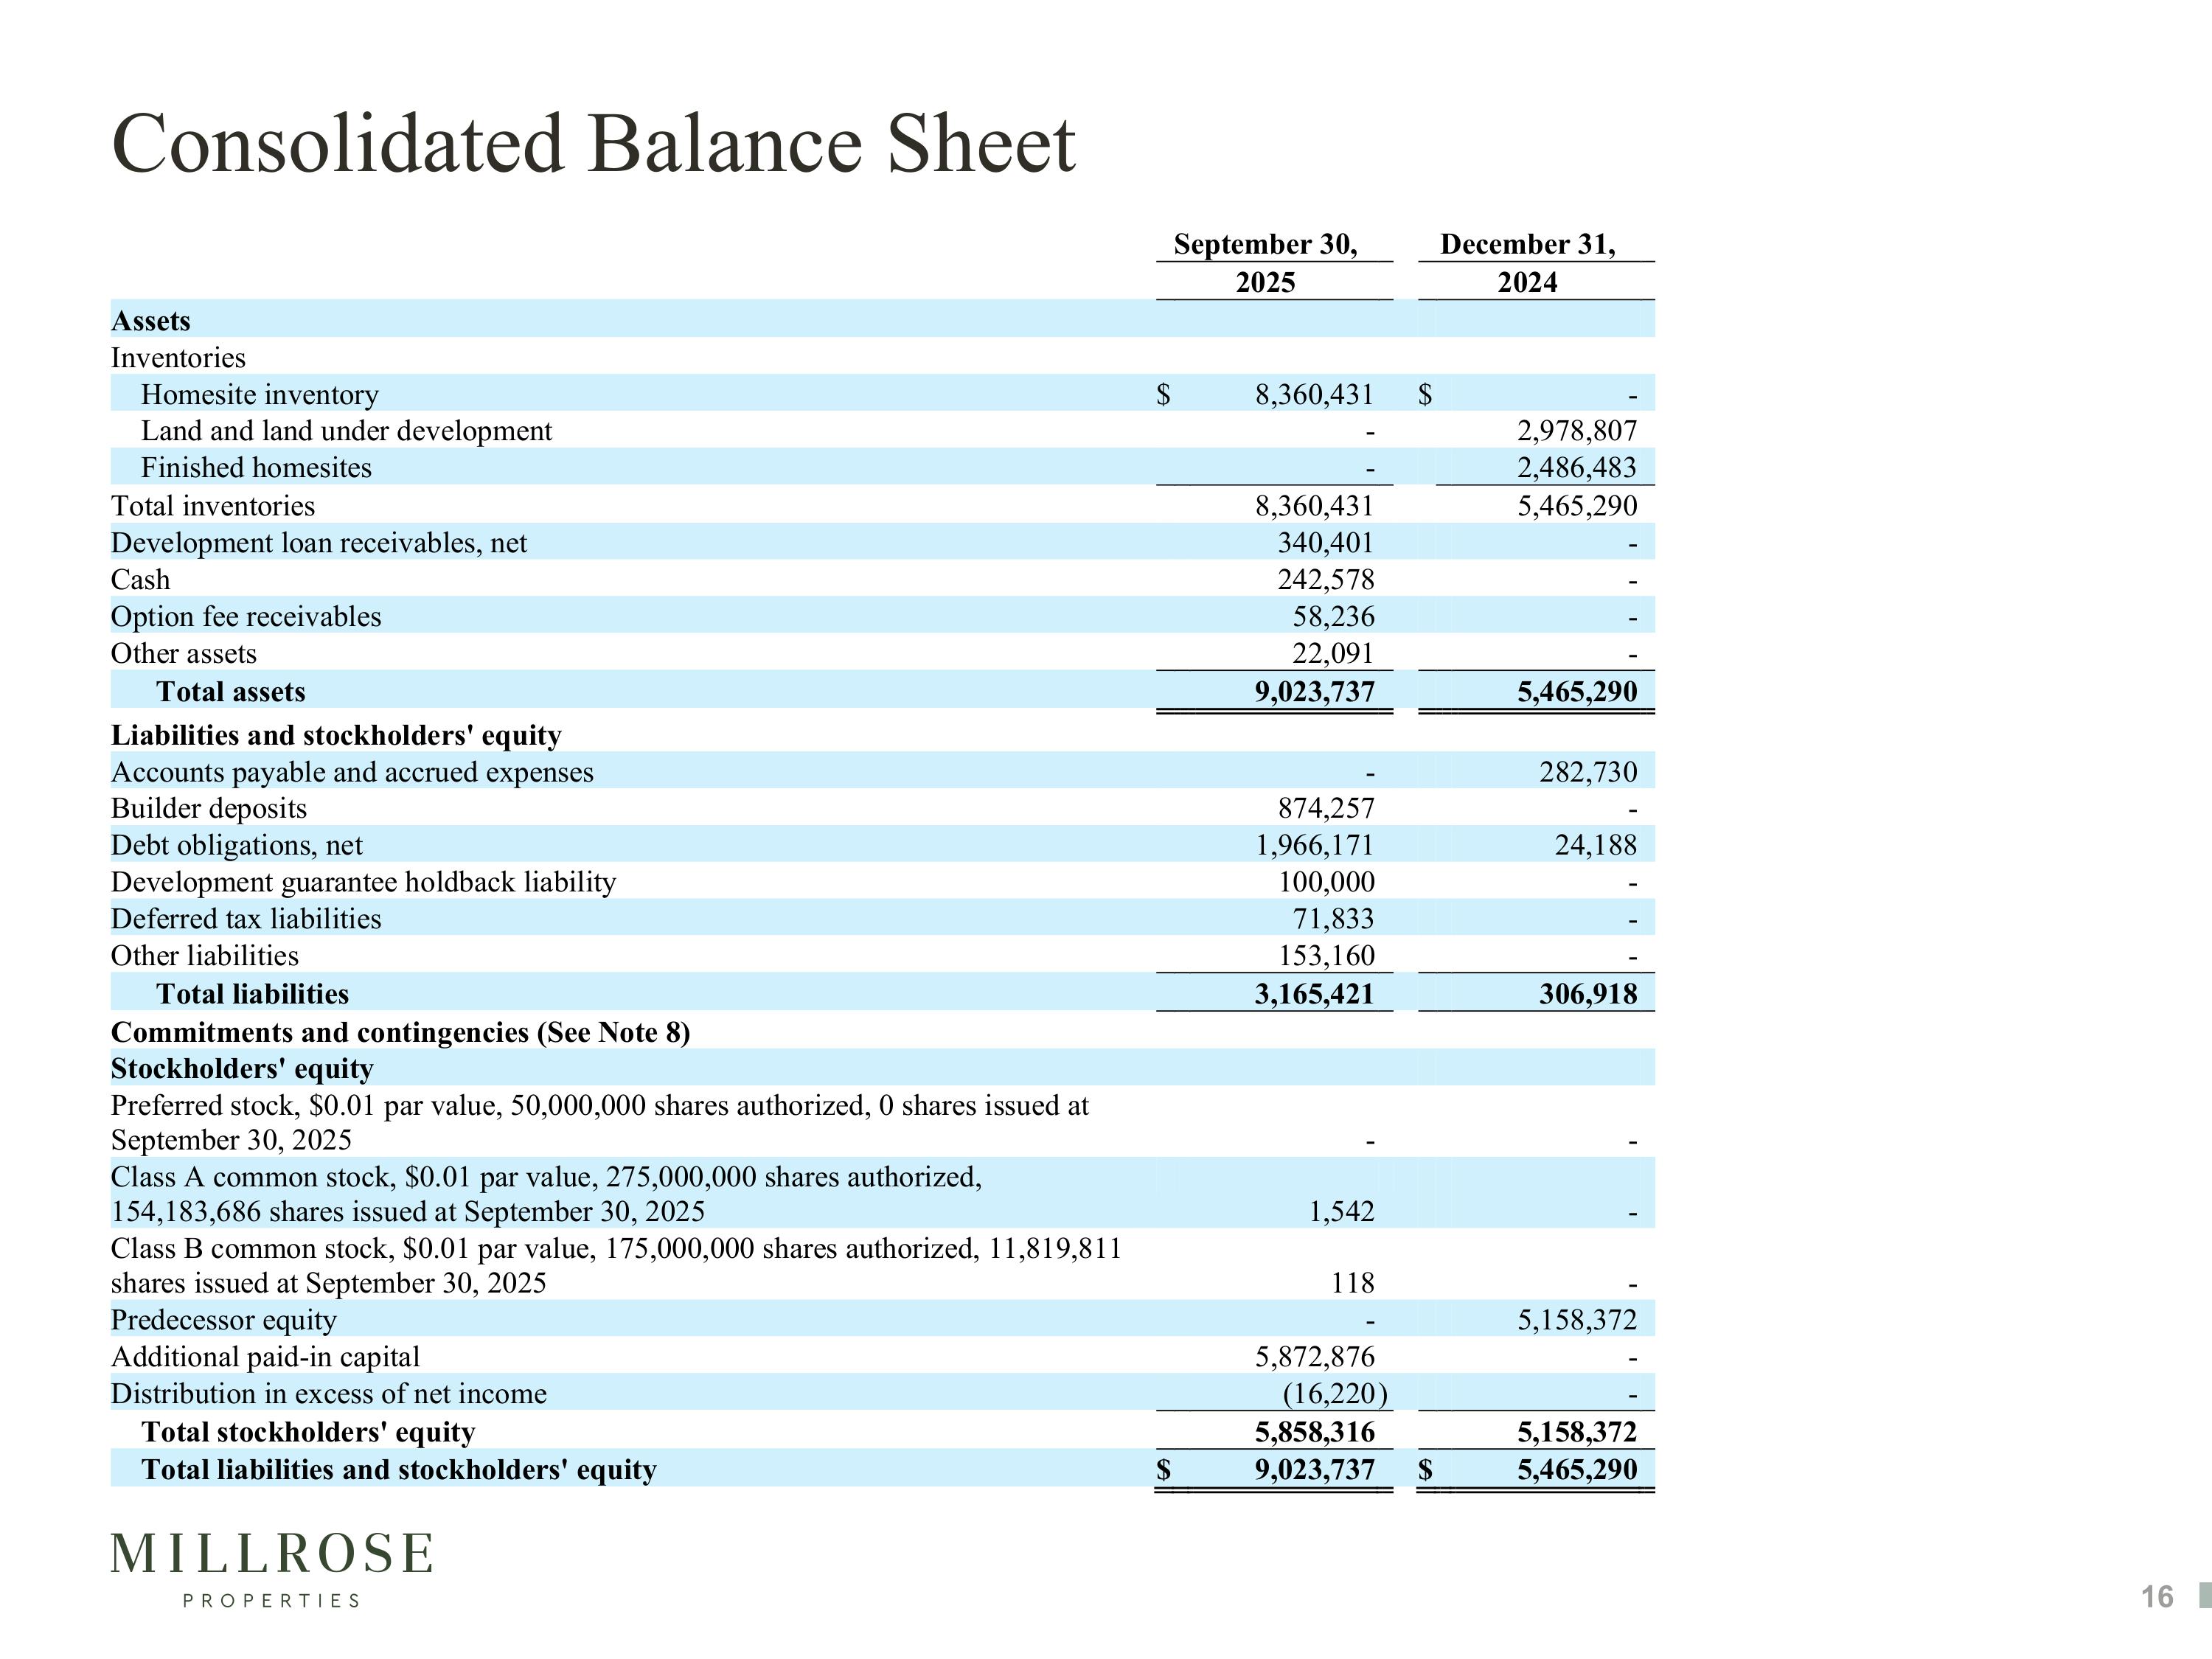
Consolidated Balance Sheet
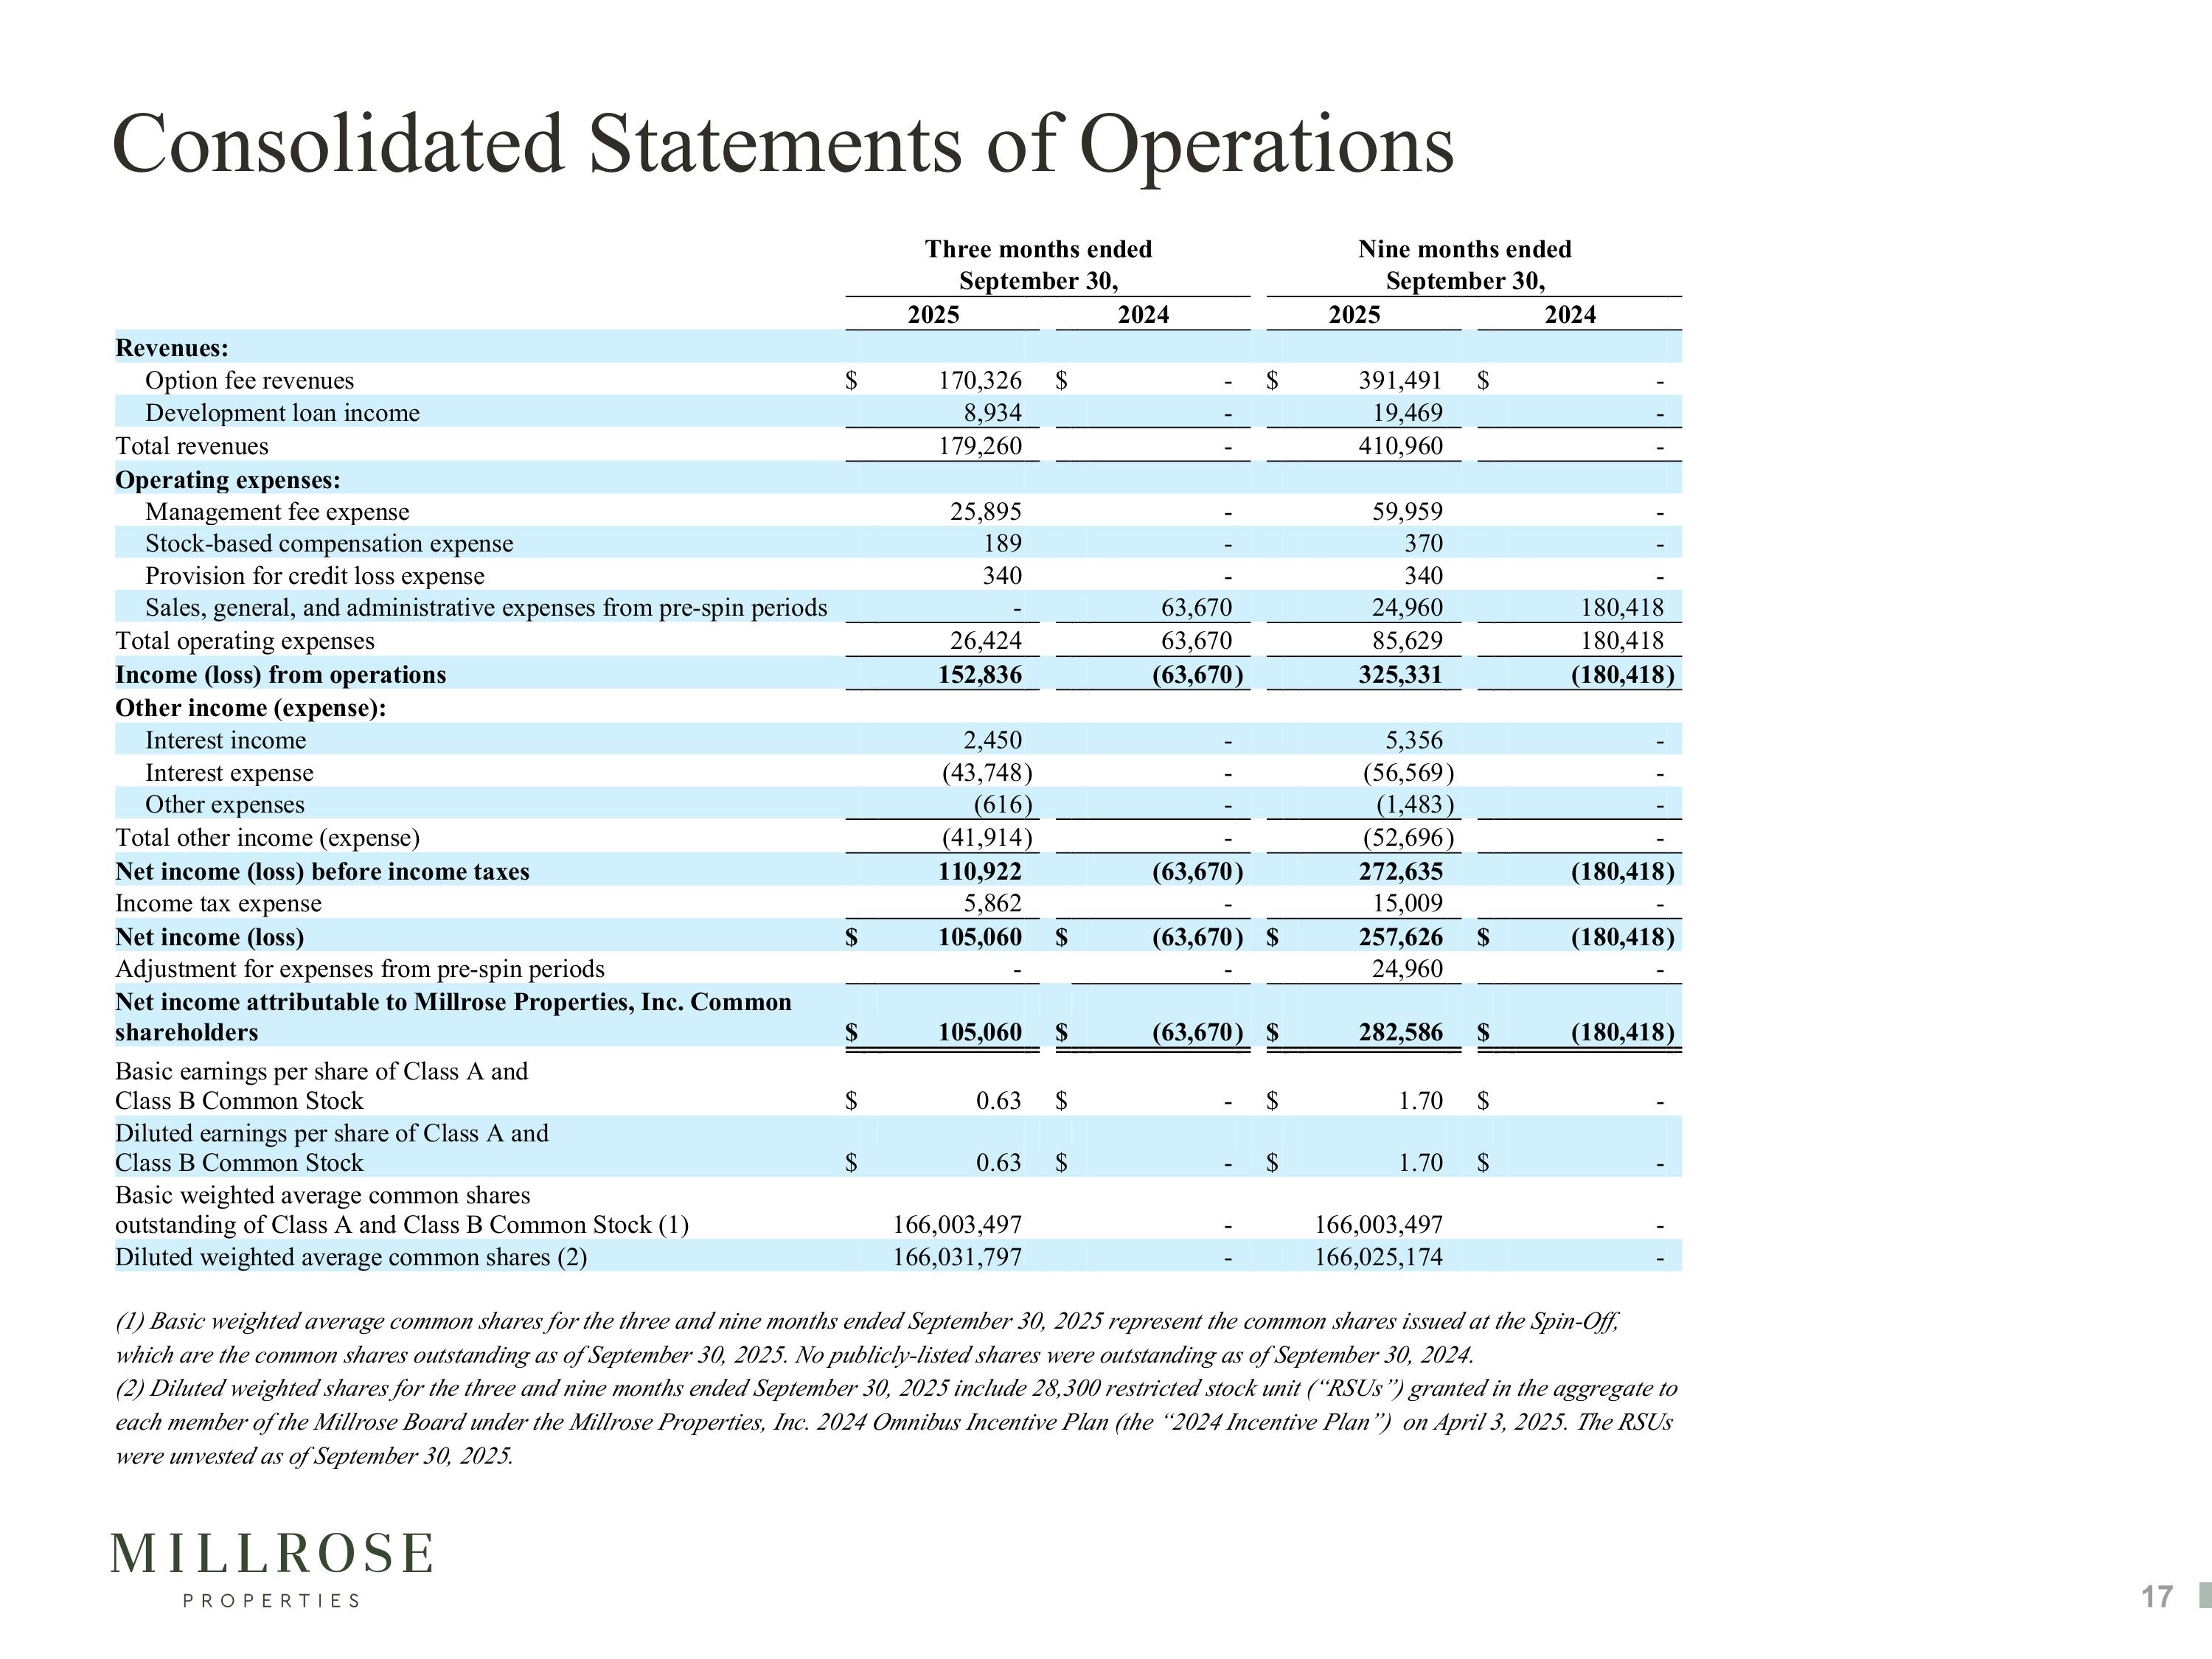
Consolidated Statements of Operations
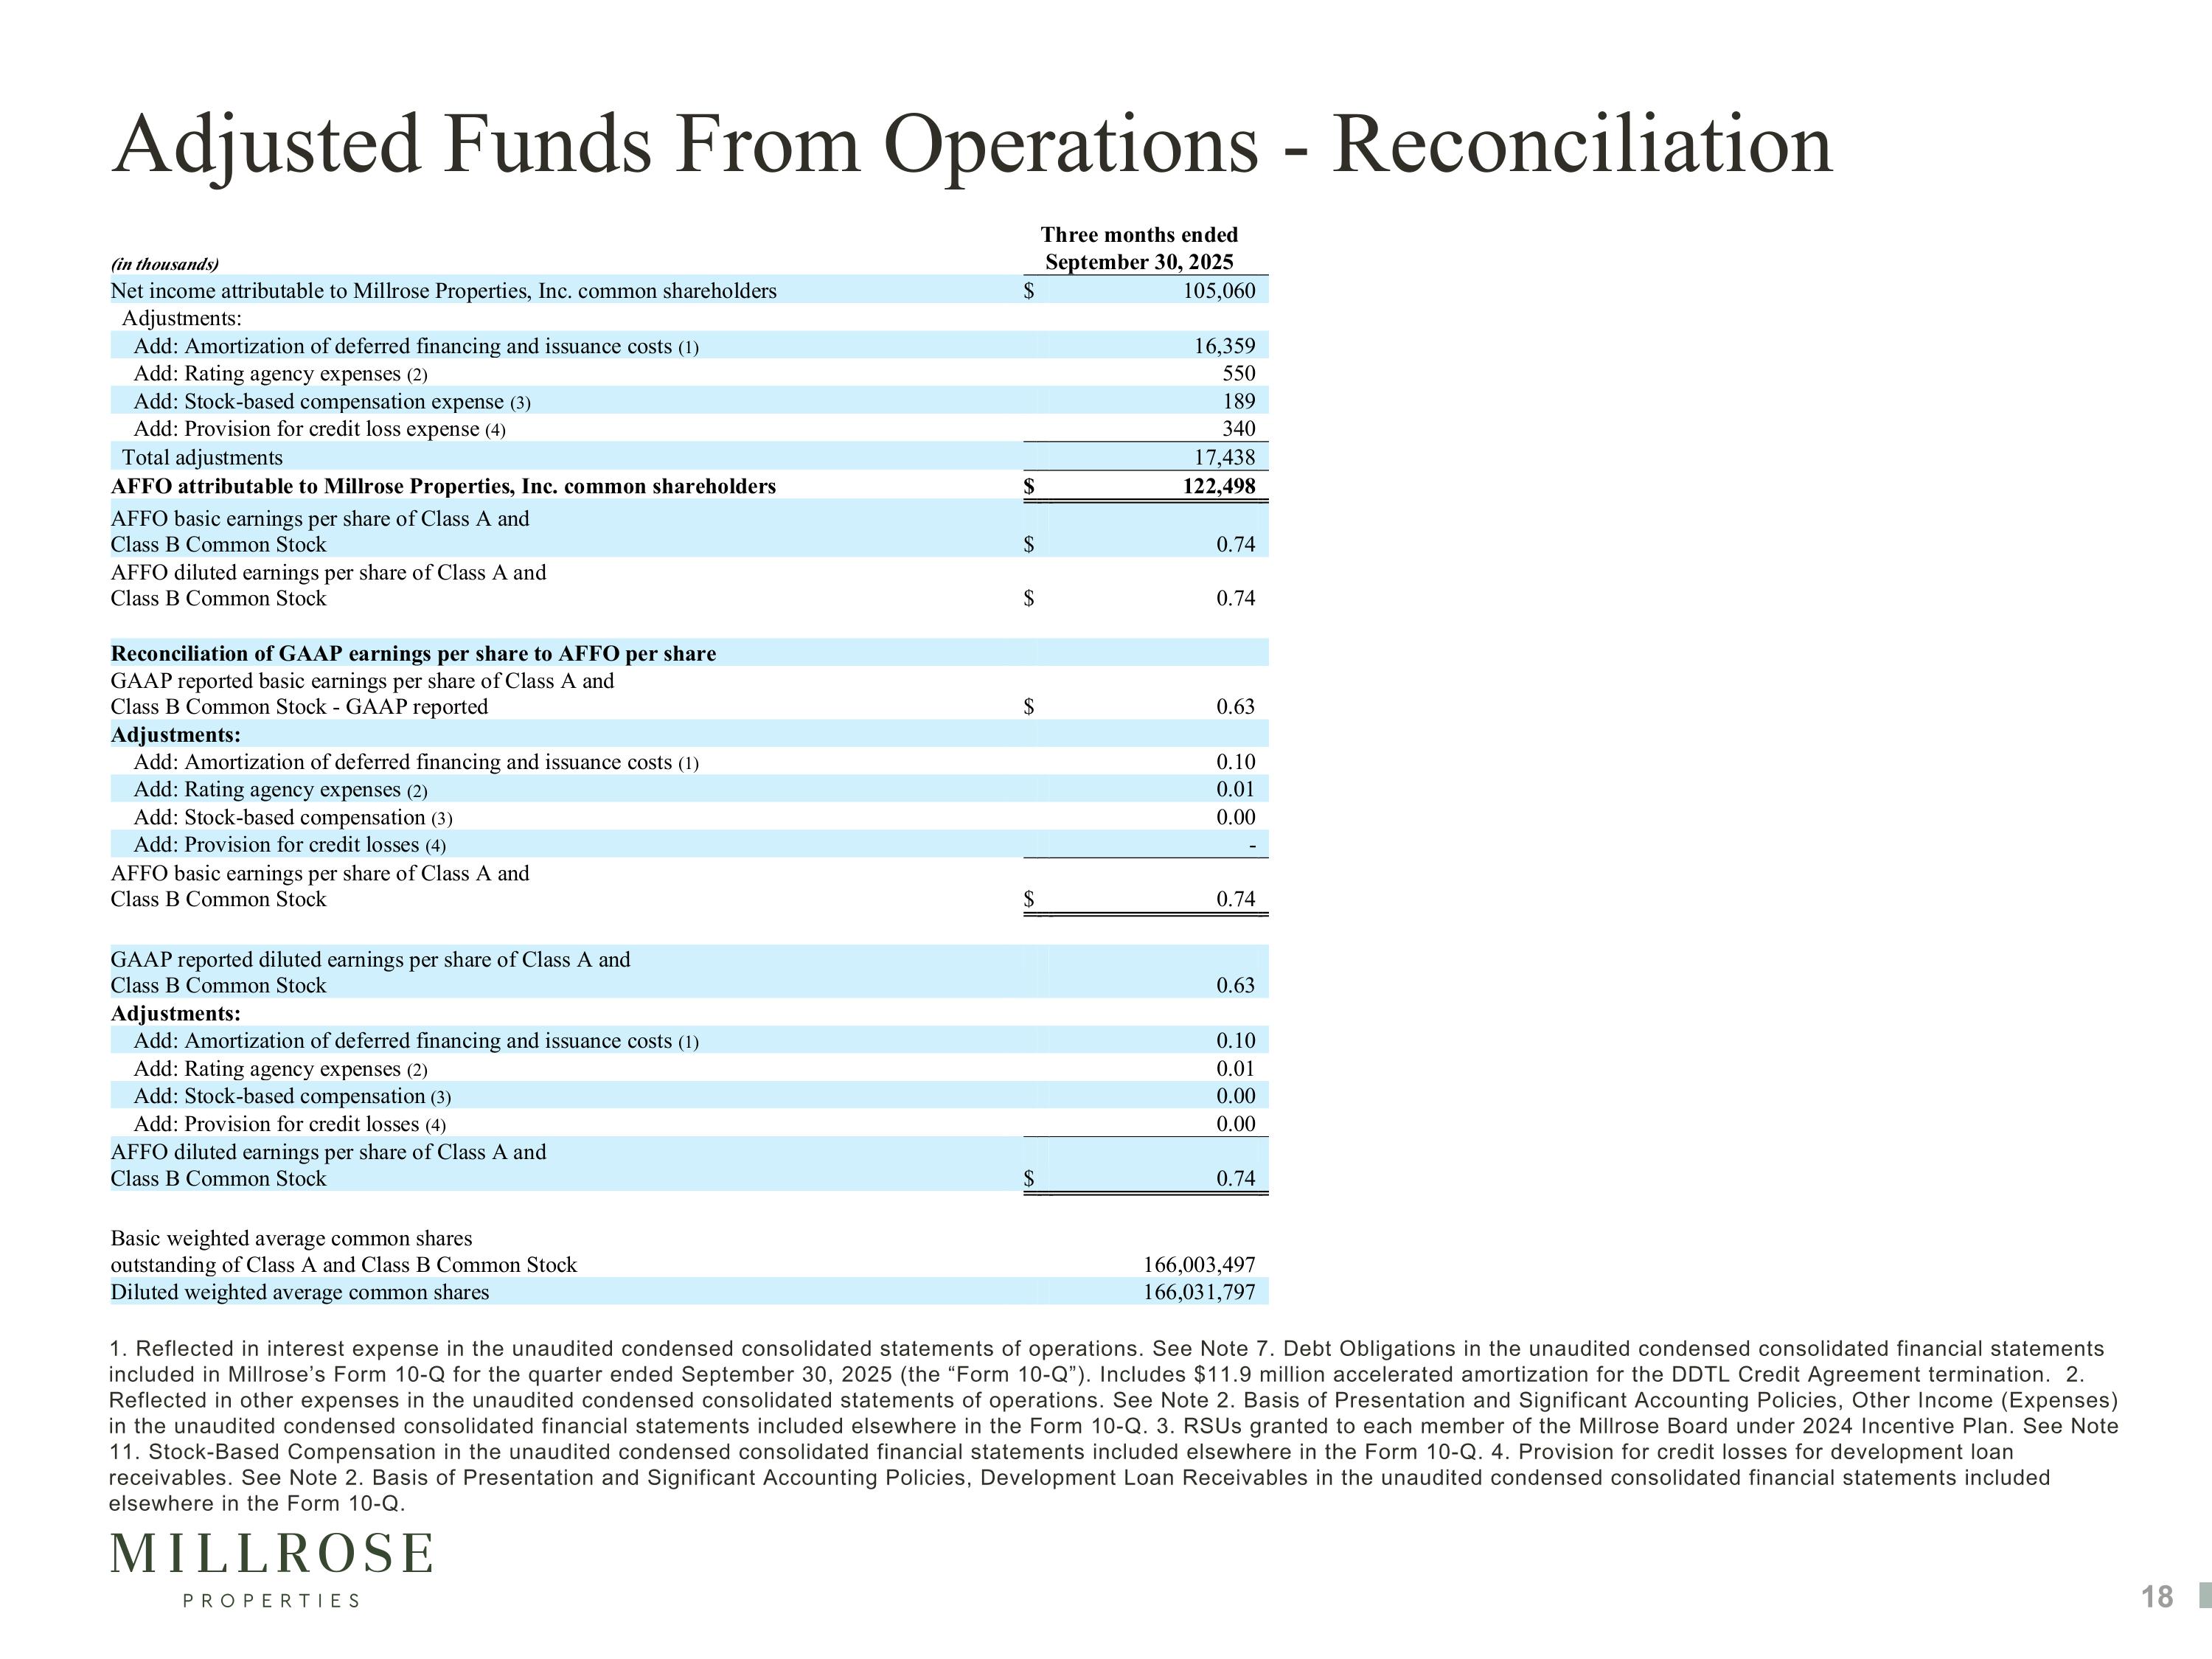
Adjusted Funds From Operations - Reconciliation 1. Reflected in interest expense in the unaudited condensed consolidated statements of operations. See Note 7. Debt Obligations in the unaudited condensed consolidated financial statements included in Millrose’s Form 10-Q for the quarter ended September 30, 2025 (the “Form 10-Q”). Includes $11.9 million accelerated amortization for the DDTL Credit Agreement termination. 2. Reflected in other expenses in the unaudited condensed consolidated statements of operations. See Note 2. Basis of Presentation and Significant Accounting Policies, Other Income (Expenses) in the unaudited condensed consolidated financial statements included elsewhere in the Form 10-Q. 3. RSUs granted to each member of the Millrose Board under 2024 Incentive Plan. See Note 11. Stock-Based Compensation in the unaudited condensed consolidated financial statements included elsewhere in the Form 10-Q. 4. Provision for credit losses for development loan receivables. See Note 2. Basis of Presentation and Significant Accounting Policies, Development Loan Receivables in the unaudited condensed consolidated financial statements included elsewhere in the Form 10-Q.
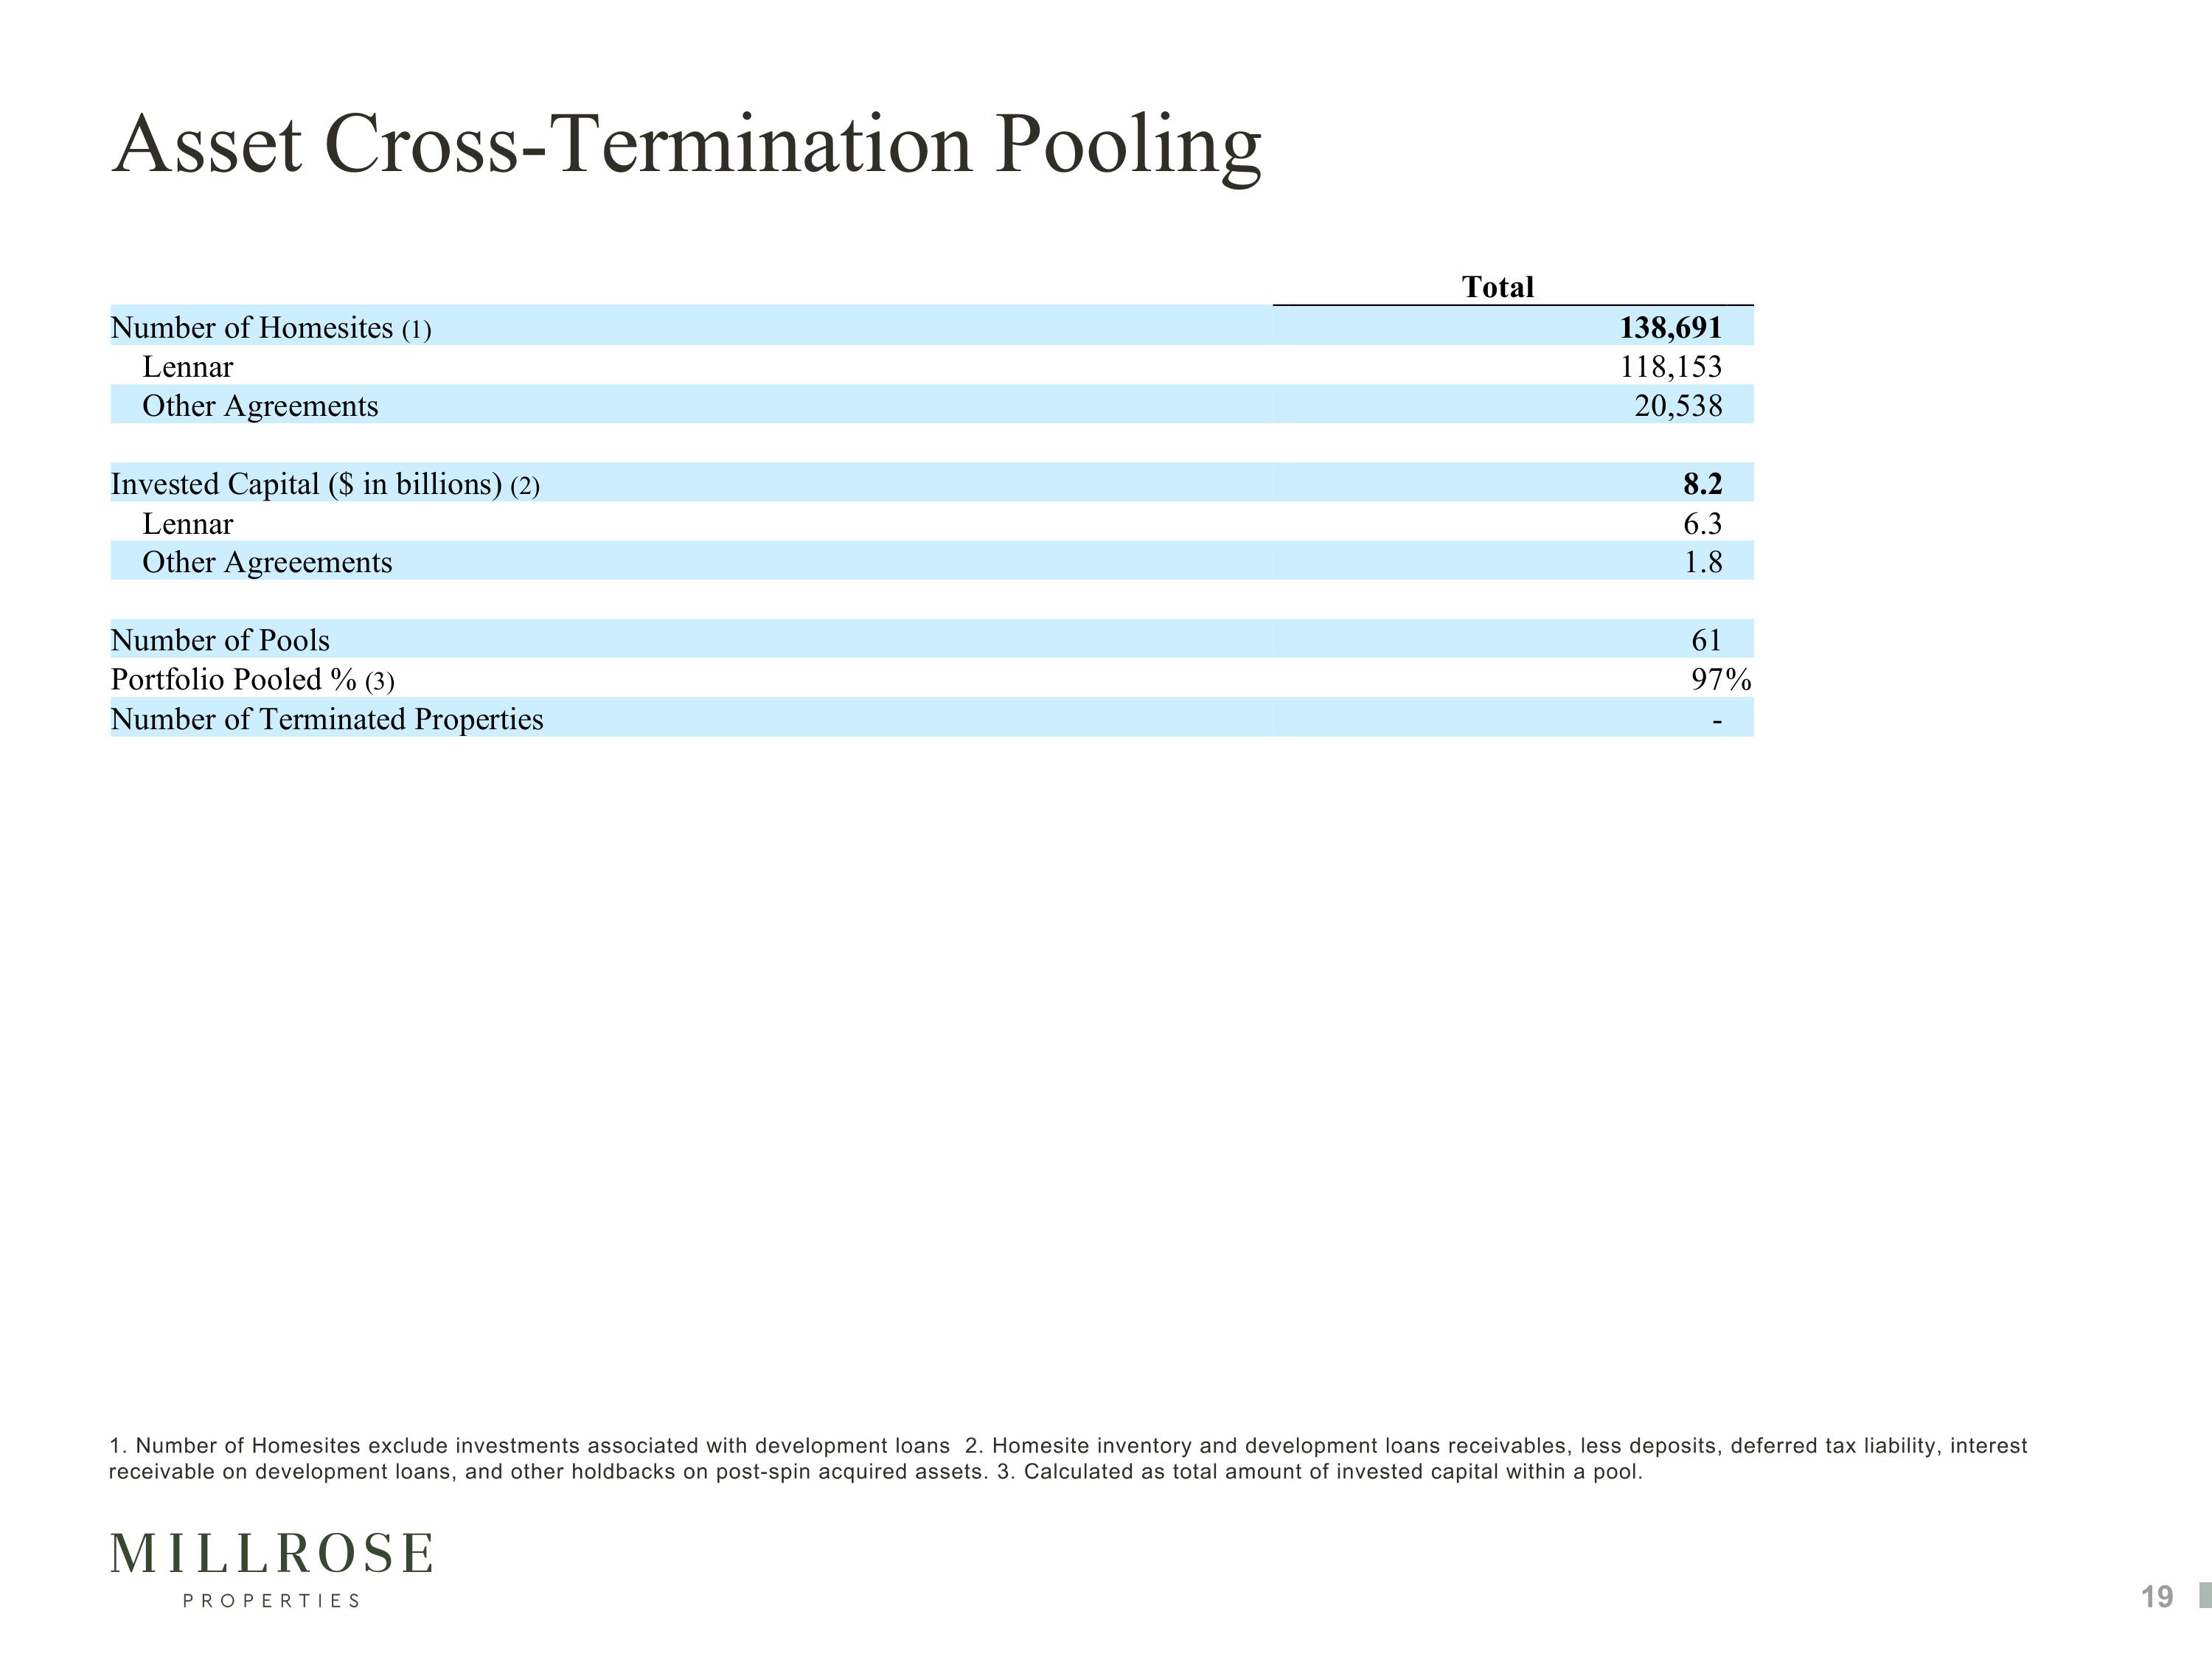
Asset Cross-Termination Pooling 1. Number of Homesites exclude investments associated with development loans 2. Homesite inventory and development loans receivables, less deposits, deferred tax liability, interest receivable on development loans, and other holdbacks on post-spin acquired assets. 3. Calculated as total amount of invested capital within a pool.
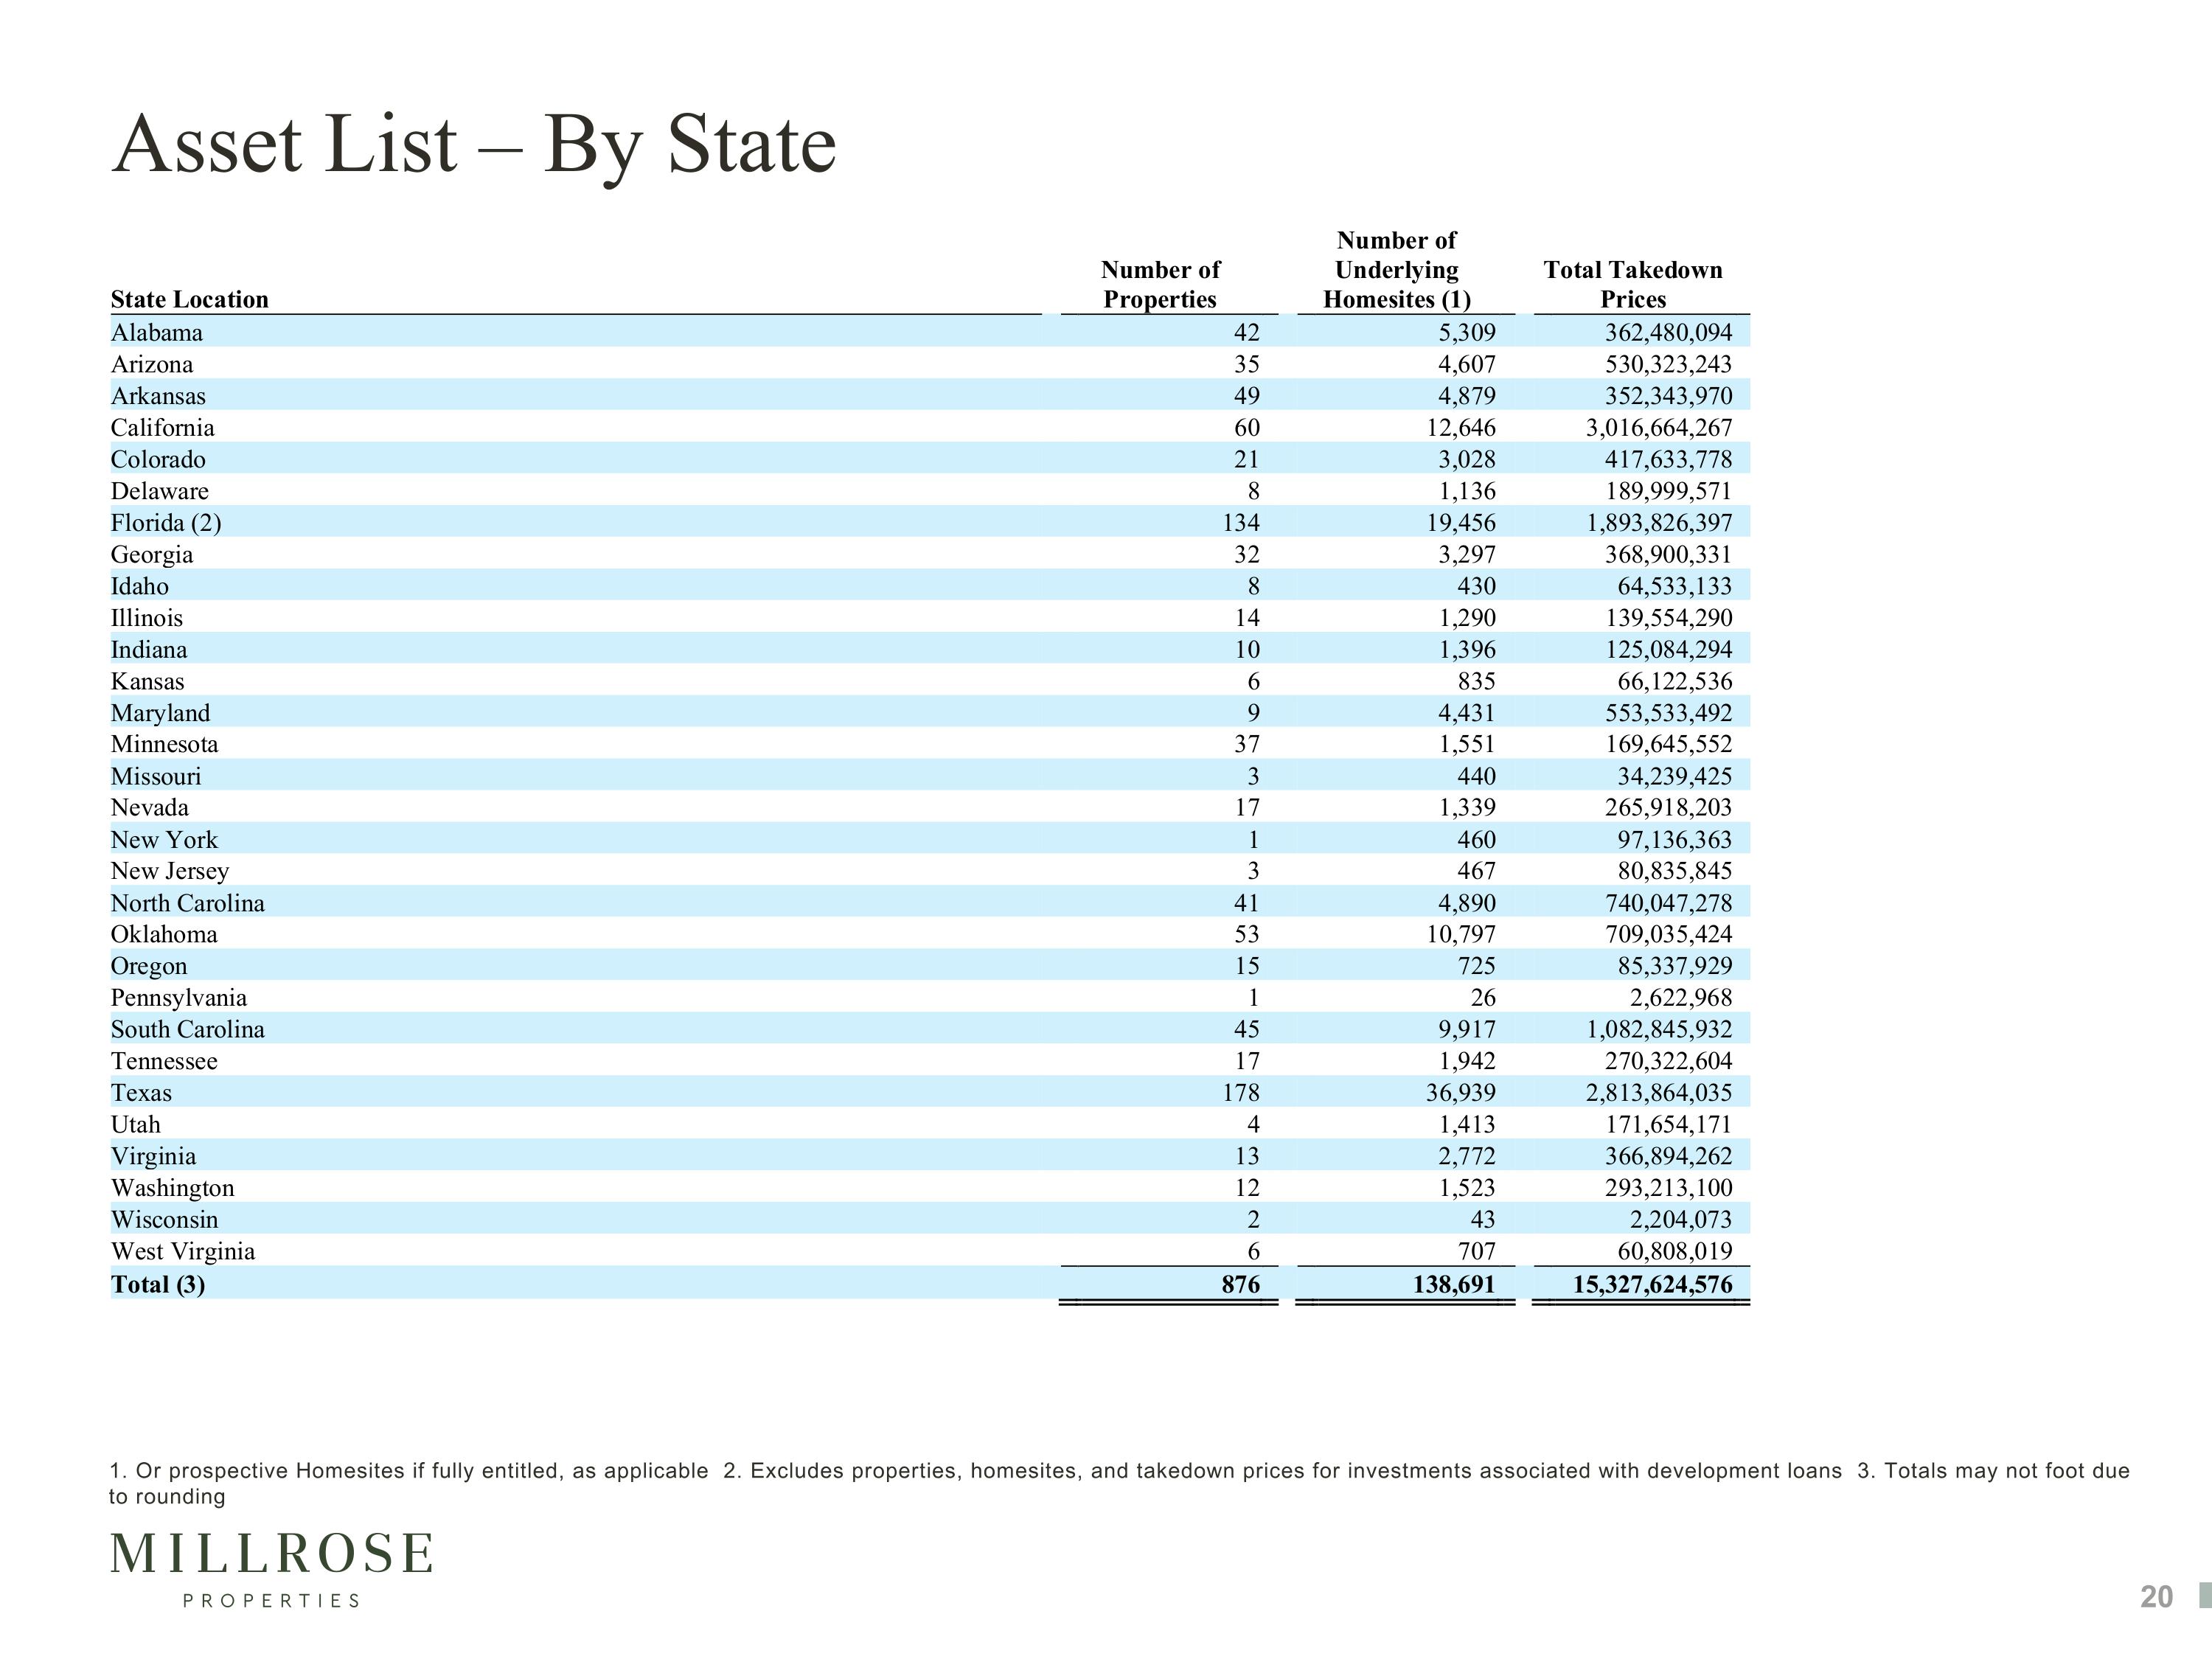
Asset List – By State 1. Or prospective Homesites if fully entitled, as applicable 2. Excludes properties, homesites, and takedown prices for investments associated with development loans 3. Totals may not foot due to rounding
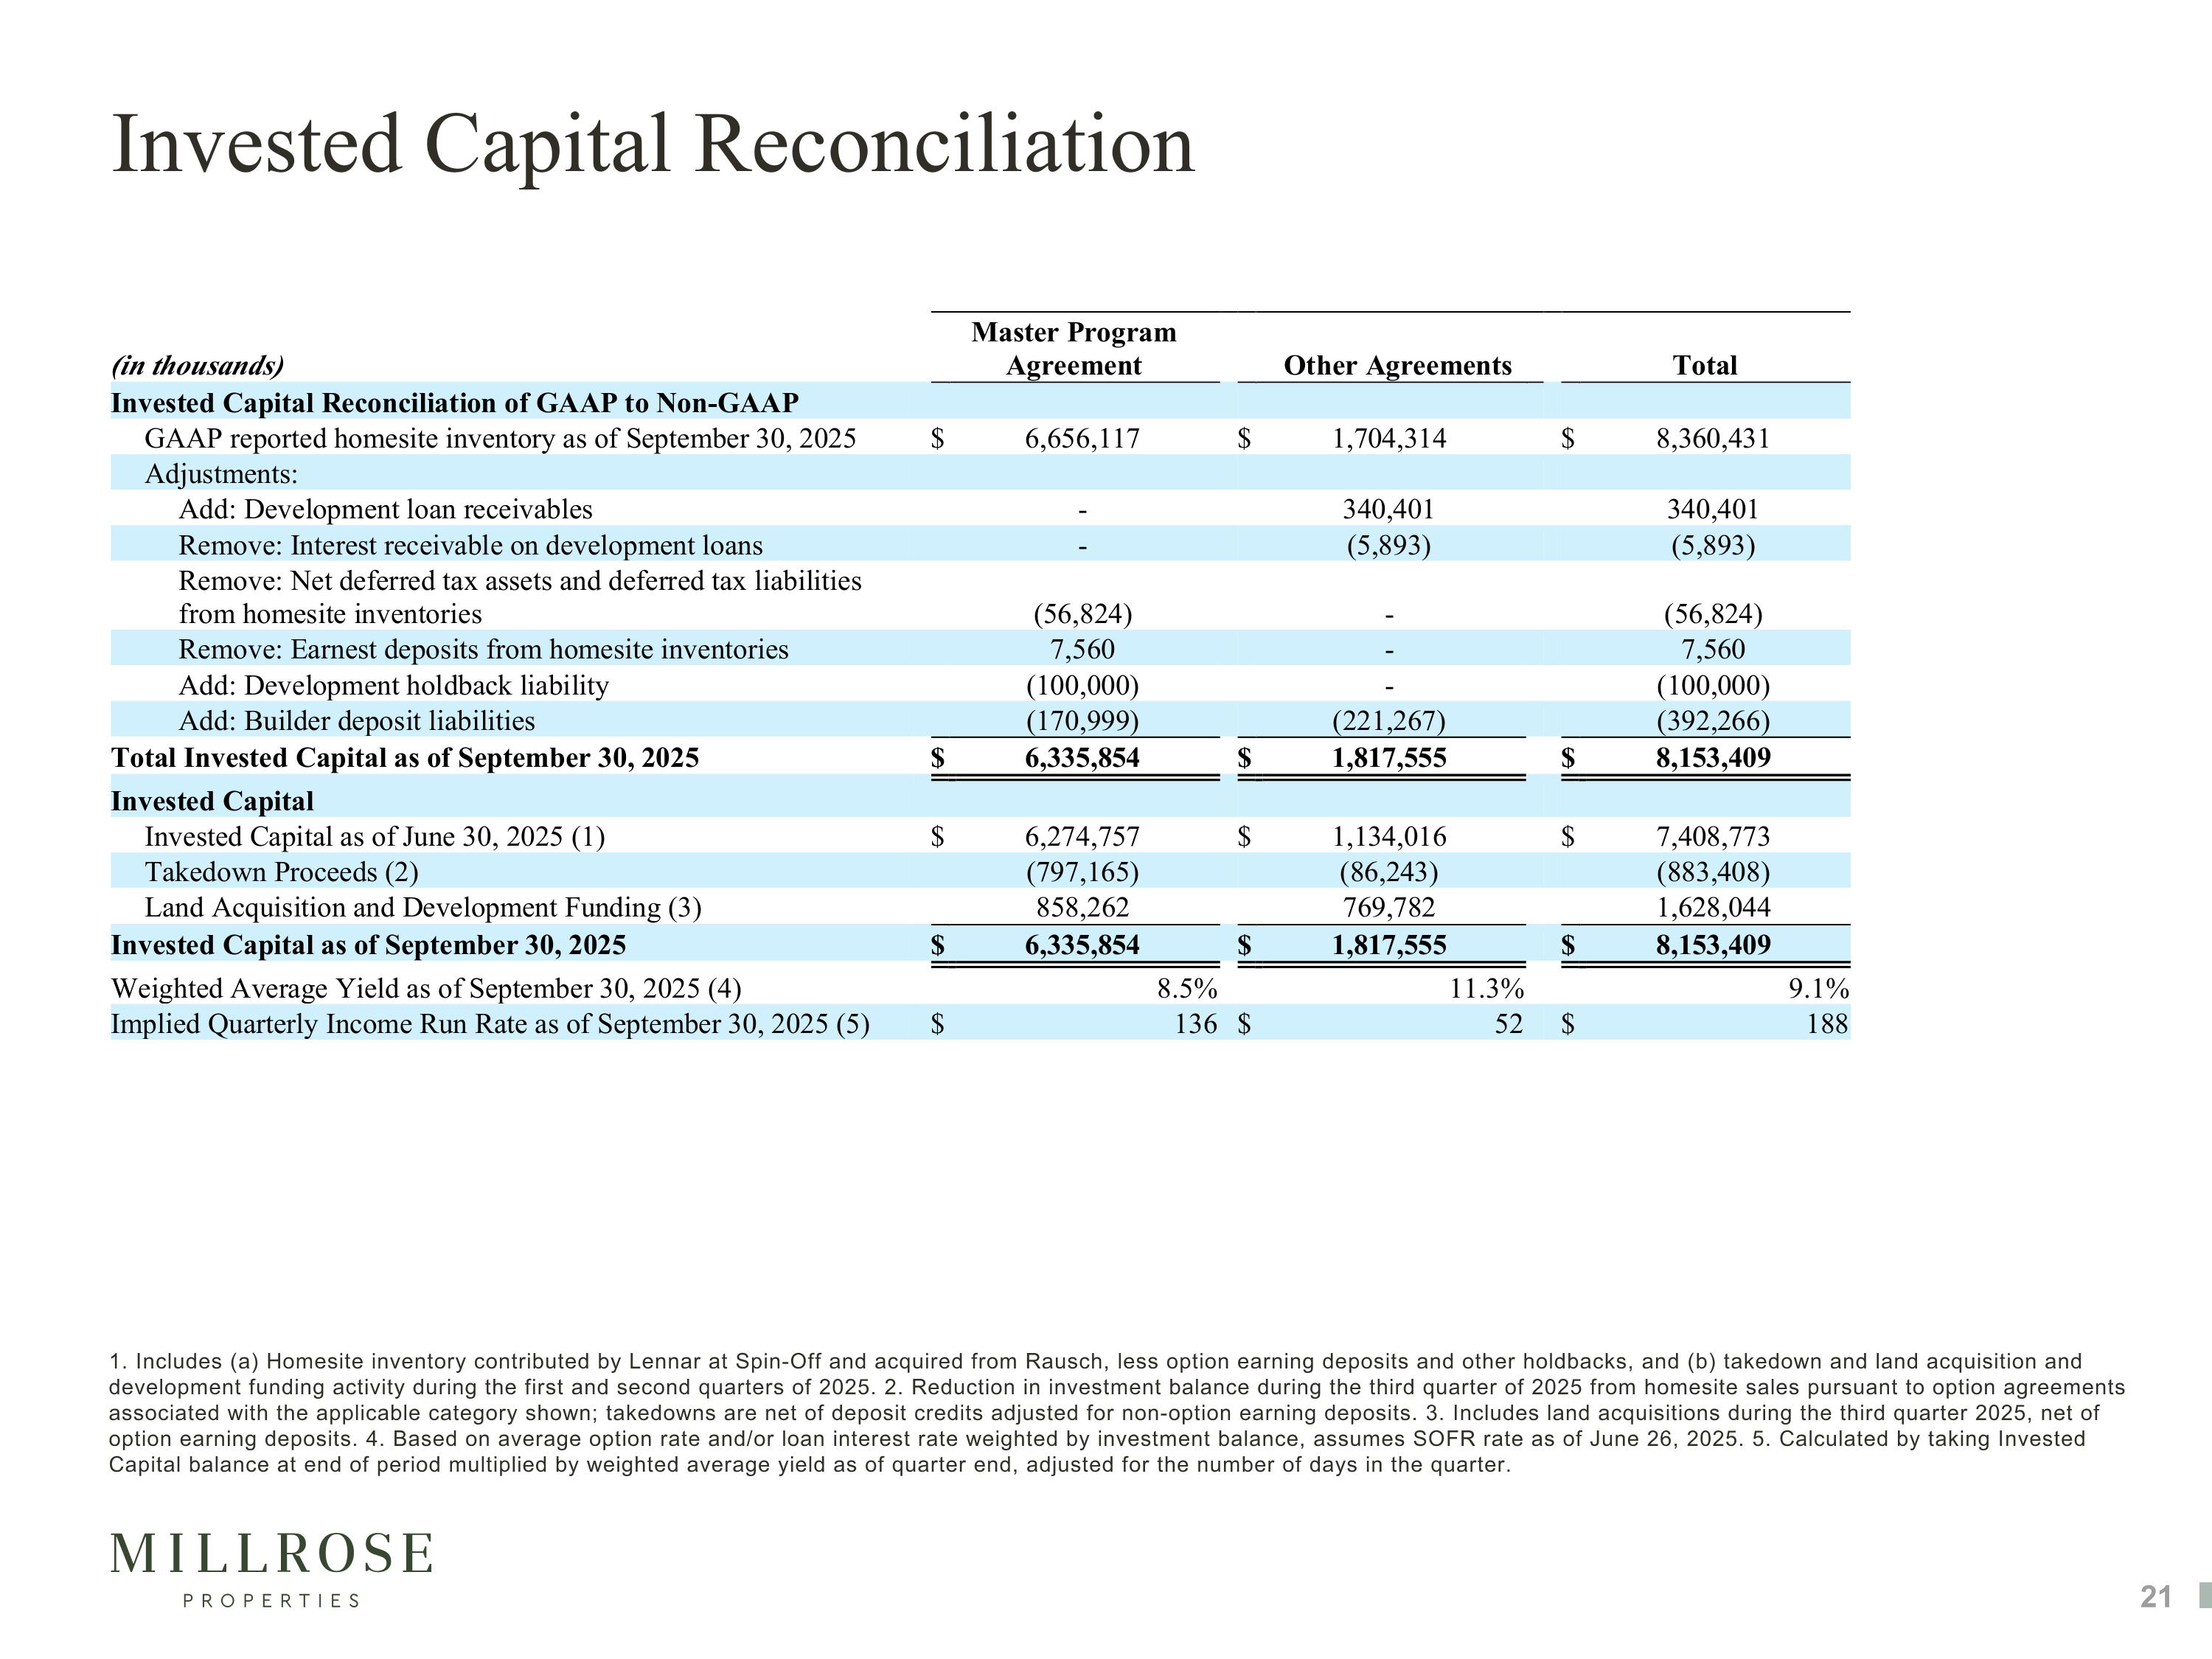
Invested Capital Reconciliation 1. Includes (a) Homesite inventory contributed by Lennar at Spin-Off and acquired from Rausch, less option earning deposits and other holdbacks, and (b) takedown and land acquisition and development funding activity during the first and second quarters of 2025. 2. Reduction in investment balance during the third quarter of 2025 from homesite sales pursuant to option agreements associated with the applicable category shown; takedowns are net of deposit credits adjusted for non-option earning deposits. 3. Includes land acquisitions during the third quarter 2025, net of option earning deposits. 4. Based on average option rate and/or loan interest rate weighted by investment balance, assumes SOFR rate as of June 26, 2025. 5. Calculated by taking Invested Capital balance at end of period multiplied by weighted average yield as of quarter end, adjusted for the number of days in the quarter.