
Exhibit 99.2 INVESTOR PRESENTATION Q3 2025 Earnings Call O c t o b e r 2 2 , 2 0 2 5
Forward-looking Statements and Additional Information This presentation contains forward-looking statements within the meaning of the federal securities laws relating to the proposed merger with PB Bankshares, Inc. (“PBBK”) by Norwood Financial Corp. (“Norwood” or “NWFL”), the integration of PBBK with NWFL, the combination of their businesses and projected or pro forma financial information and metrics. All statements other than statements of historical fact are statements that could be deemed forward-looking statements, including all statements regarding the intent, belief or current expectations of NWFL and PBBK and members of their respective board of directors and senior management teams. Investors and security holders are cautioned that such statements are predictions, and are not guarantees of future performance. Actual events or results may differ materially. Completion of the proposed merger, expected financial results or other plans are subject to a number of known and unknown risks, uncertainties and assumptions that are difficult to assess and are subject to change based on factors which are, in many instances, beyond NWFL's control. Additional risks and uncertainties may include, but are not limited to, the risk that expected cost savings, revenue synergies and other financial benefits from the proposed merger may not be realized or take longer than expected to realize, the failure to obtain required regulatory or shareholder approvals, the failure of the closing conditions in the merger agreement to be satisfied or any unexpected delay in closing the transaction. For further information regarding these risks and uncertainties and additional factors that could cause results to differ materially from those contained in the forward-looking statements, see the forward-looking statement disclosure contained in the Annual Report on Form 10-K for the most recently ended fiscal year of NWFL and PBBK, as well as the proxy statement/prospectus described below, and other documents subsequently filed by NWFL and PBBK with the Securities and Exchange Commission. Due to these and other possible uncertainties and risks, NWFL and PBBK can give no assurance that the results contemplated in the forward-looking statements will be realized, and readers are cautioned not to place undue reliance on the forward-looking statements contained in this presentation. Forward-looking statements are based on information currently available to NWFL and PBBK, and the parties assume no obligation and disclaim any intent to update any such forward-looking statements. All forward-looking statements, express or implied, included in the presentation are qualified in their entirety by this cautionary statement. NON-GAAP FINANCIAL MEASURES In addition to results presented in accordance with GAAP, this presentation includes certain non-GAAP financial measures. NWFL and PBBK believe these non-GAAP financial measures provide additional information that is useful to investors in helping to understand underlying financial performance and condition and trends of NWFL. Non-GAAP financial measures have inherent limitations. Readers should be aware of these limitations and should be cautious with respect to the use of such measures. To compensate for these limitations, non-GAAP measures are used as comparative tools, together with GAAP measures, to assist in the evaluation of operating performance or financial condition. These measures are also calculated using the appropriate GAAP or regulatory components in their entirety and are computed in a manner intended to facilitate consistent period-to-period comparisons. NWFL’s method of calculating these non-GAAP measures may differ from methods used by other companies. These non- GAAP measures should not be considered in isolation or as a substitute or an alternative for those financial measures prepared in accordance with GAAP or in-effect regulatory requirements. Numbers in this presentation may not sum due to rounding. Where non-GAAP financial measures are used, the most directly comparable GAAP or regulatory financial measure, as well as the reconciliation to the most directly comparable GAAP or regulatory financial measure, can be found in this presentation. 2
Forward-looking Statements and Additional Information This communication is being made in respect of the proposed merger transaction involving NWFL and PBBK. This material is not a solicitation of any vote or approval of the NWFL and PBBK shareholders and is not a substitute for the proxy statement/prospectus or any other documents that NWFL and PBBK may send to their respective shareholders in connection with the proposed transaction. This communication does not constitute an offer to sell or the solicitation of an offer to buy any securities. The proposed merger transaction will be submitted to the shareholders of PBBK for their consideration. In connection with the proposed merger, Norwood filed a Registration Statement on Form S-4 (File No. 333-290392) with the Securities and Exchange Commission (the “SEC”), to register the shares of Norwood common stock to be issued in connection with the proposed transaction. The Registration Statement, as amended, has not yet been declared effective by the SEC, includes the joint proxy statement/prospectus of Norwood and PB Bankshares which will be mailed to stockholders of PB Bankshares, seeking their approval of the proposed transaction. This communication does not constitute an offer to sell of the solicitation of an offer to buy and securities or a solicitation of any vote or approval. BEFORE MAKING ANY VOTING OR INVESTMENT DECISIONS, INVESTORS AND PBBK SHAREHOLDERS ARE URGED TO READ THE REGISTRATION STATEMENT AND THE PROXY STATEMENT/PROSPECTUS REGARDING THE PROPOSED TRANSACTION AND ANY OTHER RELEVANT DOCUMENTS FILED OR TO BE FILED WITH THE SEC AND ANY AMENDMENTS OR SUPPLEMENTS TO THOSE DOCUMENTS CAREFULLY AND IN THEIR ENTIRETY WHEN THEY BECOME AVAILABLE BECAUSE THEY WILL CONTAIN IMPORTANT INFORMATION ABOUT NWFL, PBBK, THE PROPOSED TRANSACTION AND RELATED MATTERS. Shareholders are also urged to carefully review and consider NWFL’s and PBBK’s public filings with the SEC, including, but not limited to, its proxy statements, its Annual Reports on Form 10-K, its Quarterly Reports on Form 10-Q and its Current Reports on Form 8-K. Investors and security holders may obtain free copies of the Registration Statement, the proxy statement/prospectus, any amendments or supplements thereto and other documents containing important information about NWFL or PBBK and/or the proposed transaction, once such documents are filed with the SEC, at the SEC’s website at www.sec.gov. In addition, copies of the documents filed with the SEC by NWFL, including the proxy statement/prospectus and the SEC filings that will be incorporated by reference in the proxy statement/prospectus, will be available free of charge on the NWFL’s website at www.wayne.bank under the heading “Shareholder Services.” Participants in the Solicitation NWFL, PBBK and certain of their respective directors, executive officers and other members of management and employees may, under the SEC’s rules, be deemed to be participants in the solicitation of proxies in connection with the proposed transaction. Information about the directors and executive officers of NWFL is set forth in its proxy statement for its 2025 annual meeting of shareholders, which was filed with the SEC on March 18, 2025, its annual report on Form 10-K for the fiscal year ended December 31, 2024, which was filed with the SEC on March 14, 2025, and in other documents filed with the SEC, each of which can be obtained free of charge from the sources indicated above. Information about the directors and executive officers of PBBK is set forth in its proxy statement for its 2025 annual meeting of shareholders, which was filed with the SEC on April 23, 2025, its annual report on Form 10-K for the fiscal year ended December 31, 2024, which was filed with the SEC on March 28, 2025, and in other documents filed with the SEC, each of which can be obtained free of charge from the sources indicated above. Additional information regarding the participants in the proxy solicitation, including a description of their direct and indirect interests, by security holdings or otherwise, will be contained in the proxy statement/prospectus and other relevant materials to be filed with the SEC when they become available. Free copies of these documents may be obtained as described in the preceding paragraph. 3
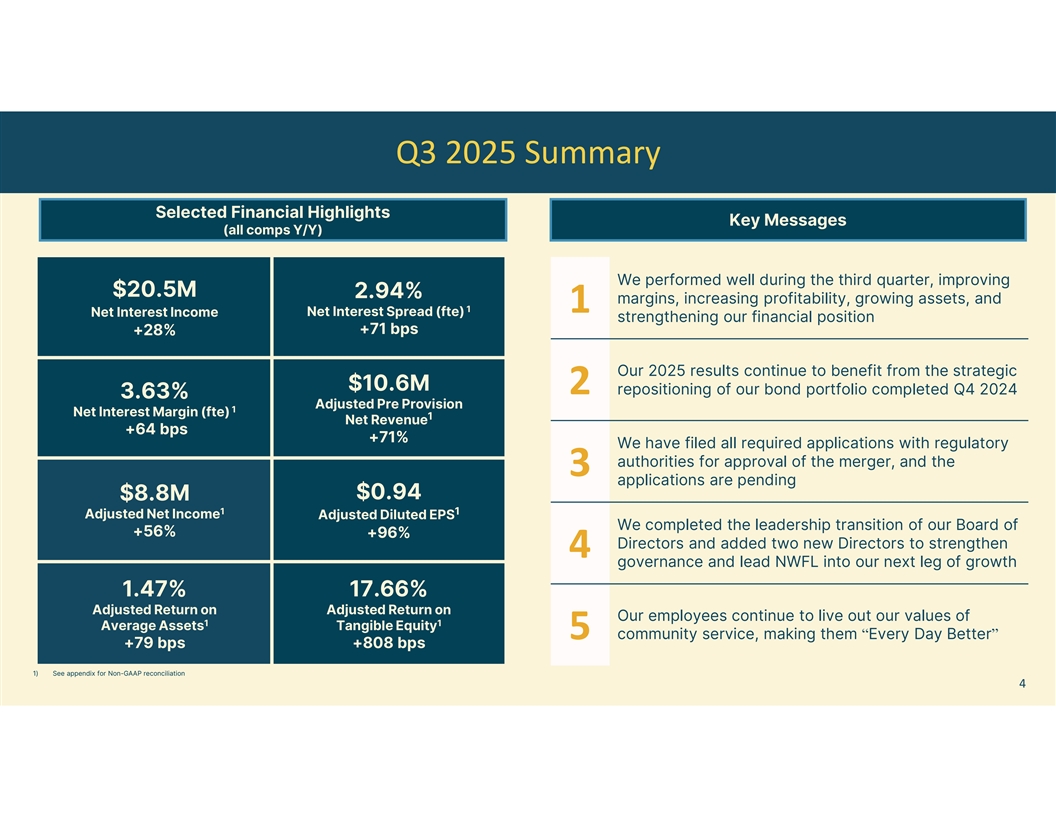
Q3 2025 Summary Selected Financial Highlights Key Messages (all comps Y/Y) We performed well during the third quarter, improving $20.5M 2.94% margins, increasing profitability, growing assets, and 1 1 Net Interest Spread (fte) Net Interest Income strengthening our financial position +71 bps +28% Our 2025 results continue to benefit from the strategic $10.6M 2 repositioning of our bond portfolio completed Q4 2024 3.63% Adjusted Pre Provision 1 Net Interest Margin (fte) 1 Net Revenue +64 bps +71% We have filed all required applications with regulatory authorities for approval of the merger, and the 3 applications are pending $0.94 $8.8M 1 1 Adjusted Net Income Adjusted Diluted EPS We completed the leadership transition of our Board of +56% +96% Directors and added two new Directors to strengthen 4 governance and lead NWFL into our next leg of growth 1.47% 17.66% Adjusted Return on Adjusted Return on Our employees continue to live out our values of 1 1 Average Assets Tangible Equity 5 community service, making them “Every Day Better” +79 bps +808 bps 1) See appendix for Non-GAAP reconciliation 4
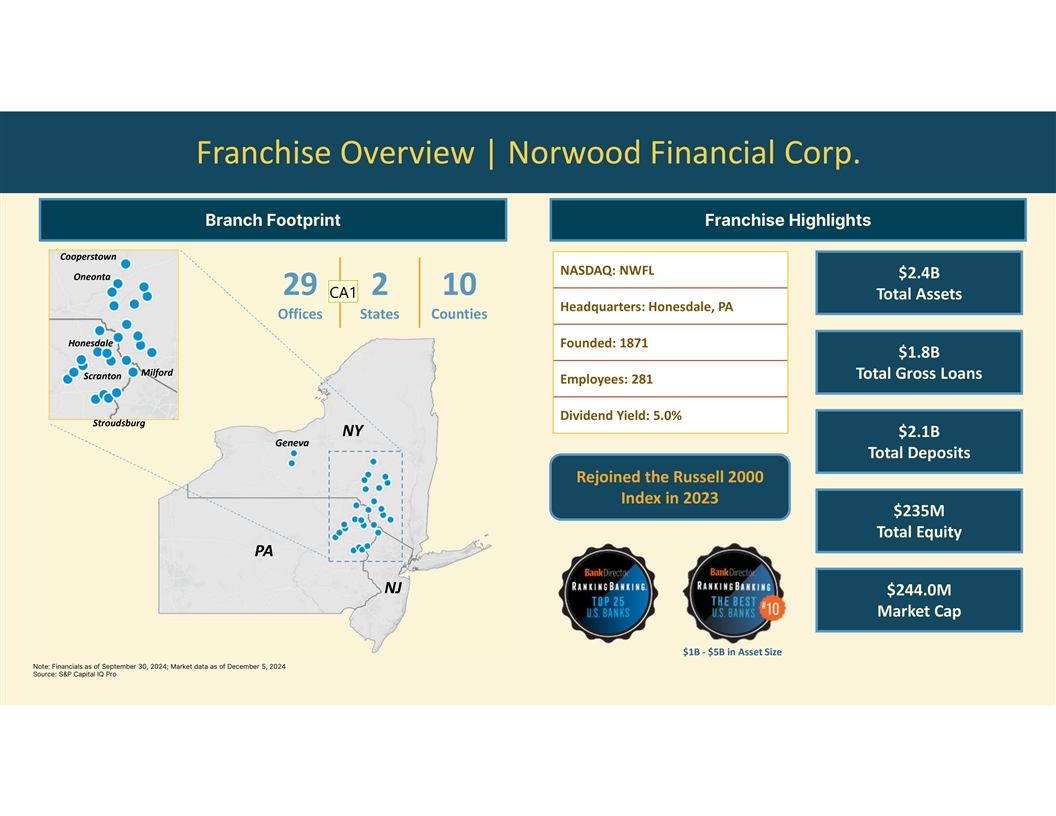
Franchise Overview | Norwood Financial Corp. Branch Footprint Franchise Highlights Cooperstown NASDAQ: NWFL $2.4B Oneonta 29 2 10 CA1 Total Assets Headquarters: Honesdale, PA Offices States Counties Honesdale Founded: 1871 $1.8B Milford Total Gross Loans Scranton Employees: 281 Dividend Yield: 5.0% Stroudsburg NY $2.1B Geneva Total Deposits Rejoined the Russell 2000 Index in 2023 $235M Total Equity PA NJ $244.0M Market Cap $1B - $5B in Asset Size Note: Financials as of September 30, 2024; Market data as of December 5, 2024 Source: S&P Capital IQ Pro
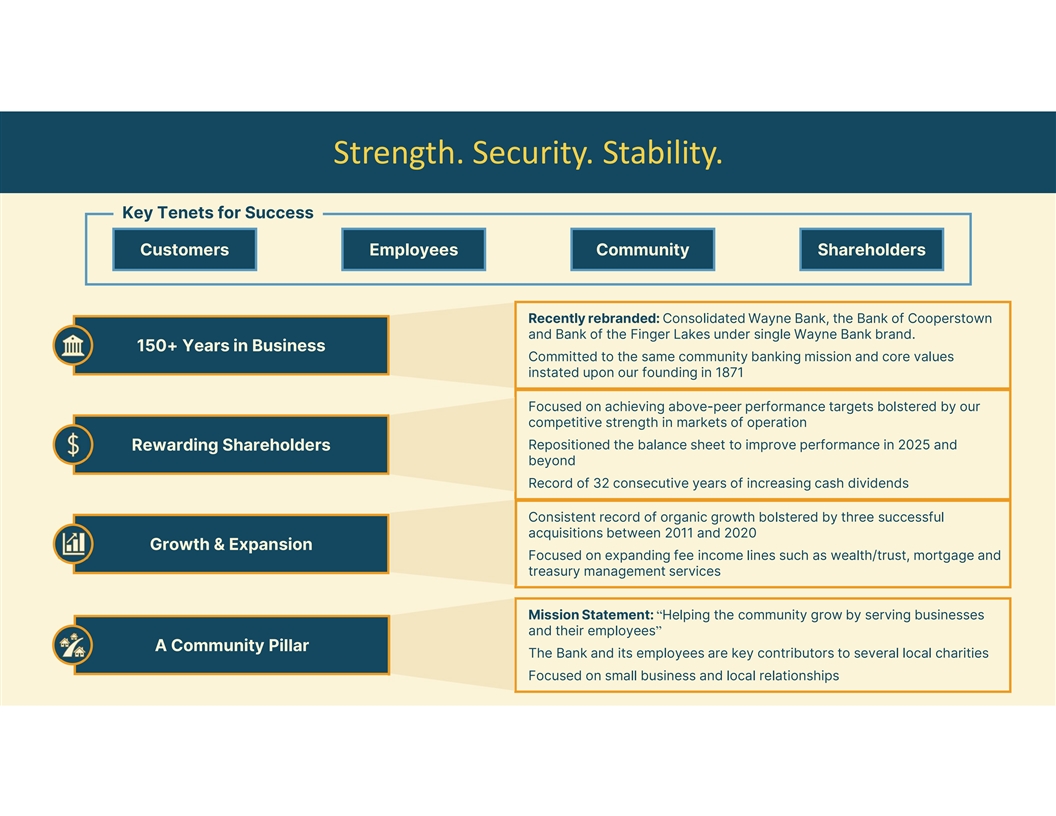
Strength. Security. Stability. Key Tenets for Success Customers Employees Community Shareholders Recently rebranded: Consolidated Wayne Bank, the Bank of Cooperstown and Bank of the Finger Lakes under single Wayne Bank brand. 150+ Years in Business Committed to the same community banking mission and core values instated upon our founding in 1871 Focused on achieving above-peer performance targets bolstered by our competitive strength in markets of operation Repositioned the balance sheet to improve performance in 2025 and Rewarding Shareholders beyond Record of 32 consecutive years of increasing cash dividends Consistent record of organic growth bolstered by three successful acquisitions between 2011 and 2020 Growth & Expansion Focused on expanding fee income lines such as wealth/trust, mortgage and treasury management services Mission Statement: “Helping the community grow by serving businesses and their employees” A Community Pillar The Bank and its employees are key contributors to several local charities Focused on small business and local relationships
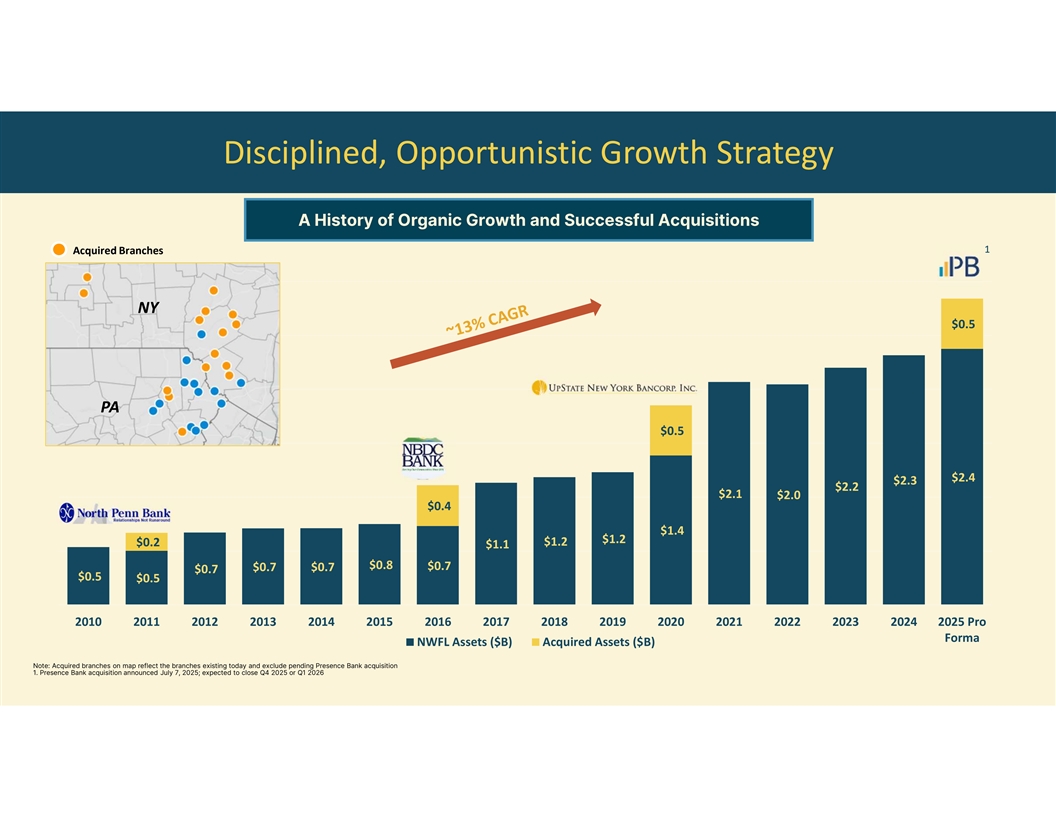
Disciplined, Opportunistic Growth Strategy A History of Organic Growth and Successful Acquisitions 1 Acquired Branches NY $0.5 PA $0.5 $2.4 $2.3 $2.2 $2.1 $2.0 $0.4 $1.4 $1.2 $1.2 $0.2 $1.1 $0.8 $0.7 $0.7 $0.7 $0.7 $0.5 $0.5 2010 2011 2012 2013 2014 2015 2016 2017 2018 2019 2020 2021 2022 2023 2024 2025 Pro Forma NWFL Assets ($B) Acquired Assets ($B) Note: Acquired branches on map reflect the branches existing today and exclude pending Presence Bank acquisition 1. Presence Bank acquisition announced July 7, 2025; expected to close Q4 2025 or Q1 2026
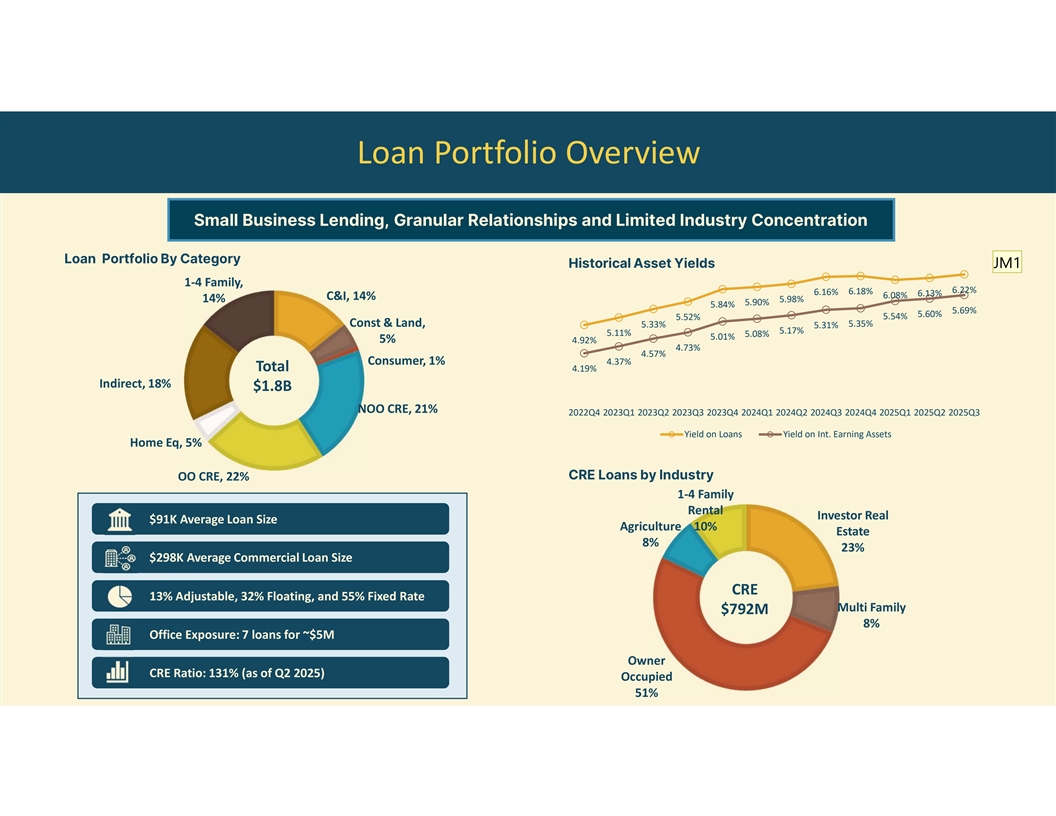
Loan Portfolio Overview Small Business Lending, Granular Relationships and Limited Industry Concentration Loan Portfolio By Category Historical Asset Yields JM1 1-4 Family, 6.22% 6.18% 6.16% 6.13% 6.08% C&I, 14% 14% 5.98% 5.90% 5.84% 5.69% 5.60% 5.52% 5.54% Const & Land, 5.35% 5.33% 5.31% 5.17% 5.11% 5.08% 5.01% 5% 4.92% 4.73% 4.57% Consumer, 1% 4.37% Total 4.19% Indirect, 18% $1.8B NOO CRE, 21% 2022Q4 2023Q1 2023Q2 2023Q3 2023Q4 2024Q1 2024Q2 2024Q3 2024Q4 2025Q1 2025Q2 2025Q3 Yield on Loans Yield on Int. Earning Assets Home Eq, 5% CRE Loans by Industry OO CRE, 22% 1-4 Family Rental Investor Real $91K Average Loan Size Agriculture 10% Estate 8% 23% $298K Average Commercial Loan Size CRE 13% Adjustable, 32% Floating, and 55% Fixed Rate Multi Family $792M 8% Office Exposure: 7 loans for ~$5M Owner CRE Ratio: 131% (as of Q2 2025) Occupied 51%
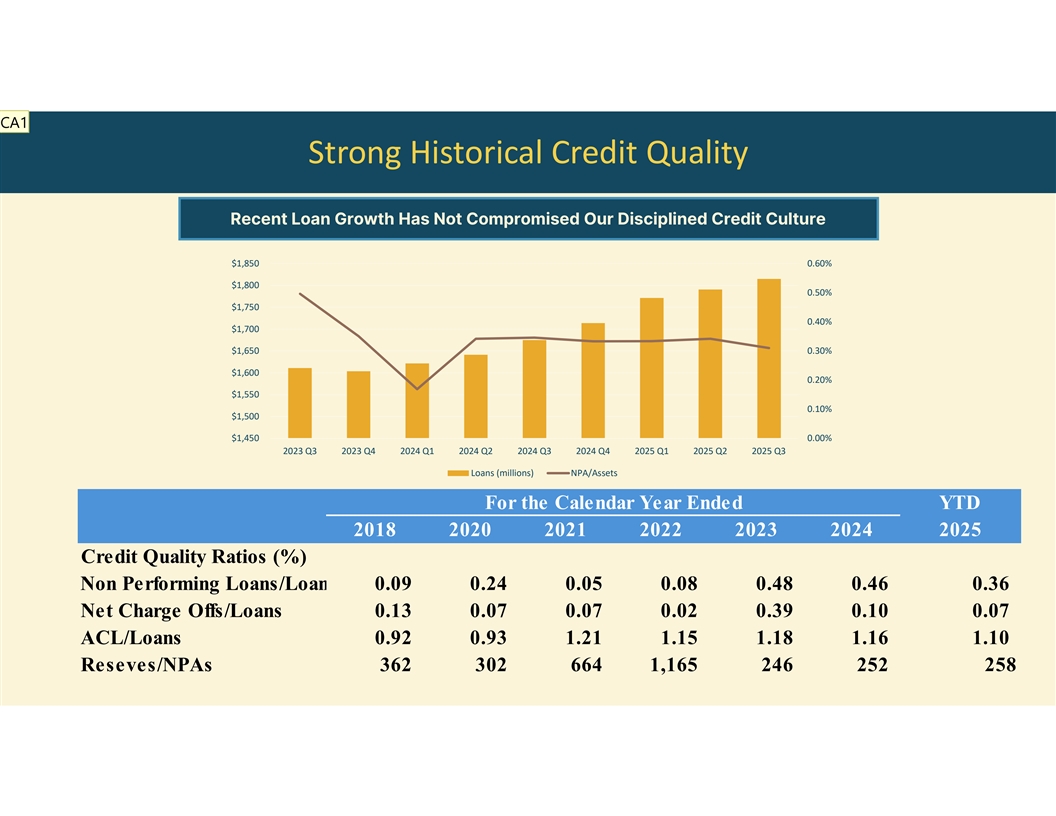
CA1 Strong Historical Credit Quality Recent Loan Growth Has Not Compromised Our Disciplined Credit Culture $1,850 0.60% $1,800 0.50% $1,750 0.40% $1,700 $1,650 0.30% $1,600 0.20% $1,550 0.10% $1,500 $1,450 0.00% 2023 Q3 2023 Q4 2024 Q1 2024 Q2 2024 Q3 2024 Q4 2025 Q1 2025 Q2 2025 Q3 Loans (millions) NPA/Assets For the Calendar Year Ended YTD 2018 2020 2021 2022 2023 2024 2025 Credit Quality Ratios (%) Non Performing Loans/Loans 0.09 0 .24 0 .05 0 .08 0 .48 0 .46 0.36 Net Charge Offs/Loans 0.13 0 .07 0 .07 0 .02 0 .39 0 .10 0.07 ACL/Loans 0.92 0 .93 1 .21 1 .15 1 .18 1 .16 1.10 Reseves/NPAs 3 62 302 6 64 1 ,165 246 2 52 258
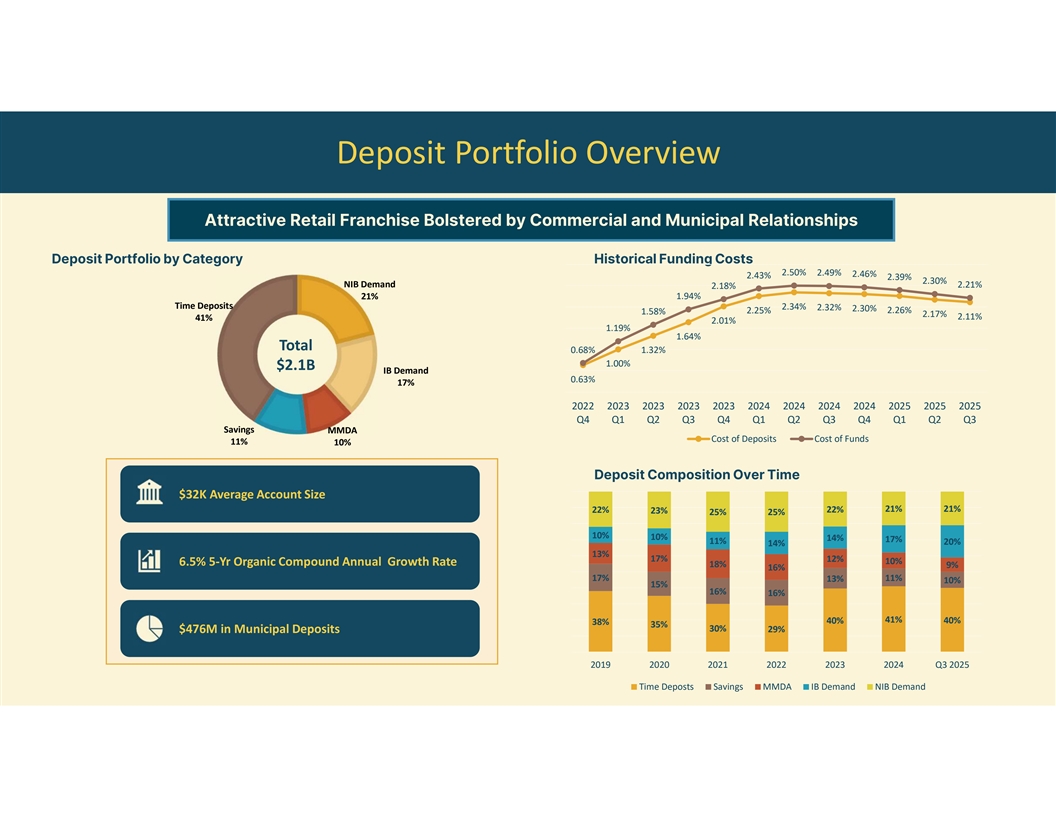
Deposit Portfolio Overview Attractive Retail Franchise Bolstered by Commercial and Municipal Relationships Deposit Portfolio by Category Historical Funding Costs 2.50% 2.49% 2.46% 2.43% 2.39% 2.30% NIB Demand 2.21% 2.18% 21% 1.94% Time Deposits 2.34% 2.32% 2.30% 2.25% 2.26% 1.58% 2.17% 2.11% 41% 2.01% 1.19% 1.64% Total 0.68% 1.32% 1.00% $2.1B IB Demand 0.63% 17% 2022 2023 2023 2023 2023 2024 2024 2024 2024 2025 2025 2025 Q4 Q1 Q2 Q3 Q4 Q1 Q2 Q3 Q4 Q1 Q2 Q3 Savings MMDA Cost of Deposits Cost of Funds 11% 10% Deposit Composition Over Time $32K Average Account Size 21% 21% 22% 23% 22% 25% 25% 10% 10% 14% 17% 11% 20% 14% 13% 17% 12% 10% 6.5% 5-Yr Organic Compound Annual Growth Rate 18% 9% 16% 17% 13% 11% 10% 15% 16% 16% 41% 40% 40% 38% 35% 30% 29% $476M in Municipal Deposits 2019 2020 2021 2022 2023 2024 Q3 2025 Time Deposts Savings MMDA IB Demand NIB Demand
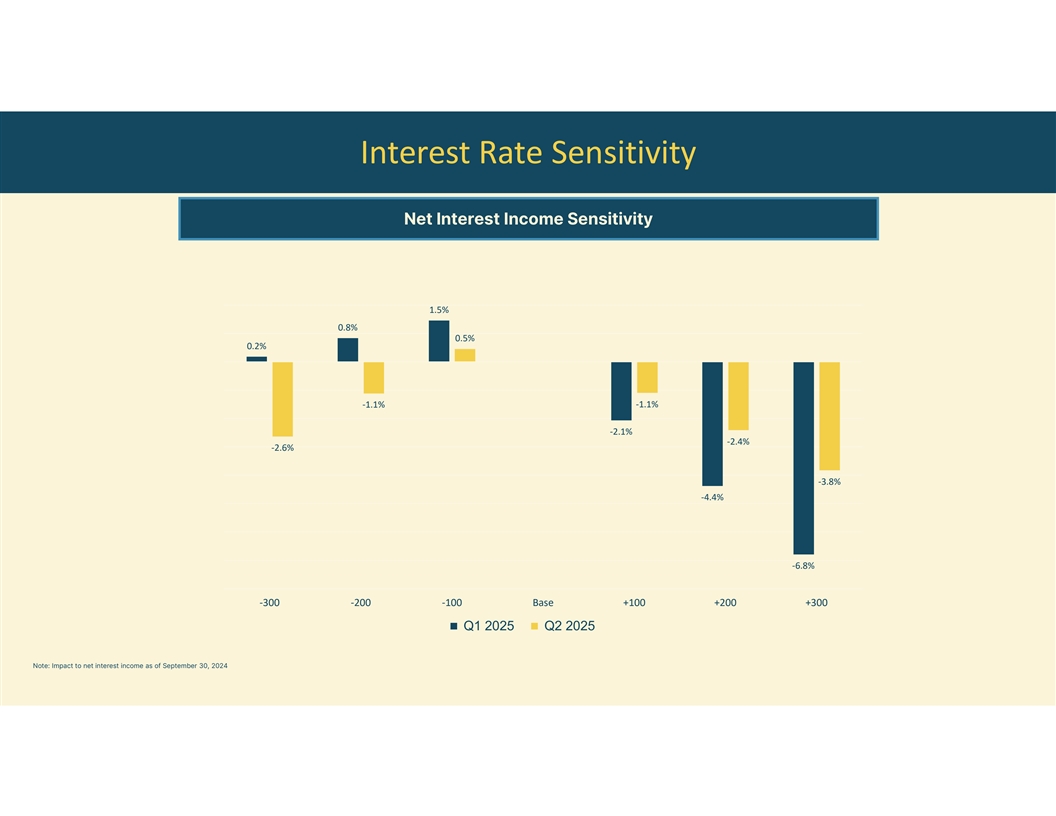
Interest Rate Sensitivity Net Interest Income Sensitivity 1.5% 0.8% 0.5% 0.2% -1.1% -1.1% -2.1% -2.4% -2.6% -3.8% -4.4% -6.8% -300 -200 -100 Base +100 +200 +300 Q1 2025 Q2 2025 Note: Impact to net interest income as of September 30, 2024
Investment Proposition Strong local ties providing consistent and Disciplined underwriting culture sound growth opportunities Experienced Executive Team, aligned Granular loan and deposit portfolio tied to with Board of Directors, focused on our community delivering shareholder return Attractive financial profile enhanced by the Well-positioned to take advantage of proposed offering and repositioning market dislocation and M&Aopportunities Strength. Security. Stability.

APPENDIX
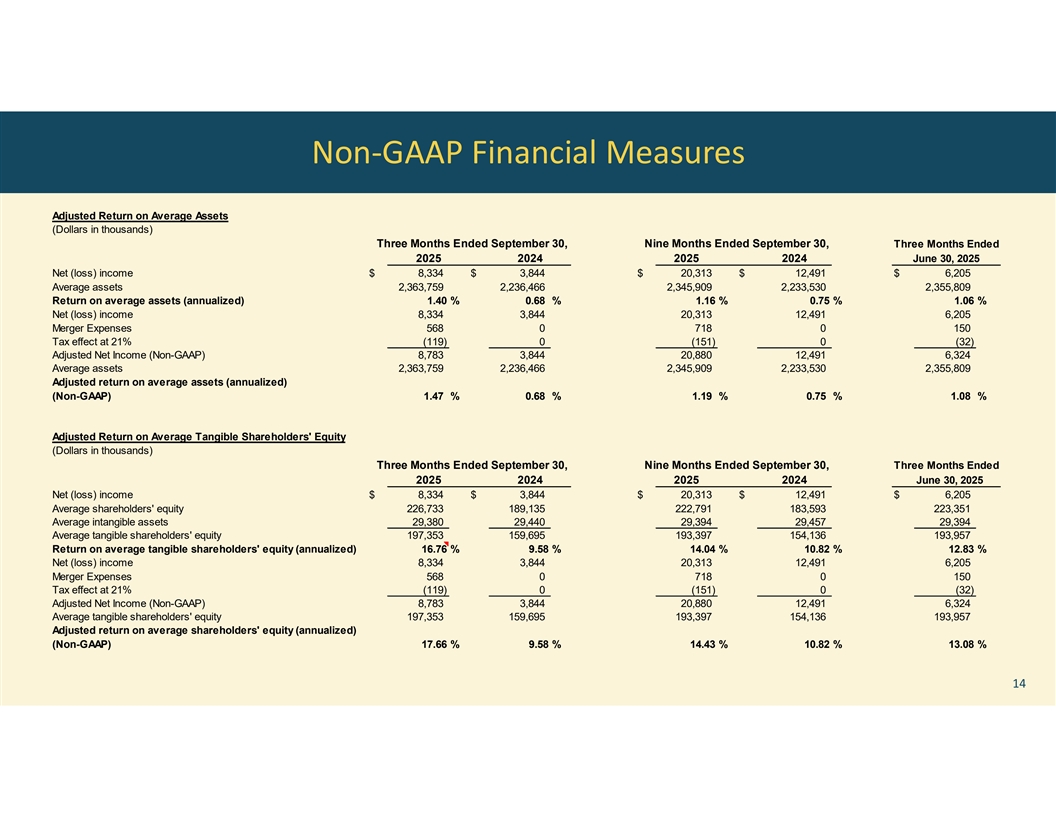
Non-GAAP Financial Measures Adjusted Return on Average Assets (Dollars in thousands) Three Months Ended September 30, Nine Months Ended September 30, Three Months Ended 2025 2024 2025 2024 June 30, 2025 Net (loss) income $ 8,334 $ 3,844 $ 20,313 $ 12,491 $ 6,205 Average assets 2,363,759 2,236,466 2,345,909 2,233,530 2,355,809 Return on average assets (annualized) 1.40 % 0.68 % 1.16 % 0.75 % 1.06 % Net (loss) income 8,334 3,844 20,313 12,491 6,205 Merger Expenses 568 0 718 0 150 Tax effect at 21% (119) 0 (151) 0 (32) Adjusted Net Income (Non-GAAP) 8,783 3,844 20,880 12,491 6,324 Average assets 2,363,759 2,236,466 2,345,909 2,233,530 2,355,809 Adjusted return on average assets (annualized) (Non-GAAP) 1.47 % 0.68 % 1.19 % 0.75 % 1.08 % Adjusted Return on Average Tangible Shareholders' Equity (Dollars in thousands) Three Months Ended September 30, Nine Months Ended September 30, Three Months Ended 2025 2024 2025 2024 June 30, 2025 Net (loss) income $ 8,334 $ 3,844 $ 20,313 $ 12,491 $ 6,205 Average shareholders' equity 226,733 189,135 222,791 183,593 223,351 Average intangible assets 29,380 29,440 29,394 29,457 29,394 Average tangible shareholders' equity 197,353 159,695 193,397 154,136 193,957 Return on average tangible shareholders' equity (annualized) 16.76 % 9.58 % 14.04 % 10.82 % 12.83 % Net (loss) income 8,334 3,844 20,313 12,491 6,205 Merger Expenses 568 0 718 0 150 Tax effect at 21% (119) 0 (151) 0 (32) Adjusted Net Income (Non-GAAP) 8,783 3,844 20,880 12,491 6,324 Average tangible shareholders' equity 197,353 159,695 193,397 154,136 193,957 Adjusted return on average shareholders' equity (annualized) (Non-GAAP) 17.66 % 9.58 % 14.43 % 10.82 % 13.08 % 14
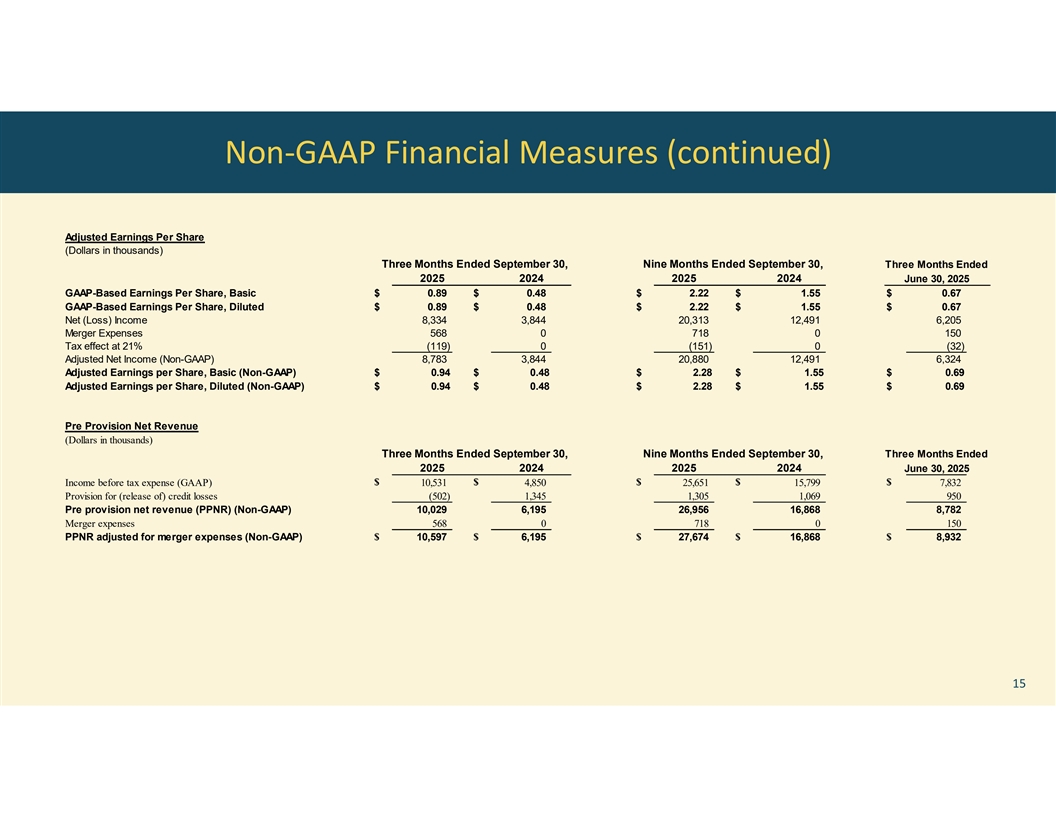
Non-GAAP Financial Measures (continued) Adjusted Earnings Per Share (Dollars in thousands) Three Months Ended September 30, Nine Months Ended September 30, Three Months Ended 2025 2024 2025 2024 June 30, 2025 GAAP-Based Earnings Per Share, Basic $ 0.89 $ 0.48 $ 2.22 $ 1.55 $ 0.67 GAAP-Based Earnings Per Share, Diluted $ 0.89 $ 0.48 $ 2.22 $ 1.55 $ 0.67 Net (Loss) Income 8,334 3,844 20,313 12,491 6,205 Merger Expenses 568 0 718 0 150 Tax effect at 21% (119) 0 (151) 0 (32) Adjusted Net Income (Non-GAAP) 8,783 3,844 20,880 12,491 6,324 Adjusted Earnings per Share, Basic (Non-GAAP) $ 0.94 $ 0.48 $ 2.28 $ 1.55 $ 0.69 Adjusted Earnings per Share, Diluted (Non-GAAP) $ 0.94 $ 0.48 $ 2.28 $ 1.55 $ 0.69 Pre Provision Net Revenue (Dollars in thousands) Three Months Ended September 30, Nine Months Ended September 30, Three Months Ended 2025 2024 2025 2024 June 30, 2025 $ $ $ $ $ Income before tax expense (GAAP) 10,531 4,850 25,651 15,799 7,832 Provision for (release of) credit losses (502) 1,345 1,305 1,069 950 Pre provision net revenue (PPNR) (Non-GAAP) 10,029 6,195 26,956 16,868 8,782 Merger expenses 568 0 718 0 150 PPNR adjusted for merger expenses (Non-GAAP) $ 10,597 $ 6,195 $ 27,674 $ 16,868 $ 8,932 15
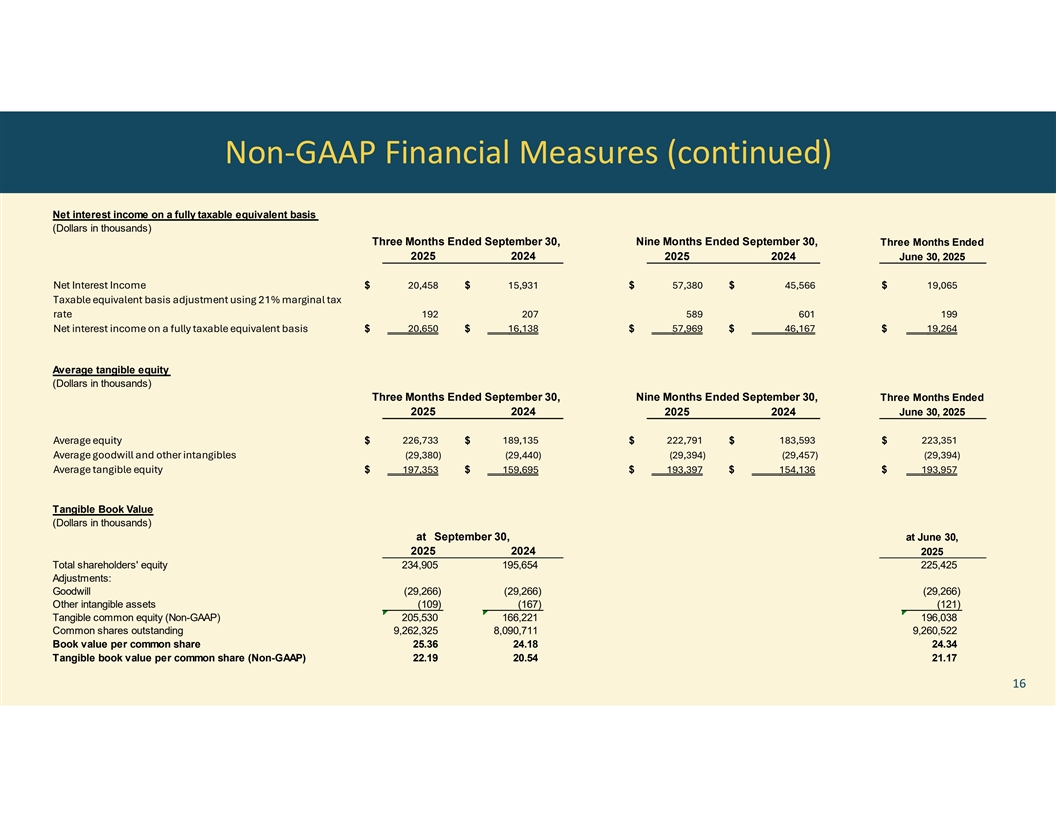
Non-GAAP Financial Measures (continued) Net interest income on a fully taxable equivalent basis (Dollars in thousands) Three Months Ended September 30, Nine Months Ended September 30, Three Months Ended 2025 2024 2025 2024 June 30, 2025 Net Interest Income $ 20,458 $ 15,931 $ 5 7,380 $ 4 5,566 $ 19,065 Taxable equivalent basis adjustment using 21% marginal tax rate 192 207 589 601 199 Net interest income on a fully taxable equivalent basis $ 2 0,650 $ 1 6,138 $ 5 7,969 $ 46,167 $ 1 9,264 Average tangible equity (Dollars in thousands) Three Months Ended September 30, Nine Months Ended September 30, Three Months Ended 2025 2024 2025 2024 June 30, 2025 Average equity $ 226,733 $ 189,135 $ 222,791 $ 183,593 $ 223,351 Average goodwill and other intangibles (29,380) (29,440) (29,394) (29,457) (29,394) Average tangible equity $ 197,353 $ 159,695 $ 193,397 $ 154,136 $ 193,957 Tangible Book Value (Dollars in thousands) at September 30, at June 30, 2025 2024 2025 Total shareholders' equity 234,905 195,654 225,425 Adjustments: Goodwill (29,266) (29,266) (29,266) Other intangible assets (109) (167) (121) Tangible common equity (Non-GAAP) 205,530 166,221 196,038 Common shares outstanding 9,262,325 8,090,711 9,260,522 Book value per common share 25.36 24.18 24.34 Tangible book value per common share (Non-GAAP) 22.19 20.54 21.17 16

Thank You