The following performance information provides some indication of the risks of investing in the Fund by showing changes in the Fund’s performance over time. The bar chart shows the annual returns for the Fund year over year. The table illustrates how the Fund’s average annual returns for the 1-year and since inception periods compare with those of a broad measure of market performance. The Fund’s past performance, before and after taxes, does not necessarily indicate how it will perform in the future. Updated performance information is available on the Fund’s website at https://tfpnetf.com.
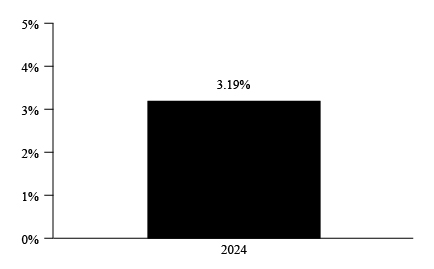
During the period of time shown in the bar chart, the Fund’s highest quarterly return was 6.88% for the quarter ended March 31, 2024 and the lowest quarterly return was -2.48% for the quarter ended June 30, 2024.
The performance information shown above is based on a calendar year. The Fund’s year-to-date return for the period ended September 30, 2025 was 0.50%.
| 1 Year | Since
Inception July 11, 2023 | |
| Return Before Taxes | 3.19% | 0.42% |
| Return After Taxes on Distributions | 2.83% | -0.07% |
| Return After Taxes on Distributions and Sale of Fund Shares | 1.92% | 0.14% |
| S&P 500 TR Index(1) (reflects no deduction for fees, expenses, or taxes) | 25.02% | 22.79% |
| SG CTA Index (2) (reflects no deduction for fees, expenses, or taxes) | 2.35% | -0.69% |
| (1) | The S&P 500 TR Index is a is a market capitalization-weighted index that tracks the performance of the 500 largest publicly traded companies in the United States, representing about 80% of the total U.S. equity market capitalization. |
| (2) | The SG CTA Index includes the largest CTAs by assets under management that are open to new investment and meet certain reporting standards. It aims to represent the overall performance of the managed futures industry, particularly medium- to long-term trend followers. |
After-tax returns are calculated using the historical highest individual federal marginal income tax rates during the period covered by the table above and do not reflect the impact of state and local taxes. Actual after-tax returns depend on an investors tax situation and may differ from those shown. After-tax returns shown are not relevant to investors who hold their Shares through tax-deferred or other tax-advantaged arrangements such as an individual retirement account (“IRA”).