
THIRD QUARTER SUMMARY FINANCIALS | ||||||||||||||
| Moody’s Corporation (MCO) Revenue | Moody’s Analytics (MA) Revenue | Moody’s Investors Service (MIS) Revenue | ||||||||||||
3Q 2025 | 3Q 2025 | 3Q 2025 | ||||||||||||
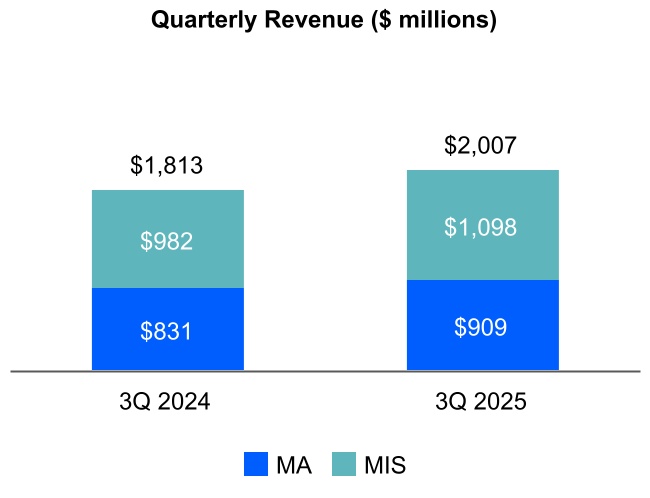
$2.0 billion ⇑ 11% | $909 million ⇑ 9% | $1.1 billion ⇑ 12% | ||||||||||||
YTD 2025 | YTD 2025 | YTD 2025 | ||||||||||||
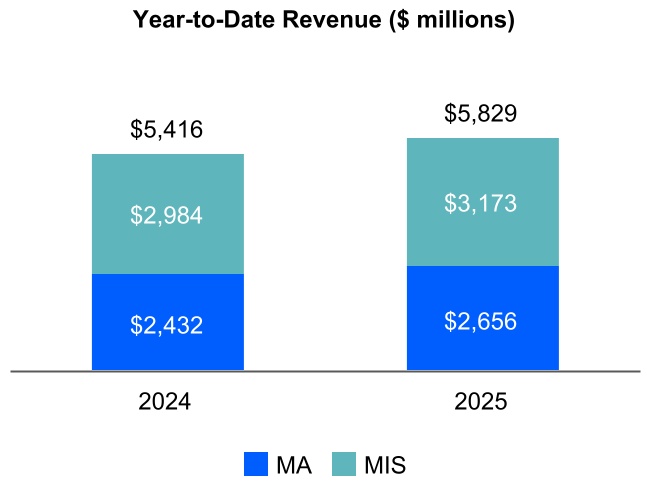
$5.8 billion ⇑ 8% | $2.7 billion ⇑ 9% | $3.2 billion ⇑ 6% | ||||||||||||
| MCO Diluted EPS | MCO Adjusted Diluted EPS2 | MCO FY 2025 Projected1 | ||||||||||||
3Q 2025 | 3Q 2025 | Diluted EPS | ||||||||||||
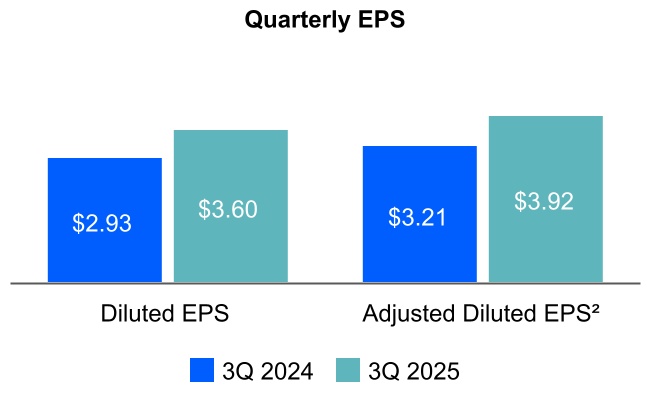
$3.60 ⇑ 23% | $3.92 ⇑ 22% | $13.15 to $13.40 | ||||||||||||
YTD 2025 | YTD 2025 | Adjusted Diluted EPS2 | ||||||||||||
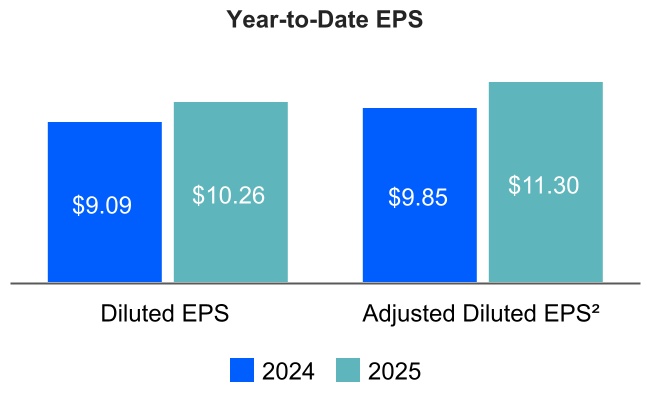
$10.26 ⇑ 13% | $11.30 ⇑ 15% | $14.50 to $14.75 | ||||||||||||
“The power of the Moody’s franchise was on full display this quarter, with strong top-line growth and significant operating leverage. The investments we’ve made to capitalize on several deep currents are paying off – enabling us to better serve our customers while giving us the financial flexibility to pursue key growth opportunities. Our results, once again, speak for themselves: significant margin expansion, strong top-line growth, and clear momentum.” | |||||
| Rob Fauber President and Chief Executive Officer | |||||
“Our financial performance this quarter was exceptional, with MCO and MIS revenue reaching record highs. We have a powerful earnings engine delivering double-digit EPS growth and generating significant free cash flow, all while investing for growth. We’re raising our guidance, most notably, our adjusted diluted EPS2 to be in the range of $14.50 to $14.751, which represents 17% year-over-year growth at the midpoint.” | |||||
| Noémie Heuland Chief Financial Officer | |||||
1 Guidance as of October 22, 2025. Refer to Table 12 - “2025 Outlook” for table of all items for which the Company provides guidance and page 10 for disclosure regarding the assumptions used by the Company with respect to its guidance. 2 Refer to the tables at the end of this press release for reconciliations of adjusted and constant currency measures to U.S. GAAP. | |||||
| REVENUE | ||
| Moody’s Corporation (MCO) | ||
Third Quarter 2025 | Year-to-Date 2025 | |||||||
•MCO revenue was $2.0 billion, an 11% increase from the prior-year period. •Foreign currency translation favorably impacted MCO revenue by 1%. | •MCO revenue was $5.8 billion, an 8% increase from the prior-year period. •Foreign currency translation favorably impacted MCO revenue by 1%. | |||||||
| Moody’s Analytics (MA) | ||
Third Quarter 2025 | Year-to-Date 2025 | |||||||
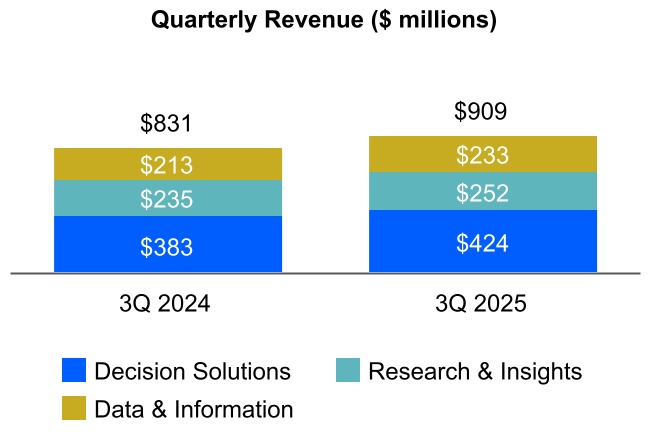
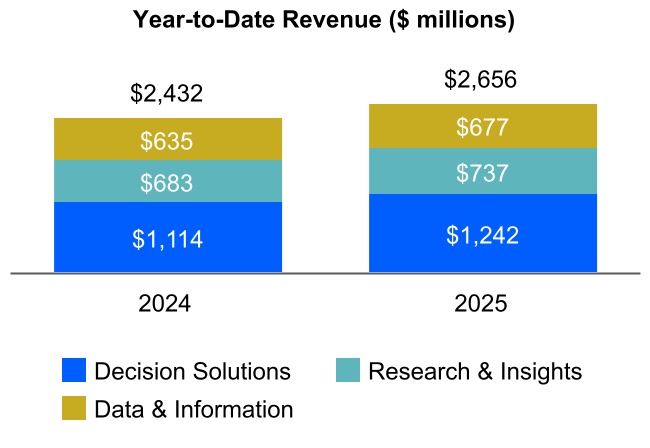
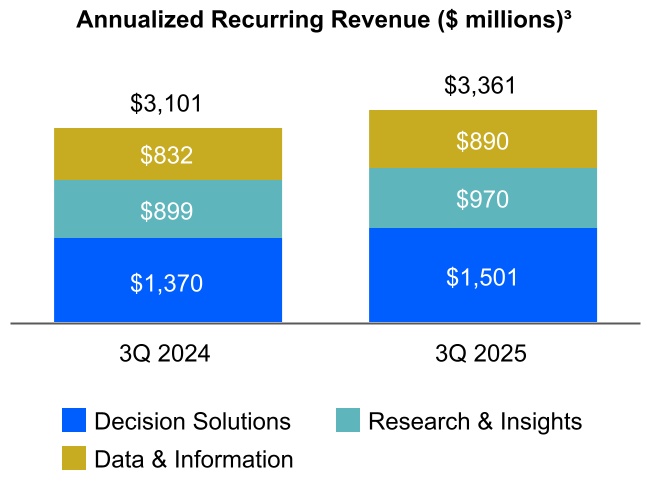
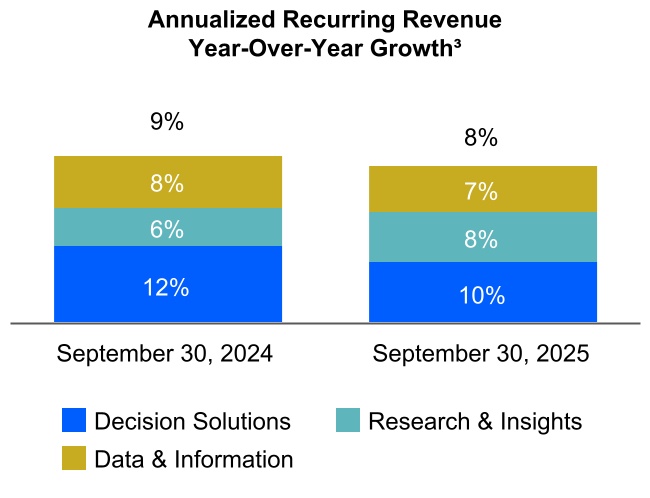
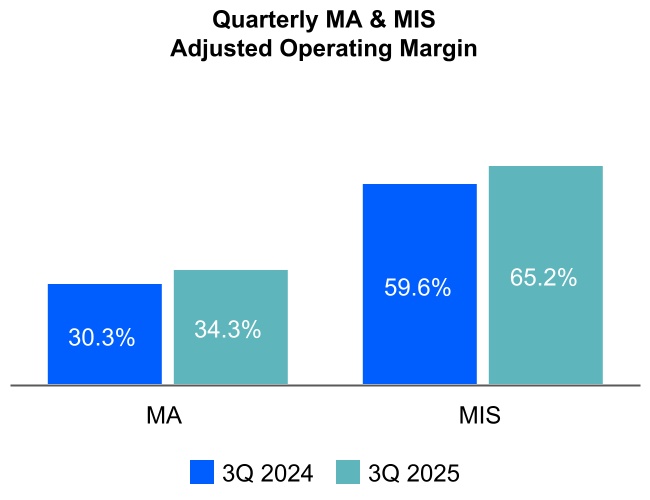
•Revenue grew 9%, or 6% on an organic constant currency basis2, versus the prior-year period, including 11% growth in Decision Solutions, 7% in Research and Insights and 9% in Data & Information. •Recurring revenue, comprising 96% of total MA revenue, grew 11% on a reported and 8% on an organic constant currency basis2. •Transaction revenue declined by 19%, reflecting MA’s ongoing strategic shift towards subscription-based solutions. •Foreign currency translation favorably impacted MA’s revenue by 2%. | •Revenue grew 9%, or 7% on an organic constant currency basis2, versus the prior-year period, with a favorable foreign currency impact of 1%. •Recurring revenue grew 11% on a reported and 8% on an organic constant currency2 basis. •ARR3 of $3.4 billion increased $260 million, representing 8% growth versus September 30, 2024. •Decision Solutions ARR3 grew 10%, including 7% in Banking, 8% in Insurance and 16% in KYC. Research & Insights and Data & Information ARR3 grew 8% and 7%, respectively. | |||||||
3 Refer to Table 10 at the end of this press release for the definition of and further information on the Annualized Recurring Revenue (ARR) metric. | |||||
| Moody’s Investors Service (MIS) | ||
Third Quarter 2025 | Year-to-Date 2025 | |||||||
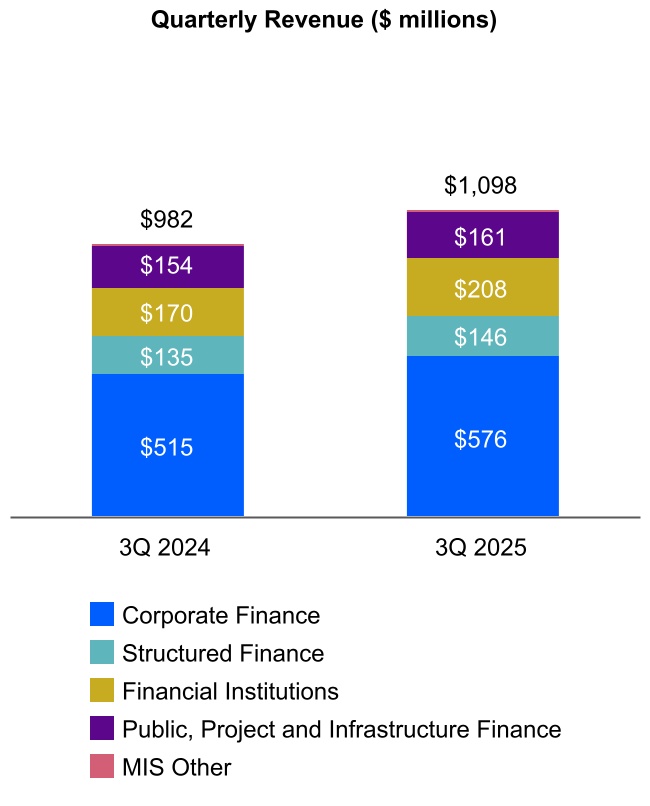
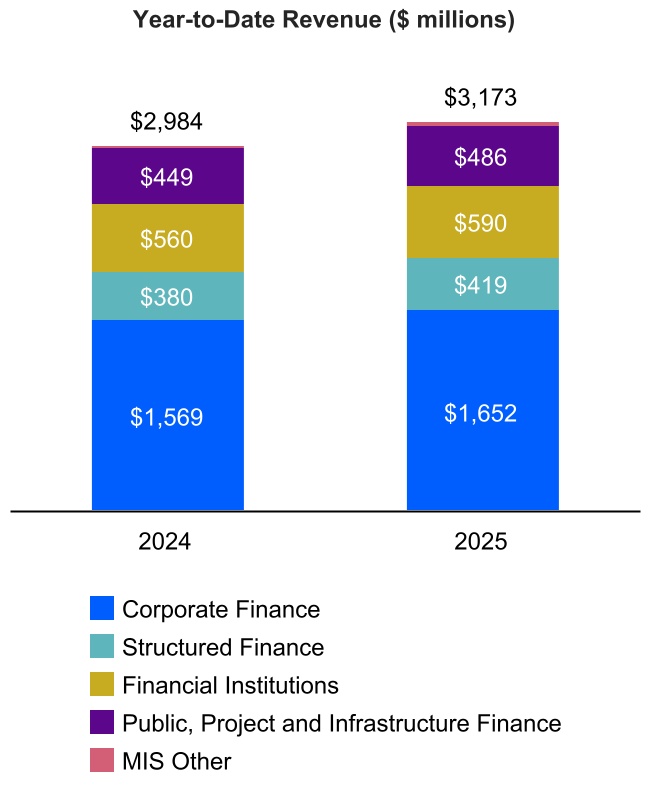
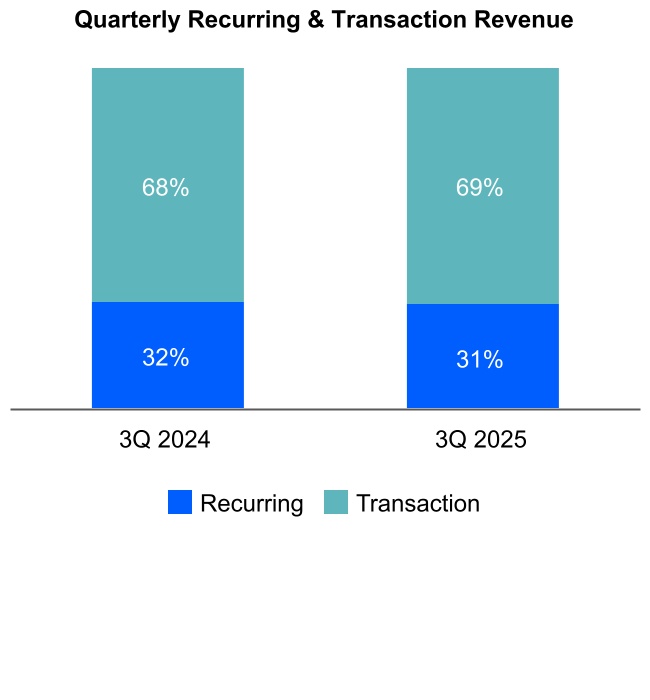
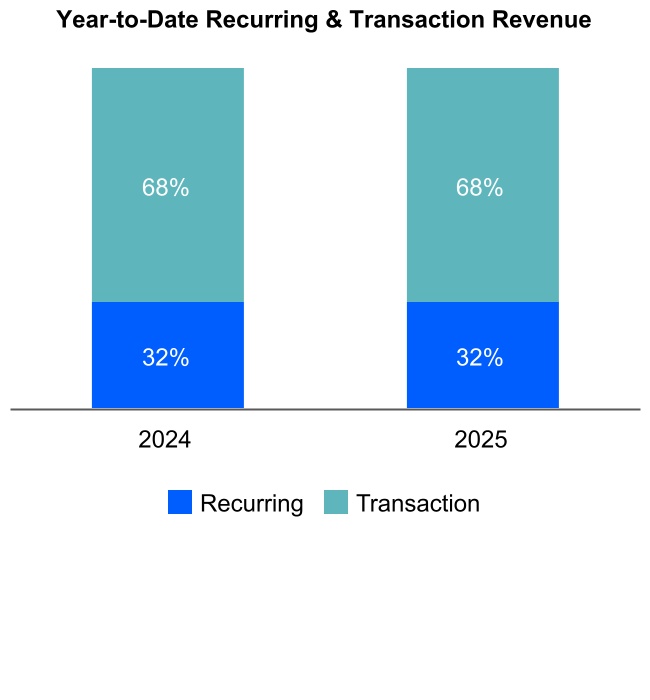
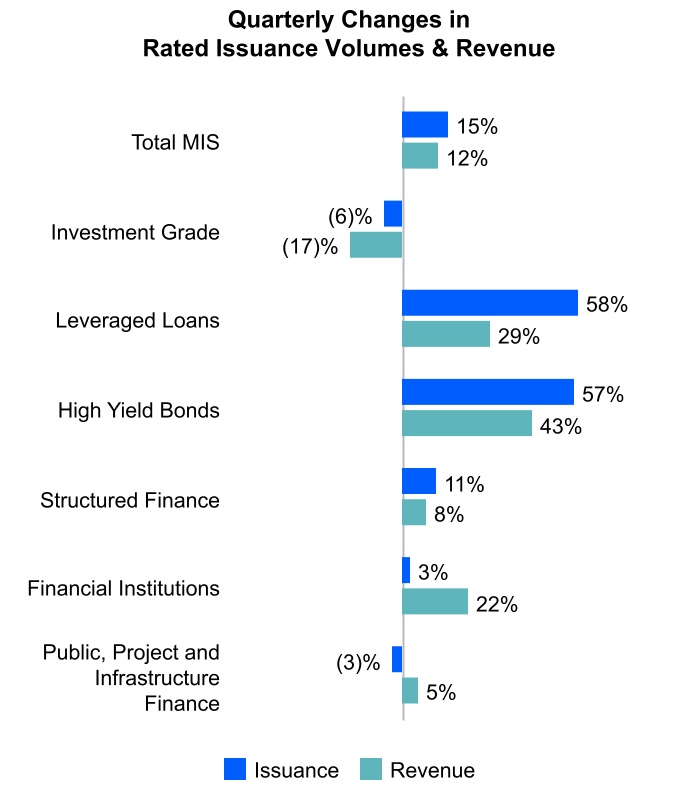
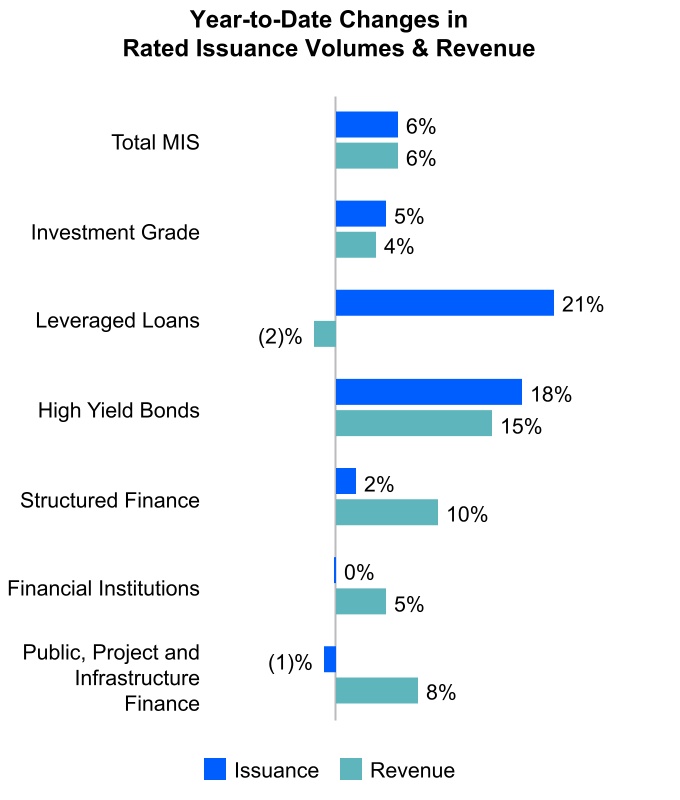
•Revenue grew 12% compared to the prior-year period, achieving a record quarter and the third successive quarter over $1 billion in revenue. •Corporate Finance revenue growth was driven by Leveraged Finance issuers, primarily from ongoing refinancing, while Investment Grade revenue declined against a strong prior-year comparative. •Financial Institutions revenue growth is attributed to the strongest quarter in over a decade for infrequent issuer issuance in Banking. •Structured Finance revenue growth was primarily driven by increased activity in CLOs, supported by growth of Leveraged Loan formation. •Public, Project and Infrastructure Finance revenue growth was mainly driven by U.S. Public Finance issuance. •Foreign currency translation favorably impacted MIS revenue by 1%. | •Revenue grew 6% compared to the prior-year period. •Market conditions remained constructive despite tariff and trade volatility, as spreads remained near historical lows and investor demand remained strong. •Corporate Finance revenue growth was driven by Investment Grade issuers, benefiting from strong demand, and High Yield issuance which improved after the subdued activity in recent years. •Financial Institutions revenue growth was primarily driven by infrequent issuance within the Banking sector. •Structured Finance revenue increased primarily from continued momentum in CMBS and CLOs, given the tight spread environment. •Public, Project and Infrastructure Finance revenue growth mainly from U.S. Public Finance as issuers tapped the market to get ahead of potential further volatility. •Foreign currency translation had an immaterial impact on MIS revenue. | |||||||
| OPERATING EXPENSES AND MARGIN | ||
MCO Operating Expenses | ||
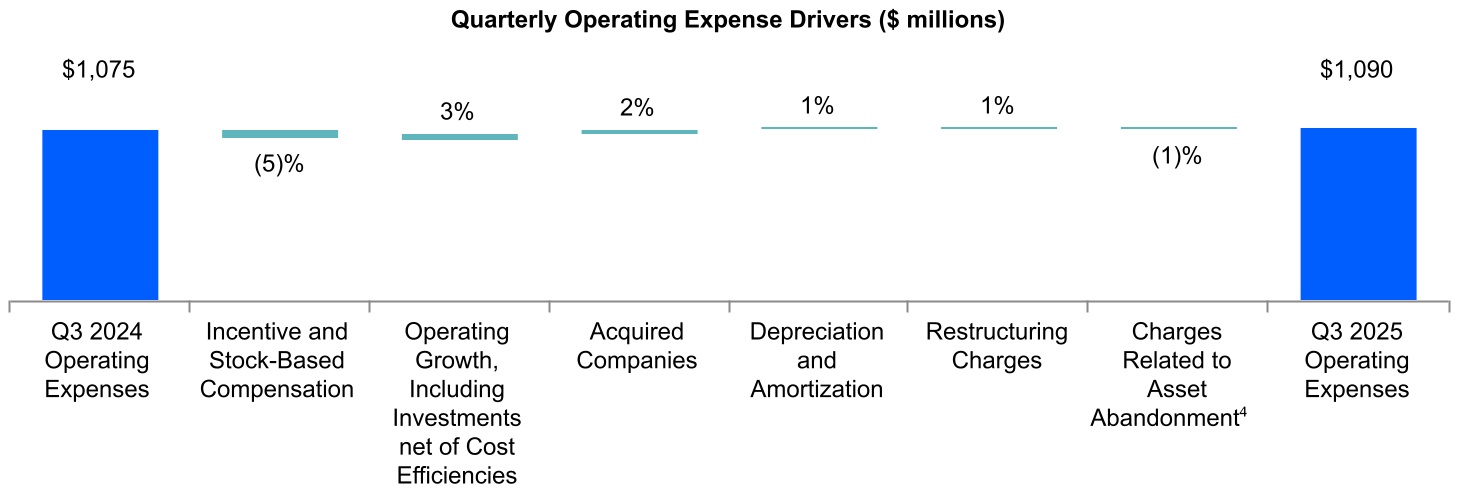
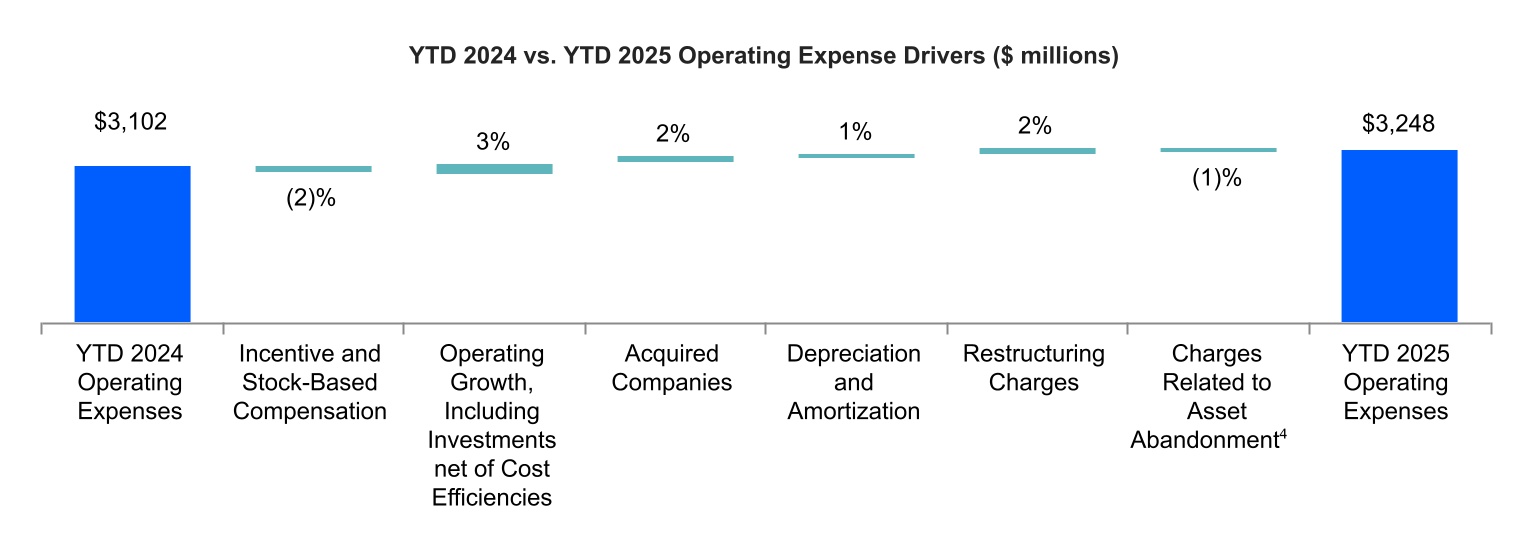
Third Quarter 2025 | Year-to-Date 2025 | |||||||
•Operating expenses were generally in line year-over-year as investments across both businesses, annual salary increases, and the impact of recent acquisitions were offset by lower incentive compensation and cost efficiency initiatives. •Foreign currency unfavorably impacted operating expenses by 1%. | •Operating expenses grew 5% including 2% from restructuring charges and 2% from inorganic expense growth from M&A. •Operating expense growth, which included organic investments and annual salary increases, was largely offset by savings from our restructuring program and lower incentive compensation accruals, reflecting continued focus on disciplined cost management. •Foreign currency had an immaterial impact on operating expenses. | |||||||
4 Refer to Table 5 - “Financial Information by Segment (Unaudited)” for more information regarding the “Charges Related to Asset Abandonment” category. | |||||
Operating Margin and Adjusted Operating Margin2 | ||
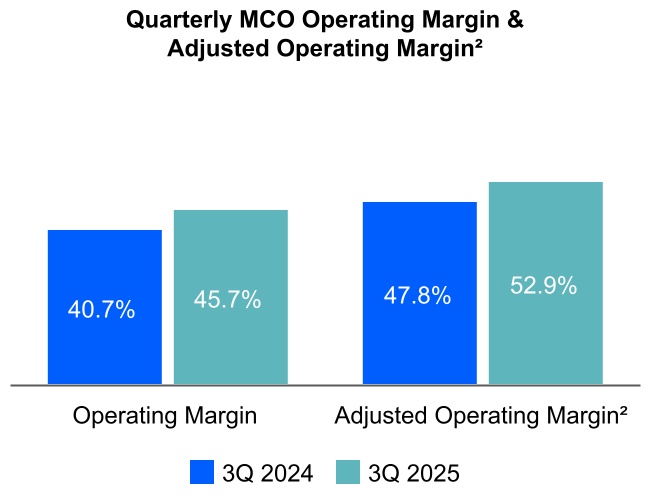
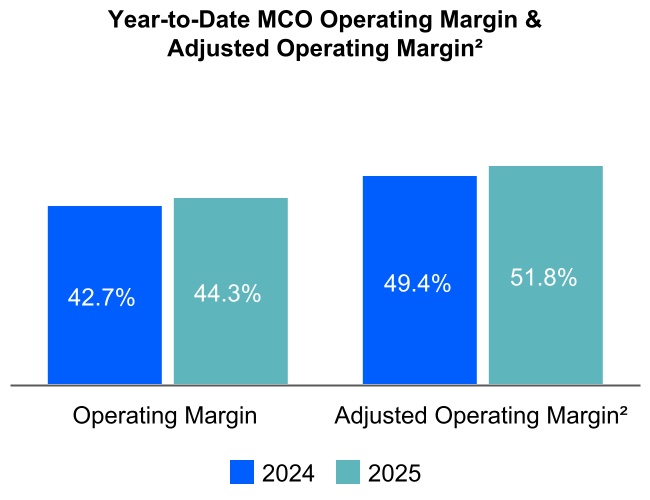
Third Quarter 2025 | Year-to-Date 2025 | |||||||
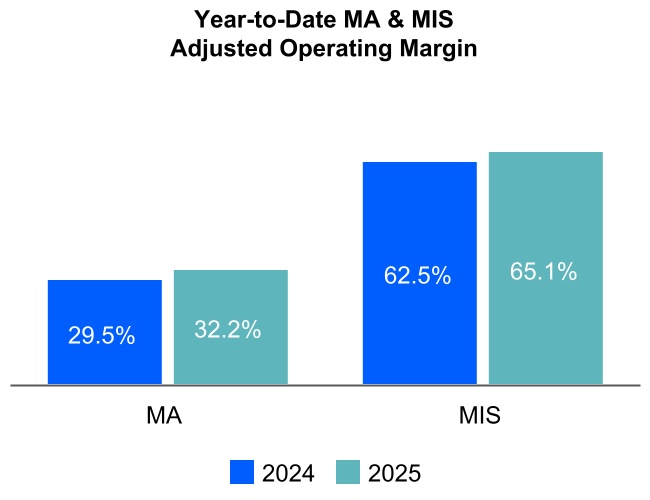
•MCO’s operating margin was 45.7%. MCO’s adjusted operating margin2 was 52.9%, increased 510 basis points from the prior-year period. •MA’s adjusted operating margin was 34.3%, up 400 basis points from the prior-year period. •MIS’s adjusted operating margin was 65.2%, up 560 basis points from the prior-year period. •Foreign currency translation had an immaterial impact on MCO’s operating and adjusted operating margins2. | •MCO’s operating margin was 44.3% and MCO’s adjusted operating margin2 was 51.8%. •MA’s adjusted operating margin was 32.2%, up 270 basis points from the prior-year period, driven by operating efficiencies and the redeployment of investment capacity into key strategic areas. •MIS’s adjusted operating margin was 65.1%, up 260 basis points from the prior-year period. •Foreign currency translation had an immaterial impact on MCO’s operating and adjusted operating margins2. | |||||||
| EARNINGS PER SHARE (EPS) | ||
Diluted EPS and Adjusted Diluted EPS2 | ||
Third Quarter 2025 | Year-to-Date 2025 | |||||||
•Diluted EPS and Adjusted Diluted EPS2 growth of 23% and 22%, respectively, from the prior-year period, driven by improved operating performance. •The Effective Tax Rate (ETR) was 25.4%, higher than the 24.0% reported in the prior-year period, and reflects tax benefits recognized in the third quarter of 2024, which resulted from the resolutions of uncertain tax positions coupled with an increase in current year state income taxes. | •Diluted EPS and Adjusted Diluted EPS2 grew 13% and 15%, respectively, from the prior-year period due to continued net income growth mainly due to strong revenue growth in MIS and MA. •The ETR was 24.2%, broadly in line with the prior-year period. | |||||||
| CAPITAL ALLOCATION AND LIQUIDITY | ||
Capital Returned to Shareholders & Free Cash Flow2 | ||
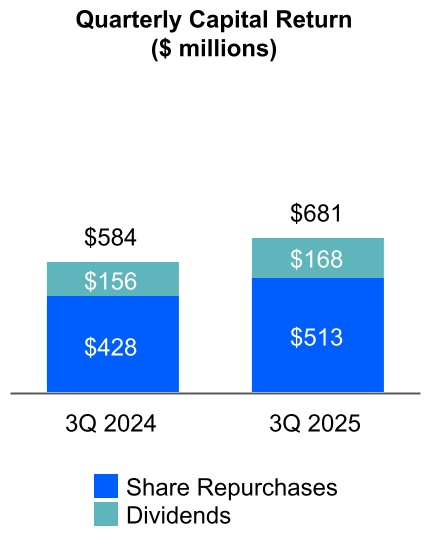
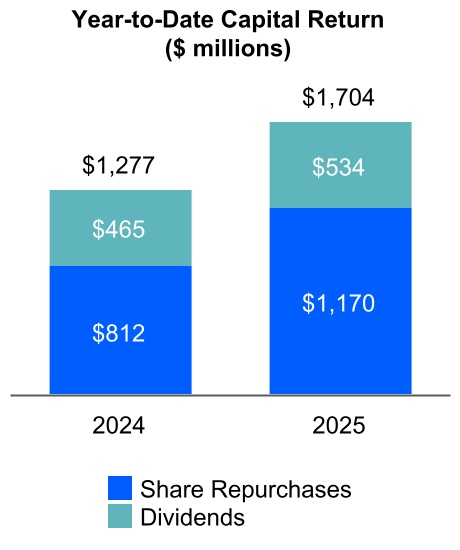
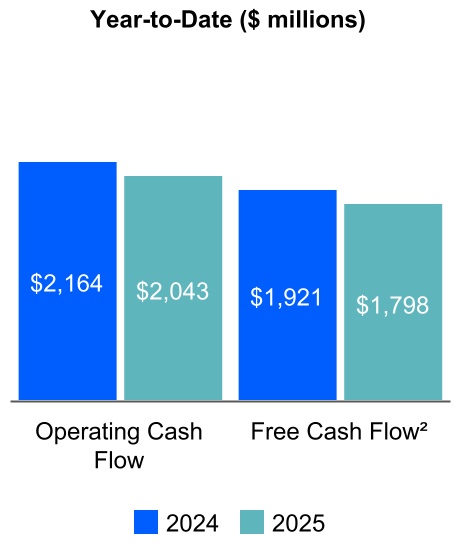
•Cash flow from operations was $2,043 million and free cash flow2 was $1,798 million. •The decrease in both operating cash flow and free cash flow2 was primarily driven by higher tax and incentive compensation payments compared to the prior-year period. •On October 21, 2025, the Moody’s Board of Directors declared a regular quarterly dividend of $0.94 per share of MCO Common Stock. The dividend will be payable on December 12, 2025, to stockholders of record at the close of business on November 21, 2025. •During the third quarter of 2025, Moody’s repurchased 1.0 million shares at an average cost of $503.66 per share and issued net 53 thousand shares as part of its employee stock-based compensation programs. The net amount included shares withheld for employee payroll taxes. •As of September 30, 2025, Moody’s had 178.4 million shares outstanding, with approximately $398 million of share repurchase authority remaining. On October 21, 2025, the Moody’s Board of Directors authorized an additional $4 billion in share repurchase authority. There is no established expiration date for the remaining authorization. •As of September 30, 2025, Moody's had $7.0 billion of outstanding debt and an undrawn $1.25 billion revolving credit facility. | ||
| ASSUMPTIONS AND OUTLOOK | ||
| Forecasted Item | Last Publicly Disclosed Assumption | Current Assumption | ||||||
U.S. GDP (1) growth | 0.5% - 1.5% | 1.5% - 2.5% | ||||||
Euro area GDP (1) growth | 0.5% - 1.5% | NC | ||||||
Global GDP (1) growth | 1.5% - 2.5% | 2.0% - 3.0% | ||||||
| Global policy rates | Expecting two cuts from the U.S. Fed in 2H25. Other Central Banks to maintain easing bias | Two federal funds rate cuts in Q4. Differing inflation outlooks are driving varied monetary policy approaches across other central banks | ||||||
| U.S. high yield spreads | To widen to around 430 bps over the next 12 months, close to historical average of around 500 bps | To widen to around 480 bps over the next 12 months, close to historical average of around 500 bps | ||||||
| U.S. inflation rate | 2.5% - 3.5% | NC | ||||||
| Euro area inflation rate | 2.0% - 2.5% | Around 2.0% | ||||||
| U.S. unemployment rate | 4.0% - 5.0% during 2025 | NC | ||||||
| Global high yield default rate | To decline to around 3.6% by year-end | To decline to around 3.7% by year-end | ||||||
| Global MIS rated issuance | Decrease in the low-single-digit to mid-single-digit percent range | Increase in the mid-single-digit percent range | ||||||
| GBP/USD exchange rate | $1.37 for the remainder of the year | $1.35 for the remainder of the year | ||||||
| EUR/USD exchange rate | $1.17 for the remainder of the year | $1.18 for the remainder of the year | ||||||
NC - There is no difference between the Company’s current assumption and the last publicly disclosed assumption for this item. Note: All current assumptions are as of October 22, 2025. (1) GDP growth represents real GDP. | ||||||||
| TELECONFERENCE DETAILS | ||
| Date and Time | October 22, 2025, at 9:00 a.m. Eastern Time (ET). | |||||||
| Webcast | The webcast and its replay can be accessed through Moody’s Investor Relations website, ir.moodys.com, within “Events & Presentations.” | |||||||
| Dial In | U.S. and Canada | ‘+1-888-596-4144 | ||||||
Other callers | ‘+1-646-968-2525 | |||||||
| Passcode | 515 6491 | |||||||
| Dial In Replay | A replay will be available immediately after the call on October 22, 2025 and until October 29, 2025. | |||||||
U.S. and Canada | ‘+1-800-770-2030 | |||||||
Other callers | ‘+1-609-800-9909 | |||||||
| Passcode | 515 6491 | |||||||
| ABOUT MOODY’S CORPORATION | ||
| “SAFE HARBOR” STATEMENT UNDER THE PRIVATE SECURITIES LITIGATION REFORM ACT OF 1995 | ||
Three Months Ended September 30, | Nine Months Ended September 30, | ||||||||||||||||||||||
| Amounts in millions, except per share amounts | 2025 | 2024 | 2025 | 2024 | |||||||||||||||||||
| Revenue | $ | 2,007 | $ | 1,813 | $ | 5,829 | $ | 5,416 | |||||||||||||||
| Expenses: | |||||||||||||||||||||||
| Operating | 492 | 512 | 1,472 | 1,448 | |||||||||||||||||||
Selling, general and administrative | 453 | 434 | 1,335 | 1,293 | |||||||||||||||||||
| Depreciation and amortization | 123 | 108 | 356 | 318 | |||||||||||||||||||
| Restructuring | 21 | 6 | 81 | 13 | |||||||||||||||||||
| Charges related to asset abandonment | 1 | 15 | 4 | 30 | |||||||||||||||||||
| Total expenses | 1,090 | 1,075 | 3,248 | 3,102 | |||||||||||||||||||
| Operating income | 917 | 738 | 2,581 | 2,314 | |||||||||||||||||||
| Non-operating (expense) income, net | |||||||||||||||||||||||
| Interest expense, net | (58) | (60) | (180) | (185) | |||||||||||||||||||
Other non-operating income, net | 8 | 25 | 42 | 45 | |||||||||||||||||||
| Total non-operating (expense) income, net | (50) | (35) | (138) | (140) | |||||||||||||||||||
| Income before provision for income taxes | 867 | 703 | 2,443 | 2,174 | |||||||||||||||||||
| Provision for income taxes | 220 | 169 | 592 | 510 | |||||||||||||||||||
| Net income | 647 | 534 | 1,851 | 1,664 | |||||||||||||||||||
Less: Net income attributable to noncontrolling interests | 1 | — | 2 | 1 | |||||||||||||||||||
Net income attributable to Moody's | $ | 646 | $ | 534 | $ | 1,849 | $ | 1,663 | |||||||||||||||
| Earnings per share attributable to Moody's common shareholders | |||||||||||||||||||||||
| Basic | $ | 3.61 | $ | 2.94 | $ | 10.30 | $ | 9.13 | |||||||||||||||
| Diluted | $ | 3.60 | $ | 2.93 | $ | 10.26 | $ | 9.09 | |||||||||||||||
| Weighted average number of shares outstanding | |||||||||||||||||||||||
| Basic | 178.9 | 181.7 | 179.5 | 182.2 | |||||||||||||||||||
| Diluted | 179.6 | 182.5 | 180.2 | 183.0 | |||||||||||||||||||
| Amounts in millions | September 30, 2025 | December 31, 2024 | |||||||||
| ASSETS | |||||||||||
| Current assets: | |||||||||||
| Cash and cash equivalents | $ | 2,181 | $ | 2,408 | |||||||
| Short-term investments | 78 | 566 | |||||||||
Accounts receivable, net of allowance for credit losses of $33 in 2025 and $32 in 2024 | 1,774 | 1,801 | |||||||||
| Other current assets | 566 | 515 | |||||||||
| Total current assets | 4,599 | 5,290 | |||||||||
Property and equipment, net of accumulated depreciation of $1,506 in 2025 and $1,453 in 2024 | 712 | 656 | |||||||||
| Operating lease right-of-use assets | 300 | 216 | |||||||||
| Goodwill | 6,465 | 5,994 | |||||||||
| Intangible assets, net | 1,916 | 1,890 | |||||||||
| Deferred tax assets, net | 288 | 293 | |||||||||
| Other assets | 1,135 | 1,166 | |||||||||
| Total assets | $ | 15,415 | $ | 15,505 | |||||||
| LIABILITIES AND SHAREHOLDERS' EQUITY | |||||||||||
| Current liabilities: | |||||||||||
| Accounts payable and accrued liabilities | $ | 1,032 | $ | 1,344 | |||||||
| Current portion of operating lease liabilities | 98 | 102 | |||||||||
| Current portion of long-term debt | — | 697 | |||||||||
| Deferred revenue | 1,369 | 1,454 | |||||||||
| Total current liabilities | 2,499 | 3,597 | |||||||||
| Non-current portion of deferred revenue | 58 | 57 | |||||||||
| Long-term debt | 6,983 | 6,731 | |||||||||
| Deferred tax liabilities, net | 348 | 449 | |||||||||
| Uncertain tax positions | 232 | 211 | |||||||||
| Operating lease liabilities | 282 | 216 | |||||||||
| Other liabilities | 901 | 517 | |||||||||
| Total liabilities | 11,303 | 11,778 | |||||||||
| Total Moody's shareholders' equity | 3,957 | 3,565 | |||||||||
| Noncontrolling interests | 155 | 162 | |||||||||
| Total shareholders' equity | 4,112 | 3,727 | |||||||||
Total liabilities, noncontrolling interests and shareholders' equity | $ | 15,415 | $ | 15,505 | |||||||
| Nine Months Ended September 30, | |||||||||||
| Amounts in millions | 2025 | 2024 | |||||||||
Cash flows from operating activities | |||||||||||
| Net income | $ | 1,851 | $ | 1,664 | |||||||
Reconciliation of net income to net cash provided by operating activities: | |||||||||||
| Depreciation and amortization | 356 | 318 | |||||||||
| Stock-based compensation | 174 | 166 | |||||||||
| Deferred income taxes | 40 | 9 | |||||||||
Non-cash restructuring and abandonment-related charges | 8 | 15 | |||||||||
Provision for credit losses on accounts receivable | 11 | 14 | |||||||||
Gain on previously held/sold investments in non-consolidated affiliates | — | (7) | |||||||||
Net changes in other operating assets and liabilities | (397) | (15) | |||||||||
| Net cash provided by operating activities | 2,043 | 2,164 | |||||||||
Cash flows from investing activities | |||||||||||
| Capital additions | (245) | (243) | |||||||||
| Purchases of investments | (158) | (623) | |||||||||
| Sales and maturities of investments | 656 | 105 | |||||||||
Purchases of investments in non-consolidated affiliates | (14) | (4) | |||||||||
| Receipts from settlement of net investment hedges | 32 | — | |||||||||
| Cash paid for acquisitions, net of cash acquired | (227) | (110) | |||||||||
| Net cash provided by (used in) investing activities | 44 | (875) | |||||||||
Cash flows from financing activities | |||||||||||
| Issuance of notes | — | 496 | |||||||||
| Repayment of notes | (700) | — | |||||||||
Proceeds from stock-based compensation plans | 44 | 60 | |||||||||
Repurchase of shares related to stock-based compensation | (92) | (85) | |||||||||
Treasury shares | (1,170) | (812) | |||||||||
Dividends | (534) | (465) | |||||||||
| Dividends to noncontrolling interests | (2) | (1) | |||||||||
Debt issuance costs, extinguishment costs and related fees | — | (5) | |||||||||
| Net cash used in financing activities | (2,454) | (812) | |||||||||
Effect of exchange rate changes on cash and cash equivalents | 140 | 35 | |||||||||
| (Decrease) increase in cash and cash equivalents | (227) | 512 | |||||||||
Cash and cash equivalents, beginning of period | 2,408 | 2,130 | |||||||||
Cash and cash equivalents, end of period | $ | 2,181 | $ | 2,642 | |||||||
Three Months Ended September 30, | Nine Months Ended September 30, | ||||||||||||||||||||||
| Amounts in millions | 2025 | 2024 | 2025 | 2024 | |||||||||||||||||||
| Interest: | |||||||||||||||||||||||
| Income | $ | 14 | $ | 28 | $ | 51 | $ | 73 | |||||||||||||||
Expense on borrowings(1) | (59) | (79) | (193) | (227) | |||||||||||||||||||
Expense on UTPs and other tax related liabilities | (6) | (3) | (17) | (12) | |||||||||||||||||||
| Net periodic pension costs - interest component | (7) | (6) | (21) | (19) | |||||||||||||||||||
Interest expense, net | $ | (58) | $ | (60) | $ | (180) | $ | (185) | |||||||||||||||
Other non-operating income, net: | |||||||||||||||||||||||
FX gains (losses) | $ | (7) | $ | — | $ | (10) | $ | (7) | |||||||||||||||
| Net periodic pension income - non-service and non-interest cost components | 9 | 9 | 27 | 25 | |||||||||||||||||||
Income from investments in non-consolidated affiliates | 4 | 8 | 18 | 10 | |||||||||||||||||||
Gain on previously held equity method investments(2) | — | 7 | — | 7 | |||||||||||||||||||
| Gain on investments | 3 | 4 | 8 | 12 | |||||||||||||||||||
Other | (1) | (3) | (1) | (2) | |||||||||||||||||||
Other non-operating income, net | $ | 8 | $ | 25 | $ | 42 | $ | 45 | |||||||||||||||
| Total non-operating (expense) income, net | $ | (50) | $ | (35) | $ | (138) | $ | (140) | |||||||||||||||
(1) Expense on borrowings includes interest on long-term debt and realized gains/losses related to interest rate swaps and cross currency swaps. | ||
(2) The amount for the three and nine months ended September 30, 2024 reflects non-cash gains relating to the step-acquisitions of Praedicat and GCR. | ||
Three Months Ended September 30, | |||||||||||||||||||||||||||||||||||||||||||||||
| 2025 | 2024 | ||||||||||||||||||||||||||||||||||||||||||||||
| Amounts in millions | MA | MIS | Eliminations | Consolidated | MA | MIS | Eliminations | Consolidated | |||||||||||||||||||||||||||||||||||||||
| Total external revenue | $ | 909 | $ | 1,098 | $ | — | $ | 2,007 | $ | 831 | $ | 982 | $ | — | $ | 1,813 | |||||||||||||||||||||||||||||||
| Intersegment revenue | 3 | 50 | (53) | — | 3 | 48 | (51) | — | |||||||||||||||||||||||||||||||||||||||
| Total revenue | 912 | 1,148 | (53) | 2,007 | 834 | 1,030 | (51) | 1,813 | |||||||||||||||||||||||||||||||||||||||
Compensation expense | 352 | 283 | — | 635 | 350 | 318 | — | 668 | |||||||||||||||||||||||||||||||||||||||
Non-compensation expense | 197 | 113 | — | 310 | 183 | 95 | — | 278 | |||||||||||||||||||||||||||||||||||||||
Intersegment expense | 50 | 3 | (53) | — | 48 | 3 | (51) | — | |||||||||||||||||||||||||||||||||||||||
| Operating, SG&A | 599 | 399 | (53) | 945 | 581 | 416 | (51) | 946 | |||||||||||||||||||||||||||||||||||||||
| Adjusted Operating Income | $ | 313 | $ | 749 | $ | — | $ | 1,062 | $ | 253 | $ | 614 | $ | — | $ | 867 | |||||||||||||||||||||||||||||||
| Adjusted Operating Margin | 34.3 | % | 65.2 | % | 52.9 | % | 30.3 | % | 59.6 | % | 47.8 | % | |||||||||||||||||||||||||||||||||||
| Depreciation and amortization | 101 | 22 | — | 123 | 88 | 20 | — | 108 | |||||||||||||||||||||||||||||||||||||||
| Restructuring | 15 | 6 | — | 21 | 4 | 2 | — | 6 | |||||||||||||||||||||||||||||||||||||||
Charges related to asset abandonment (1) | 1 | — | — | 1 | 15 | — | — | 15 | |||||||||||||||||||||||||||||||||||||||
| Operating income | $ | 917 | $ | 738 | |||||||||||||||||||||||||||||||||||||||||||
| Operating margin | 45.7 | % | 40.7 | % | |||||||||||||||||||||||||||||||||||||||||||
Non-operating (expense) income, net | (50) | (35) | |||||||||||||||||||||||||||||||||||||||||||||
Income before provision for income taxes | $ | 867 | $ | 703 | |||||||||||||||||||||||||||||||||||||||||||
Nine Months Ended September 30, | |||||||||||||||||||||||||||||||||||||||||||||||
| 2025 | 2024 | ||||||||||||||||||||||||||||||||||||||||||||||
| Amounts in millions | MA | MIS | Eliminations | Consolidated | MA | MIS | Eliminations | Consolidated | |||||||||||||||||||||||||||||||||||||||
| Total external revenue | $ | 2,656 | $ | 3,173 | $ | — | $ | 5,829 | $ | 2,432 | $ | 2,984 | $ | — | $ | 5,416 | |||||||||||||||||||||||||||||||
| Intersegment revenue | 9 | 149 | (158) | — | 10 | 144 | (154) | — | |||||||||||||||||||||||||||||||||||||||
| Total revenue | 2,665 | 3,322 | (158) | 5,829 | 2,442 | 3,128 | (154) | 5,416 | |||||||||||||||||||||||||||||||||||||||
Compensation expense | 1,069 | 843 | — | 1,912 | 1,023 | 867 | — | 1,890 | |||||||||||||||||||||||||||||||||||||||
Non-compensation expense | 589 | 306 | — | 895 | 554 | 297 | — | 851 | |||||||||||||||||||||||||||||||||||||||
Intersegment expense | 149 | 9 | (158) | — | 144 | 10 | (154) | — | |||||||||||||||||||||||||||||||||||||||
| Operating, SG&A | 1,807 | 1,158 | (158) | 2,807 | 1,721 | 1,174 | (154) | 2,741 | |||||||||||||||||||||||||||||||||||||||
| Adjusted Operating Income | $ | 858 | $ | 2,164 | $ | — | $ | 3,022 | $ | 721 | $ | 1,954 | $ | — | $ | 2,675 | |||||||||||||||||||||||||||||||
| Adjusted Operating Margin | 32.2 | % | 65.1 | % | 51.8 | % | 29.5 | % | 62.5 | % | 49.4 | % | |||||||||||||||||||||||||||||||||||
| Depreciation and amortization | 292 | 64 | — | 356 | 260 | 58 | — | 318 | |||||||||||||||||||||||||||||||||||||||
| Restructuring | 59 | 22 | — | 81 | 7 | 6 | — | 13 | |||||||||||||||||||||||||||||||||||||||
Charges related to asset abandonment (1) | 4 | — | — | 4 | 30 | — | — | 30 | |||||||||||||||||||||||||||||||||||||||
| Operating income | $ | 2,581 | $ | 2,314 | |||||||||||||||||||||||||||||||||||||||||||
| Operating margin | 44.3 | % | 42.7 | % | |||||||||||||||||||||||||||||||||||||||||||
Non-operating (expense) income, net | (138) | (140) | |||||||||||||||||||||||||||||||||||||||||||||
Income before provision for income taxes | $ | 2,443 | $ | 2,174 | |||||||||||||||||||||||||||||||||||||||||||
Three Months Ended September 30, | |||||||||||||||||||||||||||||||||||
| 2025 | 2024 | ||||||||||||||||||||||||||||||||||
| Amounts in millions | Transaction | Recurring | Total | Transaction | Recurring | Total | |||||||||||||||||||||||||||||
Decision Solutions | |||||||||||||||||||||||||||||||||||
Banking | $ | 25 | $ | 115 | $ | 140 | $ | 28 | $ | 112 | $ | 140 | |||||||||||||||||||||||
| 18 | % | 82 | % | 100 | % | 20 | % | 80 | % | 100 | % | ||||||||||||||||||||||||
Insurance | $ | 3 | $ | 168 | $ | 171 | $ | 6 | $ | 142 | $ | 148 | |||||||||||||||||||||||
| 2 | % | 98 | % | 100 | % | 4 | % | 96 | % | 100 | % | ||||||||||||||||||||||||
KYC | $ | 1 | $ | 112 | $ | 113 | $ | 3 | $ | 92 | $ | 95 | |||||||||||||||||||||||
| 1 | % | 99 | % | 100 | % | 3 | % | 97 | % | 100 | % | ||||||||||||||||||||||||
Total Decision Solutions | $ | 29 | $ | 395 | $ | 424 | $ | 37 | $ | 346 | $ | 383 | |||||||||||||||||||||||
| 7 | % | 93 | % | 100 | % | 10 | % | 90 | % | 100 | % | ||||||||||||||||||||||||
| Research & Insights | $ | 3 | $ | 249 | $ | 252 | $ | 3 | $ | 232 | $ | 235 | |||||||||||||||||||||||
| 1 | % | 99 | % | 100 | % | 1 | % | 99 | % | 100 | % | ||||||||||||||||||||||||
| Data & Information | $ | 2 | $ | 231 | $ | 233 | $ | 2 | $ | 211 | $ | 213 | |||||||||||||||||||||||
| 1 | % | 99 | % | 100 | % | 1 | % | 99 | % | 100 | % | ||||||||||||||||||||||||
| Total MA | $ | 34 | $ | 875 | $ | 909 | $ | 42 | $ | 789 | $ | 831 | |||||||||||||||||||||||
| 4 | % | 96 | % | 100 | % | 5 | % | 95 | % | 100 | % | ||||||||||||||||||||||||
| Corporate Finance | $ | 433 | $ | 143 | $ | 576 | $ | 382 | $ | 133 | $ | 515 | |||||||||||||||||||||||
| 75 | % | 25 | % | 100 | % | 74 | % | 26 | % | 100 | % | ||||||||||||||||||||||||
| Structured Finance | $ | 86 | $ | 60 | $ | 146 | $ | 78 | $ | 57 | $ | 135 | |||||||||||||||||||||||
| 59 | % | 41 | % | 100 | % | 58 | % | 42 | % | 100 | % | ||||||||||||||||||||||||
| Financial Institutions | $ | 123 | $ | 85 | $ | 208 | $ | 92 | $ | 78 | $ | 170 | |||||||||||||||||||||||
| 59 | % | 41 | % | 100 | % | 54 | % | 46 | % | 100 | % | ||||||||||||||||||||||||
| Public, Project and Infrastructure Finance | $ | 111 | $ | 50 | $ | 161 | $ | 109 | $ | 45 | $ | 154 | |||||||||||||||||||||||
| 69 | % | 31 | % | 100 | % | 71 | % | 29 | % | 100 | % | ||||||||||||||||||||||||
| MIS Other | $ | — | $ | 7 | $ | 7 | $ | 2 | $ | 6 | $ | 8 | |||||||||||||||||||||||
| — | % | 100 | % | 100 | % | 25 | % | 75 | % | 100 | % | ||||||||||||||||||||||||
| Total MIS | $ | 753 | $ | 345 | $ | 1,098 | $ | 663 | $ | 319 | $ | 982 | |||||||||||||||||||||||
| 69 | % | 31 | % | 100 | % | 68 | % | 32 | % | 100 | % | ||||||||||||||||||||||||
| Total Moody's Corporation | $ | 787 | $ | 1,220 | $ | 2,007 | $ | 705 | $ | 1,108 | $ | 1,813 | |||||||||||||||||||||||
| 39 | % | 61 | % | 100 | % | 39 | % | 61 | % | 100 | % | ||||||||||||||||||||||||
| Nine Months Ended September 30, | |||||||||||||||||||||||||||||||||||
| 2025 | 2024 | ||||||||||||||||||||||||||||||||||
| Amounts in millions | Transaction | Recurring | Total | Transaction | Recurring | Total | |||||||||||||||||||||||||||||
Decision Solutions | |||||||||||||||||||||||||||||||||||
Banking | $ | 76 | $ | 343 | $ | 419 | $ | 85 | $ | 320 | $ | 405 | |||||||||||||||||||||||
| 18 | % | 82 | % | 100 | % | 21 | % | 79 | % | 100 | % | ||||||||||||||||||||||||
Insurance | $ | 15 | $ | 487 | $ | 502 | $ | 20 | $ | 419 | $ | 439 | |||||||||||||||||||||||
| 3 | % | 97 | % | 100 | % | 5 | % | 95 | % | 100 | % | ||||||||||||||||||||||||
KYC | $ | 1 | $ | 320 | $ | 321 | $ | 6 | $ | 264 | $ | 270 | |||||||||||||||||||||||
| — | % | 100 | % | 100 | % | 2 | % | 98 | % | 100 | % | ||||||||||||||||||||||||
Total Decision Solutions | $ | 92 | $ | 1,150 | $ | 1,242 | $ | 111 | $ | 1,003 | $ | 1,114 | |||||||||||||||||||||||
| 7 | % | 93 | % | 100 | % | 10 | % | 90 | % | 100 | % | ||||||||||||||||||||||||
| Research & Insights | $ | 9 | $ | 728 | $ | 737 | $ | 9 | $ | 674 | $ | 683 | |||||||||||||||||||||||
| 1 | % | 99 | % | 100 | % | 1 | % | 99 | % | 100 | % | ||||||||||||||||||||||||
| Data & Information | $ | 6 | $ | 671 | $ | 677 | $ | 7 | $ | 628 | $ | 635 | |||||||||||||||||||||||
| 1 | % | 99 | % | 100 | % | 1 | % | 99 | % | 100 | % | ||||||||||||||||||||||||
| Total MA | $ | 107 | $ | 2,549 | $ | 2,656 | $ | 127 | $ | 2,305 | $ | 2,432 | |||||||||||||||||||||||
| 4 | % | 96 | % | 100 | % | 5 | % | 95 | % | 100 | % | ||||||||||||||||||||||||
| Corporate Finance | $ | 1,225 | $ | 427 | $ | 1,652 | $ | 1,169 | $ | 400 | $ | 1,569 | |||||||||||||||||||||||
| 74 | % | 26 | % | 100 | % | 75 | % | 25 | % | 100 | % | ||||||||||||||||||||||||
| Structured Finance | $ | 238 | $ | 181 | $ | 419 | $ | 213 | $ | 167 | $ | 380 | |||||||||||||||||||||||
| 57 | % | 43 | % | 100 | % | 56 | % | 44 | % | 100 | % | ||||||||||||||||||||||||
| Financial Institutions | $ | 340 | $ | 250 | $ | 590 | $ | 329 | $ | 231 | $ | 560 | |||||||||||||||||||||||
| 58 | % | 42 | % | 100 | % | 59 | % | 41 | % | 100 | % | ||||||||||||||||||||||||
| Public, Project and Infrastructure Finance | $ | 340 | $ | 146 | $ | 486 | $ | 315 | $ | 134 | $ | 449 | |||||||||||||||||||||||
| 70 | % | 30 | % | 100 | % | 70 | % | 30 | % | 100 | % | ||||||||||||||||||||||||
| MIS Other | $ | 5 | $ | 21 | $ | 26 | $ | 6 | $ | 20 | $ | 26 | |||||||||||||||||||||||
| 19 | % | 81 | % | 100 | % | 23 | % | 77 | % | 100 | % | ||||||||||||||||||||||||
| Total MIS | $ | 2,148 | $ | 1,025 | $ | 3,173 | $ | 2,032 | $ | 952 | $ | 2,984 | |||||||||||||||||||||||
| 68 | % | 32 | % | 100 | % | 68 | % | 32 | % | 100 | % | ||||||||||||||||||||||||
| Total Moody's Corporation | $ | 2,255 | $ | 3,574 | $ | 5,829 | $ | 2,159 | $ | 3,257 | $ | 5,416 | |||||||||||||||||||||||
| 39 | % | 61 | % | 100 | % | 40 | % | 60 | % | 100 | % | ||||||||||||||||||||||||
Three Months Ended September 30, | Nine Months Ended September 30, | ||||||||||||||||||||||
| Amounts in millions | 2025 | 2024 | 2025 | 2024 | |||||||||||||||||||
| Operating income | $ | 917 | $ | 738 | $ | 2,581 | $ | 2,314 | |||||||||||||||
| Depreciation and amortization | 123 | 108 | 356 | 318 | |||||||||||||||||||
| Restructuring | 21 | 6 | 81 | 13 | |||||||||||||||||||
| Charges related to asset abandonment | 1 | 15 | 4 | 30 | |||||||||||||||||||
| Adjusted Operating Income | $ | 1,062 | $ | 867 | $ | 3,022 | $ | 2,675 | |||||||||||||||
| Operating margin | 45.7 | % | 40.7 | % | 44.3 | % | 42.7 | % | |||||||||||||||
| Adjusted Operating Margin | 52.9 | % | 47.8 | % | 51.8 | % | 49.4 | % | |||||||||||||||
| Nine Months Ended September 30, | |||||||||||
| Amounts in millions | 2025 | 2024 | |||||||||
| Net cash provided by operating activities | $ | 2,043 | $ | 2,164 | |||||||
| Capital additions | (245) | (243) | |||||||||
| Free Cash Flow | $ | 1,798 | $ | 1,921 | |||||||
| Net cash provided by (used in) investing activities | $ | 44 | $ | (875) | |||||||
| Net cash used in financing activities | $ | (2,454) | $ | (812) | |||||||
Three Months Ended September 30, | Nine Months Ended September 30, | |||||||||||||||||||||||||||||||||||||||||||||||||
| Amounts in millions | 2025 | 2024 | Change | Growth | 2025 | 2024 | Change | Growth | ||||||||||||||||||||||||||||||||||||||||||
| MCO revenue | $ | 2,007 | $ | 1,813 | $ | 194 | 11% | $ | 5,829 | $ | 5,416 | $ | 413 | 8% | ||||||||||||||||||||||||||||||||||||
| FX impact | (24) | — | (24) | (37) | — | (37) | ||||||||||||||||||||||||||||||||||||||||||||
| Inorganic revenue from acquisitions | (13) | — | (13) | (45) | — | (45) | ||||||||||||||||||||||||||||||||||||||||||||
Organic constant currency MCO revenue | $ | 1,970 | $ | 1,813 | $ | 157 | 9% | $ | 5,747 | $ | 5,416 | $ | 331 | 6% | ||||||||||||||||||||||||||||||||||||
| MA revenue | $ | 909 | $ | 831 | $ | 78 | 9% | $ | 2,656 | $ | 2,432 | $ | 224 | 9% | ||||||||||||||||||||||||||||||||||||
| FX impact | (14) | — | (14) | (21) | — | (21) | ||||||||||||||||||||||||||||||||||||||||||||
| Inorganic revenue from acquisitions | (13) | — | (13) | (38) | — | (38) | ||||||||||||||||||||||||||||||||||||||||||||
Organic constant currency MA revenue | $ | 882 | $ | 831 | $ | 51 | 6% | $ | 2,597 | $ | 2,432 | $ | 165 | 7% | ||||||||||||||||||||||||||||||||||||
| Decision Solutions revenue | $ | 424 | $ | 383 | $ | 41 | 11% | $ | 1,242 | $ | 1,114 | $ | 128 | 11% | ||||||||||||||||||||||||||||||||||||
| FX impact | (5) | — | (5) | (7) | — | (7) | ||||||||||||||||||||||||||||||||||||||||||||
| Inorganic revenue from acquisitions | (13) | — | (13) | (38) | — | (38) | ||||||||||||||||||||||||||||||||||||||||||||
Organic constant currency Decision Solutions revenue | $ | 406 | $ | 383 | $ | 23 | 6% | $ | 1,197 | $ | 1,114 | $ | 83 | 7% | ||||||||||||||||||||||||||||||||||||
| Research and Insights revenue | $ | 252 | $ | 235 | $ | 17 | 7% | $ | 737 | $ | 683 | $ | 54 | 8% | ||||||||||||||||||||||||||||||||||||
| FX impact | (3) | — | (3) | (6) | — | (6) | ||||||||||||||||||||||||||||||||||||||||||||
| Inorganic revenue from acquisitions | — | — | — | |||||||||||||||||||||||||||||||||||||||||||||||
Constant currency Research and Insights revenue | $ | 249 | $ | 235 | $ | 14 | 6% | $ | 731 | $ | 683 | $ | 48 | 7% | ||||||||||||||||||||||||||||||||||||
| Data and Information revenue | $ | 233 | $ | 213 | $ | 20 | 9% | $ | 677 | $ | 635 | $ | 42 | 7% | ||||||||||||||||||||||||||||||||||||
| FX impact | (6) | — | (6) | (8) | — | (8) | ||||||||||||||||||||||||||||||||||||||||||||
Constant currency Data and Information revenue | $ | 227 | $ | 213 | $ | 14 | 7% | $ | 669 | $ | 635 | $ | 34 | 5% | ||||||||||||||||||||||||||||||||||||
| MA recurring revenue | $ | 875 | $ | 789 | $ | 86 | 11% | $ | 2,549 | $ | 2,305 | $ | 244 | 11% | ||||||||||||||||||||||||||||||||||||
| FX impact | (14) | — | (14) | (22) | — | (22) | ||||||||||||||||||||||||||||||||||||||||||||
| Inorganic recurring revenue from acquisitions | (12) | — | (12) | (36) | — | (36) | ||||||||||||||||||||||||||||||||||||||||||||
Organic constant currency MA recurring revenue | $ | 849 | $ | 789 | $ | 60 | 8% | $ | 2,491 | $ | 2,305 | $ | 186 | 8% | ||||||||||||||||||||||||||||||||||||
| Amounts in millions | September 30, 2025 | September 30, 2024 | Change | Growth | |||||||||||||||||||
| MA ARR | |||||||||||||||||||||||
| Decision Solutions | |||||||||||||||||||||||
| Banking | $ | 466 | $ | 436 | $ | 30 | 7% | ||||||||||||||||
| Insurance | 628 | 583 | 45 | 8% | |||||||||||||||||||
| KYC | 407 | 351 | 56 | 16% | |||||||||||||||||||
Total Decision Solutions | $ | 1,501 | $ | 1,370 | $ | 131 | 10% | ||||||||||||||||
| Research and Insights | 970 | 899 | 71 | 8% | |||||||||||||||||||
| Data and Information | 890 | 832 | 58 | 7% | |||||||||||||||||||
| Total MA ARR | $ | 3,361 | $ | 3,101 | $ | 260 | 8% | ||||||||||||||||
Three Months Ended September 30, | Nine Months Ended September 30, | ||||||||||||||||||||||||||||||||||
| Amounts in millions | 2025 | 2024 | 2025 | 2024 | |||||||||||||||||||||||||||||||
| Net Income attributable to Moody's common shareholders | $ | 646 | $ | 534 | $ | 1,849 | $ | 1,663 | |||||||||||||||||||||||||||
| Pre-tax Acquisition-Related Intangible Amortization Expenses | $ | 55 | $ | 51 | $ | 163 | $ | 148 | |||||||||||||||||||||||||||
| Tax on Acquisition-Related Intangible Amortization Expenses | (14) | (12) | (40) | (36) | |||||||||||||||||||||||||||||||
| Net Acquisition-Related Intangible Amortization Expenses | 41 | 39 | 123 | 112 | |||||||||||||||||||||||||||||||
| Pre-tax restructuring | $ | 21 | $ | 6 | $ | 81 | $ | 13 | |||||||||||||||||||||||||||
| Tax on restructuring | (5) | (1) | (20) | (3) | |||||||||||||||||||||||||||||||
| Net restructuring | 16 | 5 | 61 | 10 | |||||||||||||||||||||||||||||||
| Pre-tax charges related to asset abandonment | $ | 1 | $ | 15 | $ | 4 | $ | 30 | |||||||||||||||||||||||||||
| Tax on charges related to asset abandonment | — | (3) | (1) | (7) | |||||||||||||||||||||||||||||||
| Net charges related to asset abandonment | 1 | 12 | 3 | 23 | |||||||||||||||||||||||||||||||
| Pre-tax gain on previously held equity method investments | $ | — | $ | (7) | $ | — | $ | (7) | |||||||||||||||||||||||||||
| Tax on gain on previously held equity method investments | — | 2 | — | 2 | |||||||||||||||||||||||||||||||
| Net gain on previously held equity method investments | — | (5) | — | (5) | |||||||||||||||||||||||||||||||
| Adjusted Net Income | $ | 704 | $ | 585 | $ | 2,036 | $ | 1,803 | |||||||||||||||||||||||||||
Three Months Ended September 30, | Nine Months Ended September 30, | ||||||||||||||||||||||||||||||||||
| 2025 | 2024 | 2025 | 2024 | ||||||||||||||||||||||||||||||||
| Diluted earnings per share attributable to Moody's common shareholders | $ | 3.60 | $ | 2.93 | $ | 10.26 | $ | 9.09 | |||||||||||||||||||||||||||
| Pre-tax Acquisition-Related Intangible Amortization Expenses | $ | 0.31 | $ | 0.28 | $ | 0.90 | $ | 0.81 | |||||||||||||||||||||||||||
| Tax on Acquisition-Related Intangible Amortization Expenses | (0.09) | (0.07) | (0.22) | (0.20) | |||||||||||||||||||||||||||||||
| Net Acquisition-Related Intangible Amortization Expenses | 0.22 | 0.21 | 0.68 | 0.61 | |||||||||||||||||||||||||||||||
| Pre-tax restructuring | $ | 0.12 | $ | 0.03 | $ | 0.45 | $ | 0.07 | |||||||||||||||||||||||||||
| Tax on restructuring | (0.03) | — | (0.11) | (0.02) | |||||||||||||||||||||||||||||||
| Net restructuring | 0.09 | 0.03 | 0.34 | 0.05 | |||||||||||||||||||||||||||||||
| Pre-tax charges related to asset abandonment | $ | 0.01 | $ | 0.08 | $ | 0.02 | $ | 0.16 | |||||||||||||||||||||||||||
| Tax on charges related to asset abandonment | — | (0.01) | — | (0.03) | |||||||||||||||||||||||||||||||
| Net charges related to asset abandonment | 0.01 | 0.07 | 0.02 | 0.13 | |||||||||||||||||||||||||||||||
| Pre-tax gain on previously held equity method investments | $ | — | $ | (0.04) | $ | — | $ | (0.04) | |||||||||||||||||||||||||||
| Tax on gain on previously held equity method investments | — | 0.01 | — | 0.01 | |||||||||||||||||||||||||||||||
| Net gain on previously held equity method investments | — | (0.03) | — | (0.03) | |||||||||||||||||||||||||||||||
| Adjusted Diluted EPS | $ | 3.92 | $ | 3.21 | $ | 11.30 | $ | 9.85 | |||||||||||||||||||||||||||
| Note: The tax impacts in the tables above were calculated using tax rates in effect in the jurisdiction for which the item relates. | ||
Full Year 2025 Moody's Corporation Guidance as of October 22, 2025 | ||||||||
Moody's Corporation (MCO) | Last Publicly Disclosed Guidance | Current Guidance | ||||||
| Revenue | Increase in the mid-single-digit percent range | Increase in the high-single-digit percent range | ||||||
Operating Expenses | Increase in the low-to-mid-single-digit percent range | NC | ||||||
Operating Margin | 42% to 43% | 43% to 44% | ||||||
Adjusted Operating Margin (1) | 49% to 50% | Approximately 51% | ||||||
Interest Expense, Net | $220 million to $240 million | $215 million to $225 million | ||||||
Effective Tax Rate | 23% to 25% | 22% to 23%(2) | ||||||
Diluted EPS | $12.25 to $12.75 | $13.15 to $13.40 | ||||||
Adjusted Diluted EPS (1) | $13.50 to $14.00 | $14.50 to $14.75 | ||||||
Operating Cash Flow | $2.65 to $2.85 billion | Approximately $2.85 billion | ||||||
Free Cash Flow (1) | $2.30 to $2.50 billion | Approximately $2.5 billion | ||||||
Share Repurchases | At least $1.3 billion (subject to available cash, market conditions, M&A opportunities and other ongoing capital allocation decisions) | At least $1.5 billion (subject to available cash, market conditions, M&A opportunities and other ongoing capital allocation decisions) | ||||||
| Moody's Analytics (MA) | Last Publicly Disclosed Guidance | Current Guidance | ||||||
MA Revenue | Increase in the high-single-digit percent range | NC | ||||||
ARR (3) | Increase in the high-single-digit percent range | NC | ||||||
| MA Adjusted Operating Margin | 32% to 33% | Approximately 33% | ||||||
| Moody's Investors Service (MIS) | Last Publicly Disclosed Guidance | Current Guidance | ||||||
MIS Revenue | Increase in the low-single-digit to mid-single-digit percent range | Increase in the high-single-digit percent range | ||||||
| MIS Adjusted Operating Margin | 61% to 62% | 63% to 64% | ||||||
NC - There is no difference between the Company’s current guidance and the last publicly disclosed guidance for this item. Note: All current guidance as of October 22, 2025. (1) These metrics are adjusted measures. See below for reconciliation of these measures to their comparable U.S. GAAP measure. (2) Incorporates an approximate 200 bps benefit in the fourth quarter of 2025 pursuant to the lapse of a statute of limitations related to tax exposures assumed in a prior-year M&A transaction, for which the sellers indemnified Moody’s. This benefit will be fully offset by the release of an indemnification asset, resulting in no impact to net income or EPS. (3) Refer to Table 10 within this earnings release for the definition of and further information on the ARR metric. | ||||||||
Projected for the Year Ended December 31, 2025 | |||||
| Operating margin guidance | 43% to 44% | ||||
| Depreciation and amortization | Approximately 6.2% | ||||
| Restructuring | Approximately 1.3% | ||||
Charges Related to Asset Abandonment | Negligible | ||||
| Adjusted Operating Margin guidance | Approximately 51% | ||||
| Projected for the Year Ended December 31, 2025 | |||||
| Operating cash flow guidance | Approximately $2.85 billion | ||||
| Less: Capital expenditures | Approximately $350 million | ||||
| Free Cash Flow guidance | Approximately $2.5 billion | ||||
| Projected for the Year Ended December 31, 2025 | |||||
| Diluted EPS guidance | $13.15 to $13.40 | ||||
| Acquisition-Related Intangible Amortization | Approximately $0.90 | ||||
| Restructuring | Approximately $0.45 | ||||
Charges Related to Asset Abandonment | Negligible | ||||
| Adjusted Diluted EPS guidance | $14.50 to $14.75 | ||||