Exhibit 99.2 Third Quarter 2025 Financial Review and Analysis (preliminary, unaudited) October 22, 2025 Supplemental Presentation Materials Unless otherwise indicated, comparisons are to the same period in the prior year. October 22, 2025 Preliminary & unaudited, Q3 2025 financial review and analysis 1
Safe Harbor Statement Certain statements contained in this document are forward-looking statements intended to qualify for the safe harbor from liability established by the Private Securities Litigation Reform Act of 1995. These forward-looking statements, and financial or other business targets, are subject to certain risks and uncertainties. We believe that the most significant risk factors that could affect our financial performance in the near term include: (i) the impact on underlying demand for our products from global economic conditions, tariffs, geopolitical uncertainty, and changes in environmental standards, regulations and preferences; (ii) competitors’ actions, including pricing, expansion in key markets, and product offerings; (iii) the cost and availability of raw materials; (iv) the degree to which higher costs can be offset with productivity measures and/or passed on to customers through price increases, without a significant loss of volume; (v) foreign currency fluctuations; and (vi) the execution and integration of acquisitions. Actual results and trends may differ materially from historical or anticipated results depending on a variety of factors, including but not limited to, risks and uncertainties related to the following: ● International Operations – worldwide economic, social, geopolitical and market conditions; changes in geopolitical conditions, including those related to trade relations and tariffs, China, the Russia-Ukraine war, the Israel-Hamas war and related hostilities in the Middle East; fluctuations in foreign currency exchange rates; and other risks associated with international operations, including in emerging markets ● Our Business – fluctuations in demand affecting sales to customers; fluctuations in the cost and availability of raw materials and energy; changes in our markets due to competitive conditions, technological developments, laws and regulations, and customer preferences; environmental regulations and sustainability trends; the impact of competitive products and pricing; the execution and integration of acquisitions; selling prices; customer and supplier concentrations or consolidations; the financial condition of distributors; outsourced manufacturers; product and service quality claims; restructuring and other cost reduction actions; our ability to generate sustained productivity improvement and our ability to achieve and sustain targeted cost reductions; the timely development and market acceptance of new products, including sustainable or sustainably-sourced products; our investment in development activities and new production facilities; the collection of receivables from customers; and our sustainability and governance practices ● Information Technology – disruptions in information technology systems; cybersecurity events or other security breaches; and successful installation of new or upgraded information technology systems ● Income Taxes – fluctuations in tax rates; changes in tax laws and regulations, and uncertainties associated with interpretations of such laws and regulations; outcome of tax audits; and the realization of deferred tax assets ● Human Capital – recruitment and retention of employees and collective labor arrangements ● Our Indebtedness – our ability to obtain adequate financing arrangements and maintain access to capital; credit rating risks; fluctuations in interest rates; and compliance with our debt covenants ● Ownership of Our Stock – potential significant variability of our stock price and amounts of future dividends and share repurchases ● Legal and Regulatory Matters – protection and infringement of our intellectual property; the impact of legal and regulatory proceedings, including with respect to compliance and anti-corruption, environmental, health and safety, and trade compliance ● Other Financial Matters – fluctuations in pension costs and goodwill impairment For a more detailed discussion of these factors, see “Risk Factors” and “Management’s Discussion and Analysis of Financial Condition and Results of Operations” in our 2024 Form 10-K, filed with the Securities and Exchange Commission on February 26, 2025, and subsequent quarterly reports on Form 10-Q. The forward-looking statements included in this document are made only as of the date of this document, and we undertake no obligation to update these statements to reflect subsequent events or circumstances, other than as may be required by law. October 22, 2025 Preliminary & unaudited, Q3 2025 financial review and analysis 2

Use of Non-GAAP Financial Measures This presentation contains certain non-GAAP financial measures as defined by SEC rules. We report our financial results in conformity with accounting principles generally accepted in the United States of America, or GAAP, and also communicate with investors using certain non-GAAP financial measures. These non-GAAP financial measures are not in accordance with, nor are they a substitute for or superior to, the comparable GAAP financial measures. These non-GAAP financial measures are intended to supplement the presentation of our financial results prepared in accordance with GAAP. We use these non-GAAP financial measures internally to evaluate trends in our underlying performance, as well as to facilitate comparisons with the results of competitors for quarters and year-to-date periods, as applicable. Based on feedback from investors and financial analysts, we believe that the supplemental non-GAAP financial measures we provide are also useful to their assessments of our performance and operating trends, as well as liquidity. In accordance with Regulations G and S-K, reconciliations of non-GAAP financial measures from the most directly comparable GAAP financial measures, including limitations associated with these non-GAAP financial measures, are provided in the appendix to this document and/or the financial schedules accompanying the earnings news release for the quarter (see Attachments A-4 through A-8 to news release dated October 22, 2025). Our non-GAAP financial measures exclude the impact of certain events, activities or strategic decisions. The accounting effects of these events, activities or decisions, which are included in the GAAP financial measures, may make it more difficult to assess our underlying performance in a single period. By excluding the accounting effects, positive or negative, of certain items (e.g., restructuring charges, outcomes of certain legal matters and settlements, certain effects of strategic transactions and related costs, losses from debt extinguishments, gains or losses from curtailment or settlement of pension obligations, gains or losses on sales of certain assets, gains or losses on venture and other investments, currency adjustments due to highly inflationary economies, and other items), we believe that we are providing meaningful supplemental information that facilitates an understanding of our core operating results and liquidity measures. While some of the items we exclude from GAAP financial measures recur, they tend to be disparate in amount, frequency or timing. We use the non-GAAP financial measures described below in this presentation. • Sales change ex. currency refers to the increase or decrease in net sales, excluding the estimated impact of foreign currency translation, and, where applicable, the currency adjustments for transitional reporting of highly inflationary economies and the reclassification of sales between segments. Additionally, where applicable, sales change ex. currency is also adjusted for extra days in our fiscal year and the calendar shift resulting from extra days in the prior fiscal year. The estimated impact of foreign currency translation is calculated on a constant currency basis, with prior-period results translated at current period average exchange rates to exclude the effect of foreign currency fluctuations. Our 2025 fiscal year that began on December 29, 2024 will end on December 31, 2025; fiscal years 2026 and beyond will be coincident with the calendar year beginning on January 1 and ending on December 31. • Organic sales change refers to sales change ex. currency, excluding the estimated impact of acquisitions and product line divestitures. We believe that sales change ex. currency and organic sales change assist investors in evaluating the sales change from the ongoing activities of our businesses and enhance their ability to evaluate our results from period to period. We believe that the following measures assist investors in understanding our core operating trends and comparing our results with those of our competitors. • Adjusted operating income refers to net income adjusted for taxes; other expense (income), net; interest expense; other non-operating expense (income), net; and other items. • Adjusted EBITDA refers to adjusted operating income before depreciation and amortization. • Adjusted operating margin refers to adjusted operating income as a percentage of net sales. • Adjusted EBITDA margin refers to adjusted EBITDA as a percentage of net sales. • Adjusted tax rate refers to the projected full-year GAAP tax rate, adjusted to exclude certain unusual or infrequent events that are expected to significantly impact that rate, such as effects of certain discrete tax planning actions, impacts related to enactments of comprehensive tax law changes, and other items. • Adjusted net income refers to income before taxes, tax-effected at the adjusted tax rate, and adjusted for tax-effected restructuring charges and other items. • Adjusted net income per common share, assuming dilution (adjusted EPS) refers to adjusted net income divided by the weighted average number of common shares outstanding, assuming dilution. • Net debt to adjusted EBITDA ratio refers to total debt (including finance leases) less cash and cash equivalents, divided by adjusted EBITDA for the last twelve months. We believe that the net debt to adjusted EBITDA ratio assists investors in assessing our leverage position. • Adjusted free cash flow (adjusted FCF) refers to cash flow provided by operating activities, less payments for property, plant and equipment, less payments for software and other deferred charges, plus proceeds from company-owned life insurance policies, plus proceeds from sales of property, plant and equipment, plus (minus) net proceeds from insurance and sales (purchases) of investments, less net cash used for Argentine Blue Chip Swap securities. Where applicable, adjusted free cash flow is also adjusted for certain acquisition-related transaction costs. We believe that adjusted free cash flow assists investors by showing the amount of cash we have available for debt reductions, dividends, share repurchases and acquisitions. • Adjusted free cash flow conversion refers to adjusted free cash flow divided by net income. This document has been furnished (not filed) on Form 8-K with the SEC and may be found on our website at www.investors.averydennison.com. October 22, 2025 Preliminary & unaudited, Q3 2025 financial review and analysis 3
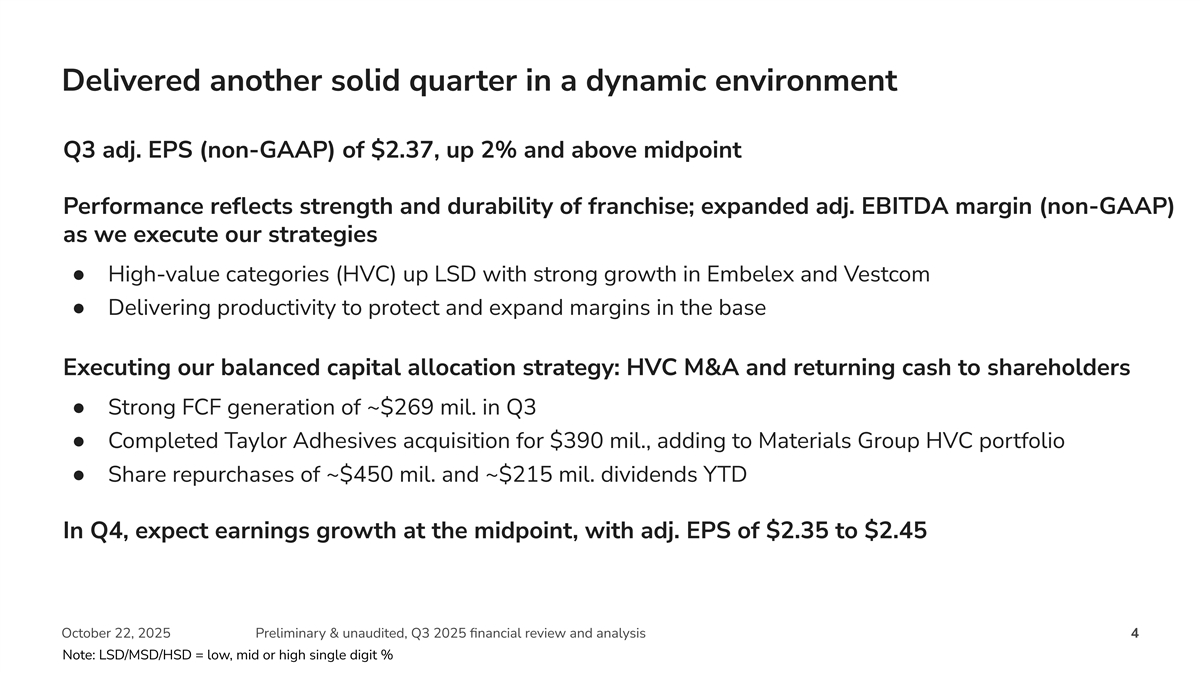
Delivered another solid quarter in a dynamic environment Q3 adj. EPS (non-GAAP) of $2.37, up 2% and above midpoint Performance reflects strength and durability of franchise; expanded adj. EBITDA margin (non-GAAP) as we execute our strategies ● High-value categories (HVC) up LSD with strong growth in Embelex and Vestcom ● Delivering productivity to protect and expand margins in the base Executing our balanced capital allocation strategy: HVC M&A and returning cash to shareholders ● Strong FCF generation of ~$269 mil. in Q3 ● Completed Taylor Adhesives acquisition for $390 mil., adding to Materials Group HVC portfolio ● Share repurchases of ~$450 mil. and ~$215 mil. dividends YTD In Q4, expect earnings growth at the midpoint, with adj. EPS of $2.35 to $2.45 October 22, 2025 Preliminary & unaudited, Q3 2025 financial review and analysis 4 Note: LSD/MSD/HSD = low, mid or high single digit %
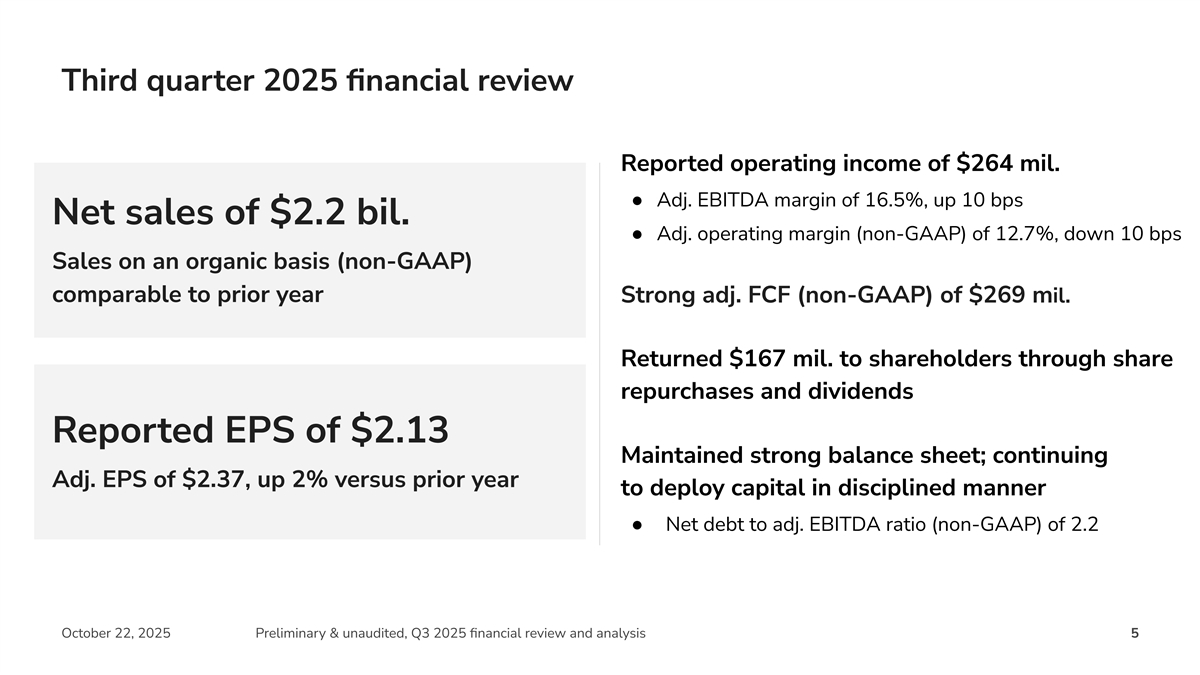
Third quarter 2025 financial review Reported operating income of $264 mil. ● Adj. EBITDA margin of 16.5%, up 10 bps Net sales of $2.2 bil. ● Adj. operating margin (non-GAAP) of 12.7%, down 10 bps Sales on an organic basis (non-GAAP) comparable to prior year Strong adj. FCF (non-GAAP) of $269 mil. Returned $167 mil. to shareholders through share repurchases and dividends Reported EPS of $2.13 Maintained strong balance sheet; continuing Adj. EPS of $2.37, up 2% versus prior year to deploy capital in disciplined manner ● Net debt to adj. EBITDA ratio (non-GAAP) of 2.2 October 22, 2025 Preliminary & unaudited, Q3 2025 financial review and analysis 5
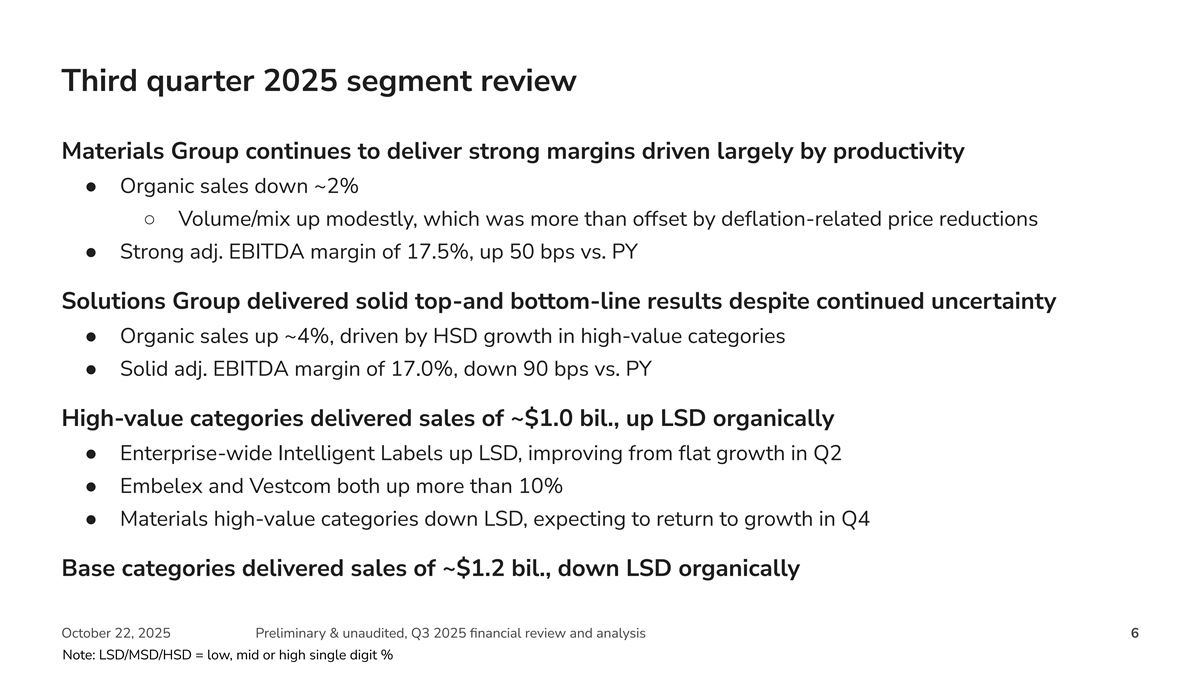
Third quarter 2025 segment review Materials Group continues to deliver strong margins driven largely by productivity ● Organic sales down ~2% ○ Volume/mix up modestly, which was more than offset by deflation-related price reductions ● Strong adj. EBITDA margin of 17.5%, up 50 bps vs. PY Solutions Group delivered solid top-and bottom-line results despite continued uncertainty ● Organic sales up ~4%, driven by HSD growth in high-value categories ● Solid adj. EBITDA margin of 17.0%, down 90 bps vs. PY High-value categories delivered sales of ~$1.0 bil., up LSD organically ● Enterprise-wide Intelligent Labels up LSD, improving from flat growth in Q2 ● Embelex and Vestcom both up more than 10% ● Materials high-value categories down LSD, expecting to return to growth in Q4 Base categories delivered sales of ~$1.2 bil., down LSD organically October 22, 2025 Preliminary & unaudited, Q3 2025 financial review and analysis 6 Note: LSD/MSD/HSD = low, mid or high single digit %
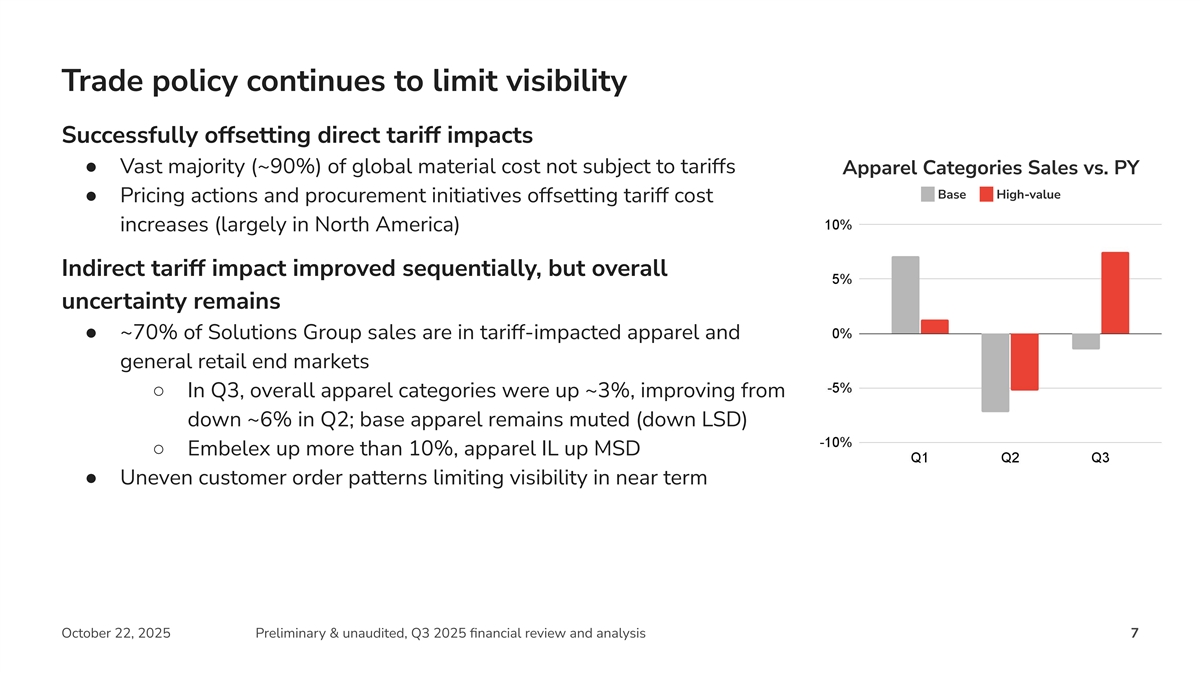
Trade policy continues to limit visibility Successfully offsetting direct tariff impacts ● Vast majority (~90%) of global material cost not subject to tariffs Apparel Categories Sales vs. PY Base High-value ● Pricing actions and procurement initiatives offsetting tariff cost increases (largely in North America) Indirect tariff impact improved sequentially, but overall uncertainty remains ● ~70% of Solutions Group sales are in tariff-impacted apparel and general retail end markets ○ In Q3, overall apparel categories were up ~3%, improving from down ~6% in Q2; base apparel remains muted (down LSD) ○ Embelex up more than 10%, apparel IL up MSD ● Uneven customer order patterns limiting visibility in near term October 22, 2025 Preliminary & unaudited, Q3 2025 financial review and analysis 7
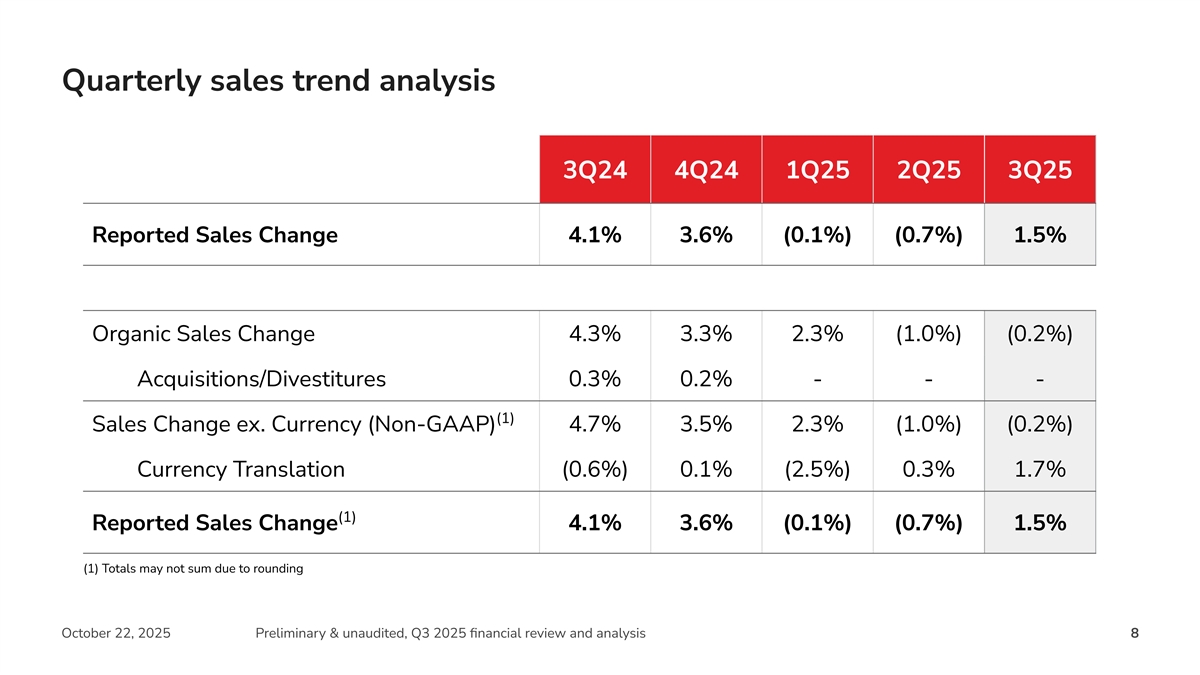
Quarterly sales trend analysis 3Q24 4Q24 1Q25 2Q25 3Q25 Reported Sales Change 4.1% 3.6% (0.1%) (0.7%) 1.5% Organic Sales Change 4.3% 3.3% 2.3% (1.0%) (0.2%) Acquisitions/Divestitures 0.3% 0.2% - - - (1) Sales Change ex. Currency (Non-GAAP) 4.7% 3.5% 2.3% (1.0%) (0.2%) Currency Translation (0.6%) 0.1% (2.5%) 0.3% 1.7% (1) Reported Sales Change 4.1% 3.6% (0.1%) (0.7%) 1.5% (1) Totals may not sum due to rounding October 22, 2025 Preliminary & unaudited, Q3 2025 financial review and analysis 8
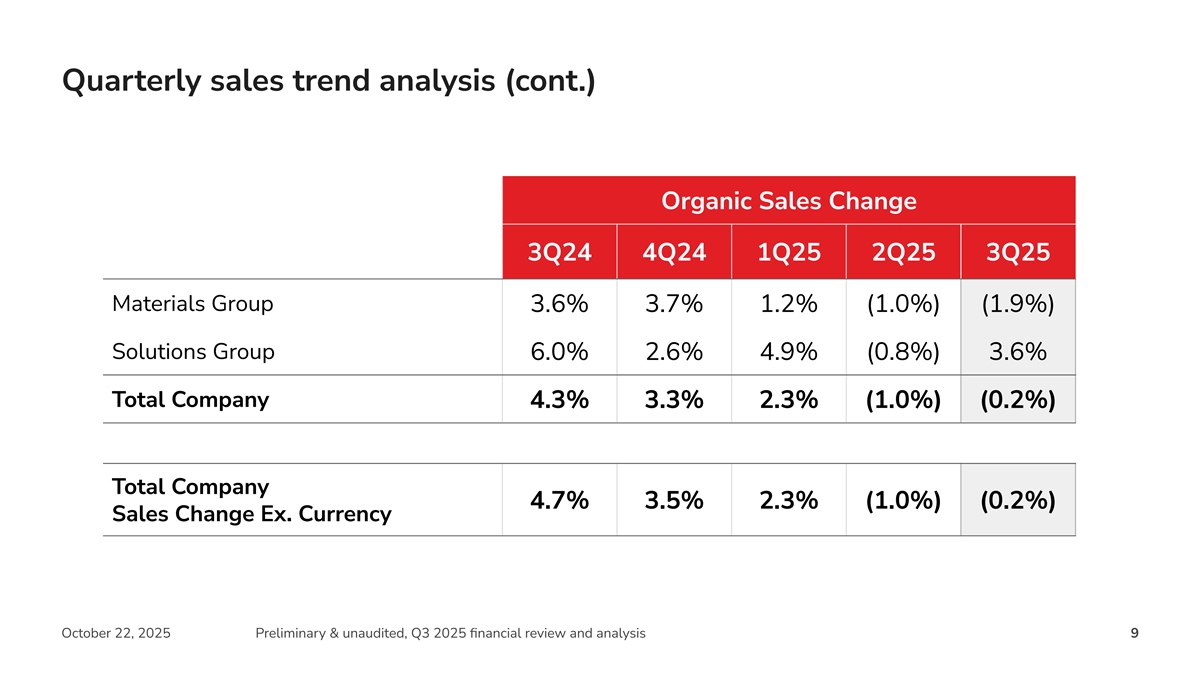
Quarterly sales trend analysis (cont.) Organic Sales Change 3Q24 4Q24 1Q25 2Q25 3Q25 Materials Group 3.6% 3.7% 1.2% (1.0%) (1.9%) Solutions Group 6.0% 2.6% 4.9% (0.8%) 3.6% Total Company 4.3% 3.3% 2.3% (1.0%) (0.2%) Total Company 4.7% 3.5% 2.3% (1.0%) (0.2%) Sales Change Ex. Currency October 22, 2025 Preliminary & unaudited, Q3 2025 financial review and analysis 9
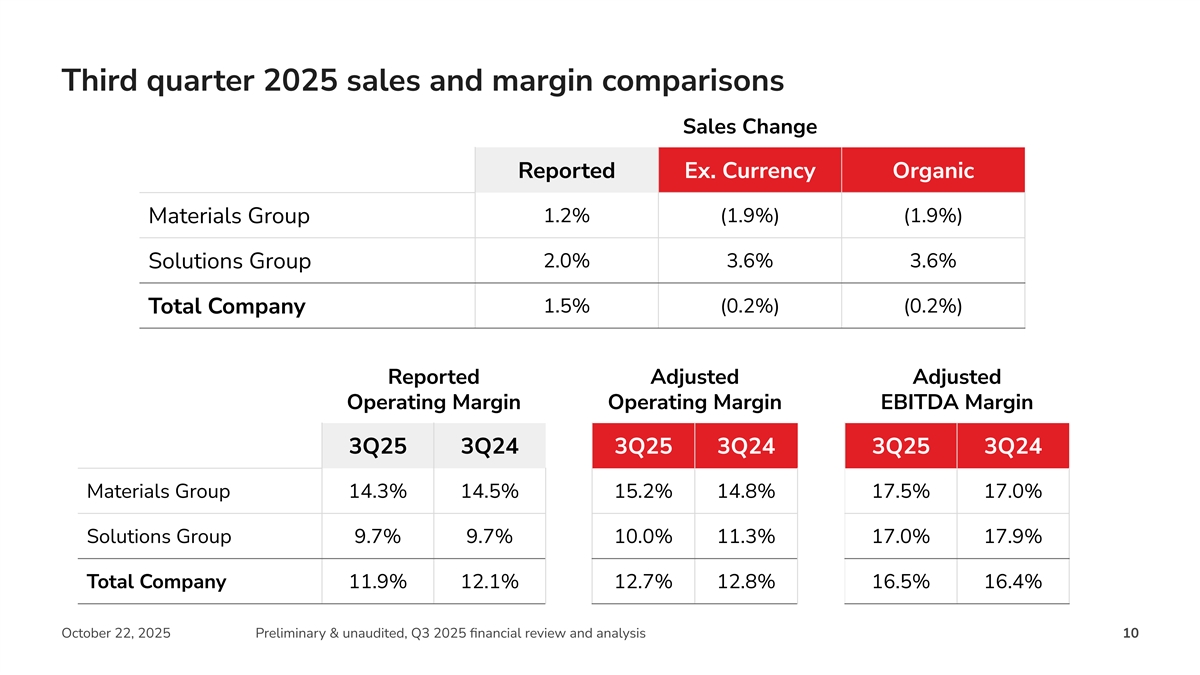
Third quarter 2025 sales and margin comparisons Sales Change Reported Ex. Currency Organic 1.2% (1.9%) (1.9%) Materials Group 2.0% 3.6% 3.6% Solutions Group 1.5% (0.2%) (0.2%) Total Company Reported Adjusted Adjusted Operating Margin Operating Margin EBITDA Margin 3Q25 3Q24 3Q25 3Q24 3Q25 3Q24 Materials Group 14.3% 14.5% 15.2% 14.8% 17.5% 17.0% Solutions Group 9.7% 9.7% 10.0% 11.3% 17.0% 17.9% Total Company 11.9% 12.1% 12.7% 12.8% 16.5% 16.4% October 22, 2025 Preliminary & unaudited, Q3 2025 financial review and analysis 10
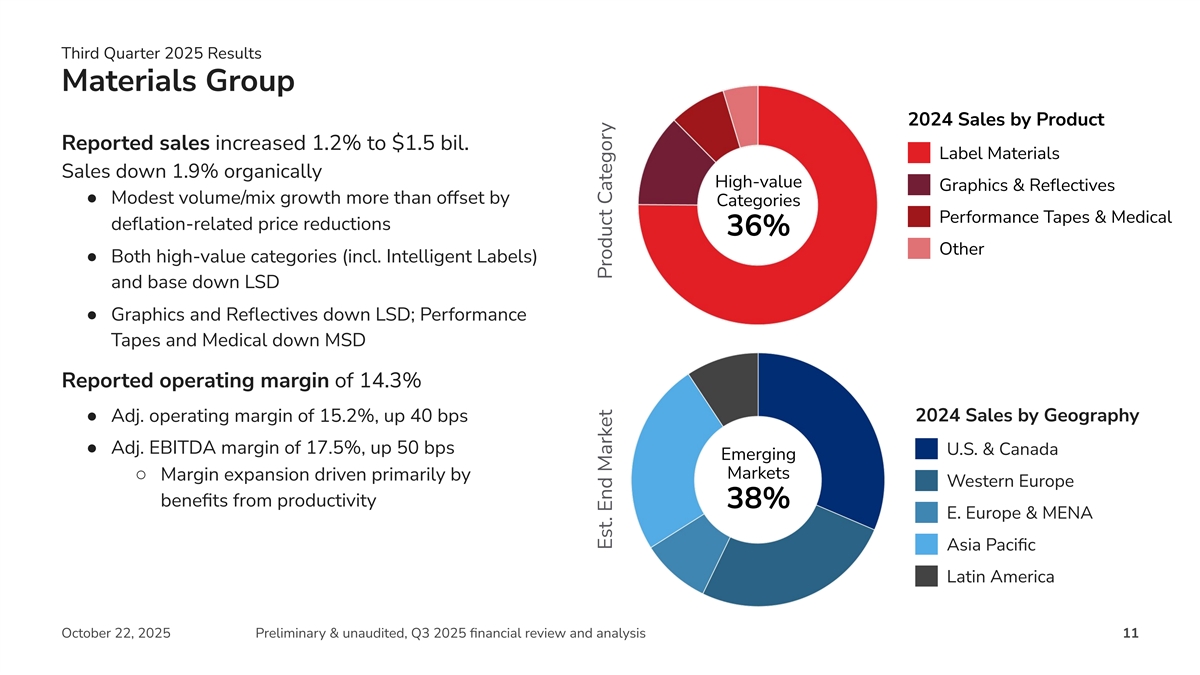
Third Quarter 2025 Results Materials Group 2024 Sales by Product Reported sales increased 1.2% to $1.5 bil. Label Materials Sales down 1.9% organically High-value Graphics & Reflectives ● Modest volume/mix growth more than offset by Categories Performance Tapes & Medical deflation-related price reductions 36% Other ● Both high-value categories (incl. Intelligent Labels) and base down LSD ● Graphics and Reflectives down LSD; Performance Tapes and Medical down MSD Reported operating margin of 14.3% 2024 Sales by Geography ● Adj. operating margin of 15.2%, up 40 bps ● Adj. EBITDA margin of 17.5%, up 50 bps U.S. & Canada Emerging Markets ○ Margin expansion driven primarily by Western Europe benefits from productivity 38% E. Europe & MENA Asia Pacific Latin America October 22, 2025 Preliminary & unaudited, Q3 2025 financial review and analysis 11 Est. End Market Product Category
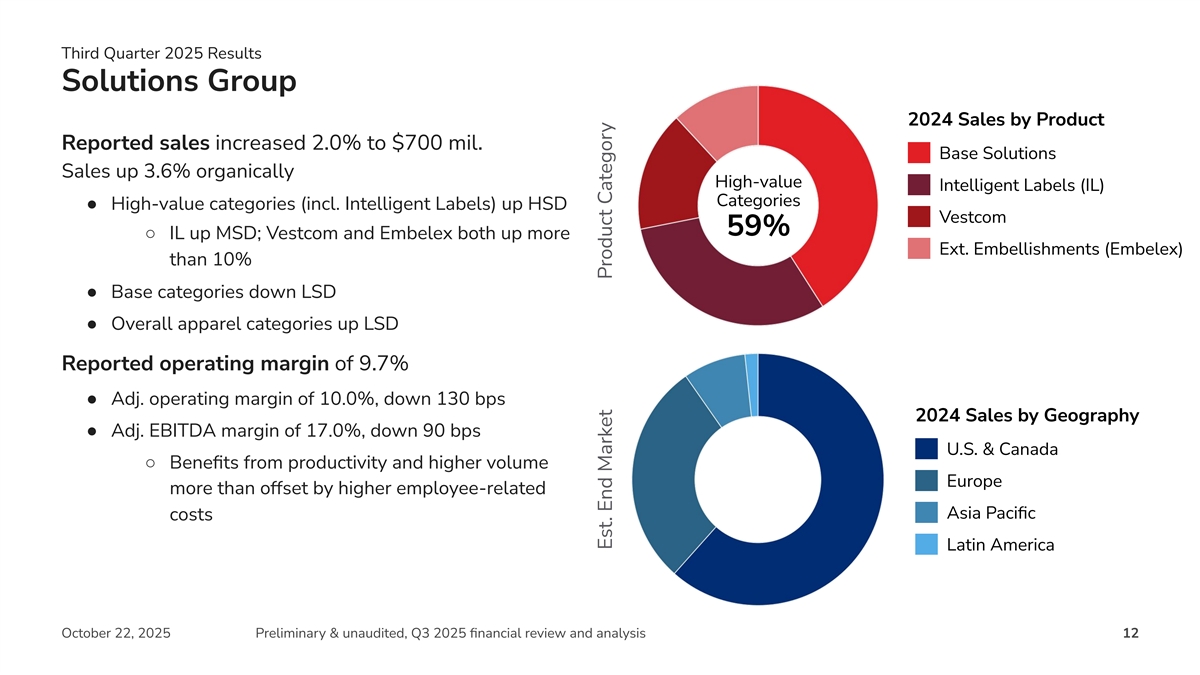
Third Quarter 2025 Results Solutions Group 2024 Sales by Product Reported sales increased 2.0% to $700 mil. Base Solutions Sales up 3.6% organically High-value Intelligent Labels (IL) Categories ● High-value categories (incl. Intelligent Labels) up HSD Vestcom 59% ○ IL up MSD; Vestcom and Embelex both up more Ext. Embellishments (Embelex) than 10% ● Base categories down LSD ● Overall apparel categories up LSD Reported operating margin of 9.7% ● Adj. operating margin of 10.0%, down 130 bps 2024 Sales by Geography ● Adj. EBITDA margin of 17.0%, down 90 bps U.S. & Canada ○ Benefits from productivity and higher volume Europe more than offset by higher employee-related Asia Pacific costs Latin America October 22, 2025 Preliminary & unaudited, Q3 2025 financial review and analysis 12 Est. End Market Product Category
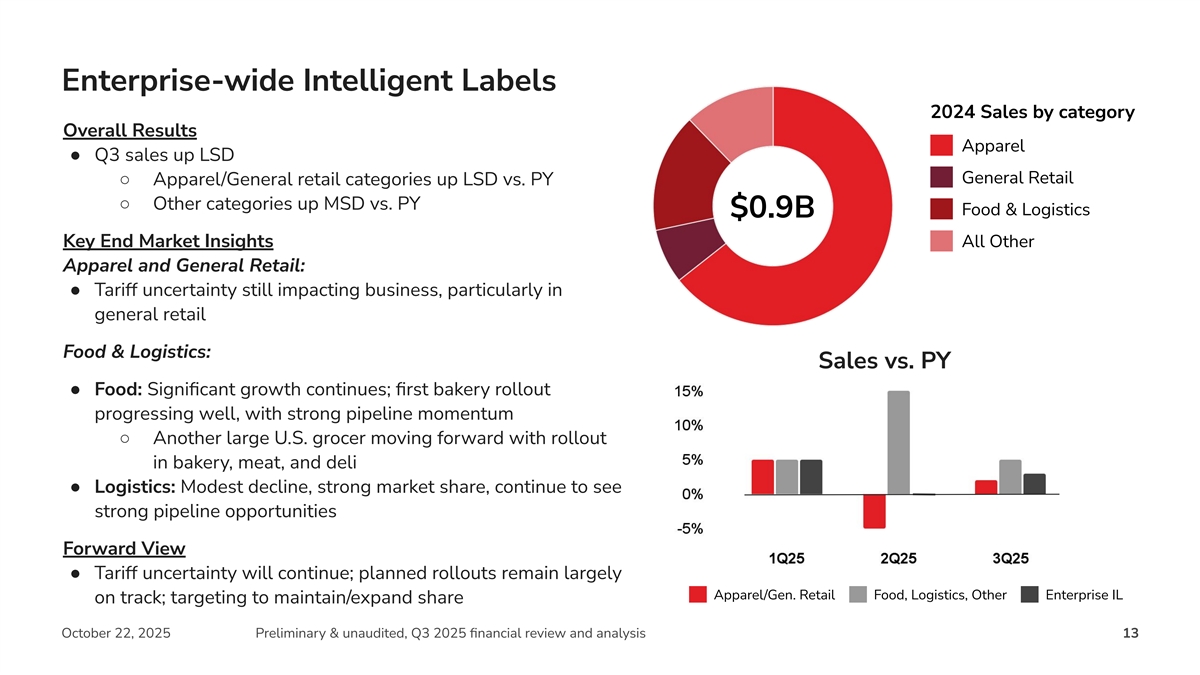
Enterprise-wide Intelligent Labels 2024 Sales by category Overall Results Apparel ● Q3 sales up LSD General Retail ○ Apparel/General retail categories up LSD vs. PY ○ Other categories up MSD vs. PY Food & Logistics $0.9B Key End Market Insights All Other Apparel and General Retail: ● Tariff uncertainty still impacting business, particularly in general retail Food & Logistics: Sales vs. PY ● Food: Significant growth continues; first bakery rollout progressing well, with strong pipeline momentum ○ Another large U.S. grocer moving forward with rollout in bakery, meat, and deli ● Logistics: Modest decline, strong market share, continue to see strong pipeline opportunities Forward View ● Tariff uncertainty will continue; planned rollouts remain largely Apparel/Gen. Retail Food, Logistics, Other Enterprise IL on track; targeting to maintain/expand share October 22, 2025 Preliminary & unaudited, Q3 2025 financial review and analysis 13
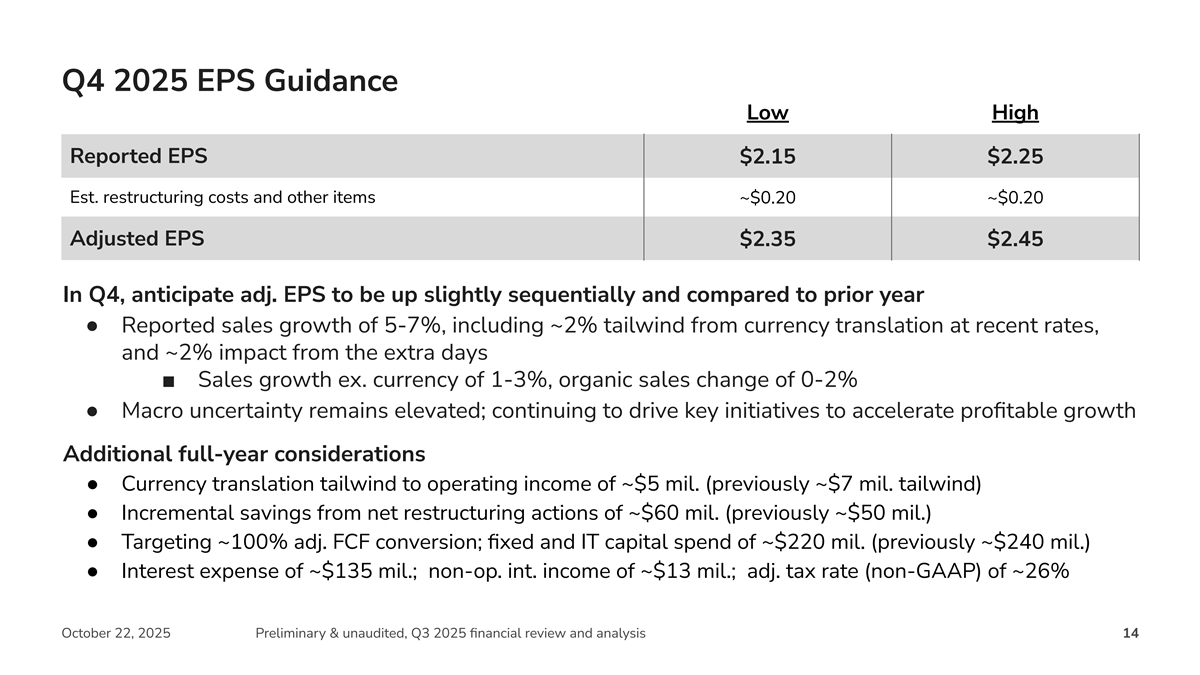
Q4 2025 EPS Guidance Low High Reported EPS $2.15 $2.25 Est. restructuring costs and other items ~$0.20 ~$0.20 Adjusted EPS $2.35 $2.45 In Q4, anticipate adj. EPS to be up slightly sequentially and compared to prior year ● Reported sales growth of 5-7%, including ~2% tailwind from currency translation at recent rates, and ~2% impact from the extra days ■ Sales growth ex. currency of 1-3%, organic sales change of 0-2% ● Macro uncertainty remains elevated; continuing to drive key initiatives to accelerate profitable growth Additional full-year considerations ● Currency translation tailwind to operating income of ~$5 mil. (previously ~$7 mil. tailwind) ● Incremental savings from net restructuring actions of ~$60 mil. (previously ~$50 mil.) ● Targeting ~100% adj. FCF conversion; fixed and IT capital spend of ~$220 mil. (previously ~$240 mil.) ● Interest expense of ~$135 mil.; non-op. int. income of ~$13 mil.; adj. tax rate (non-GAAP) of ~26% October 22, 2025 Preliminary & unaudited, Q3 2025 financial review and analysis 14

Appendix September 18, 2024 Avery Dennison 2024 Investor Day 15 Classification: Avery Dennison - Secret
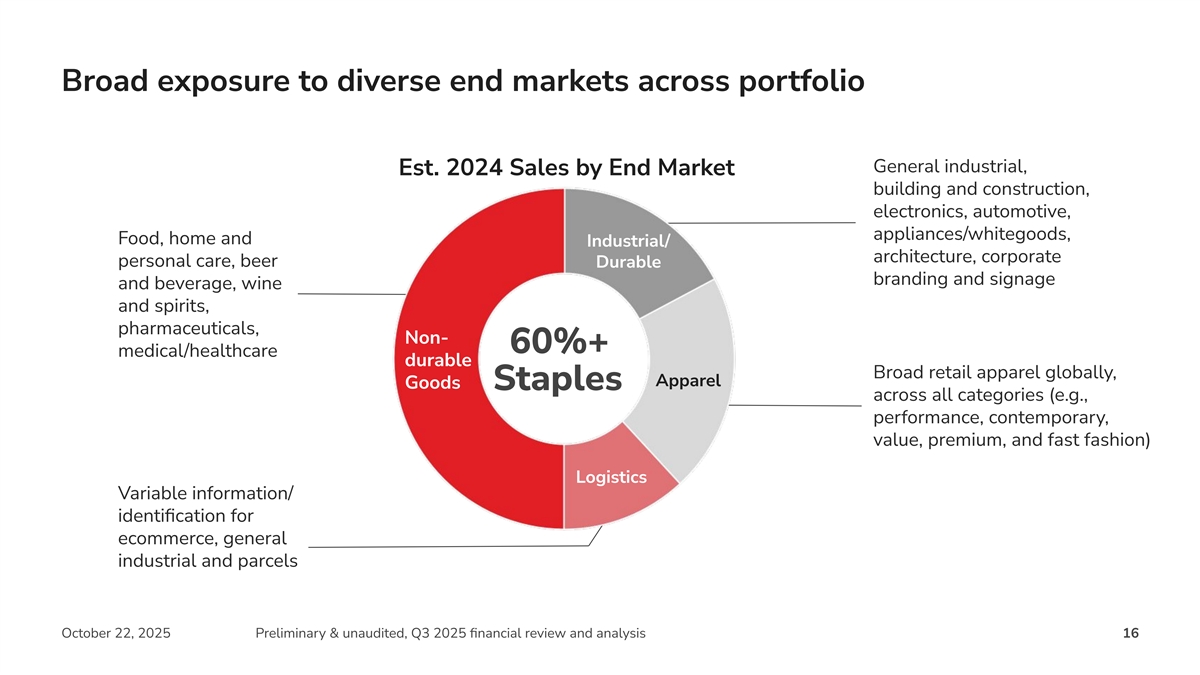
Apparel Broad exposure to diverse end markets across portfolio General industrial, Est. 2024 Sales by End Market building and construction, electronics, automotive, appliances/whitegoods, Food, home and Industrial/ architecture, corporate personal care, beer Durable branding and signage and beverage, wine and spirits, pharmaceuticals, Non- 60%+ medical/healthcare durable Broad retail apparel globally, Goods Staples across all categories (e.g., performance, contemporary, value, premium, and fast fashion) Logistics Variable information/ identification for ecommerce, general industrial and parcels October 22, 2025 Preliminary & unaudited, Q3 2025 financial review and analysis 16
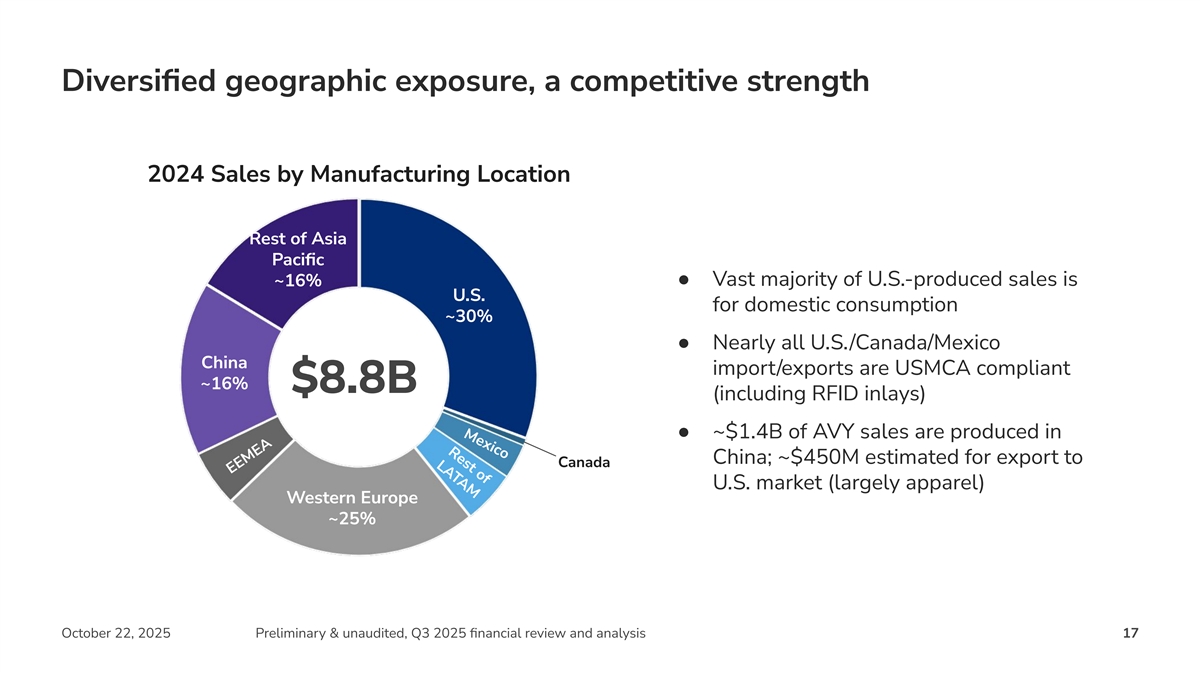
Rest of LATAM Mexico Diversified geographic exposure, a competitive strength ~16% China 2024 Sales by Manufacturing Location Rest of Asia Pacific ~16%● Vast majority of U.S.-produced sales is U.S. for domestic consumption ~30% ● Nearly all U.S./Canada/Mexico import/exports are USMCA compliant $8.8B (including RFID inlays) ● ~$1.4B of AVY sales are produced in China; ~$450M estimated for export to Canada U.S. market (largely apparel) U.S. Western Europe ~25% October 22, 2025 Preliminary & unaudited, Q3 2025 financial review and analysis 17 EEMEA

averydennison.com #MakingPossible © 2025 Avery Dennison Corporation. All rights reserved. The “Making Possible” tagline, Avery Dennison and all other Avery Dennison brands, product names and codes are trademarks of Avery Dennison Corporation. All other brands or product names are trademarks of their respective owners. Fortune 500® is a trademark of Time, Inc. Branding and other information on any October 22, 2025 Preliminary & unaudited, Q3 2025 financial review and anal samply es depict sis ed are fictitious. Any resemblance to actual names is purely coincidental. 18