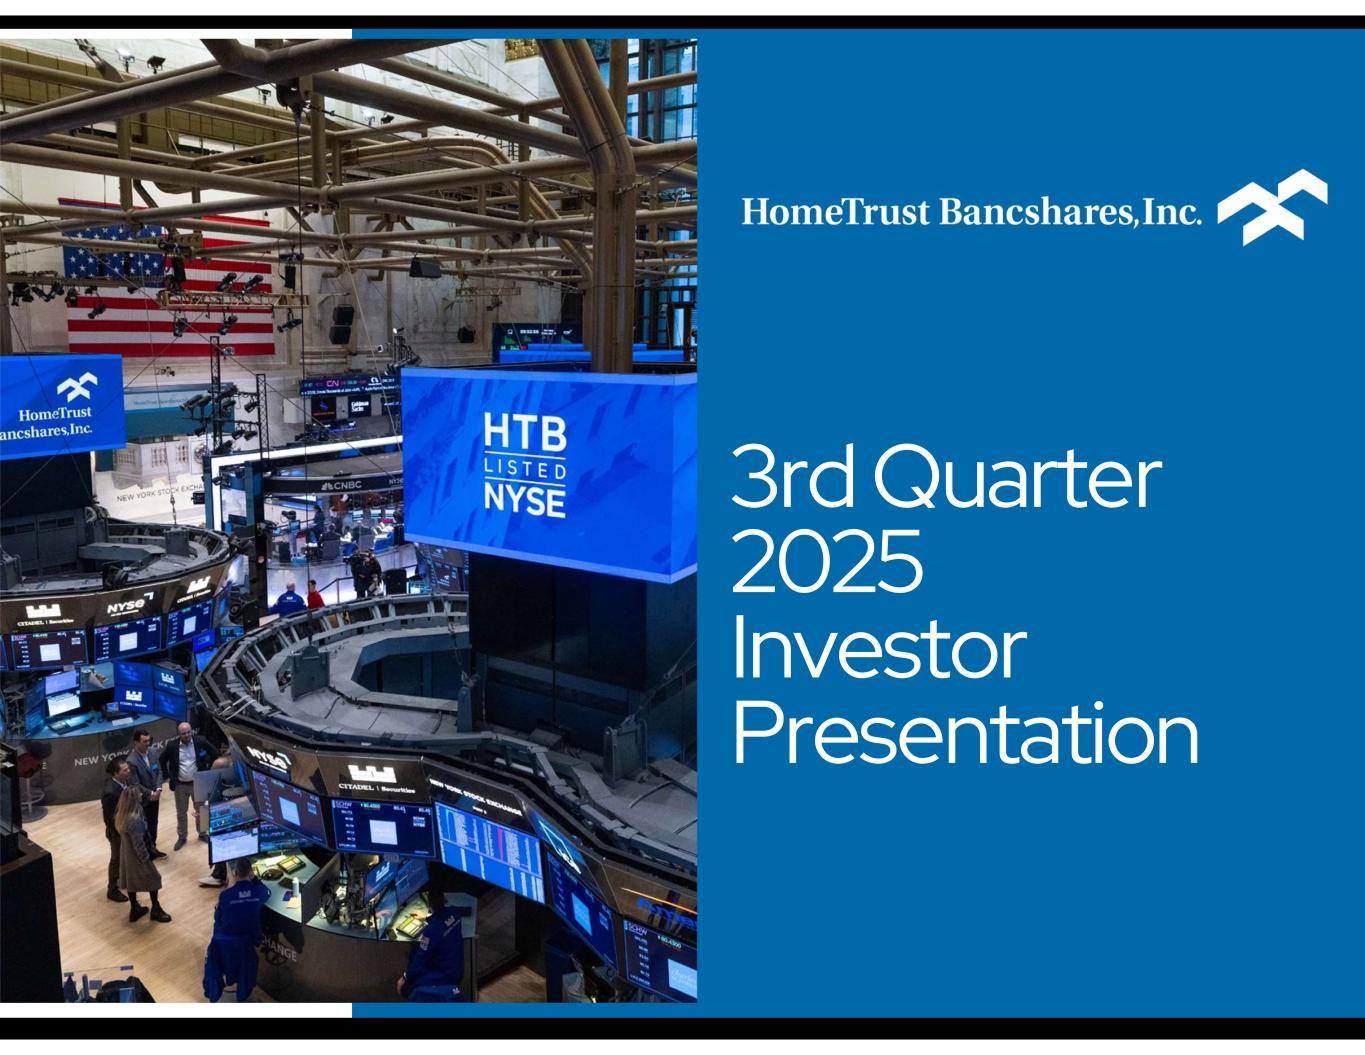
3rd Quarter 2025 Investor Presentation
This document includes "forward-looking statements" within the meaning of the Private Securities Litigation Reform Act of 1995. Forward-looking statements are not statements of historical fact, but instead are based on certain assumptions including statements with respect to the Company's beliefs, plans, objectives, goals, expectations, assumptions, and statements about future economic performance and projections of financial items. These forward-looking statements are subject to known and unknown risks, uncertainties and other factors that could cause actual results to differ materially from the results anticipated or implied by forward-looking statements. The factors that could result in material differentiation include, but are not limited to natural disasters, including the lingering effects of Hurricane Helene; expected revenues, cost savings, synergies and other benefits from merger and acquisition activities might not be realized to the extent anticipated, within the anticipated time frames, or at all, and costs or difficulties relating to integration matters, including but not limited to customer and employee retention, might be greater than expected; goodwill impairment charges might be incurred; increased competitive pressures among financial services companies; changes in the interest rate environment; changes in general economic conditions, both nationally and in our market areas; legislative and regulatory changes; and the effects of inflation, a potential recession, and other factors described in the Company's latest annual Report on Form 10-K and Quarterly Reports on Form 10-Q and other documents filed with or furnished to the Securities and Exchange Commission - which are available on the Company's website at www.htb.com and on the SEC's website at www.sec.gov. Any of the forward-looking statements that the Company makes in this document or the documents the Company files with or furnishes to the SEC are based upon management's beliefs and assumptions at the time they are made and may turn out to be wrong because of inaccurate assumptions, the factors described above or because of other factors that management cannot foresee. The Company does not undertake, and specifically disclaims any obligation, to revise any forward-looking statements to reflect the occurrence of anticipated or unanticipated events or circumstances after the date of such statements. Forward Looking Statements 2
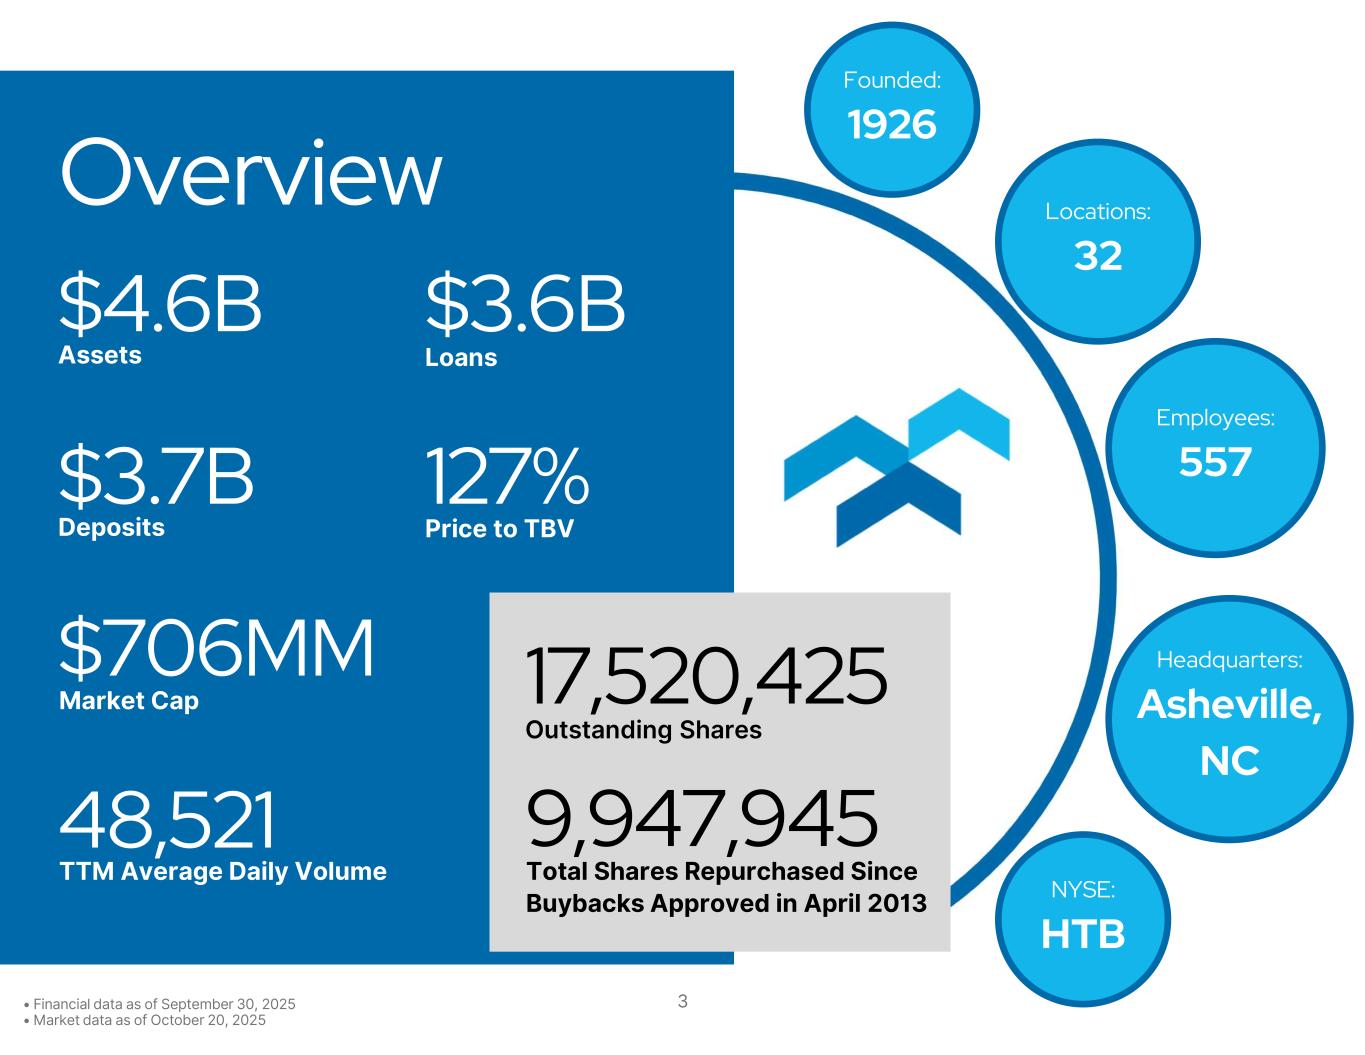
Founded: 1926 Locations: 32 Employees: 557 Headquarters: Asheville, NC NYSE: HTB Overview $4.6B Assets $3.6B Loans $3.7B Deposits 127% Price to TBV 9,947,945 Total Shares Repurchased Since Buybacks Approved in April 2013 $706MM Market Cap 48,521 TTM Average Daily Volume 17,520,425 Outstanding Shares • Financial data as of September 30, 2025 • Market data as of October 20, 2025 3
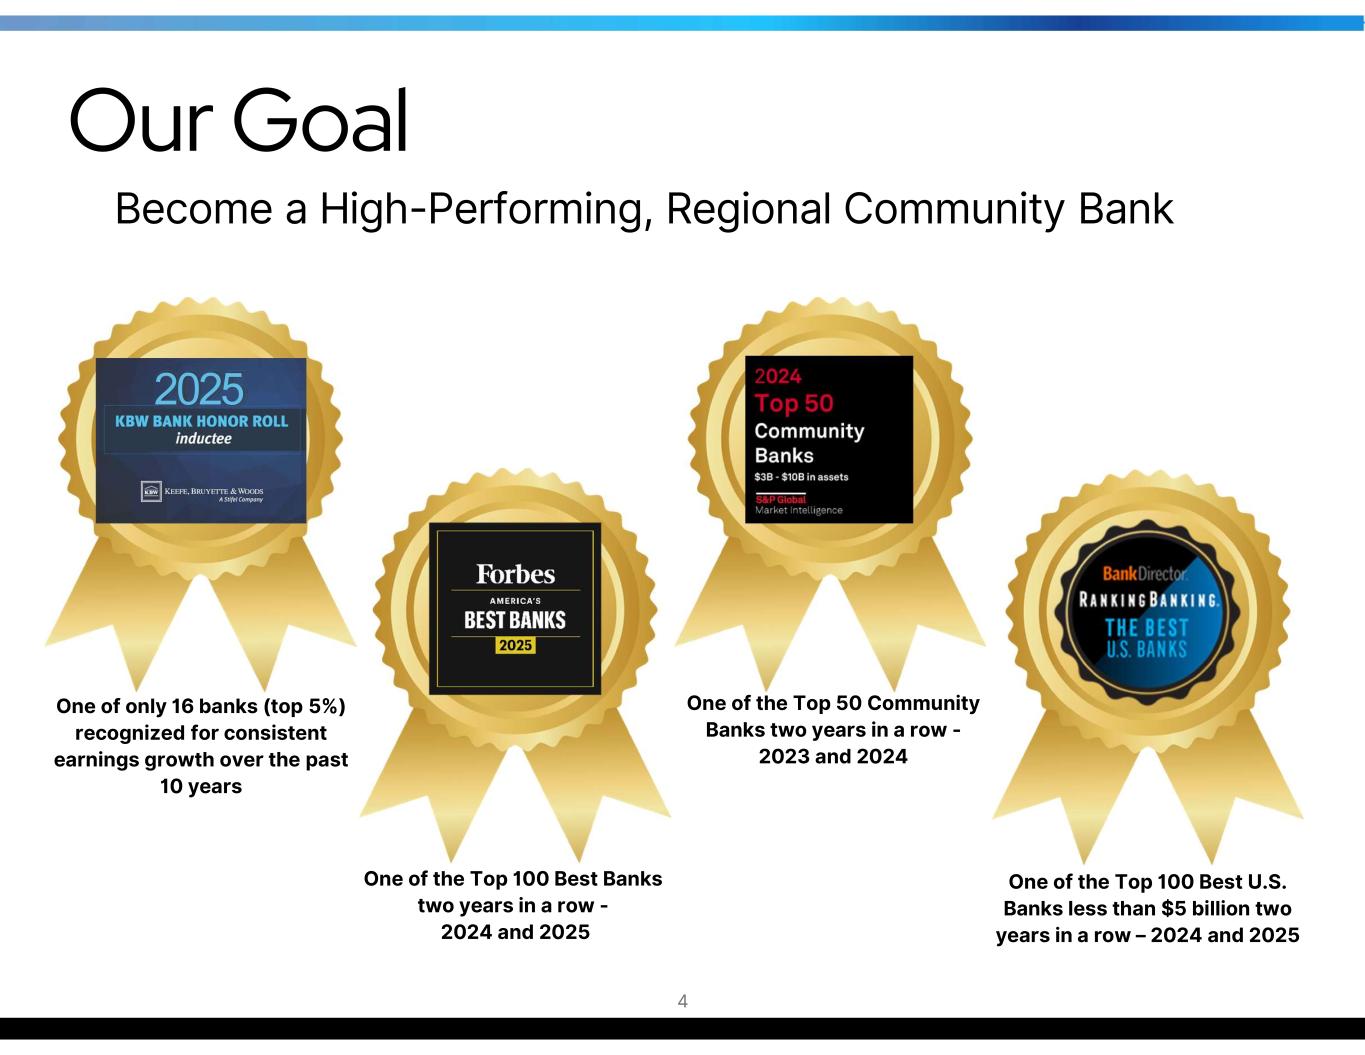
One of the Top 50 Community Banks two years in a row - 2023 and 2024 One of the Top 100 Best Banks two years in a row - 2024 and 2025 One of the Top 100 Best U.S. Banks less than $5 billion two years in a row – 2024 and 2025 4 Our Goal Become a High-Performing, Regional Community Bank One of only 16 banks (top 5%) recognized for consistent earnings growth over the past 10 years 2025
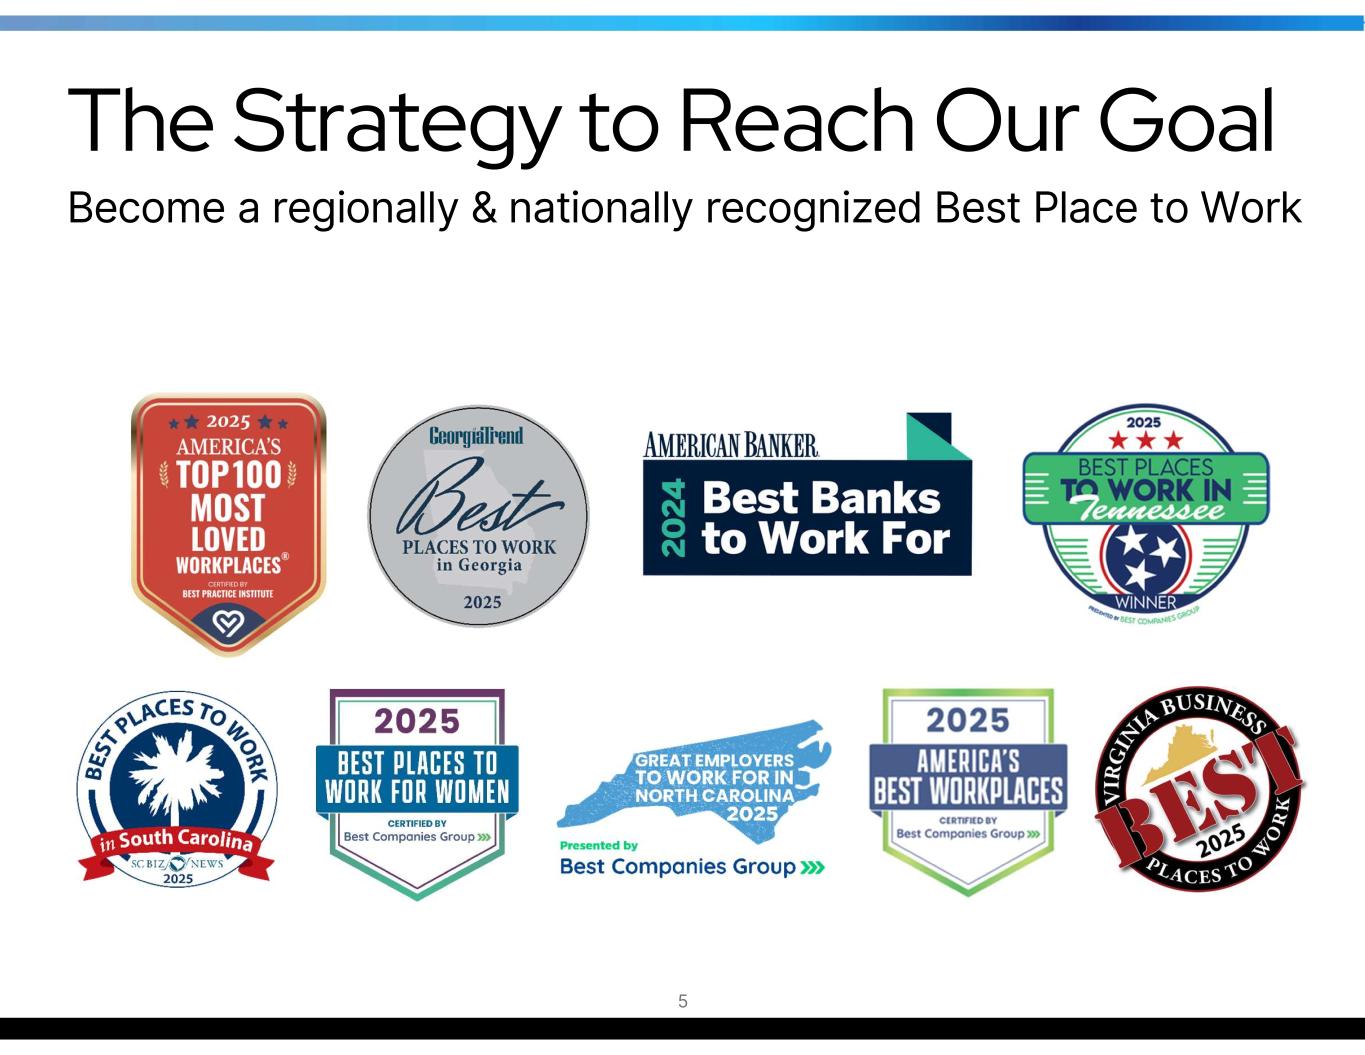
Become a regionally & nationally recognized Best Place to Work The Strategy to Reach Our Goal 5
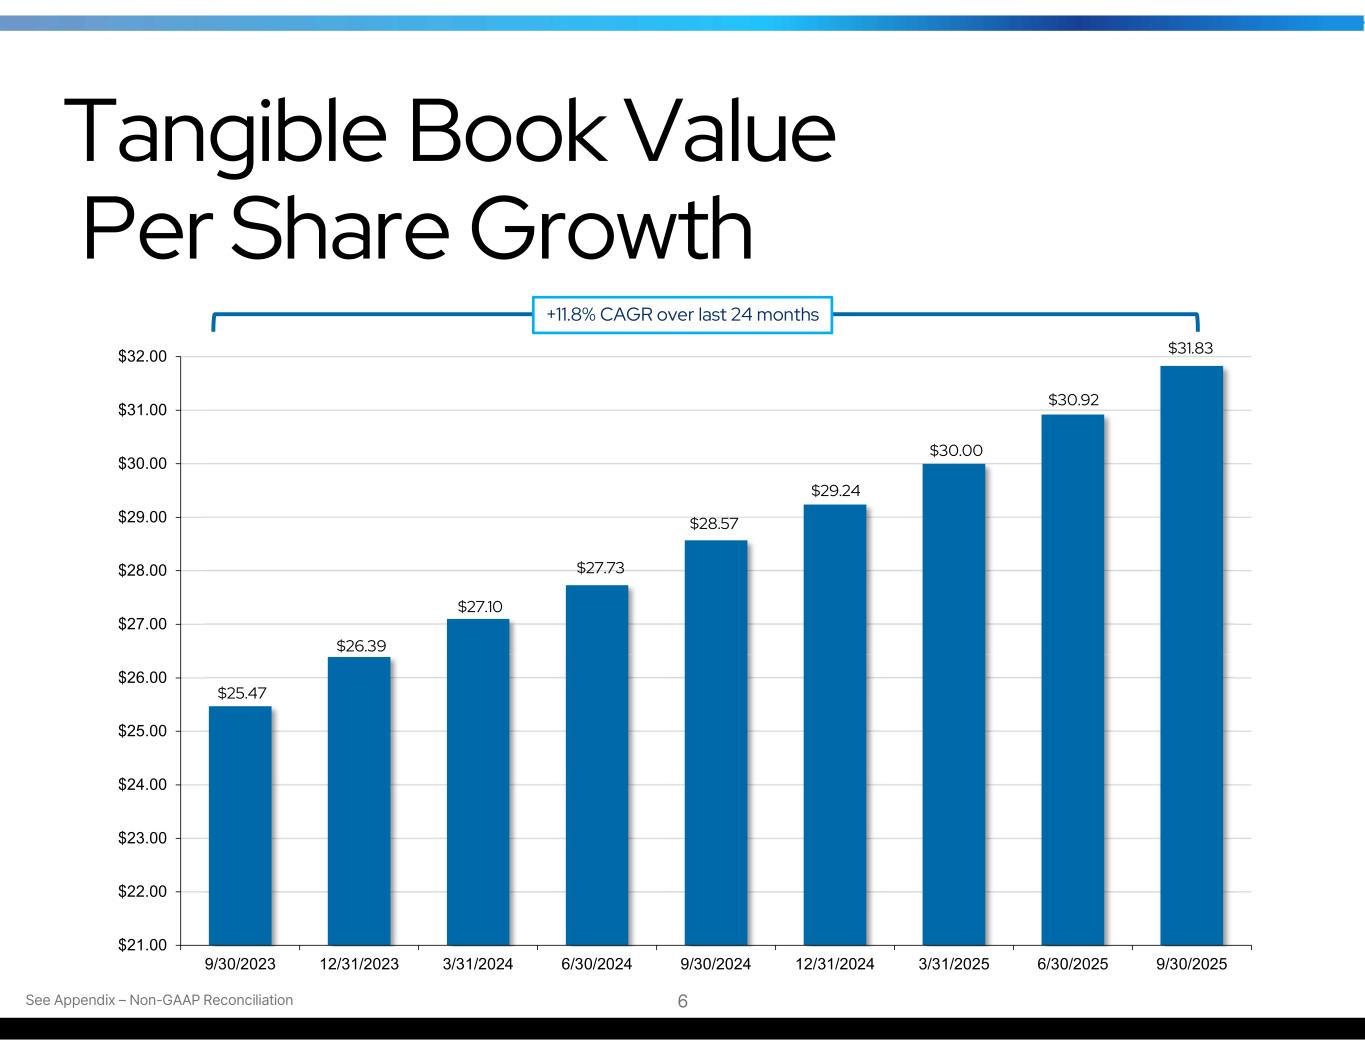
$25.47 $26.39 $27.10 $27.73 $28.57 $29.24 $30.00 $30.92 $31.83 $21.00 $22.00 $23.00 $24.00 $25.00 $26.00 $27.00 $28.00 $29.00 $30.00 $31.00 $32.00 9/30/2023 12/31/2023 3/31/2024 6/30/2024 9/30/2024 12/31/2024 3/31/2025 6/30/2025 9/30/2025 See Appendix – Non-GAAP Reconciliation Tangible Book Value Per Share Growth +11.8% CAGR over last 24 months 6
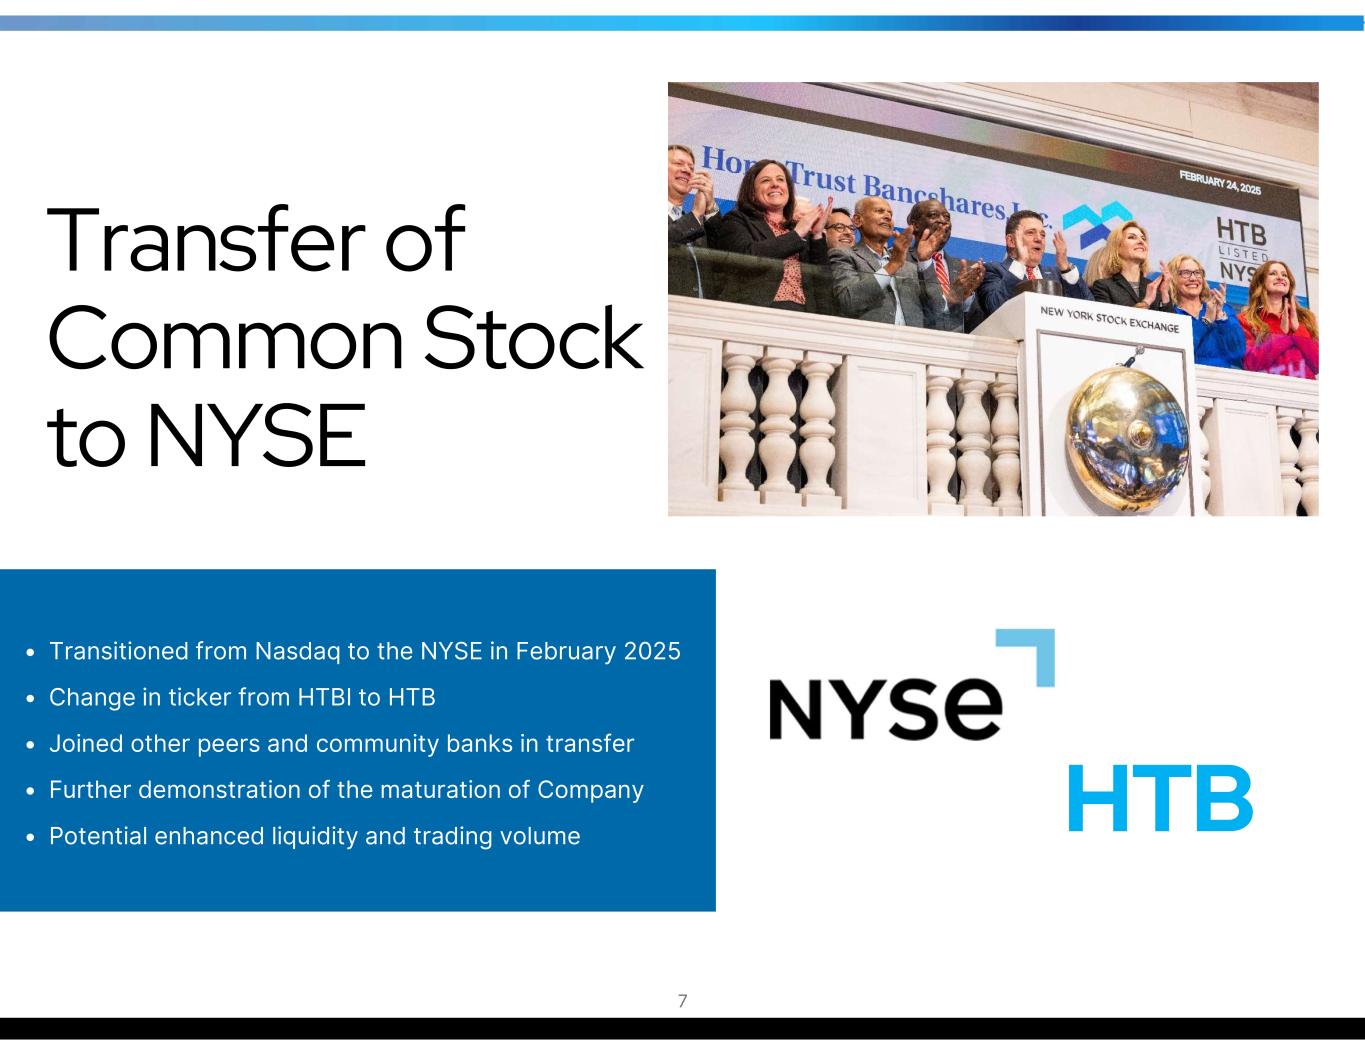
Transfer of Common Stock to NYSE HTB • Transitioned from Nasdaq to the NYSE in February 2025 • Change in ticker from HTBI to HTB • Joined other peers and community banks in transfer • Further demonstration of the maturation of Company • Potential enhanced liquidity and trading volume 7
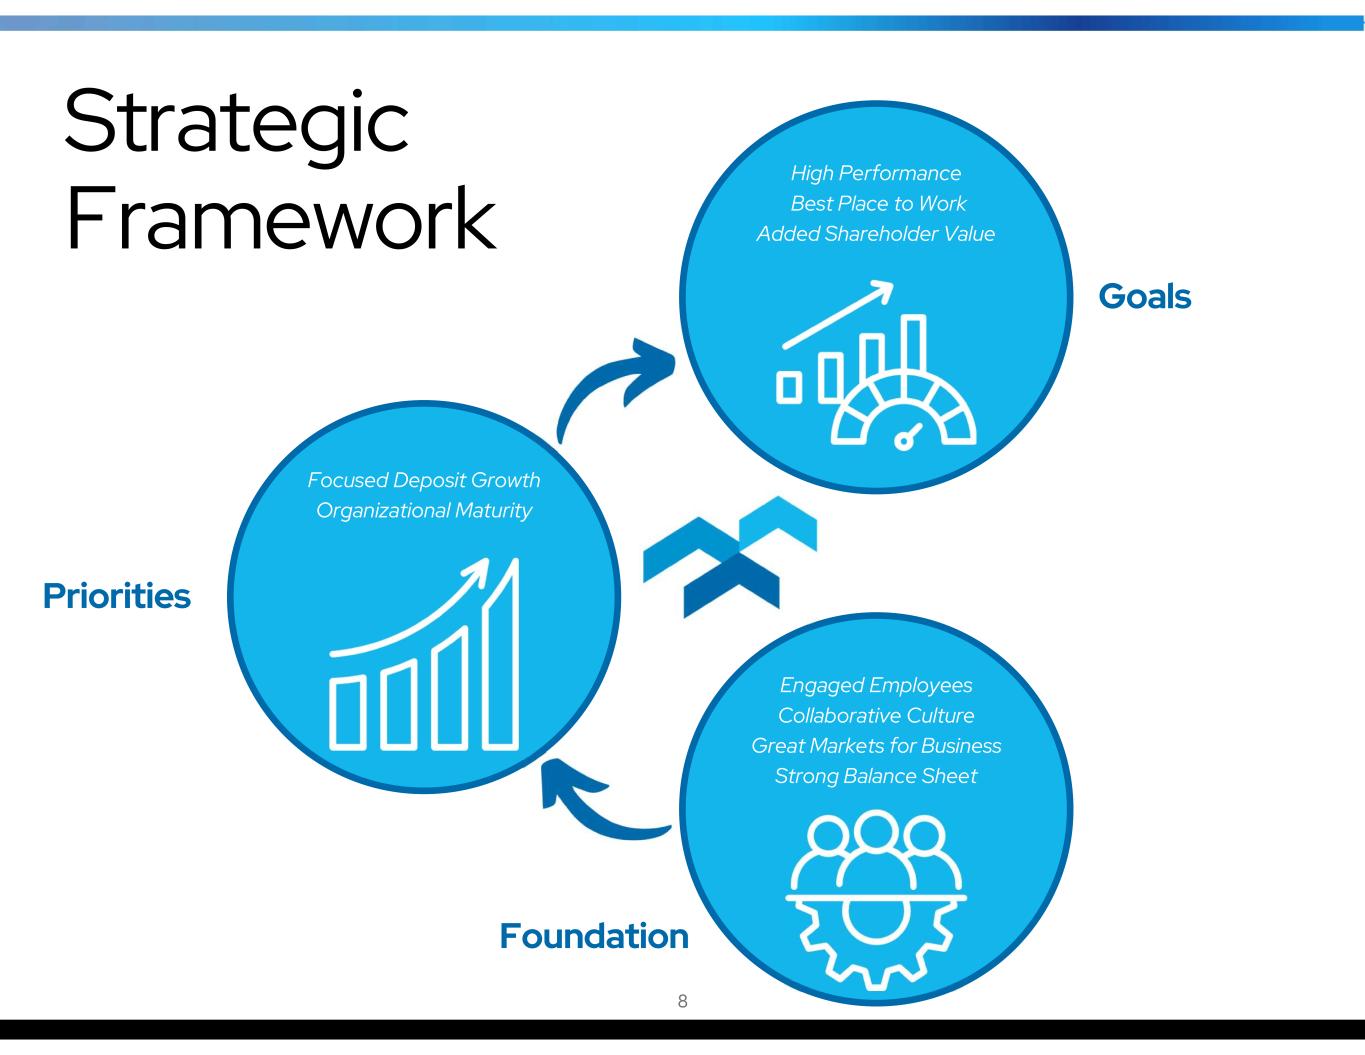
Focused Deposit Growth Organizational Maturity Strategic Framework High Performance Best Place to Work Added Shareholder Value Engaged Employees Collaborative Culture Great Markets for Business Strong Balance Sheet Foundation Priorities Goals 8
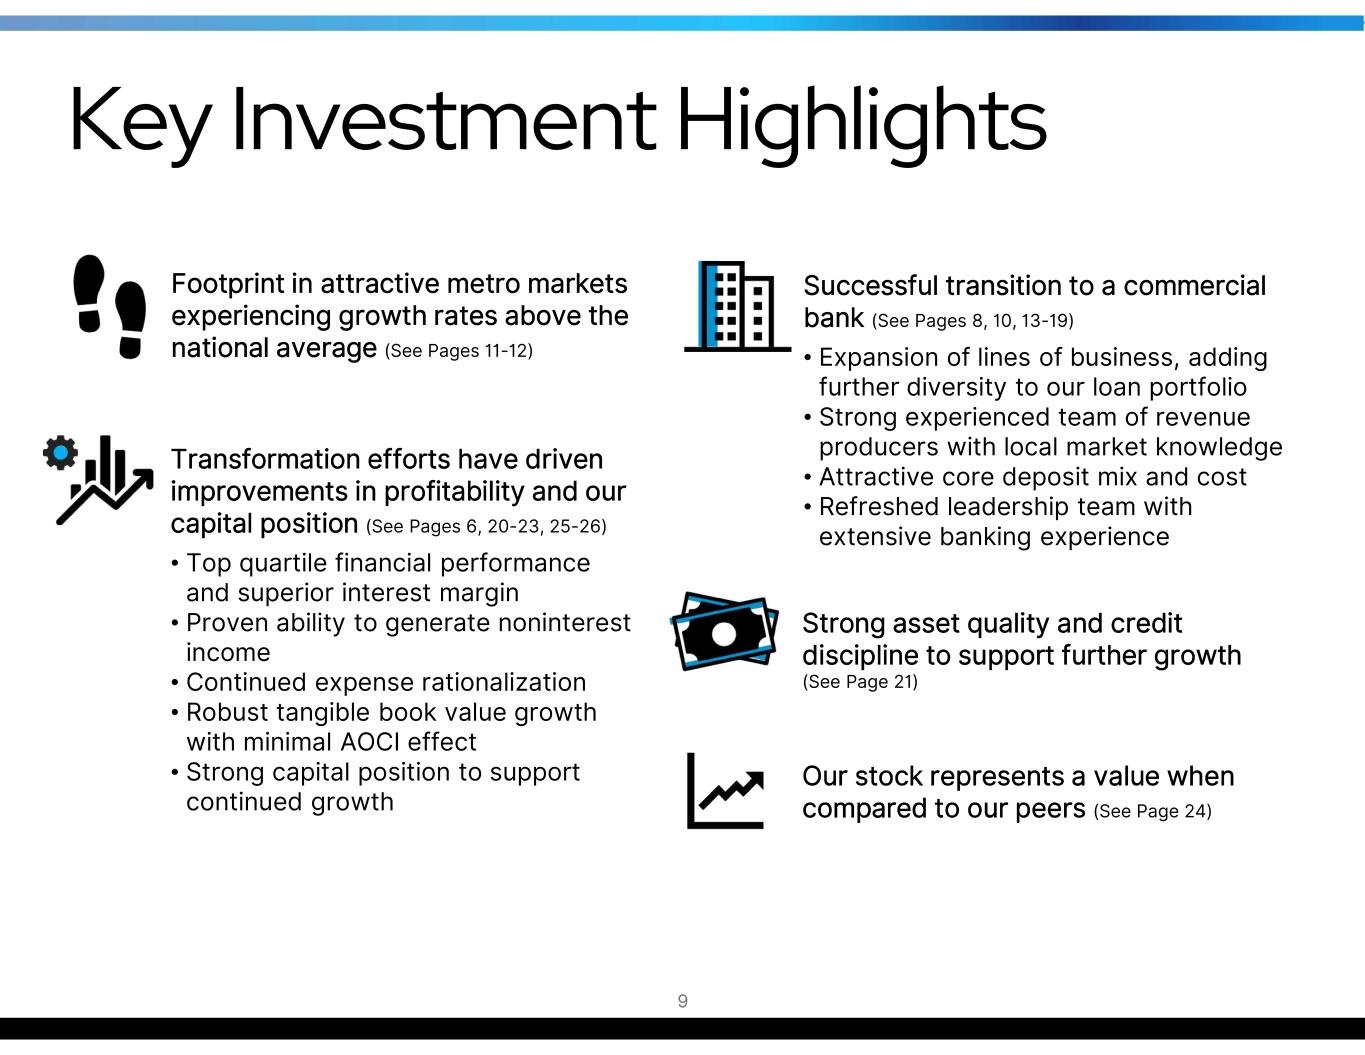
Key Investment Highlights Footprint in attractive metro markets experiencing growth rates above the national average (See Pages 11-12) Successful transition to a commercial bank (See Pages 8, 10, 13-19) • Expansion of lines of business, adding further diversity to our loan portfolio • Strong experienced team of revenue producers with local market knowledge • Attractive core deposit mix and cost • Refreshed leadership team with extensive banking experience Our stock represents a value when compared to our peers (See Page 24) Transformation efforts have driven improvements in profitability and our capital position (See Pages 6, 20-23, 25-26) • Top quartile financial performance and superior interest margin • Proven ability to generate noninterest income • Continued expense rationalization • Robust tangible book value growth with minimal AOCI effect • Strong capital position to support continued growth Strong asset quality and credit discipline to support further growth (See Page 21) 9
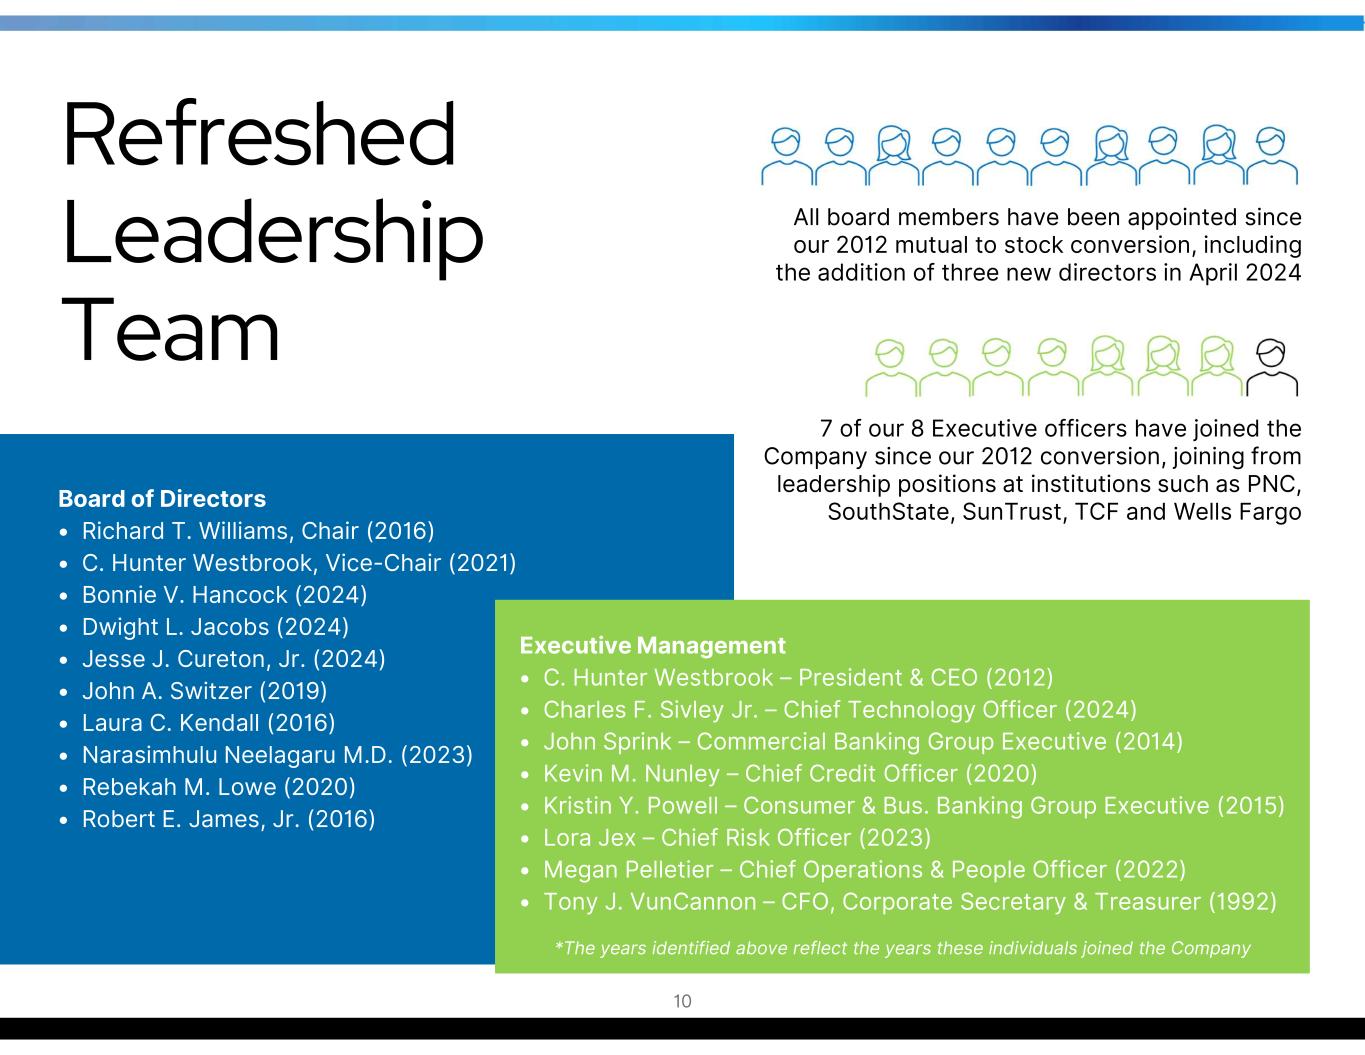
Refreshed Leadership Team Executive Management • C. Hunter Westbrook – President & CEO (2012) • Charles F. Sivley Jr. – Chief Technology Officer (2024) • John Sprink – Commercial Banking Group Executive (2014) • Kevin M. Nunley – Chief Credit Officer (2020) • Kristin Y. Powell – Consumer & Bus. Banking Group Executive (2015) • Lora Jex – Chief Risk Officer (2023) • Megan Pelletier – Chief Operations & People Officer (2022) • Tony J. VunCannon – CFO, Corporate Secretary & Treasurer (1992) Board of Directors • Richard T. Williams, Chair (2016) • C. Hunter Westbrook, Vice-Chair (2021) • Bonnie V. Hancock (2024) • Dwight L. Jacobs (2024) • Jesse J. Cureton, Jr. (2024) • John A. Switzer (2019) • Laura C. Kendall (2016) • Narasimhulu Neelagaru M.D. (2023) • Rebekah M. Lowe (2020) • Robert E. James, Jr. (2016) *The years identified above reflect the years these individuals joined the Company 7 of our 8 Executive officers have joined the Company since our 2012 conversion, joining from leadership positions at institutions such as PNC, SouthState, SunTrust, TCF and Wells Fargo All board members have been appointed since our 2012 mutual to stock conversion, including the addition of three new directors in April 2024 10
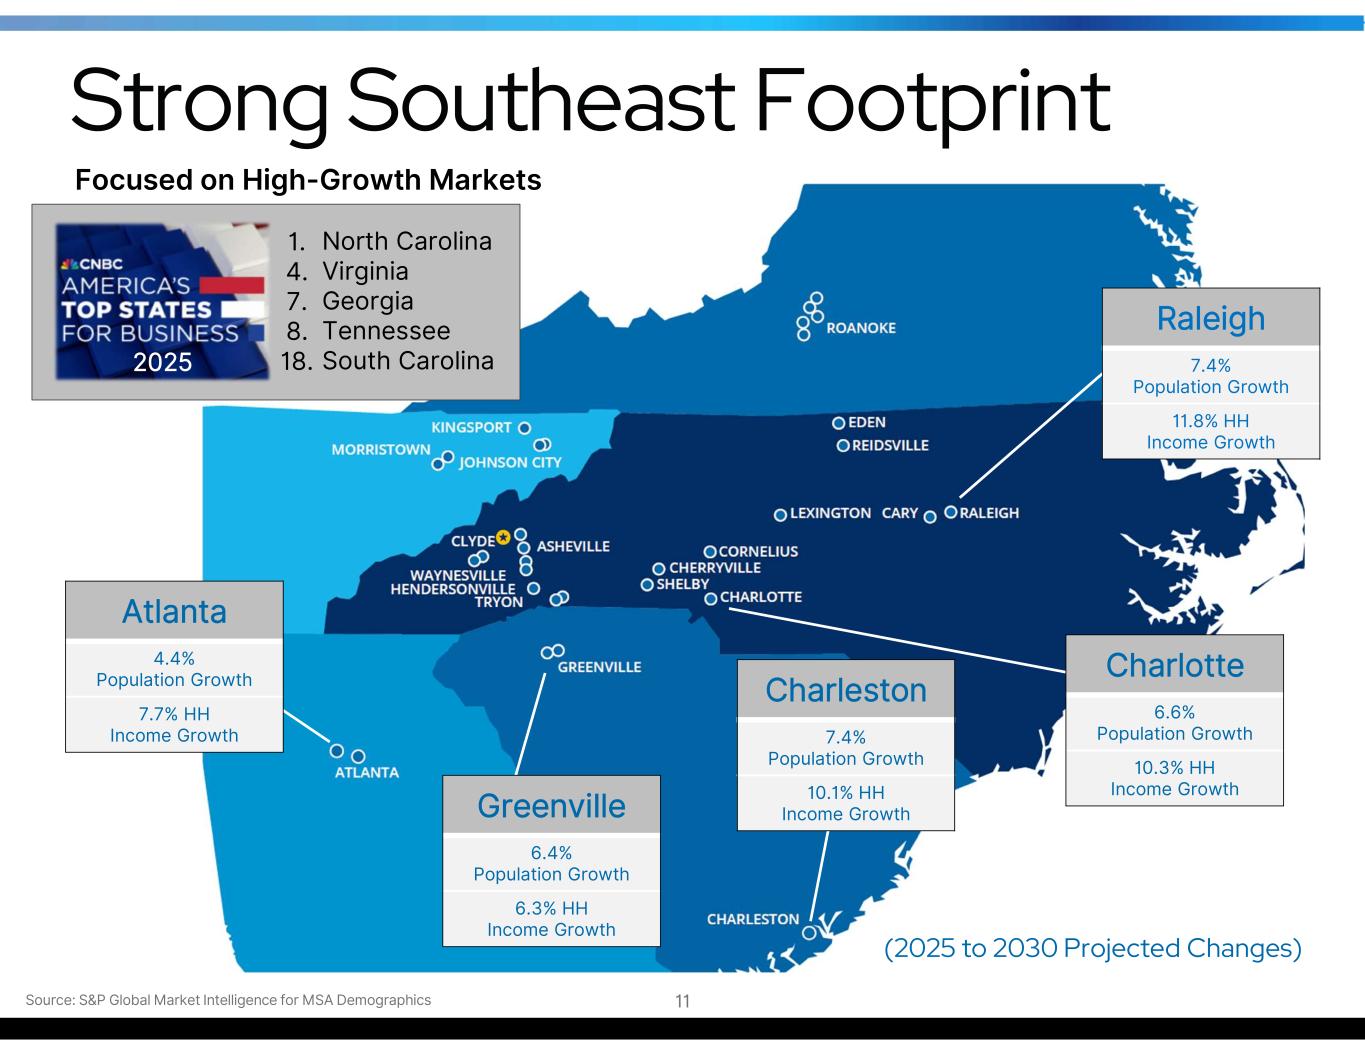
Strong Southeast Footprint Source: S&P Global Market Intelligence for MSA Demographics Raleigh 7.4% Population Growth 11.8% HH Income Growth Charlotte 6.6% Population Growth 10.3% HH Income Growth Atlanta 4.4% Population Growth 7.7% HH Income Growth Greenville 6.4% Population Growth 6.3% HH Income Growth (2025 to 2030 Projected Changes) Charleston 7.4% Population Growth 10.1% HH Income Growth Focused on High-Growth Markets 11 1. 4. 7. 8. 18. North Carolina Virginia Georgia Tennessee South Carolina2025
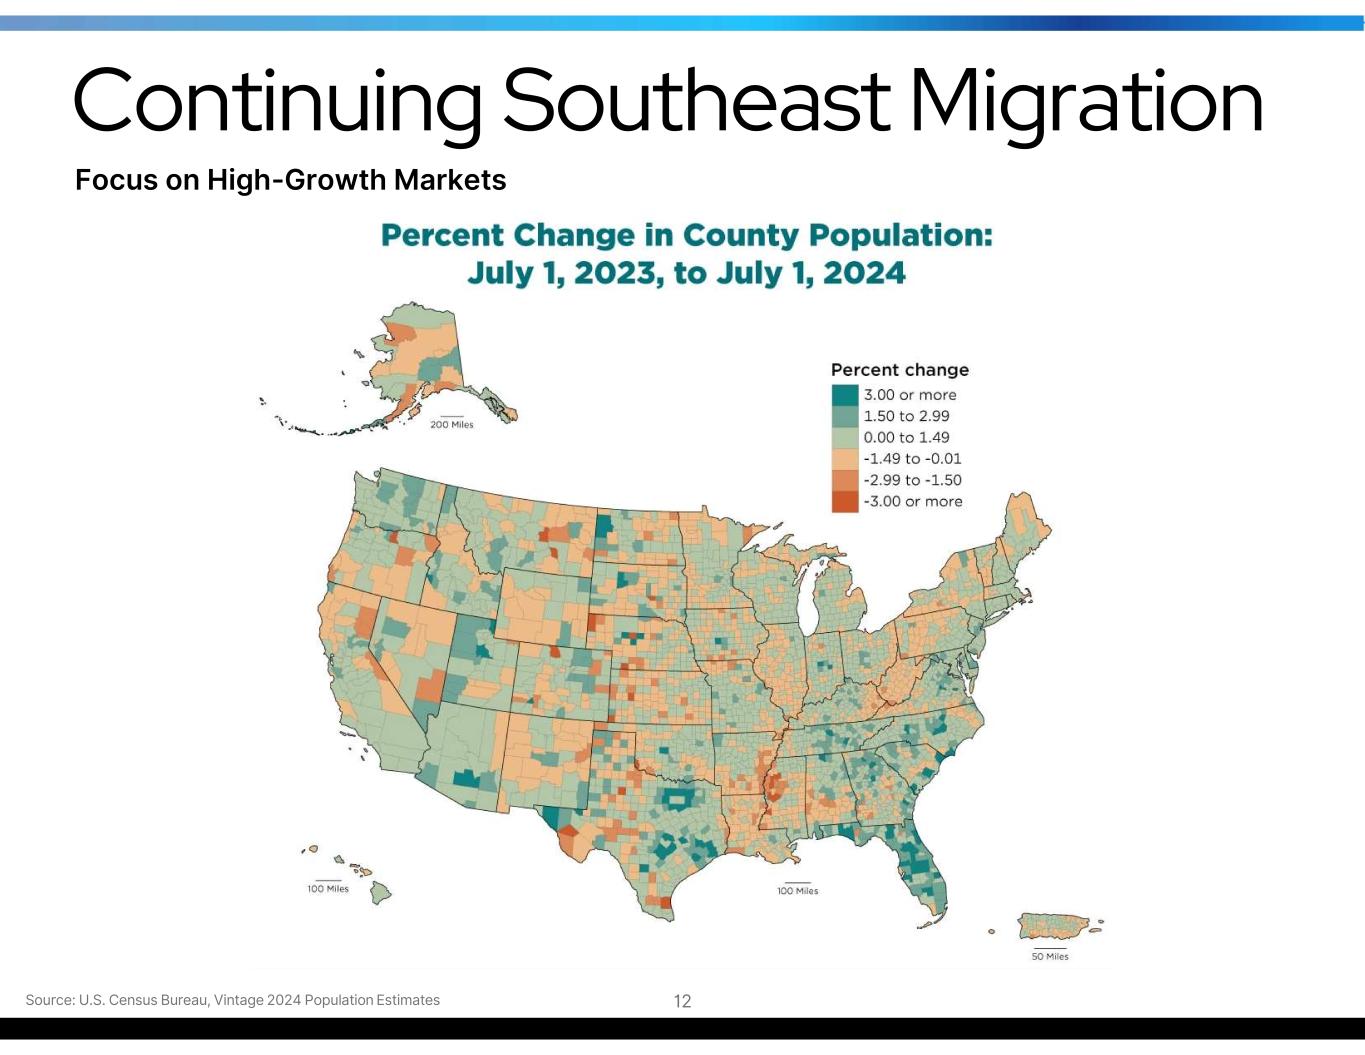
Continuing Southeast Migration Source: U.S. Census Bureau, Vintage 2024 Population Estimates 12 Focus on High-Growth Markets
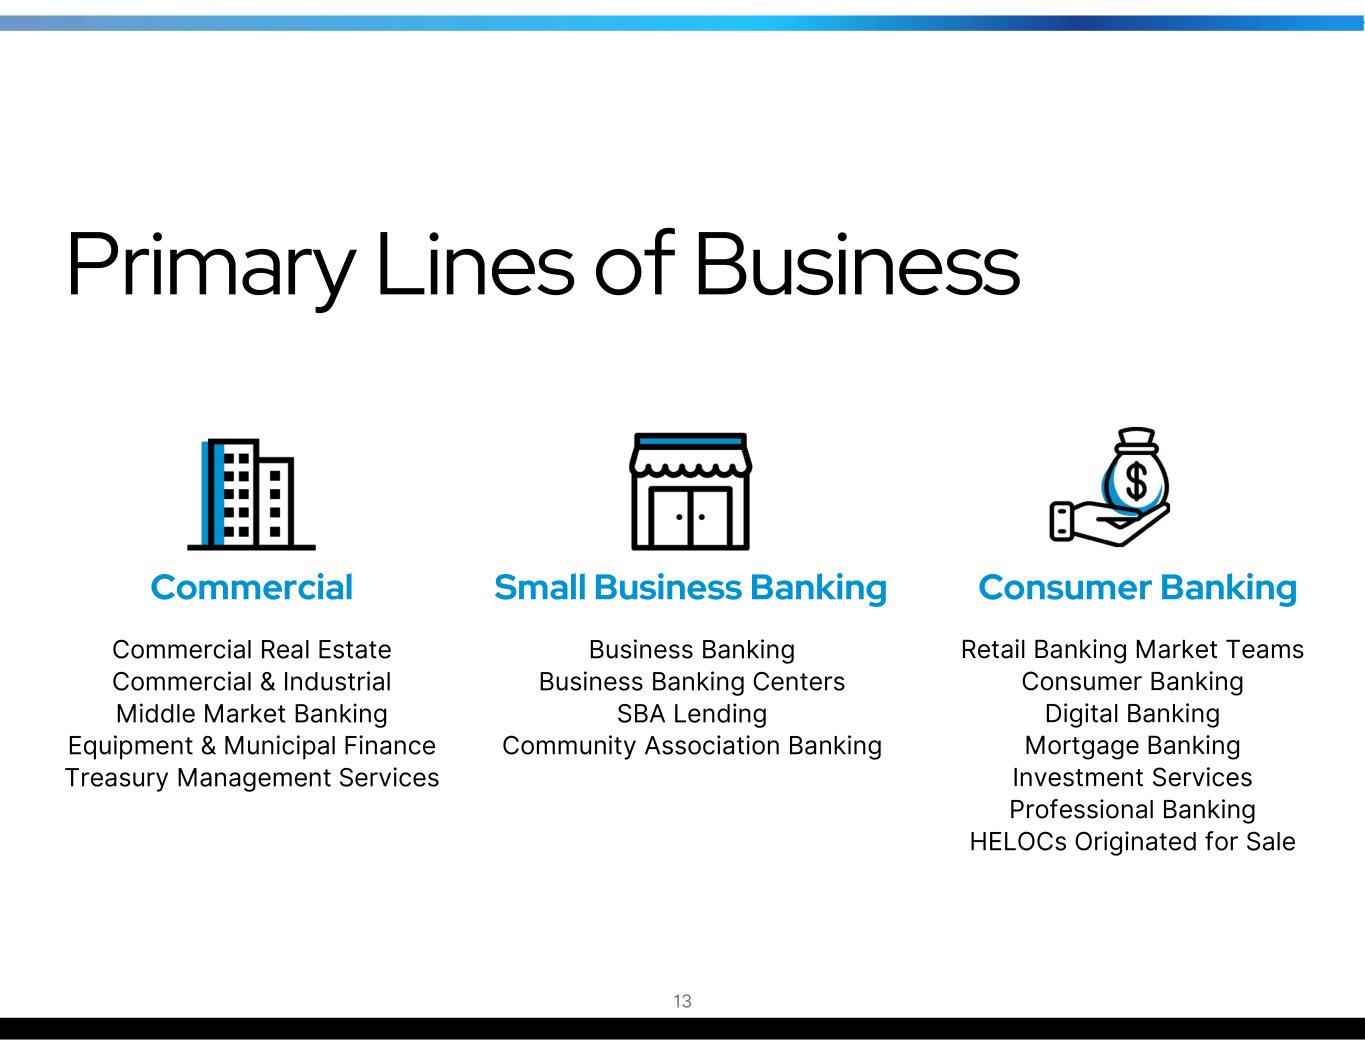
Business Banking Business Banking Centers SBA Lending Community Association Banking Small Business Banking Consumer Banking Commercial Commercial Real Estate Commercial & Industrial Middle Market Banking Equipment & Municipal Finance Treasury Management Services Retail Banking Market Teams Consumer Banking Digital Banking Mortgage Banking Investment Services Professional Banking HELOCs Originated for Sale Primary Lines of Business 13
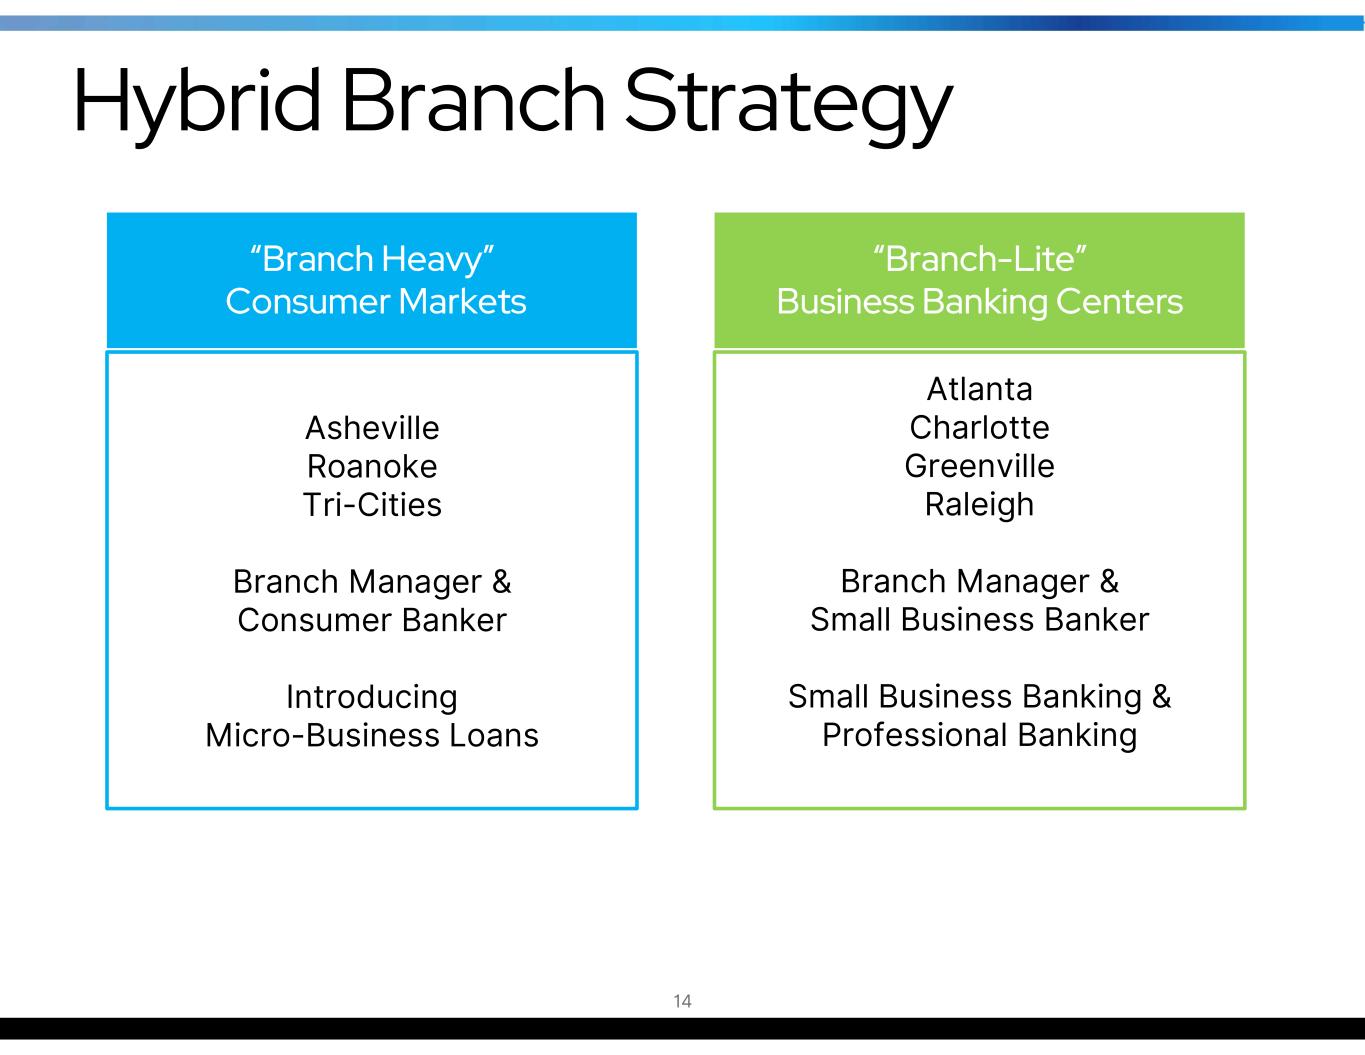
“Branch-Lite” Business Banking Centers “Branch Heavy” Consumer Markets Asheville Roanoke Tri-Cities Branch Manager & Consumer Banker Introducing Micro-Business Loans Atlanta Charlotte Greenville Raleigh Branch Manager & Small Business Banker Small Business Banking & Professional Banking 14 Hybrid Branch Strategy
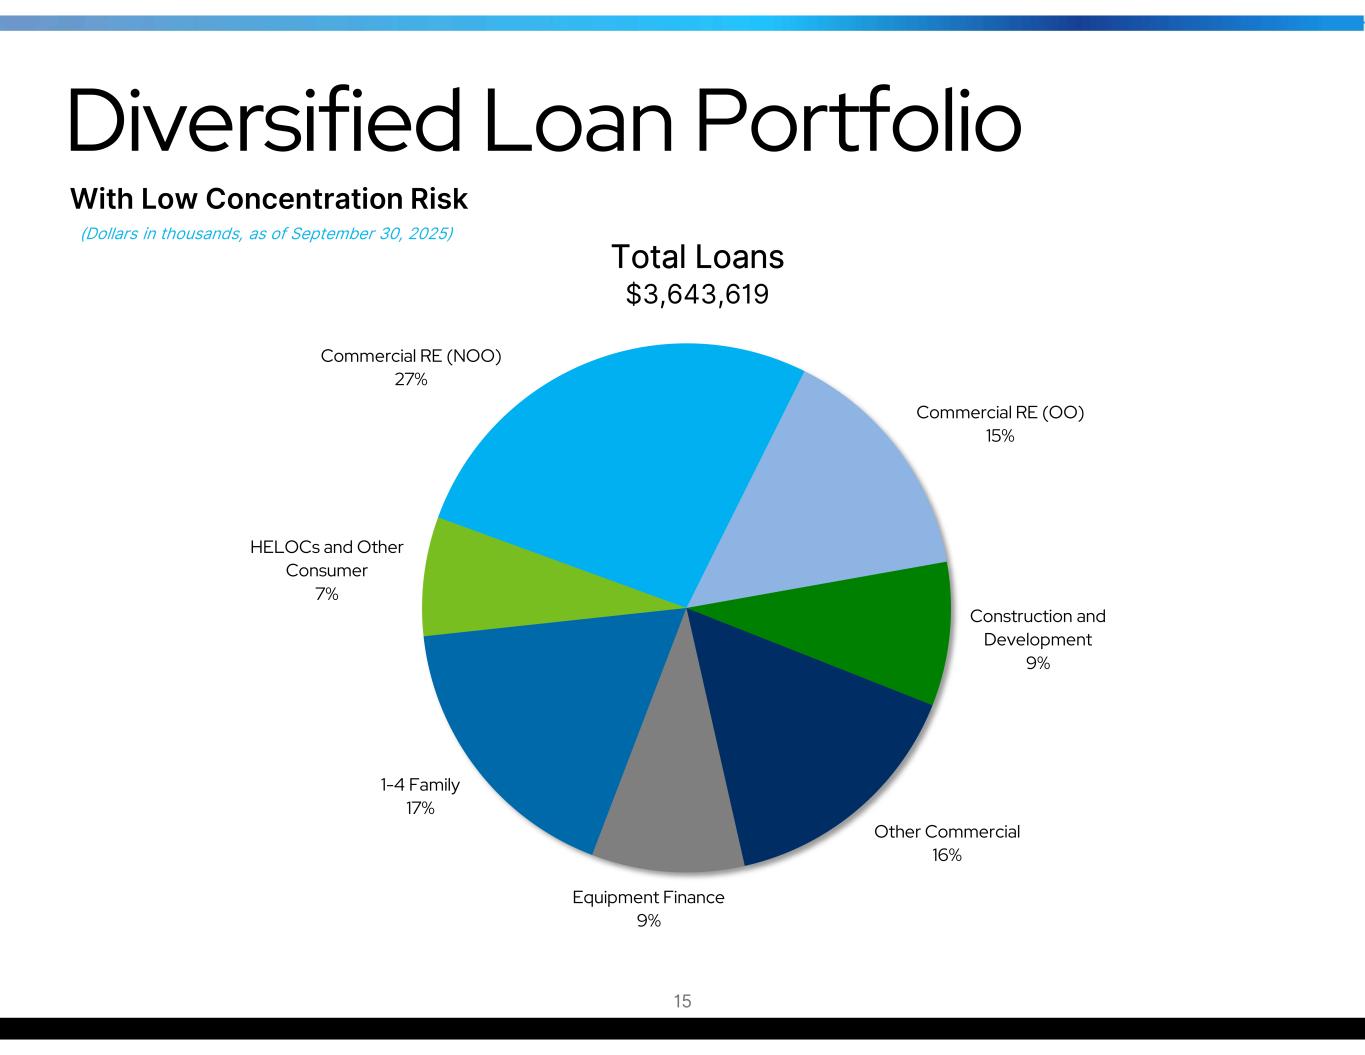
Commercial RE (NOO) 27% Commercial RE (OO) 15% Construction and Development 9% Other Commercial 16% Equipment Finance 9% 1-4 Family 17% HELOCs and Other Consumer 7% Diversified Loan Portfolio 15 Total Loans $3,643,619 (Dollars in thousands, as of September 30, 2025) With Low Concentration Risk
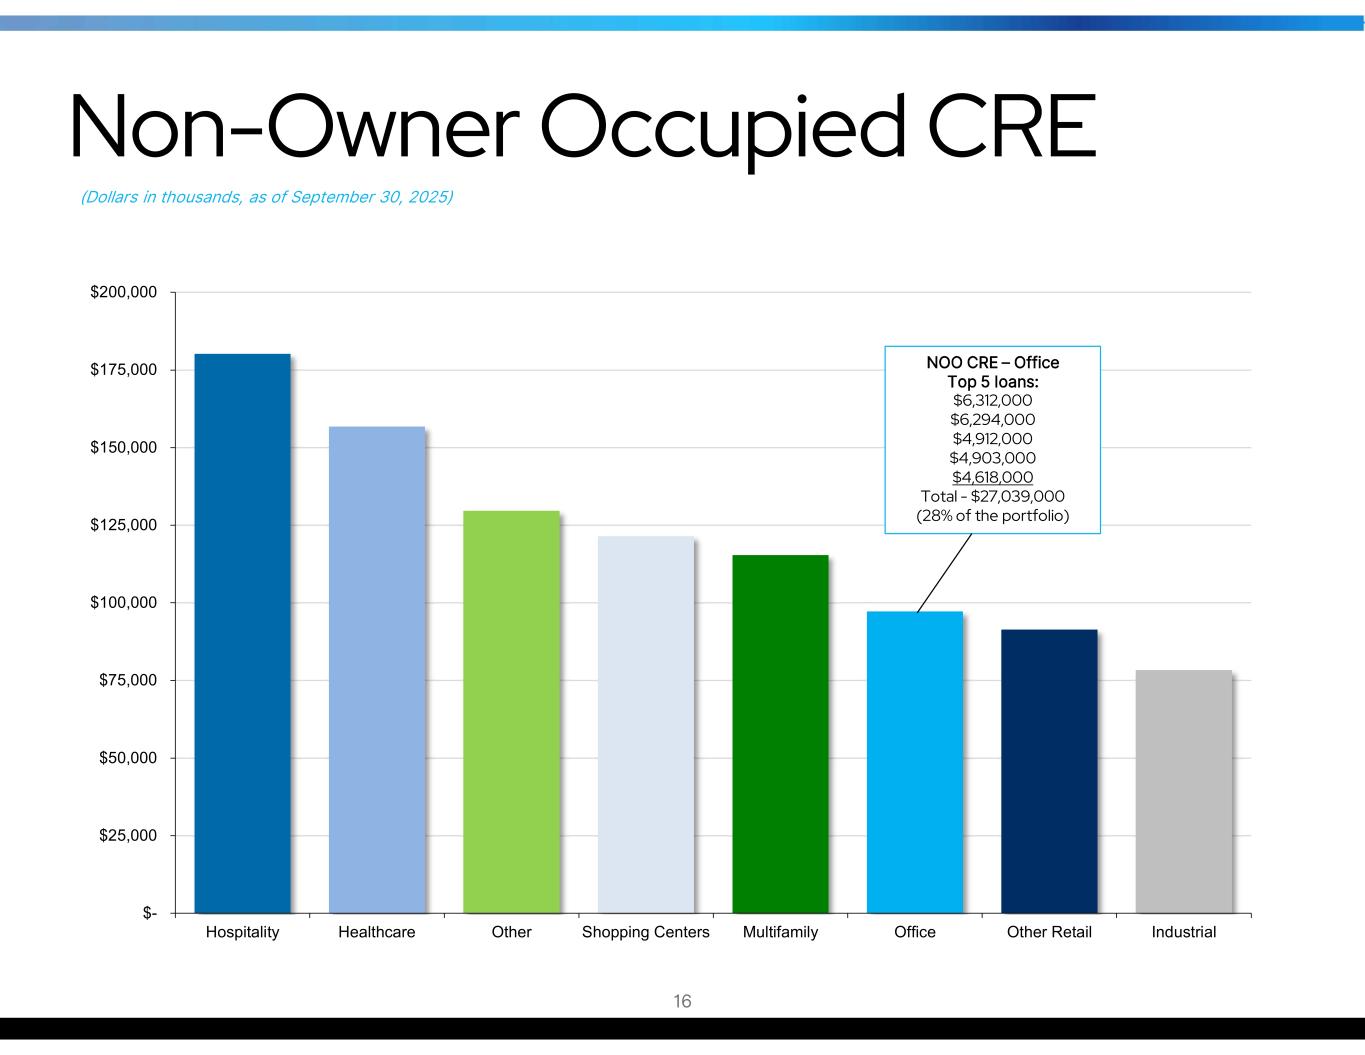
$- $25,000 $50,000 $75,000 $100,000 $125,000 $150,000 $175,000 $200,000 Hospitality Healthcare Other Shopping Centers Multifamily Office Other Retail Industrial Non-Owner Occupied CRE NOO CRE – Office Top 5 loans: $6,312,000 $6,294,000 $4,912,000 $4,903,000 $4,618,000 Total - $27,039,000 (28% of the portfolio) 16 (Dollars in thousands, as of September 30, 2025)
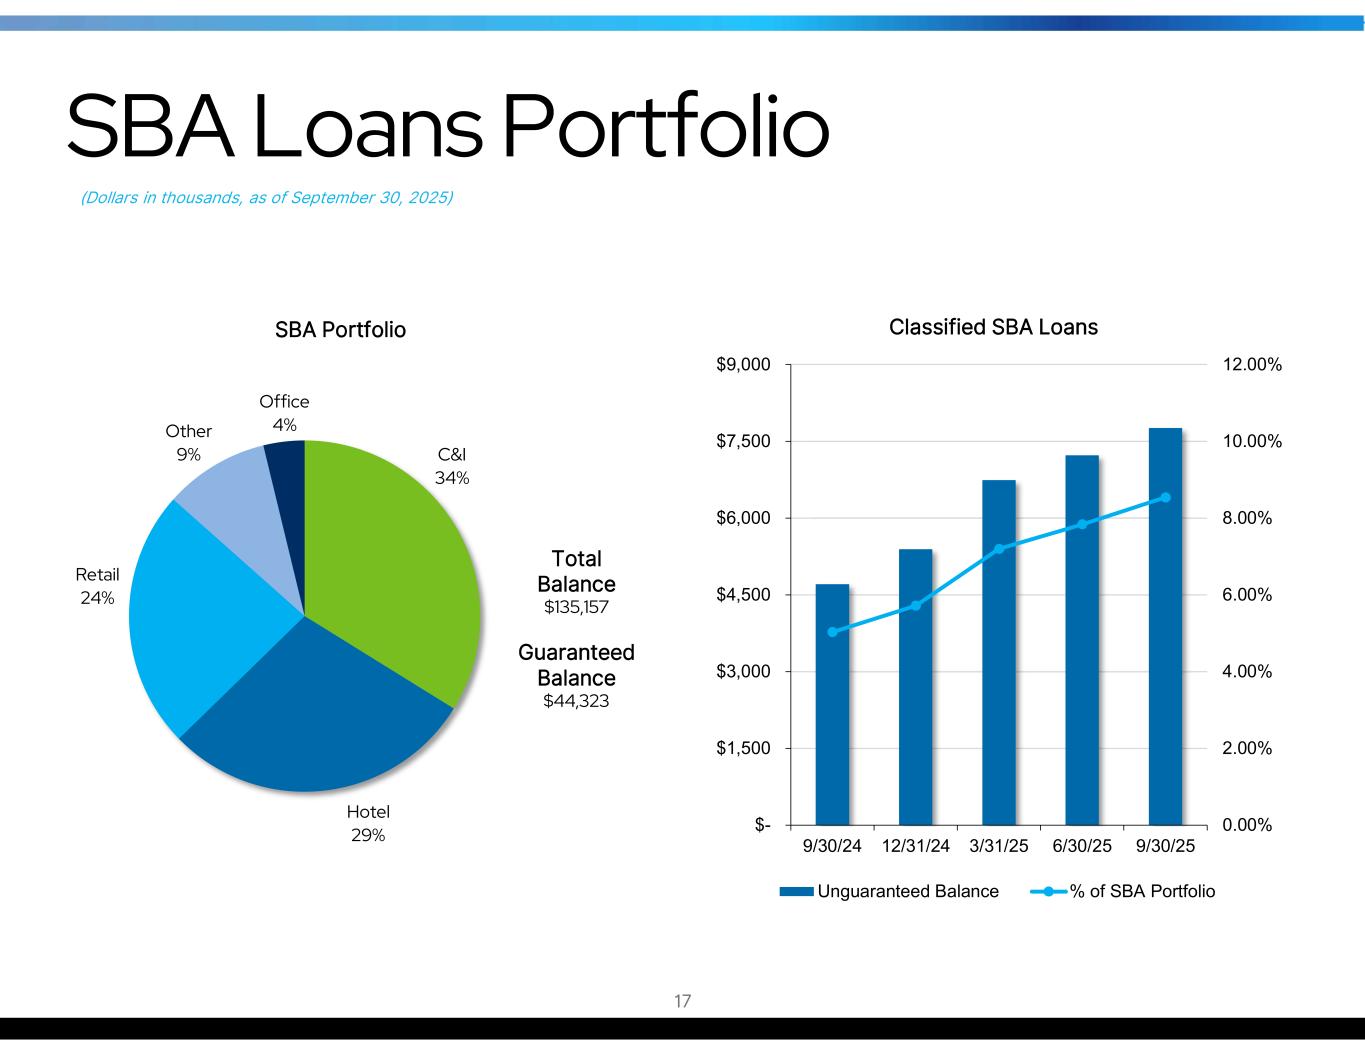
C&I 34% Hotel 29% Retail 24% Other 9% Office 4% SBA Portfolio Total Balance $135,157 Guaranteed Balance $44,323 0.00% 2.00% 4.00% 6.00% 8.00% 10.00% 12.00% $- $1,500 $3,000 $4,500 $6,000 $7,500 $9,000 9/30/24 12/31/24 3/31/25 6/30/25 9/30/25 Classified SBA Loans Unguaranteed Balance % of SBA Portfolio 17 SBA Loans Portfolio (Dollars in thousands, as of September 30, 2025)
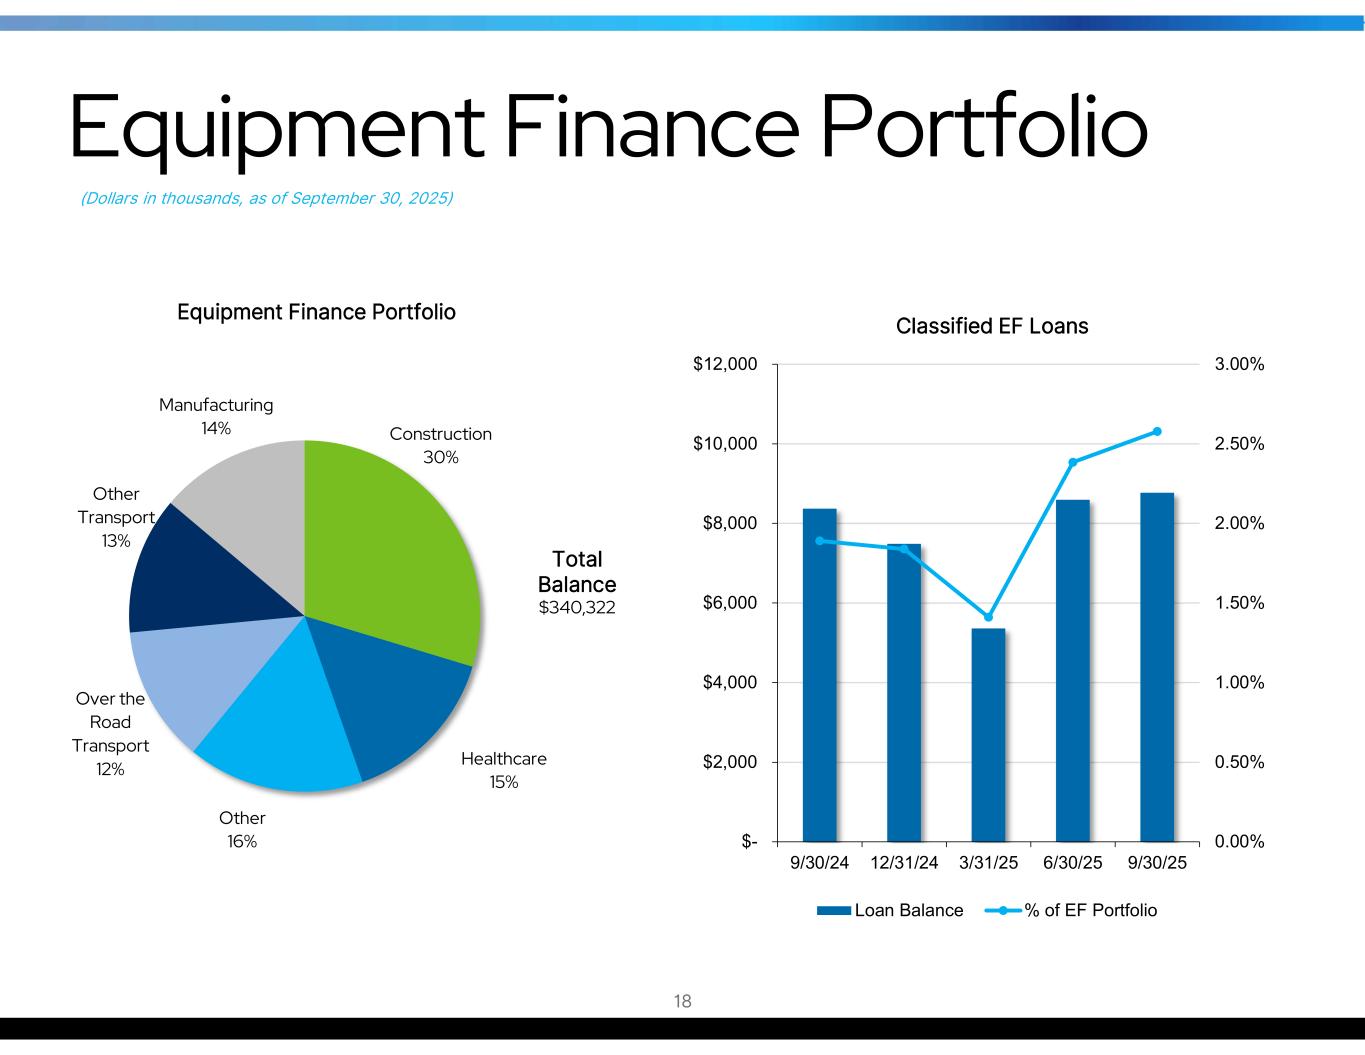
0.00% 0.50% 1.00% 1.50% 2.00% 2.50% 3.00% $- $2,000 $4,000 $6,000 $8,000 $10,000 $12,000 9/30/24 12/31/24 3/31/25 6/30/25 9/30/25 Classified EF Loans Loan Balance % of EF Portfolio 18 Equipment Finance Portfolio (Dollars in thousands, as of September 30, 2025) Construction 30% Healthcare 15% Other 16% Over the Road Transport 12% Other Transport 13% Manufacturing 14% Equipment Finance Portfolio Total Balance $340,322
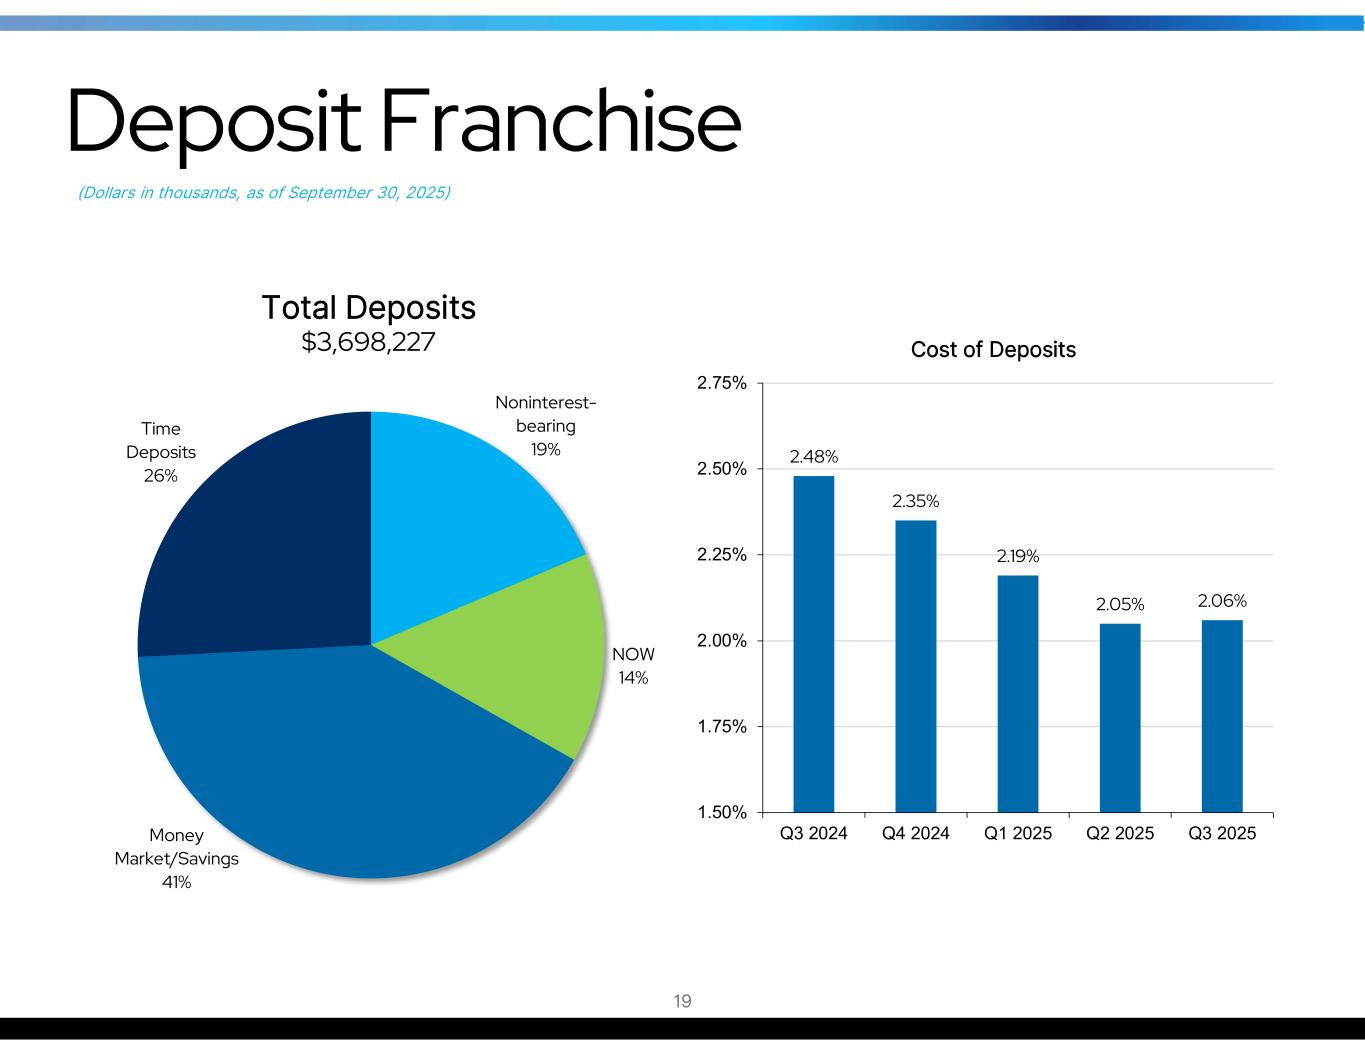
Noninterest- bearing 19% NOW 14% Money Market/Savings 41% Time Deposits 26% 2.48% 2.35% 2.19% 2.05% 2.06% 1.50% 1.75% 2.00% 2.25% 2.50% 2.75% Q3 2024 Q4 2024 Q1 2025 Q2 2025 Q3 2025 Cost of Deposits Deposit Franchise 19 (Dollars in thousands, as of September 30, 2025) Total Deposits $3,698,227
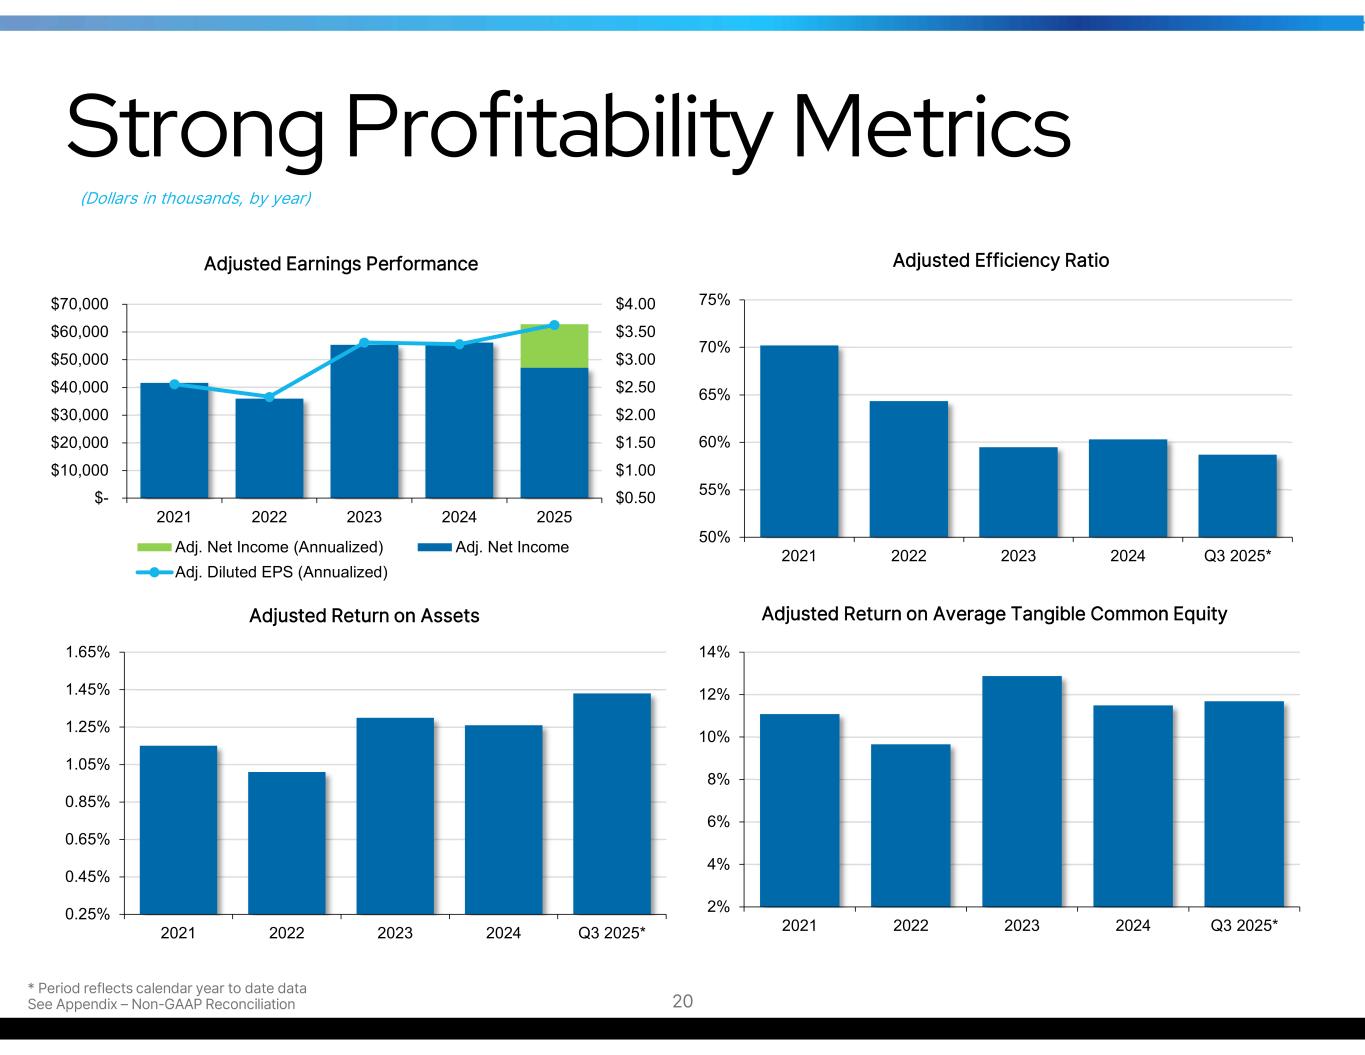
Strong Profitability Metrics (Dollars in thousands, by year) $0.50 $1.00 $1.50 $2.00 $2.50 $3.00 $3.50 $4.00 $- $10,000 $20,000 $30,000 $40,000 $50,000 $60,000 $70,000 2021 2022 2023 2024 2025 Adjusted Earnings Performance Adj. Net Income (Annualized) Adj. Net Income Adj. Diluted EPS (Annualized) 0.25% 0.45% 0.65% 0.85% 1.05% 1.25% 1.45% 1.65% 2021 2022 2023 2024 Q3 2025* Adjusted Return on Assets 50% 55% 60% 65% 70% 75% 2021 2022 2023 2024 Q3 2025* Adjusted Efficiency Ratio 2% 4% 6% 8% 10% 12% 14% 2021 2022 2023 2024 Q3 2025* Adjusted Return on Average Tangible Common Equity * Period reflects calendar year to date data See Appendix – Non-GAAP Reconciliation 20
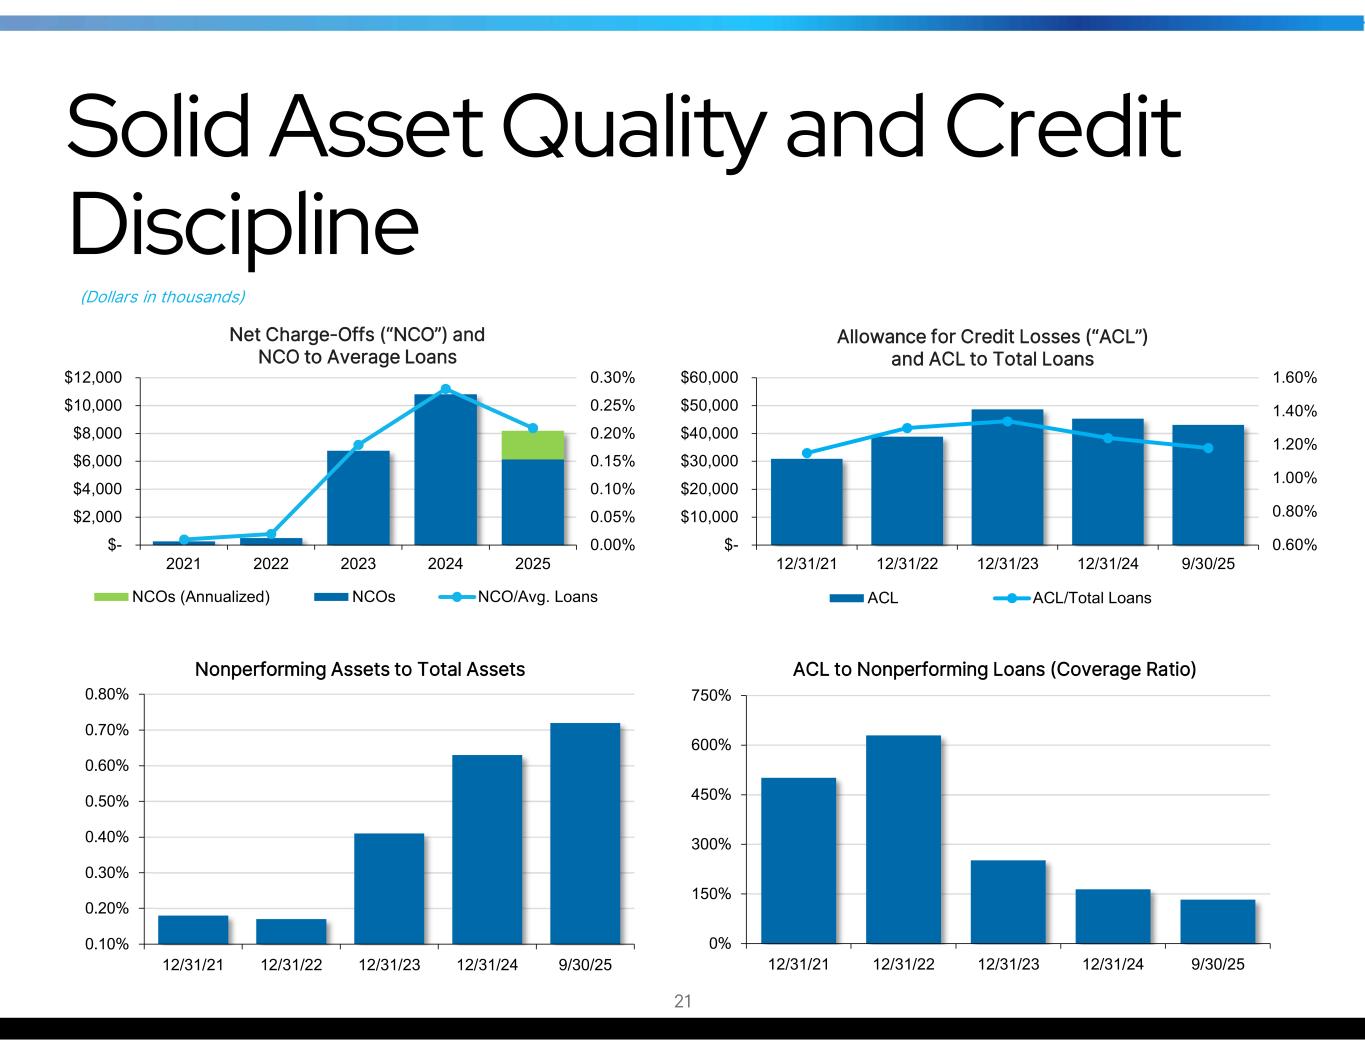
Solid Asset Quality and Credit Discipline (Dollars in thousands) 0.00% 0.05% 0.10% 0.15% 0.20% 0.25% 0.30% $- $2,000 $4,000 $6,000 $8,000 $10,000 $12,000 2021 2022 2023 2024 2025 Net Charge-Offs (“NCO”) and NCO to Average Loans NCOs (Annualized) NCOs NCO/Avg. Loans 0.10% 0.20% 0.30% 0.40% 0.50% 0.60% 0.70% 0.80% 12/31/21 12/31/22 12/31/23 12/31/24 9/30/25 Nonperforming Assets to Total Assets 0% 150% 300% 450% 600% 750% 12/31/21 12/31/22 12/31/23 12/31/24 9/30/25 ACL to Nonperforming Loans (Coverage Ratio) 21 0.60% 0.80% 1.00% 1.20% 1.40% 1.60% $- $10,000 $20,000 $30,000 $40,000 $50,000 $60,000 12/31/21 12/31/22 12/31/23 12/31/24 9/30/25 Allowance for Credit Losses (“ACL”) and ACL to Total Loans ACL ACL/Total Loans
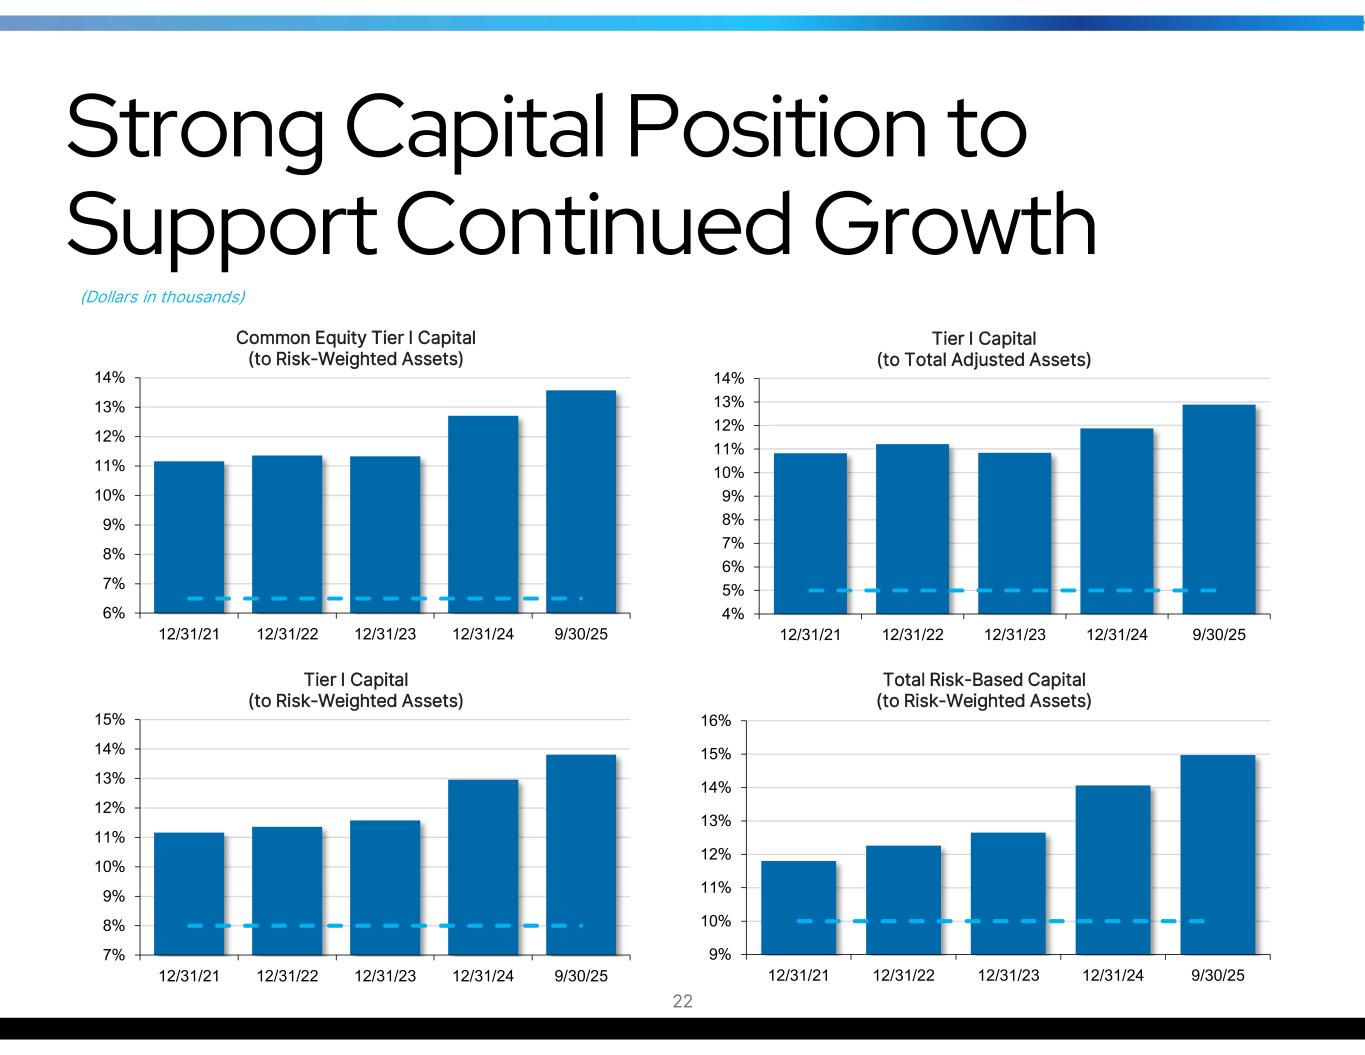
Strong Capital Position to Support Continued Growth (Dollars in thousands) 7% 8% 9% 10% 11% 12% 13% 14% 15% 12/31/21 12/31/22 12/31/23 12/31/24 9/30/25 Tier I Capital (to Risk-Weighted Assets) 9% 10% 11% 12% 13% 14% 15% 16% 12/31/21 12/31/22 12/31/23 12/31/24 9/30/25 Total Risk-Based Capital (to Risk-Weighted Assets) 6% 7% 8% 9% 10% 11% 12% 13% 14% 12/31/21 12/31/22 12/31/23 12/31/24 9/30/25 Common Equity Tier I Capital (to Risk-Weighted Assets) 4% 5% 6% 7% 8% 9% 10% 11% 12% 13% 14% 12/31/21 12/31/22 12/31/23 12/31/24 9/30/25 Tier I Capital (to Total Adjusted Assets) 22
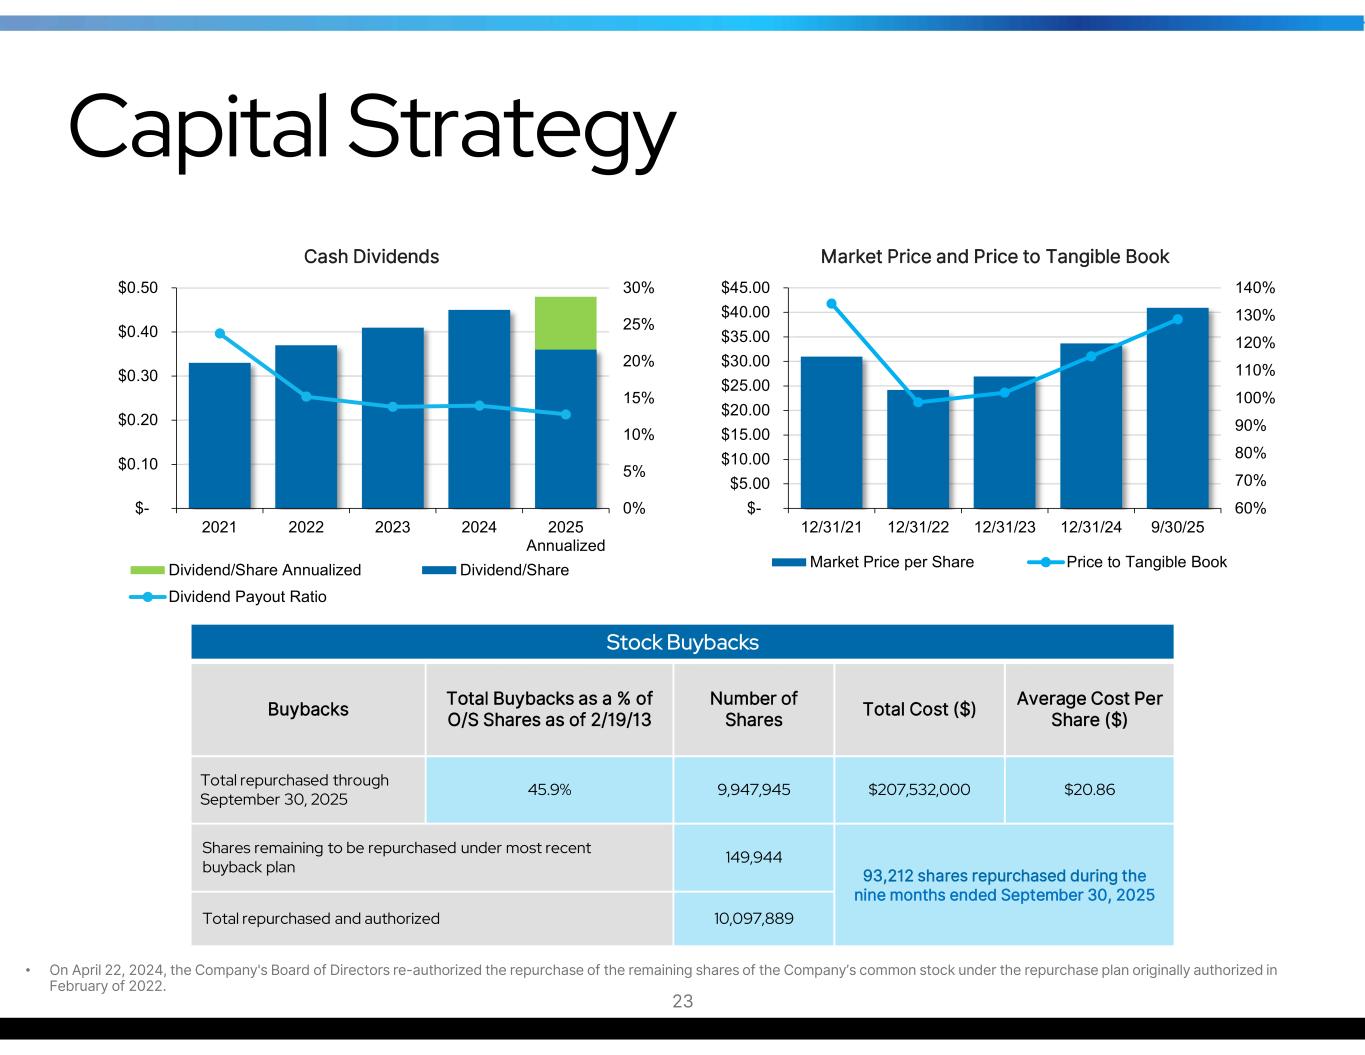
Capital Strategy 0% 5% 10% 15% 20% 25% 30% $- $0.10 $0.20 $0.30 $0.40 $0.50 2021 2022 2023 2024 2025 Annualized Cash Dividends Dividend/Share Annualized Dividend/Share Dividend Payout Ratio 60% 70% 80% 90% 100% 110% 120% 130% 140% $- $5.00 $10.00 $15.00 $20.00 $25.00 $30.00 $35.00 $40.00 $45.00 12/31/21 12/31/22 12/31/23 12/31/24 9/30/25 Market Price and Price to Tangible Book Market Price per Share Price to Tangible Book Stock Buybacks Average Cost Per Share ($)Total Cost ($) Number of Shares Total Buybacks as a % of O/S Shares as of 2/19/13Buybacks $20.86$207,532,0009,947,94545.9%Total repurchased through September 30, 2025 93,212 shares repurchased during the nine months ended September 30, 2025 149,944Shares remaining to be repurchased under most recent buyback plan 10,097,889Total repurchased and authorized • On April 22, 2024, the Company's Board of Directors re-authorized the repurchase of the remaining shares of the Company’s common stock under the repurchase plan originally authorized in February of 2022. 23
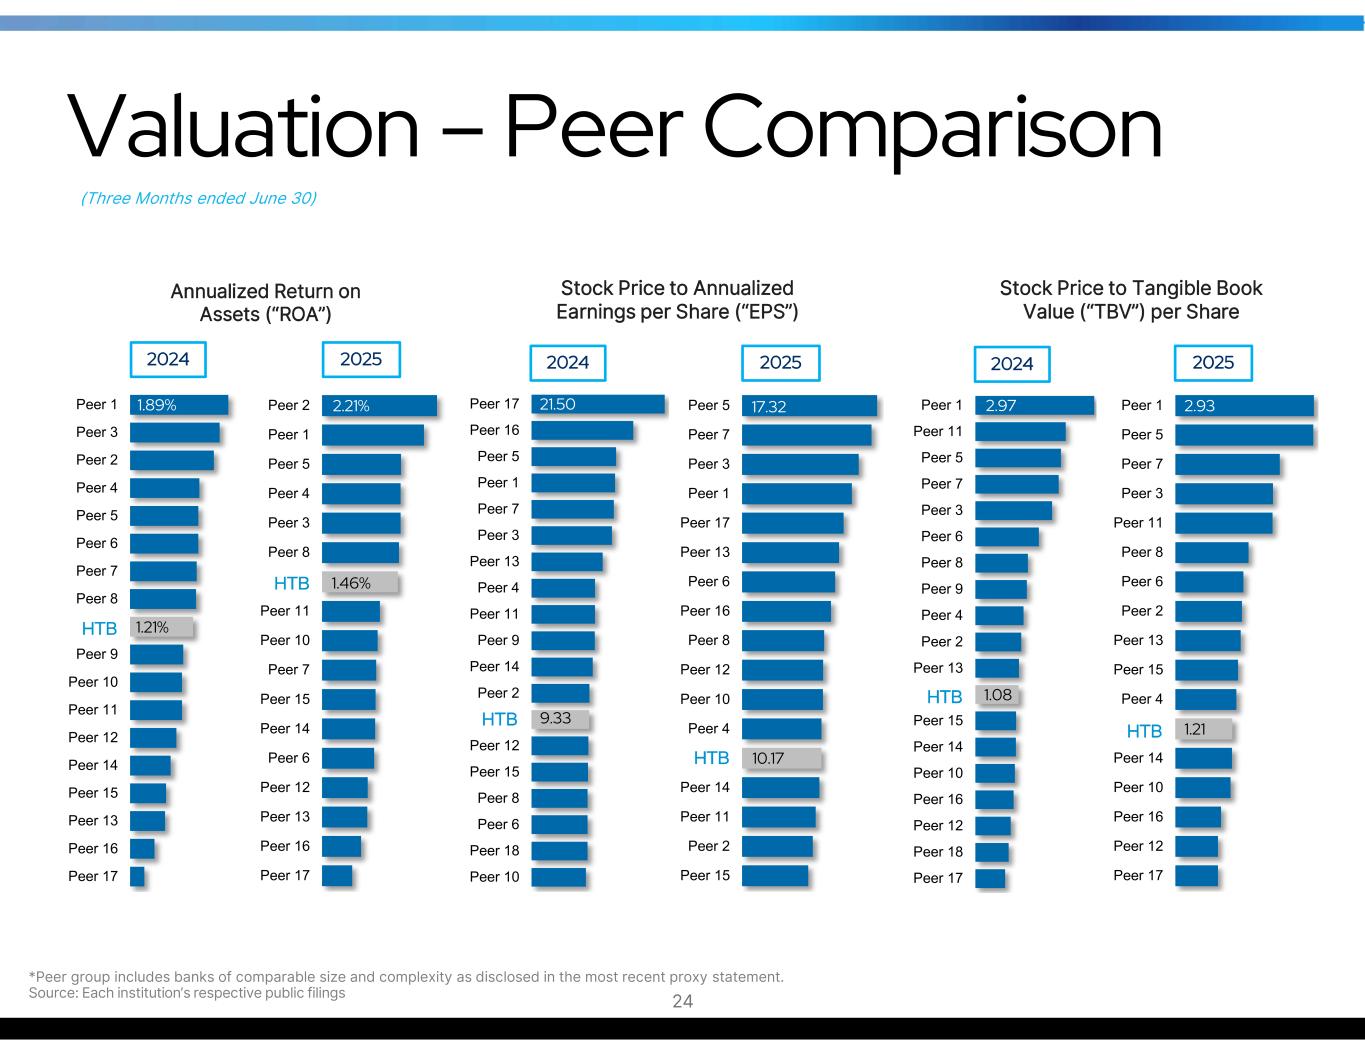
(Three Months ended June 30) Valuation – Peer Comparison *Peer group includes banks of comparable size and complexity as disclosed in the most recent proxy statement. Source: Each institution’s respective public filings 24 1.21% 1.89% Peer 17 Peer 16 Peer 13 Peer 15 Peer 14 Peer 12 Peer 11 Peer 10 Peer 9 Peer 8 Peer 7 Peer 6 Peer 5 Peer 4 Peer 2 Peer 3 Peer 1 2024 1.46% 2.21% Peer 17 Peer 16 Peer 13 Peer 12 Peer 6 Peer 14 Peer 15 Peer 7 Peer 10 Peer 11 Peer 8 Peer 3 Peer 4 Peer 5 Peer 1 Peer 2 2025 10.17 17.32 Peer 15 Peer 2 Peer 11 Peer 14 Peer 4 Peer 10 Peer 12 Peer 8 Peer 16 Peer 6 Peer 13 Peer 17 Peer 1 Peer 3 Peer 7 Peer 5 2025 9.33 21.50 Peer 10 Peer 18 Peer 6 Peer 8 Peer 15 Peer 12 Peer 2 Peer 14 Peer 9 Peer 11 Peer 4 Peer 13 Peer 3 Peer 7 Peer 1 Peer 5 Peer 16 Peer 17 2024 1.08 2.97 Peer 17 Peer 18 Peer 12 Peer 16 Peer 10 Peer 14 Peer 15 Peer 13 Peer 2 Peer 4 Peer 9 Peer 8 Peer 6 Peer 3 Peer 7 Peer 5 Peer 11 Peer 1 2024 1.21 2.93 Peer 17 Peer 12 Peer 16 Peer 10 Peer 14 Peer 4 Peer 15 Peer 13 Peer 2 Peer 6 Peer 8 Peer 11 Peer 3 Peer 7 Peer 5 Peer 1 2025 Annualized Return on Assets (“ROA”) Stock Price to Annualized Earnings per Share (“EPS”) Stock Price to Tangible Book Value (“TBV”) per Share HTB HTB HTB HTB HTB HTB
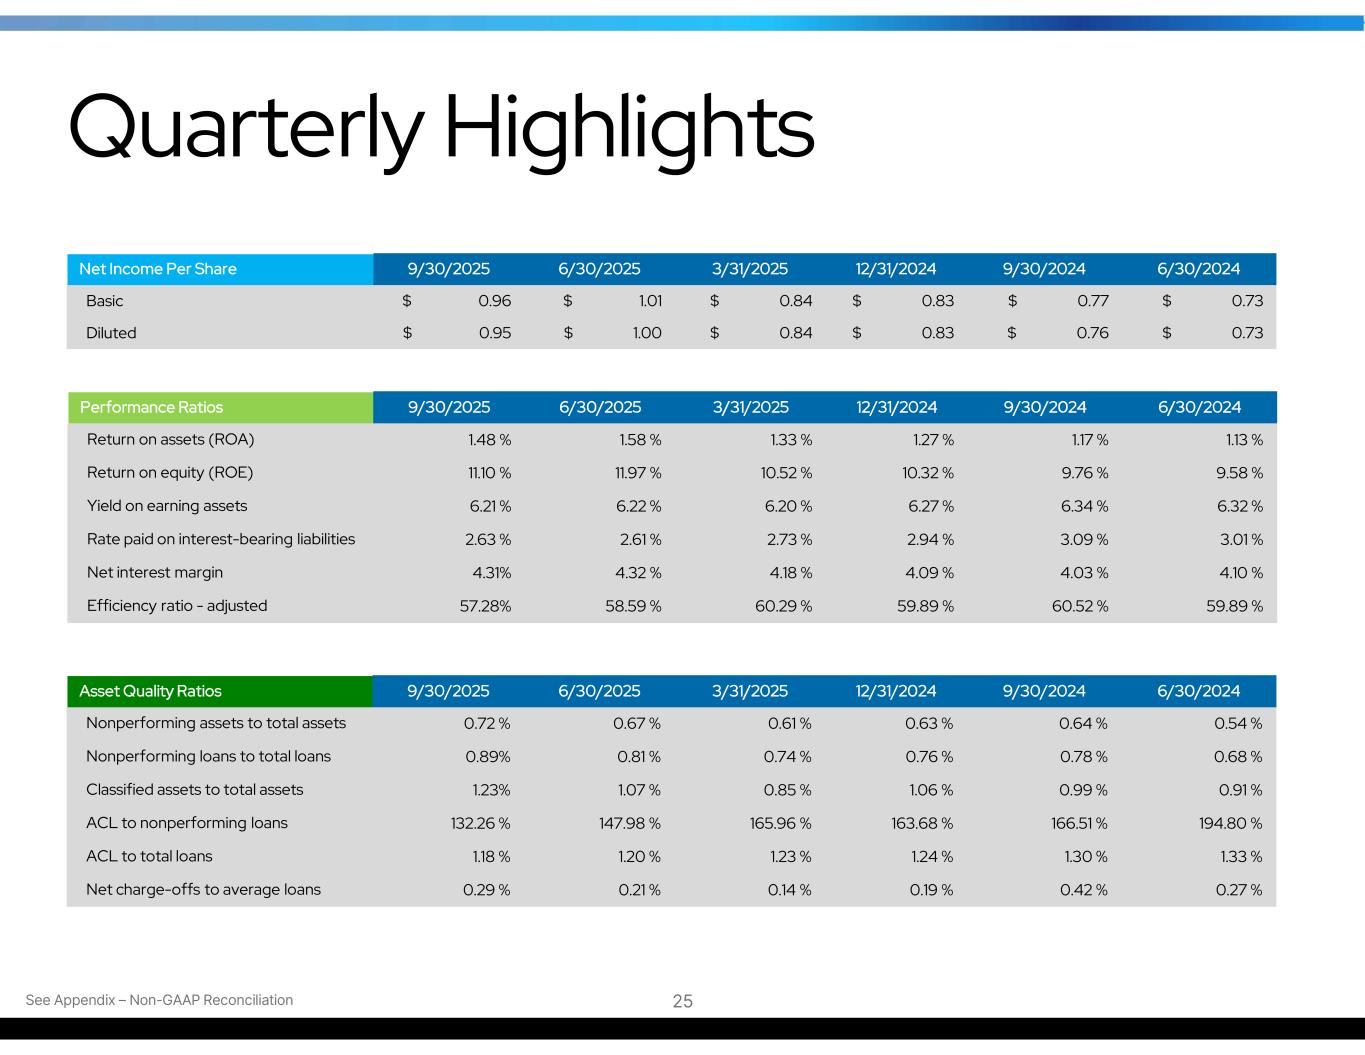
Quarterly Highlights 6/30/20249/30/202412/31/20243/31/20256/30/20259/30/2025Net Income Per Share $ 0.73$ 0.77$ 0.83$ 0.84$ 1.01$ 0.96Basic $ 0.73$ 0.76$ 0.83$ 0.84$ 1.00$ 0.95Diluted See Appendix – Non-GAAP Reconciliation 6/30/20249/30/202412/31/20243/31/20256/30/20259/30/2025Performance Ratios 1.13 %1.17 %1.27 %1.33 %1.58 %1.48 %Return on assets (ROA) 9.58 %9.76 %10.32 %10.52 %11.97 %11.10 %Return on equity (ROE) 6.32 %6.34 %6.27 %6.20 %6.22 %6.21 %Yield on earning assets 3.01 %3.09 %2.94 %2.73 %2.61 %2.63 %Rate paid on interest-bearing liabilities 4.10 %4.03 %4.09 %4.18 %4.32 %4.31%Net interest margin 59.89 %60.52 %59.89 %60.29 %58.59 %57.28%Efficiency ratio - adjusted 6/30/20249/30/202412/31/20243/31/20256/30/20259/30/2025Asset Quality Ratios 0.54 %0.64 %0.63 %0.61 %0.67 %0.72 %Nonperforming assets to total assets 0.68 %0.78 %0.76 %0.74 %0.81 %0.89%Nonperforming loans to total loans 0.91 %0.99 %1.06 %0.85 %1.07 %1.23%Classified assets to total assets 194.80 %166.51 %163.68 %165.96 %147.98 %132.26 %ACL to nonperforming loans 1.33 %1.30 %1.24 %1.23 %1.20 %1.18 %ACL to total loans 0.27 %0.42 %0.19 %0.14 %0.21 %0.29 %Net charge-offs to average loans 25
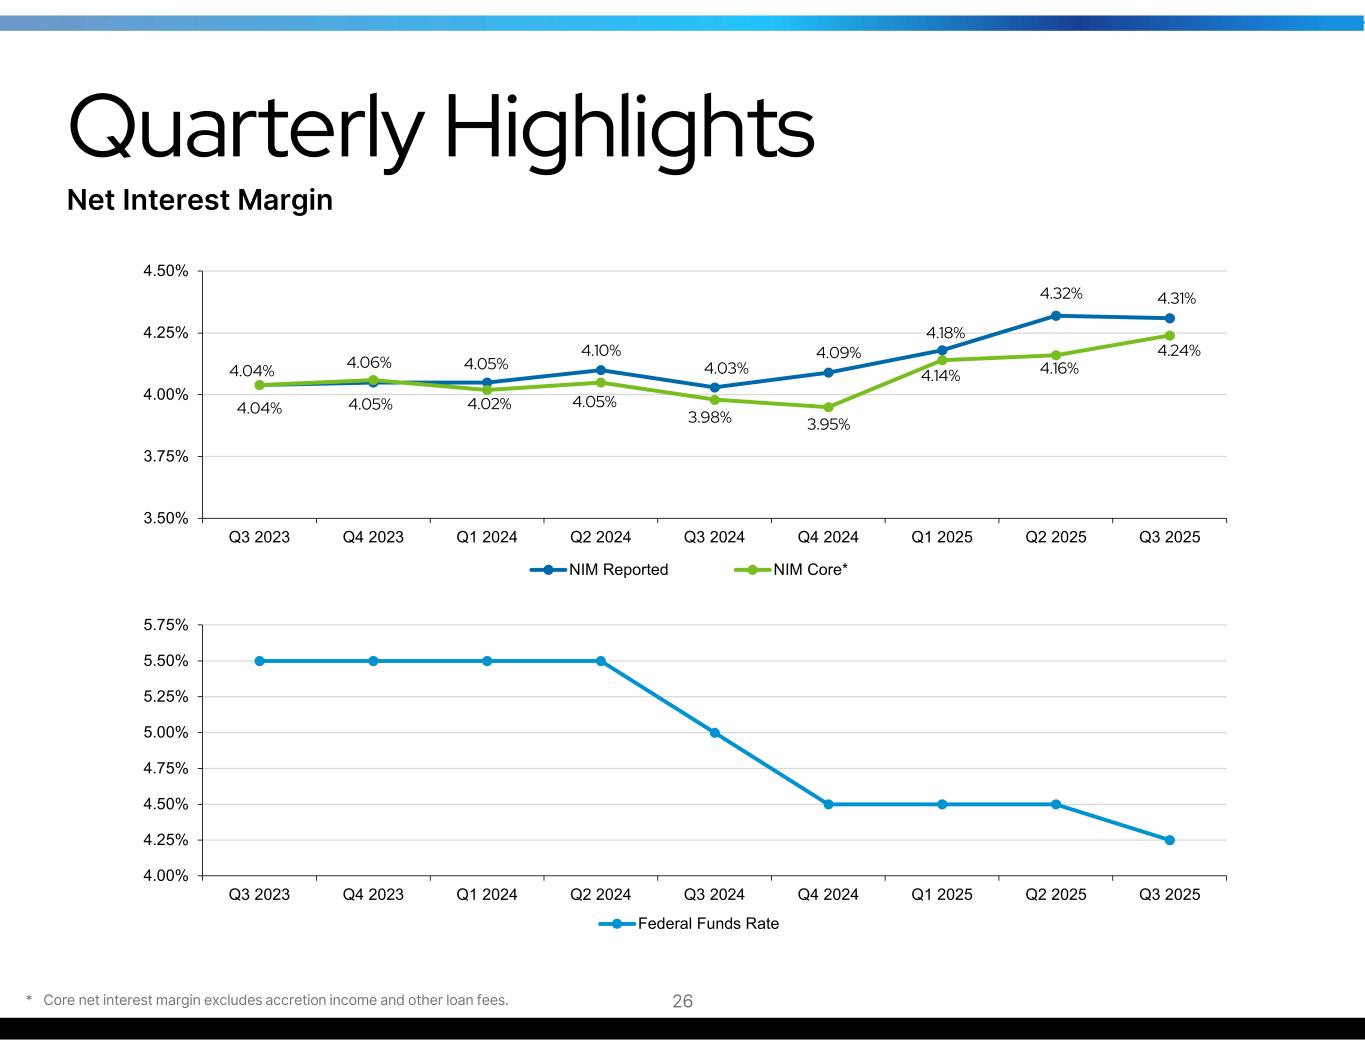
Quarterly Highlights Net Interest Margin 4.04% 4.05% 4.05% 4.10% 4.03% 4.09% 4.18% 4.32% 4.31% 4.04% 4.06% 4.02% 4.05% 3.98% 3.95% 4.14% 4.16% 4.24% 3.50% 3.75% 4.00% 4.25% 4.50% Q3 2023 Q4 2023 Q1 2024 Q2 2024 Q3 2024 Q4 2024 Q1 2025 Q2 2025 Q3 2025 NIM Reported NIM Core* 4.00% 4.25% 4.50% 4.75% 5.00% 5.25% 5.50% 5.75% Q3 2023 Q4 2023 Q1 2024 Q2 2024 Q3 2024 Q4 2024 Q1 2025 Q2 2025 Q3 2025 Federal Funds Rate * Core net interest margin excludes accretion income and other loan fees. 26
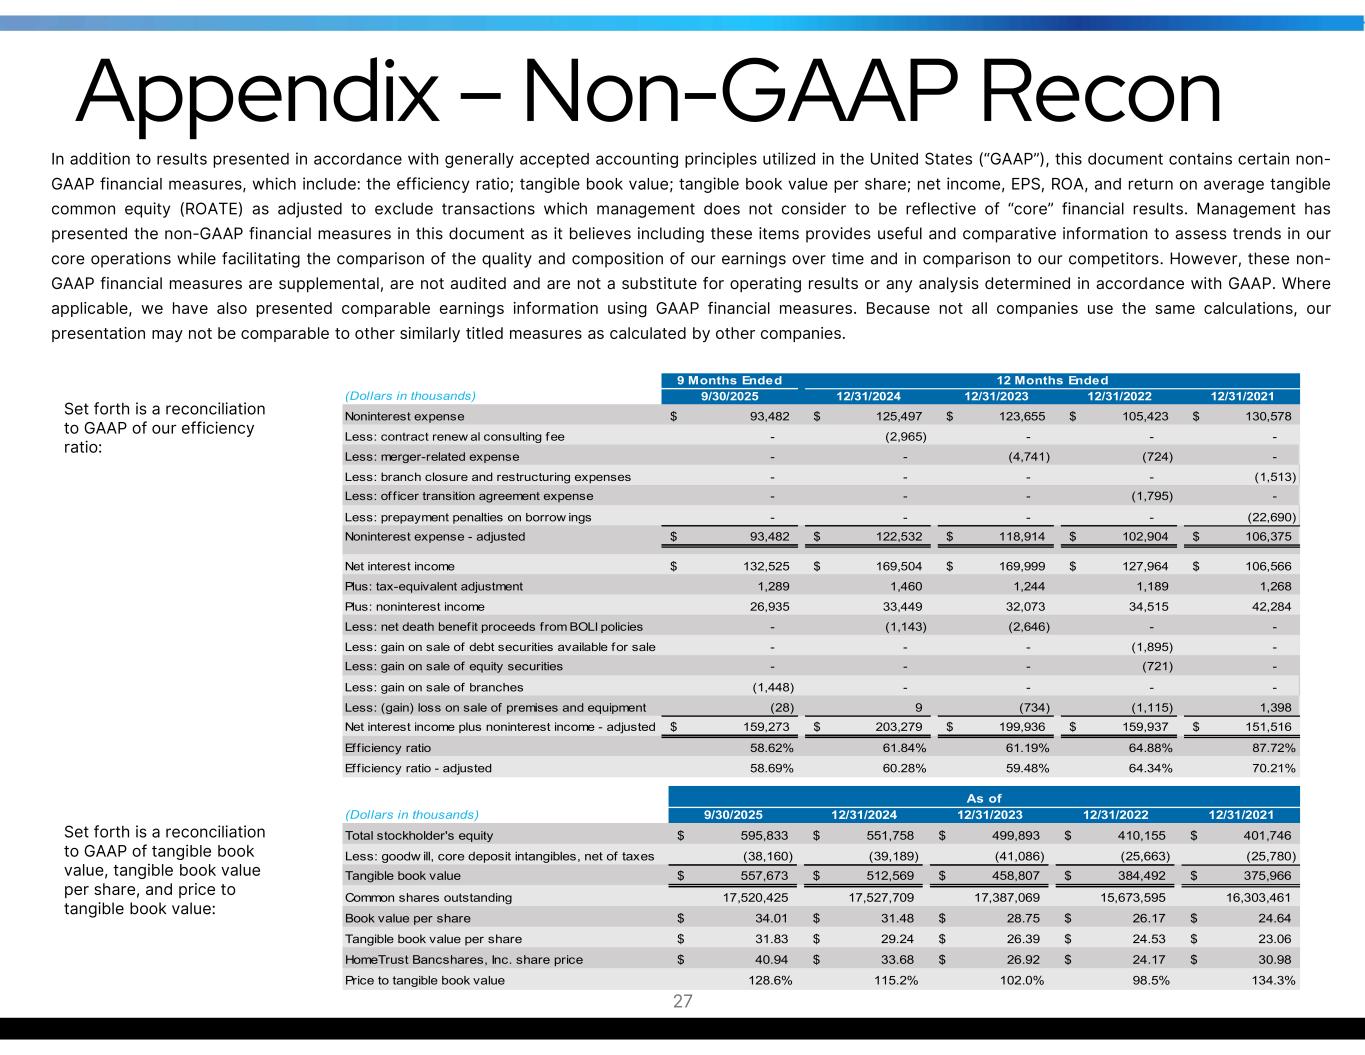
Appendix – Non-GAAP Recon In addition to results presented in accordance with generally accepted accounting principles utilized in the United States (“GAAP”), this document contains certain non- GAAP financial measures, which include: the efficiency ratio; tangible book value; tangible book value per share; net income, EPS, ROA, and return on average tangible common equity (ROATE) as adjusted to exclude transactions which management does not consider to be reflective of “core” financial results. Management has presented the non-GAAP financial measures in this document as it believes including these items provides useful and comparative information to assess trends in our core operations while facilitating the comparison of the quality and composition of our earnings over time and in comparison to our competitors. However, these non- GAAP financial measures are supplemental, are not audited and are not a substitute for operating results or any analysis determined in accordance with GAAP. Where applicable, we have also presented comparable earnings information using GAAP financial measures. Because not all companies use the same calculations, our presentation may not be comparable to other similarly titled measures as calculated by other companies. 9 Months Ended (Dollars in thousands) 9/30/2025 12/31/2024 12/31/2023 12/31/2022 12/31/2021 Noninterest expense 93,482$ 125,497$ 123,655$ 105,423$ 130,578$ Less: contract renew al consulting fee - (2,965) - - - Less: merger-related expense - - (4,741) (724) - Less: branch closure and restructuring expenses - - - - (1,513) Less: of f icer transition agreement expense - - - (1,795) - Less: prepayment penalties on borrow ings - - - - (22,690) Noninterest expense - adjusted 93,482$ 122,532$ 118,914$ 102,904$ 106,375$ Net interest income 132,525$ 169,504$ 169,999$ 127,964$ 106,566$ Plus: tax-equivalent adjustment 1,289 1,460 1,244 1,189 1,268 Plus: noninterest income 26,935 33,449 32,073 34,515 42,284 Less: net death benefit proceeds from BOLI policies - (1,143) (2,646) - - Less: gain on sale of debt securities available for sale - - - (1,895) - Less: gain on sale of equity securities - - - (721) - Less: gain on sale of branches (1,448) - - - - Less: (gain) loss on sale of premises and equipment (28) 9 (734) (1,115) 1,398 Net interest income plus noninterest income - adjusted 159,273$ 203,279$ 199,936$ 159,937$ 151,516$ Eff iciency ratio 58.62% 61.84% 61.19% 64.88% 87.72% Efficiency ratio - adjusted 58.69% 60.28% 59.48% 64.34% 70.21% 12 Months Ended (Dollars in thousands) 9/30/2025 12/31/2024 12/31/2023 12/31/2022 12/31/2021 Total stockholder's equity 595,833$ 551,758$ 499,893$ 410,155$ 401,746$ Less: goodw ill, core deposit intangibles, net of taxes (38,160) (39,189) (41,086) (25,663) (25,780) Tangible book value 557,673$ 512,569$ 458,807$ 384,492$ 375,966$ Common shares outstanding 17,520,425 17,527,709 17,387,069 15,673,595 16,303,461 Book value per share 34.01$ 31.48$ 28.75$ 26.17$ 24.64$ Tangible book value per share 31.83$ 29.24$ 26.39$ 24.53$ 23.06$ HomeTrust Bancshares, Inc. share price 40.94$ 33.68$ 26.92$ 24.17$ 30.98$ Price to tangible book value 128.6% 115.2% 102.0% 98.5% 134.3% As of Set forth is a reconciliation to GAAP of our efficiency ratio: Set forth is a reconciliation to GAAP of tangible book value, tangible book value per share, and price to tangible book value: 27
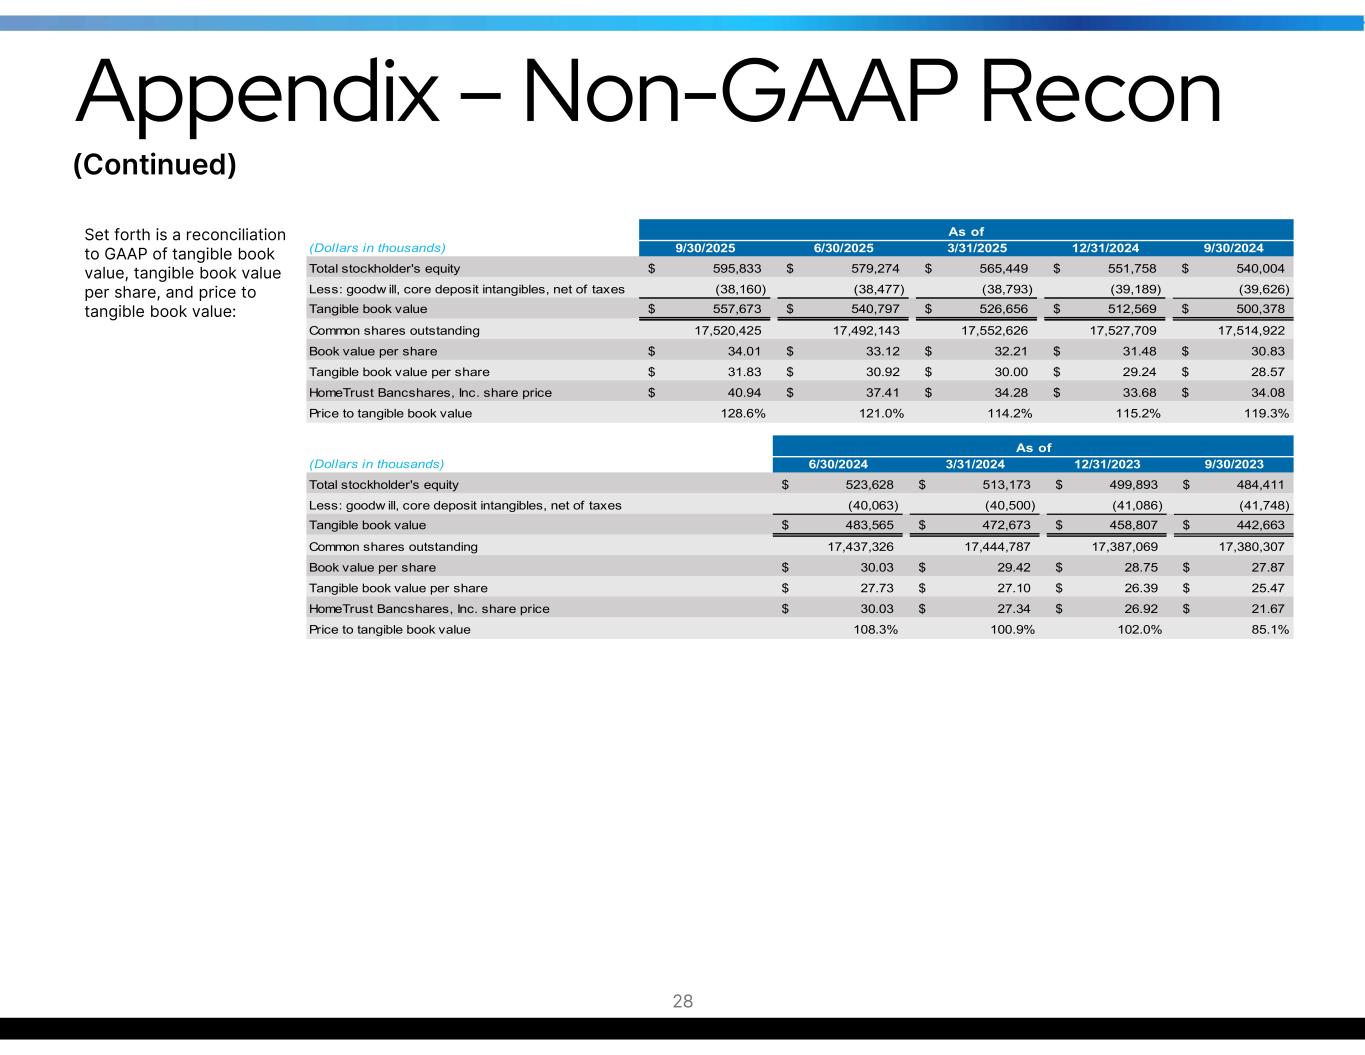
Appendix – Non-GAAP Recon Set forth is a reconciliation to GAAP of tangible book value, tangible book value per share, and price to tangible book value: (Dollars in thousands) 9/30/2025 6/30/2025 3/31/2025 12/31/2024 9/30/2024 Total stockholder's equity 595,833$ 579,274$ 565,449$ 551,758$ 540,004$ Less: goodw ill, core deposit intangibles, net of taxes (38,160) (38,477) (38,793) (39,189) (39,626) Tangible book value 557,673$ 540,797$ 526,656$ 512,569$ 500,378$ Common shares outstanding 17,520,425 17,492,143 17,552,626 17,527,709 17,514,922 Book value per share 34.01$ 33.12$ 32.21$ 31.48$ 30.83$ Tangible book value per share 31.83$ 30.92$ 30.00$ 29.24$ 28.57$ HomeTrust Bancshares, Inc. share price 40.94$ 37.41$ 34.28$ 33.68$ 34.08$ Price to tangible book value 128.6% 121.0% 114.2% 115.2% 119.3% As of (Dollars in thousands) 6/30/2024 3/31/2024 12/31/2023 9/30/2023 Total stockholder's equity 523,628$ 513,173$ 499,893$ 484,411$ Less: goodw ill, core deposit intangibles, net of taxes (40,063) (40,500) (41,086) (41,748) Tangible book value 483,565$ 472,673$ 458,807$ 442,663$ Common shares outstanding 17,437,326 17,444,787 17,387,069 17,380,307 Book value per share 30.03$ 29.42$ 28.75$ 27.87$ Tangible book value per share 27.73$ 27.10$ 26.39$ 25.47$ HomeTrust Bancshares, Inc. share price 30.03$ 27.34$ 26.92$ 21.67$ Price to tangible book value 108.3% 100.9% 102.0% 85.1% As of (Continued) 28
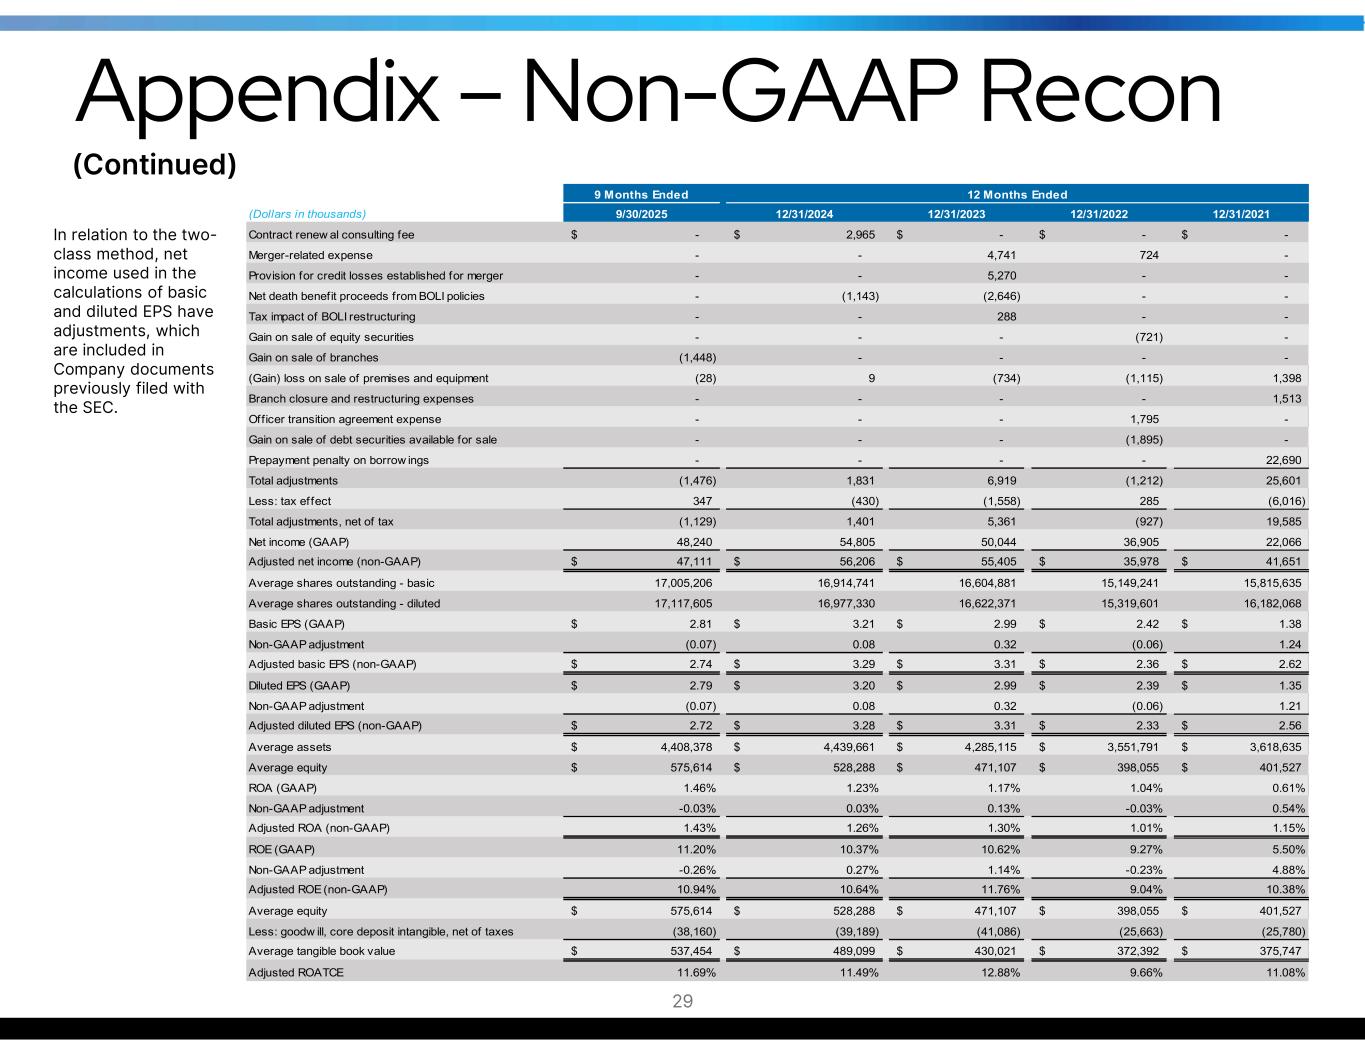
9 Months Ended (Dollars in thousands) 9/30/2025 12/31/2024 12/31/2023 12/31/2022 12/31/2021 Contract renew al consulting fee -$ 2,965$ -$ -$ -$ Merger-related expense - - 4,741 724 - Provision for credit losses established for merger - - 5,270 - - Net death benefit proceeds from BOLI policies - (1,143) (2,646) - - Tax impact of BOLI restructuring - - 288 - - Gain on sale of equity securities - - - (721) - Gain on sale of branches (1,448) - - - - (Gain) loss on sale of premises and equipment (28) 9 (734) (1,115) 1,398 Branch closure and restructuring expenses - - - - 1,513 Officer transition agreement expense - - - 1,795 - Gain on sale of debt securities available for sale - - - (1,895) - Prepayment penalty on borrow ings - - - - 22,690 Total adjustments (1,476) 1,831 6,919 (1,212) 25,601 Less: tax effect 347 (430) (1,558) 285 (6,016) Total adjustments, net of tax (1,129) 1,401 5,361 (927) 19,585 Net income (GAAP) 48,240 54,805 50,044 36,905 22,066 Adjusted net income (non-GAAP) 47,111$ 56,206$ 55,405$ 35,978$ 41,651$ Average shares outstanding - basic 17,005,206 16,914,741 16,604,881 15,149,241 15,815,635 Average shares outstanding - diluted 17,117,605 16,977,330 16,622,371 15,319,601 16,182,068 Basic EPS (GAAP) 2.81$ 3.21$ 2.99$ 2.42$ 1.38$ Non-GAAP adjustment (0.07) 0.08 0.32 (0.06) 1.24 Adjusted basic EPS (non-GAAP) 2.74$ 3.29$ 3.31$ 2.36$ 2.62$ Diluted EPS (GAAP) 2.79$ 3.20$ 2.99$ 2.39$ 1.35$ Non-GAAP adjustment (0.07) 0.08 0.32 (0.06) 1.21 Adjusted diluted EPS (non-GAAP) 2.72$ 3.28$ 3.31$ 2.33$ 2.56$ Average assets 4,408,378$ 4,439,661$ 4,285,115$ 3,551,791$ 3,618,635$ Average equity 575,614$ 528,288$ 471,107$ 398,055$ 401,527$ ROA (GAAP) 1.46% 1.23% 1.17% 1.04% 0.61% Non-GAAP adjustment -0.03% 0.03% 0.13% -0.03% 0.54% Adjusted ROA (non-GAAP) 1.43% 1.26% 1.30% 1.01% 1.15% ROE (GAAP) 11.20% 10.37% 10.62% 9.27% 5.50% Non-GAAP adjustment -0.26% 0.27% 1.14% -0.23% 4.88% Adjusted ROE (non-GAAP) 10.94% 10.64% 11.76% 9.04% 10.38% Average equity 575,614$ 528,288$ 471,107$ 398,055$ 401,527$ Less: goodw ill, core deposit intangible, net of taxes (38,160) (39,189) (41,086) (25,663) (25,780) Average tangible book value 537,454$ 489,099$ 430,021$ 372,392$ 375,747$ Adjusted ROATCE 11.69% 11.49% 12.88% 9.66% 11.08% 12 Months Ended Appendix – Non-GAAP Recon In relation to the two- class method, net income used in the calculations of basic and diluted EPS have adjustments, which are included in Company documents previously filed with the SEC. (Continued) 29
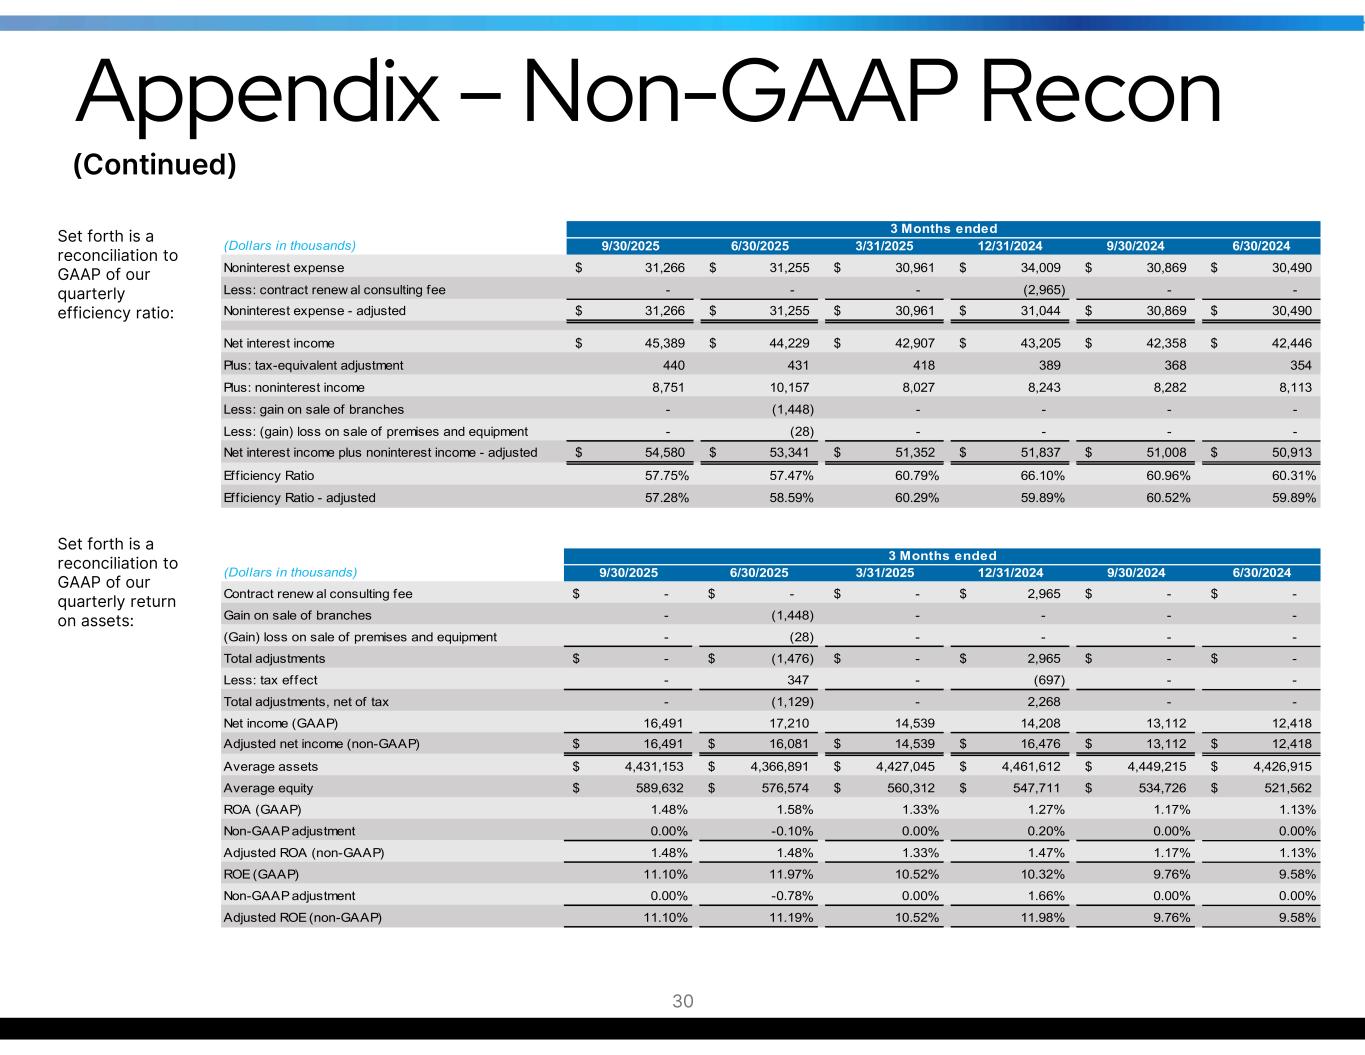
(Dollars in thousands) 9/30/2025 6/30/2025 3/31/2025 12/31/2024 9/30/2024 6/30/2024 Noninterest expense 31,266$ 31,255$ 30,961$ 34,009$ 30,869$ 30,490$ Less: contract renew al consulting fee - - - (2,965) - - Noninterest expense - adjusted 31,266$ 31,255$ 30,961$ 31,044$ 30,869$ 30,490$ Net interest income 45,389$ 44,229$ 42,907$ 43,205$ 42,358$ 42,446$ Plus: tax-equivalent adjustment 440 431 418 389 368 354 Plus: noninterest income 8,751 10,157 8,027 8,243 8,282 8,113 Less: gain on sale of branches - (1,448) - - - - Less: (gain) loss on sale of premises and equipment - (28) - - - - Net interest income plus noninterest income - adjusted 54,580$ 53,341$ 51,352$ 51,837$ 51,008$ 50,913$ Eff iciency Ratio 57.75% 57.47% 60.79% 66.10% 60.96% 60.31% Efficiency Ratio - adjusted 57.28% 58.59% 60.29% 59.89% 60.52% 59.89% 3 Months ended Appendix – Non-GAAP Recon Set forth is a reconciliation to GAAP of our quarterly return on assets: (Dollars in thousands) 9/30/2025 6/30/2025 3/31/2025 12/31/2024 9/30/2024 6/30/2024 Contract renew al consulting fee -$ -$ -$ 2,965$ -$ -$ Gain on sale of branches - (1,448) - - - - (Gain) loss on sale of premises and equipment - (28) - - - - Total adjustments -$ (1,476)$ -$ 2,965$ -$ -$ Less: tax effect - 347 - (697) - - Total adjustments, net of tax - (1,129) - 2,268 - - Net income (GAAP) 16,491 17,210 14,539 14,208 13,112 12,418 Adjusted net income (non-GAAP) 16,491$ 16,081$ 14,539$ 16,476$ 13,112$ 12,418$ Average assets 4,431,153$ 4,366,891$ 4,427,045$ 4,461,612$ 4,449,215$ 4,426,915$ Average equity 589,632$ 576,574$ 560,312$ 547,711$ 534,726$ 521,562$ ROA (GAAP) 1.48% 1.58% 1.33% 1.27% 1.17% 1.13% Non-GAAP adjustment 0.00% -0.10% 0.00% 0.20% 0.00% 0.00% Adjusted ROA (non-GAAP) 1.48% 1.48% 1.33% 1.47% 1.17% 1.13% ROE (GAAP) 11.10% 11.97% 10.52% 10.32% 9.76% 9.58% Non-GAAP adjustment 0.00% -0.78% 0.00% 1.66% 0.00% 0.00% Adjusted ROE (non-GAAP) 11.10% 11.19% 10.52% 11.98% 9.76% 9.58% 3 Months ended Set forth is a reconciliation to GAAP of our quarterly efficiency ratio: (Continued) 30
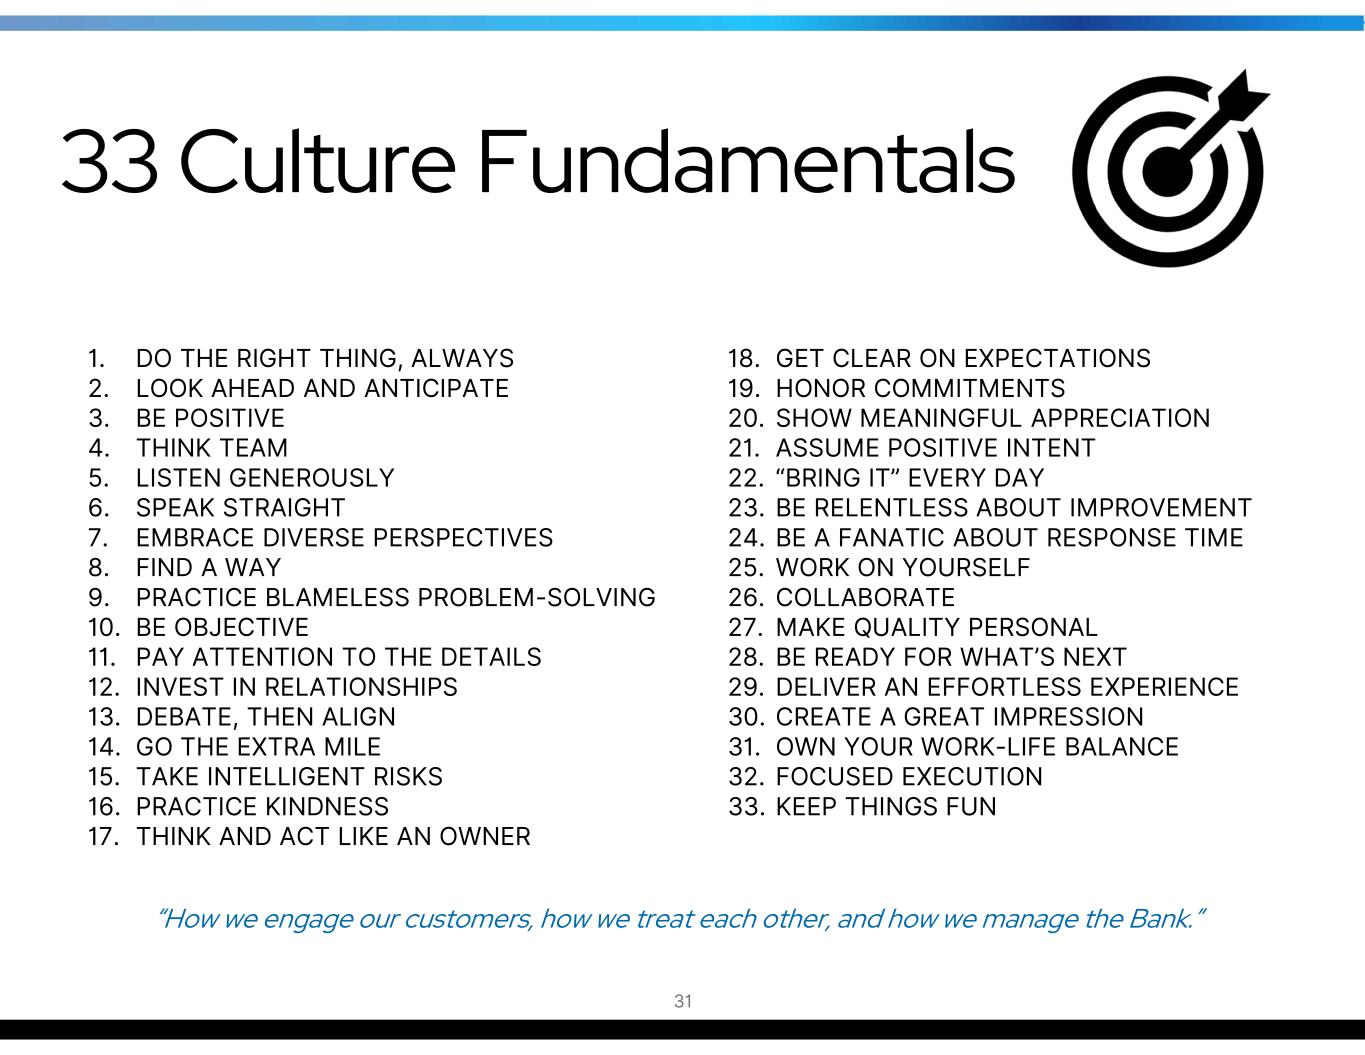
33 Culture Fundamentals 31 1. DO THE RIGHT THING, ALWAYS 2. LOOK AHEAD AND ANTICIPATE 3. BE POSITIVE 4. THINK TEAM 5. LISTEN GENEROUSLY 6. SPEAK STRAIGHT 7. EMBRACE DIVERSE PERSPECTIVES 8. FIND A WAY 9. PRACTICE BLAMELESS PROBLEM-SOLVING 10. BE OBJECTIVE 11. PAY ATTENTION TO THE DETAILS 12. INVEST IN RELATIONSHIPS 13. DEBATE, THEN ALIGN 14. GO THE EXTRA MILE 15. TAKE INTELLIGENT RISKS 16. PRACTICE KINDNESS 17. THINK AND ACT LIKE AN OWNER 18. GET CLEAR ON EXPECTATIONS 19. HONOR COMMITMENTS 20. SHOW MEANINGFUL APPRECIATION 21. ASSUME POSITIVE INTENT 22. “BRING IT” EVERY DAY 23. BE RELENTLESS ABOUT IMPROVEMENT 24. BE A FANATIC ABOUT RESPONSE TIME 25. WORK ON YOURSELF 26. COLLABORATE 27. MAKE QUALITY PERSONAL 28. BE READY FOR WHAT’S NEXT 29. DELIVER AN EFFORTLESS EXPERIENCE 30. CREATE A GREAT IMPRESSION 31. OWN YOUR WORK-LIFE BALANCE 32. FOCUSED EXECUTION 33. KEEP THINGS FUN “How we engage our customers, how we treat each other, and how we manage the Bank.”
Hunter Westbrook President and Chief Executive Officer hunter.westbrook@htb.com Tony VunCannon EVP / Chief Financial Officer Corporate Secretary / Treasurer tony.vuncannon@htb.com 10 Woodfin Street Asheville, NC 28801 (828) 259-3939 www.htb.com 32