Pay vs Performance Disclosure - USD ($)
|
12 Months Ended |
Jun. 30, 2025 |
Jun. 30, 2024 |
Jun. 30, 2023 |
Jun. 30, 2022 |
Jun. 30, 2021 |
| Pay vs Performance Disclosure |
|
|
|
|
|
| Pay vs Performance Disclosure, Table |
| | | | | | | | | | | | | | | | | | | | | | | | | | | | | | | | | | | | | | | | | | | | | | | | | Fiscal Year | | Summary Compensation Table Total for PEO (1) | Compensation Actually Paid to PEO (1)(2) | Average Summary Compensation Table Total for non-PEO NEOs (1) | Average Compensation Actually Paid to non-PEO NEOs (1)(2) | | VALUE OF INITIAL FIXED $100 INVESTMENT BASED ON: | | Net Income
($ millions) | | Adjusted Operating Income (4) ($ millions) | | | | | | | | | | | | | | Total Shareholder Return | | Peer Group Total Shareholder Return (3) | | | | | | ($) | ($) | ($) | ($) | | ($) | | ($) | | ($) | | ($) | | | (a) | | (b) | (c) | (d) | (e) | | (f) | | (g) | | (h) | | (i) | | | | | | | | | | | | | | | | | | | 2025 | | 5,378,360 | | 4,160,095 | | 1,666,400 | | 1,324,998 | | | 122.70 | | | 114.90 | | | 167.3 | | | 229.2 | | | | 2024 | | 5,415,614 | | 5,730,426 | | 1,547,110 | | 1,586,292 | | | 131.44 | | | 119.09 | | | 158.6 | | | 214.2 | | | | 2023 | | 5,029,587 | | 10,313,627 | | 1,330,339 | | 1,877,397 | | | 137.12 | | | 133.00 | | | 111.3 | | | 196.3 | | | | 2022 | | 3,744,293 | | (244,743) | | 1,091,836 | | 420,274 | | | 86.28 | | | 124.61 | | | 89.6 | | | 177.6 | | | | 2021 | | 4,340,852 | | 7,014,829 | | 1,259,552 | | 1,660,088 | | | 126.90 | | | 117.24 | | | 142.3 | | | 219.2 | | |
|
|
|
|
|
| Company Selected Measure Name |
Adjusted Operating Income
|
|
|
|
|
| Named Executive Officers, Footnote |
Mr. Ciesinski served as our principal executive officer (“PEO”) for the full fiscal year in 2025, 2024, 2023 2022 and 2021. Our non-PEO NEOs included: (a) for fiscal year 2025, Messrs. Pigott, Stealey and Viso along with Mses. Berman and Bird; (b) for fiscal year 2024, Messrs. Pigott, Stealey and Viso and Ms. Bird; (c) for fiscal year 2023, Messrs. Pigott, Stealey, Nagle and Viso and Ms. Bird; (d) for fiscal year 2022, Messrs. Pigott, Stealey and Nagle and Ms. Bird and (e) for fiscal year 2021, Messrs. Pigott, Stealey and Nagle and Ms. Bird.
|
|
|
|
|
| Peer Group Issuers, Footnote |
The Peer Group for which Total Shareholder Return is provided in column (g) is the S&P Composite 1500 Packaged Foods & Meats Index. The measurement period for this Total Shareholder Return calculation is the last trading date before the first fiscal year in the table through the end of the last fiscal year covered by the table.
|
|
|
|
|
| PEO Total Compensation Amount |
$ 5,378,360
|
$ 5,415,614
|
$ 5,029,587
|
$ 3,744,293
|
$ 4,340,852
|
| PEO Actually Paid Compensation Amount |
$ 4,160,095
|
5,730,426
|
10,313,627
|
(244,743)
|
7,014,829
|
| Adjustment To PEO Compensation, Footnote |
PEO SCT Total to CAP Reconciliation | | | | | | | | | | | | | | | | | | | | | | | | | | | | | | | | | | | | | | | | Fiscal Year | | 2025 | | 2024 | | 2023 | | 2022 | | 2021 | | | | ($) | | ($) | | ($) | | ($) | | ($) | | | | | | | | | | | | | | | | SCT total | | 5,378,360 | | | 5,415,614 | | | 5,029,587 | | | 3,744,293 | | | 4,340,852 | | | | - Grant date fair value of stock awards granted in fiscal year | | (3,000,112) | | | (2,850,173) | | | (2,599,848) | | | (2,299,929) | | | (2,199,997) | | | | + Fair value at fiscal year-end of outstanding and unvested stock awards granted in fiscal year | | 2,700,067 | | | 3,021,703 | | | 3,795,836 | | | 1,284,332 | | | 2,608,085 | | | | ± Change in fair value of outstanding and unvested stock awards granted in prior fiscal years | | (1,159,500) | | | 80,059 | | | 2,470,478 | | | (2,070,931) | | | 1,551,862 | | | | ± Fair value at vesting of stock awards granted in fiscal year that vested during fiscal year | | — | | | — | | | — | | | — | | | — | | | | ± Change in fair value as of vesting date of stock awards granted in prior fiscal years for which applicable vesting conditions were satisfied during fiscal year | | 130,844 | | | (43,643) | | | 1,553,892 | | | (922,243) | | | 714,027 | | | | - Fair value as of prior fiscal year-end of stock awards granted in prior fiscal years that failed to meet applicable vesting conditions during fiscal year | | — | | | — | | | — | | | — | | | — | | | | + Dividends or other earnings paid on stock awards in the fiscal year prior to the vesting date that are not otherwise included in the total compensation for the fiscal year | | 110,436 | | | 106,866 | | | 63,682 | | | 19,735 | | | — | | | | Compensation Actually Paid | | 4,160,095 | | | 5,730,426 | | | 10,313,627 | | | (244,743) | | | 7,014,829 | | |
|
|
|
|
|
| Non-PEO NEO Average Total Compensation Amount |
$ 1,666,400
|
1,547,110
|
1,330,339
|
1,091,836
|
1,259,552
|
| Non-PEO NEO Average Compensation Actually Paid Amount |
$ 1,324,998
|
1,586,292
|
1,877,397
|
420,274
|
1,660,088
|
| Adjustment to Non-PEO NEO Compensation Footnote |
Non-PEO NEO Average SCT Total to Average CAP Reconciliation | | | | | | | | | | | | | | | | | | | | | | | | | | | | | | | | | | | | | | | | Fiscal Year | | 2025 | | 2024 | | 2023 | | 2022 | | 2021 | | | | ($) | | ($) | | ($) | | ($) | | ($) | | | | | | | | | | | | | | | | SCT Total | | 1,666,400 | | | 1,547,110 | | | 1,330,339 | | | 1,091,836 | | | 1,259,552 | | | | - Grant date fair value of stock awards granted in fiscal year | | (549,936) | | | (477,488) | | | (395,995) | | | (404,890) | | | (337,499) | | | | + Fair value at fiscal year-end of outstanding and unvested stock awards granted in fiscal year | | 418,061 | | | 506,223 | | | 454,662 | | | 226,099 | | | 400,100 | | | | ± Change in fair value of outstanding and unvested stock awards granted in prior fiscal years | | (108,570) | | | 437 | | | 267,012 | | | (338,416) | | | 261,691 | | | | ± Fair value at vesting of stock awards granted in fiscal year that vested during fiscal year | | — | | | — | | | — | | | — | | | — | | | | ± Change in fair value as of vesting date of stock awards granted in prior fiscal years for which applicable vesting conditions were satisfied during fiscal year | | (11,133) | | | (5,209) | | | 230,943 | | | (157,829) | | | 76,244 | | | | - Fair value as of prior fiscal year-end of stock awards granted in prior fiscal years that failed to meet applicable vesting conditions during fiscal year | | (98,429) | | | — | | | (16,254) | | | — | | | — | | | | + Dividends or other earnings paid on stock awards in the fiscal year prior to the vesting date that are not otherwise included in the total compensation for the fiscal year | | 8,605 | | | 15,219 | | | 6,690 | | | 3,474 | | | — | | | | Average Compensation Actually Paid | | 1,324,998 | | | 1,586,292 | | | 1,877,397 | | | 420,274 | | | 1,660,088 | | |
|
|
|
|
|
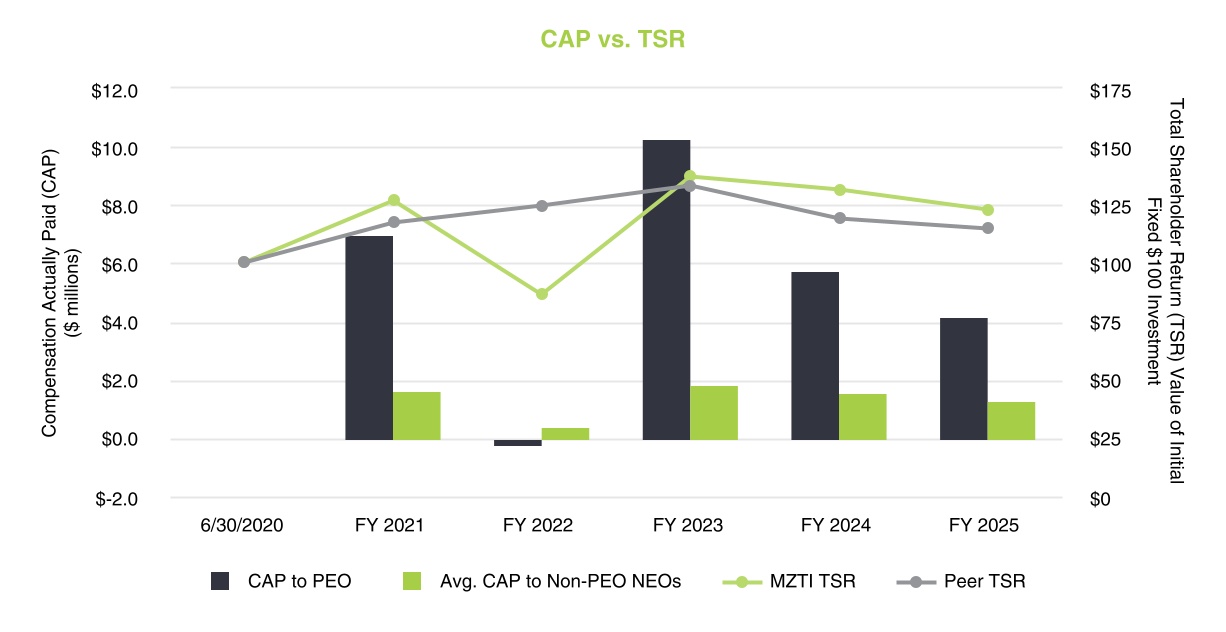
| Compensation Actually Paid vs. Total Shareholder Return |
The chart below illustrates the relationship between the PEO and average Non-PEO CAP amounts and the Corporation’s and Peer Group’s TSR during fiscal years 2021-2025. TSR results assume an initial $100 investment on June 30, 2020.
|
|
|
|
|
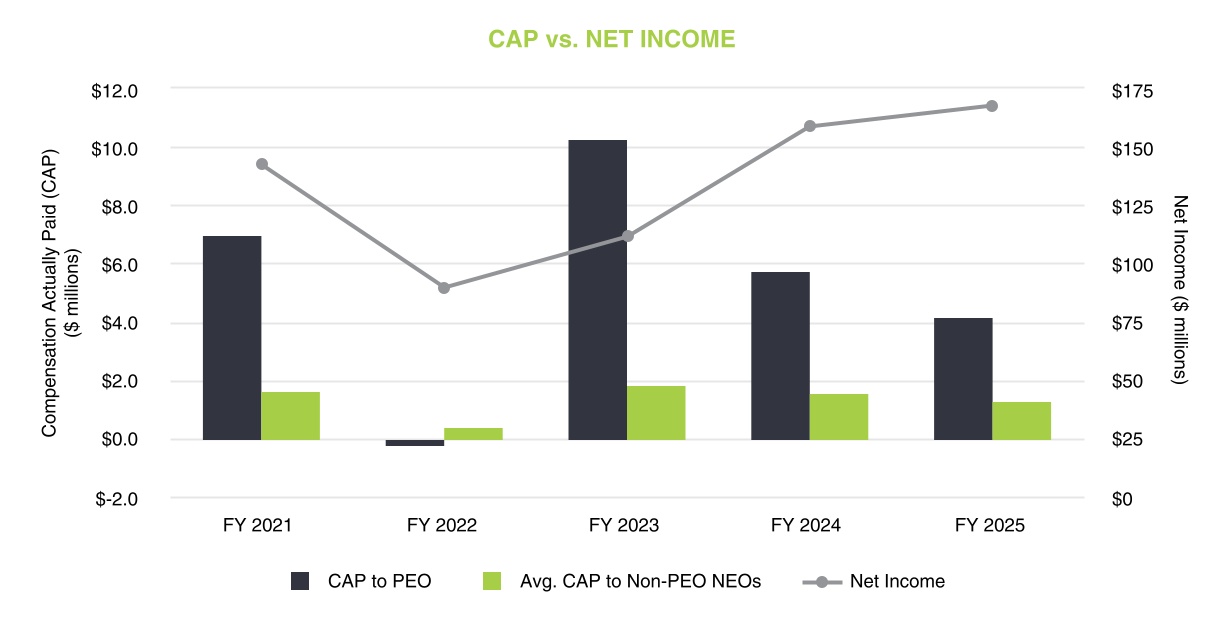
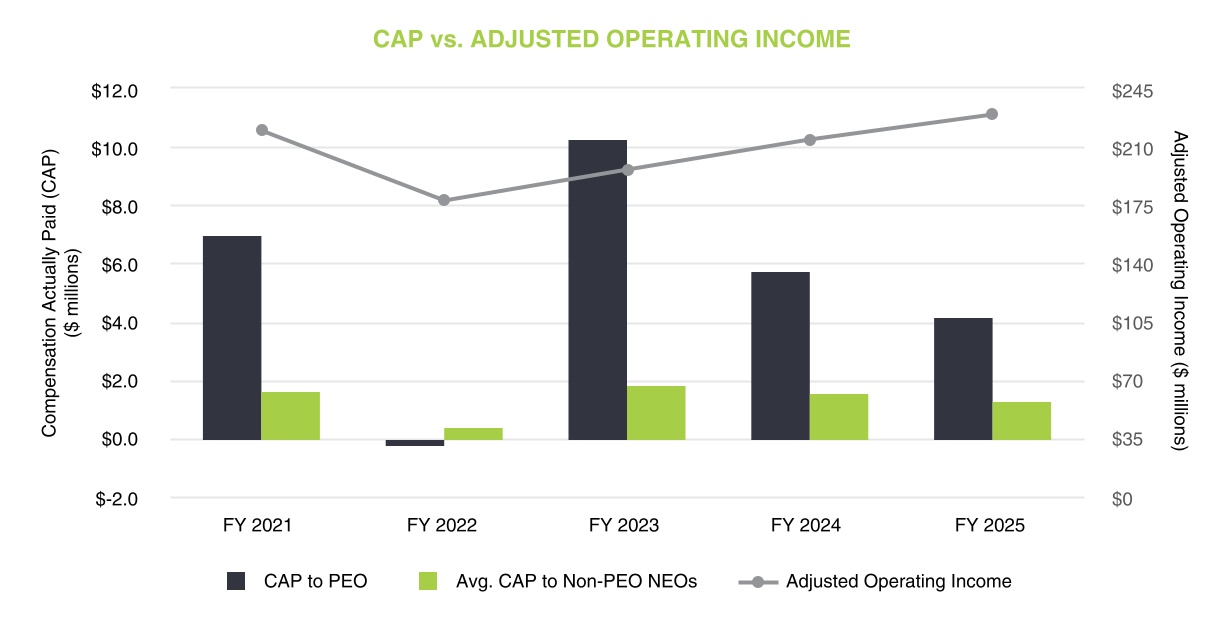
| Compensation Actually Paid vs. Net Income |
The charts below illustrate the relationship between the PEO and Non-PEO CAP amounts and the Corporation’s Net Income and Adjusted Operating Income during fiscal years 2021-2025.
|
|
|
|
|
| Compensation Actually Paid vs. Company Selected Measure |
|
|
|
|
|
| Total Shareholder Return Vs Peer Group |
The chart below illustrates the relationship between the PEO and average Non-PEO CAP amounts and the Corporation’s and Peer Group’s TSR during fiscal years 2021-2025. TSR results assume an initial $100 investment on June 30, 2020.
|
|
|
|
|
| Tabular List, Table |
| | | | Most Important Performance Measures | | •Adjusted Operating Income | •Adjusted Net Sales | •Relative TSR |
|
|
|
|
|
| Total Shareholder Return Amount |
$ 122.70
|
131.44
|
137.12
|
86.28
|
126.90
|
| Peer Group Total Shareholder Return Amount |
114.90
|
119.09
|
133.00
|
124.61
|
117.24
|
| Net Income (Loss) |
$ 167,300,000
|
$ 158,600,000
|
$ 111,300,000
|
$ 89,600,000
|
$ 142,300,000
|
| Company Selected Measure Amount |
229,200,000
|
214,200,000
|
196,300,000
|
177,600,000
|
219,200,000
|
| PEO Name |
Mr. Ciesinski
|
|
|
|
|
| Additional 402(v) Disclosure |
Amounts reported in these columns represent the compensation actually paid (“CAP”) after the applicable adjustments were made to the amounts reported in the Summary Compensation Table (“SCT”) for the applicable year. The applicable adjustments shown in the reconciliation tables below were deducted from / added to Summary Compensation Table total compensation in accordance with the SEC-mandated adjustments to calculate CAP to our PEO and average CAP to our non-PEO NEOs. The fair value of equity awards was determined using methodologies and assumptions developed in a manner substantively consistent with those used to determine the grant date fair value of such awards. No pension adjustments were made because we do not provide defined benefit pension arrangements for our NEOs.
|
|
|
|
|
| Measure:: 1 |
|
|
|
|
|
| Pay vs Performance Disclosure |
|
|
|
|
|
| Name |
•Adjusted Operating Income
|
|
|
|
|
| Non-GAAP Measure Description |
Adjusted Operating Income is a Non-GAAP financial measure defined as operating income as reported under U.S. GAAP, adjusted to exclude the following unusual costs not associated with the results of operations: (a) for fiscal year 2025, restructuring and impairment charges and acquisition SG&A expenses; (b) for fiscal year 2024, restructuring and impairment charges; (c) for fiscal year 2023, impairment charges and Project Ascent expenses; (d) for fiscal year 2022, changes in contingent consideration, restructuring and impairment charges, Project Ascent expenses and the impact of our ERP go-live which resulted in “pull-forward” sales from fiscal 2023 to fiscal 2022; and (e) for fiscal year 2021, changes in contingent consideration, impairment charges and Project Ascent expenses. These amounts can be found in our Annual Reports on Form 10-K.
|
|
|
|
|
| Measure:: 2 |
|
|
|
|
|
| Pay vs Performance Disclosure |
|
|
|
|
|
| Name |
•Adjusted Net Sales
|
|
|
|
|
| Measure:: 3 |
|
|
|
|
|
| Pay vs Performance Disclosure |
|
|
|
|
|
| Name |
•Relative TSR
|
|
|
|
|
| PEO | Aggregate Grant Date Fair Value of Equity Award Amounts Reported in Summary Compensation Table |
|
|
|
|
|
| Pay vs Performance Disclosure |
|
|
|
|
|
| Adjustment to Compensation, Amount |
$ (3,000,112)
|
$ (2,850,173)
|
$ (2,599,848)
|
$ (2,299,929)
|
$ (2,199,997)
|
| PEO | Year-end Fair Value of Equity Awards Granted in Covered Year that are Outstanding and Unvested |
|
|
|
|
|
| Pay vs Performance Disclosure |
|
|
|
|
|
| Adjustment to Compensation, Amount |
2,700,067
|
3,021,703
|
3,795,836
|
1,284,332
|
2,608,085
|
| PEO | Year-over-Year Change in Fair Value of Equity Awards Granted in Prior Years That are Outstanding and Unvested |
|
|
|
|
|
| Pay vs Performance Disclosure |
|
|
|
|
|
| Adjustment to Compensation, Amount |
(1,159,500)
|
80,059
|
2,470,478
|
(2,070,931)
|
1,551,862
|
| PEO | Vesting Date Fair Value of Equity Awards Granted and Vested in Covered Year |
|
|
|
|
|
| Pay vs Performance Disclosure |
|
|
|
|
|
| Adjustment to Compensation, Amount |
0
|
0
|
0
|
0
|
0
|
| PEO | Change in Fair Value as of Vesting Date of Prior Year Equity Awards Vested in Covered Year |
|
|
|
|
|
| Pay vs Performance Disclosure |
|
|
|
|
|
| Adjustment to Compensation, Amount |
130,844
|
(43,643)
|
1,553,892
|
(922,243)
|
714,027
|
| PEO | Prior Year End Fair Value of Equity Awards Granted in Any Prior Year that Fail to Meet Applicable Vesting Conditions During Covered Year |
|
|
|
|
|
| Pay vs Performance Disclosure |
|
|
|
|
|
| Adjustment to Compensation, Amount |
0
|
0
|
0
|
0
|
0
|
| PEO | Dividends or Other Earnings Paid on Equity Awards not Otherwise Reflected in Total Compensation for Covered Year |
|
|
|
|
|
| Pay vs Performance Disclosure |
|
|
|
|
|
| Adjustment to Compensation, Amount |
110,436
|
106,866
|
63,682
|
19,735
|
0
|
| Non-PEO NEO | Aggregate Grant Date Fair Value of Equity Award Amounts Reported in Summary Compensation Table |
|
|
|
|
|
| Pay vs Performance Disclosure |
|
|
|
|
|
| Adjustment to Compensation, Amount |
(549,936)
|
(477,488)
|
(395,995)
|
(404,890)
|
(337,499)
|
| Non-PEO NEO | Year-end Fair Value of Equity Awards Granted in Covered Year that are Outstanding and Unvested |
|
|
|
|
|
| Pay vs Performance Disclosure |
|
|
|
|
|
| Adjustment to Compensation, Amount |
418,061
|
506,223
|
454,662
|
226,099
|
400,100
|
| Non-PEO NEO | Year-over-Year Change in Fair Value of Equity Awards Granted in Prior Years That are Outstanding and Unvested |
|
|
|
|
|
| Pay vs Performance Disclosure |
|
|
|
|
|
| Adjustment to Compensation, Amount |
(108,570)
|
437
|
267,012
|
(338,416)
|
261,691
|
| Non-PEO NEO | Vesting Date Fair Value of Equity Awards Granted and Vested in Covered Year |
|
|
|
|
|
| Pay vs Performance Disclosure |
|
|
|
|
|
| Adjustment to Compensation, Amount |
0
|
0
|
0
|
0
|
0
|
| Non-PEO NEO | Change in Fair Value as of Vesting Date of Prior Year Equity Awards Vested in Covered Year |
|
|
|
|
|
| Pay vs Performance Disclosure |
|
|
|
|
|
| Adjustment to Compensation, Amount |
(11,133)
|
(5,209)
|
230,943
|
(157,829)
|
76,244
|
| Non-PEO NEO | Prior Year End Fair Value of Equity Awards Granted in Any Prior Year that Fail to Meet Applicable Vesting Conditions During Covered Year |
|
|
|
|
|
| Pay vs Performance Disclosure |
|
|
|
|
|
| Adjustment to Compensation, Amount |
(98,429)
|
0
|
(16,254)
|
0
|
0
|
| Non-PEO NEO | Dividends or Other Earnings Paid on Equity Awards not Otherwise Reflected in Total Compensation for Covered Year |
|
|
|
|
|
| Pay vs Performance Disclosure |
|
|
|
|
|
| Adjustment to Compensation, Amount |
$ 8,605
|
$ 15,219
|
$ 6,690
|
$ 3,474
|
$ 0
|