Shareholder Report
|
12 Months Ended |
|
Jul. 31, 2025
USD ($)
Holding
|
|---|
| Shareholder Report [Line Items] |
|
| Document Type |
N-CSR
|
| Amendment Flag |
false
|
| Registrant Name |
Ark ETF Trust
|
| Entity Central Index Key |
0001579982
|
| Entity Investment Company Type |
N-1A
|
| Document Period End Date |
Jul. 31, 2025
|
| C000133119 |
|
| Shareholder Report [Line Items] |
|
| Fund Name |
ARK Genomic Revolution ETF
|
| Class Name |
ARK Genomic Revolution ETF
|
| Trading Symbol |
ARKG
|
| Security Exchange Name |
CboeBZX
|
| Annual or Semi-Annual Statement [Text Block] |
ANNUAL SHAREHOLDER REPORT
|
| Shareholder Report Annual or Semi-Annual |
annual shareholder report
|
| Additional Information [Text Block] |
You can find additional information about the Fund at https://www.ark-funds.com/download-fund-materials/. You can also request this information by contacting us at (727) 810-8160.
|
| Additional Information Phone Number |
(727) 810-8160
|
| Additional Information Website |
<span style="box-sizing: border-box; color: rgb(0, 0, 0); display: inline; flex-wrap: nowrap; font-size: 12px; font-weight: 400; grid-area: auto; line-height: 18px; margin: 0px; overflow: visible; text-align: left; text-align-last: auto; white-space-collapse: preserve-breaks;">https://www.ark-funds.com/download-fund-materials/</span>
|
| Expenses [Text Block] |
What were the Fund’s cost for the period? (based on a hypothetical $10,000 investment) Fund | Costs of a $10,000 investment | Costs paid as a percentage of a $10,000 investment |
|---|
ARK Genomic Revolution ETF | $71 | 0.75% |
|---|
|
| Expenses Paid, Amount |
$ 71
|
| Expense Ratio, Percent |
0.75%
|
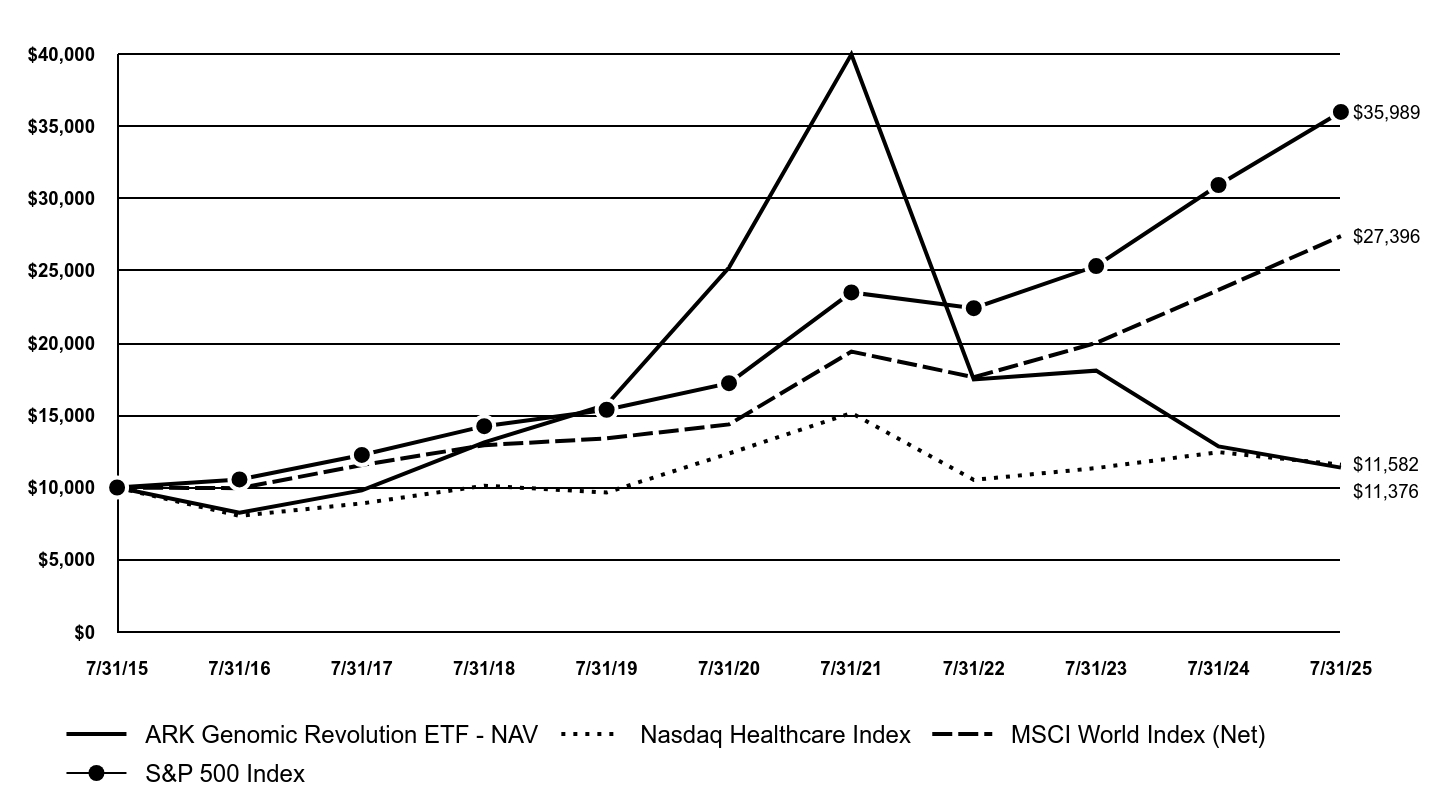
| Factors Affecting Performance [Text Block] |
Management’s Discussion of Fund PerformanceThe Fund underperformed both the S&P 500 Index and the MSCI World Index for the 12-month period ending July 31, 2025. The headwinds that once pressured disruptive technologies shifted into structural tailwinds, supported by broadening market participation, favorable policy shifts around crypto, AI, and healthcare, and potential fiscal catalysts like tax cuts. Still, many companies in the genomics space remain under pressure as they prioritize long-term growth over near-term profitability. ARK’s research suggests that a rolling recession began in the spring of 2022, when the Federal Reserve raised interest rates 22-fold in just over a year. We believe that waning pricing power is likely to force corporations into further employment cutbacks to preserve margins. Innovation often takes root in turbulent times: when consumers and businesses confront uncertainty, they are more willing to adopt better, faster, and less costly solutions. Top contributors to relative performance • The top contributor to performance during the period was Adaptive Biotechnologies Corp. (ADPT). Shares of ADPT rose during the period after strong performance in its 1Q25 earnings, marked by a 34% growth in MRD (Minimal Residual Disease) revenue, driven by an uptick in clonoSEQ test volume. The company raised its full-year MRD revenue guidance, highlighting the scalability and momentum in its MRD business, while also reducing its operating expenses and cash burn targets. • Additional contributors to performance included Tempus AI, Inc., Guardant Health, Inc., Personalis, Inc., and Accolade, Inc. Biggest detractors from relative performance • The biggest detractor from performance during the period was Twist Bioscience Corp. (TWST). Shares of TWST detracted from the Fund performance following the NIH's announcement to cut indirect costs on grants, which is expected to significantly impact research funding and spending behavior among researchers. • Additional detractors from performance included Intellia Therapeutics, Inc., Beam Therapeutics, Inc., Recursion Pharmaceuticals, Inc., and Arcturus Therapeutics Holdings, Inc. |
| Performance Past Does Not Indicate Future [Text] |
Past performance does not guarantee future results.
|
| Line Graph [Table Text Block] |
| ARK Genomic Revolution ETF - NAV | Nasdaq Healthcare Index | MSCI World Index (Net) | S&P 500 Index |
|---|
7/31/15 | $10,000 | $10,000 | $10,000 | $10,000 |
|---|
7/31/16 | $8,263 | $8,040 | $9,954 | $10,561 |
|---|
7/31/17 | $9,805 | $8,901 | $11,559 | $12,256 |
|---|
7/31/18 | $13,119 | $10,126 | $12,932 | $14,246 |
|---|
7/31/19 | $15,726 | $9,656 | $13,400 | $15,384 |
|---|
7/31/20 | $25,225 | $12,356 | $14,369 | $17,223 |
|---|
7/31/21 | $39,978 | $15,158 | $19,409 | $23,500 |
|---|
7/31/22 | $17,482 | $10,529 | $17,630 | $22,410 |
|---|
7/31/23 | $18,088 | $11,346 | $20,007 | $25,327 |
|---|
7/31/24 | $12,847 | $12,446 | $23,675 | $30,936 |
|---|
7/31/25 | $11,376 | $11,582 | $27,396 | $35,989 |
|---|
|
| Average Annual Return [Table Text Block] |
AVERAGE ANNUAL TOTAL RETURNS | 1 Year | 5 years | 10 Years |
|---|
ARK Genomic Revolution ETF - NAV | -11.46% | -14.72% | 1.30% |
|---|
Nasdaq Healthcare Index | -6.94% | -1.29% | 1.48% |
|---|
MSCI World Index (Net) | 15.72% | 13.78% | 10.60% |
|---|
S&P 500 Index | 16.33% | 15.88% | 13.66% |
|---|
|
| No Deduction of Taxes [Text Block] |
The returns for the Fund do not reflect the deduction of taxes that a shareholder would pay on Fund distributions or upon sale of Fund shares.
|
| Updated Performance Information Location [Text Block] |
To obtain performance information current to the most recent month end, please visit www.arkfunds.com.
|
| AssetsNet |
$ 1,011,802,935
|
| Holdings Count | Holding |
35
|
| Advisory Fees Paid, Amount |
$ 8,564,967
|
| InvestmentCompanyPortfolioTurnover |
33.00%
|
| Additional Fund Statistics [Text Block] |
The following table outlines key Fund statistics that you should pay attention to: - Fund net assets$1,011,802,935
- Total number of portfolio holdings35
- Total advisory fees paid$8,564,967
- Period portfolio turnover rate33%
|
| Holdings [Text Block] |
Graphical Representation of HoldingsThe table below shows the investment makeup of the Fund. The allocations may not be representative of the Fund's future investments. Sector Diversification | % of Total Investments |
|---|
Health Care | 98.5% |
|---|
Information Technology | 1.4% |
|---|
Financials (Money Market Fund) | 0.1% |
|---|
Total | 100.0% |
|---|
|
| Material Fund Change [Text Block] |
|
| C000133120 |
|
| Shareholder Report [Line Items] |
|
| Fund Name |
ARK Autonomous Technology & Robotics ETF
|
| Class Name |
ARK Autonomous Technology & Robotics ETF
|
| Trading Symbol |
ARKQ
|
| Security Exchange Name |
CboeBZX
|
| Annual or Semi-Annual Statement [Text Block] |
ANNUAL SHAREHOLDER REPORT
|
| Shareholder Report Annual or Semi-Annual |
annual shareholder report
|
| Additional Information [Text Block] |
You can find additional information about the Fund at https://www.ark-funds.com/download-fund-materials/. You can also request this information by contacting us at (727) 810-8160.
|
| Additional Information Phone Number |
(727) 810-8160
|
| Additional Information Website |
<span style="box-sizing: border-box; color: rgb(0, 0, 0); display: inline; flex-wrap: nowrap; font-size: 12px; font-weight: 400; grid-area: auto; line-height: 18px; margin: 0px; overflow: visible; text-align: left; text-align-last: auto; white-space-collapse: preserve-breaks;">https://www.ark-funds.com/download-fund-materials/</span>
|
| Expenses [Text Block] |
What were the Fund’s cost for the period? (based on a hypothetical $10,000 investment) Fund | Costs of a $10,000 investment | Costs paid as a percentage of a $10,000 investment |
|---|
ARK Autonomous Technology & Robotics ETF | $102 | 0.75% |
|---|
|
| Expenses Paid, Amount |
$ 102
|
| Expense Ratio, Percent |
0.75%
|
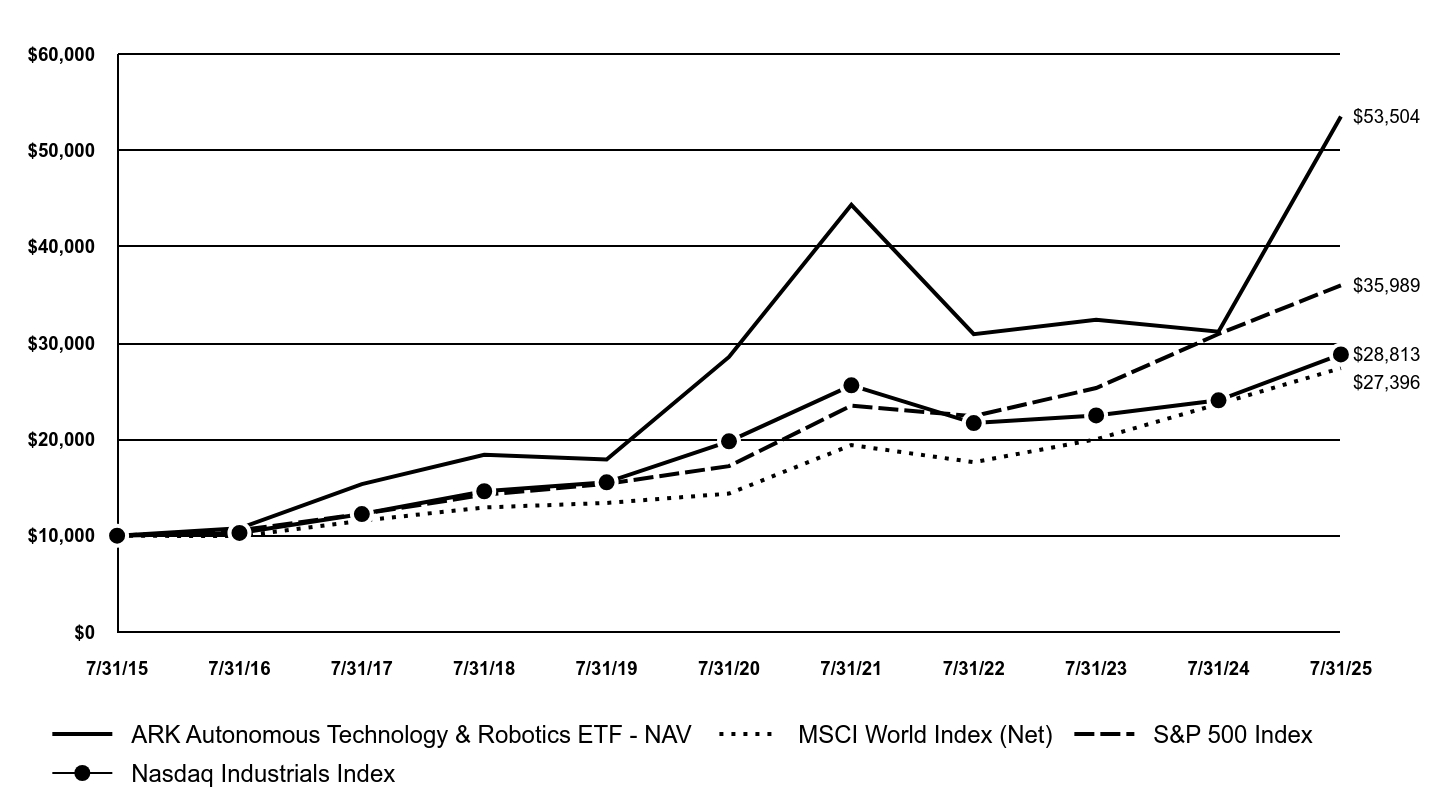
| Factors Affecting Performance [Text Block] |
Management’s Discussion of Fund PerformanceThe Fund outperformed both the S&P 500 Index and the MSCI World Index for the 12-month period ending July 31, 2025. The headwinds that once pressured disruptive technologies shifted into structural tailwinds, supported by broadening market participation, favorable policy shifts around crypto, AI, and healthcare, and potential fiscal catalysts like tax cuts. ARK’s research suggests that a rolling recession began in the spring of 2022, when the Federal Reserve raised interest rates 22-fold in just over a year. We believe that waning pricing power is likely to force corporations into further employment cutbacks to preserve margins. Innovation often takes root in turbulent times: when consumers and businesses confront uncertainty, they are more willing to adopt better, faster, and less costly solutions. Top contributors to relative performance • The top contributor to performance during the period was Rocket Lab Corp (RKLB). Shares of RKLB contributed to performance during the period driven by several positive developments. The company was on-ramped to multi-billion-dollar U.S. and U.K. defense contracts for hypersonic technologies, was selected by Kratos for a MACH-TB 2.0 test launch and secured its first dedicated satellite launch mission for the European Space Agency. The company also agreed to acquire Geost for $275 million, expanding into EO/IR satellite payloads. • Additional contributors to performance included Kratos Defense & Security Solutions, Inc., Palantir Technologies, Inc., Tesla, Inc., and Archer Aviation, Inc. Biggest detractors from relative performance • The biggest detractor from performance during the period was Teradyne, Inc. (TER). Shares of TER detracted from the Fund’s performance during the period as continued softness in its industrial automation and robotics segments persisted. In March 2025, management lowered near-term guidance for its semiconductor business at its investor day, citing potential tariffs and trade restrictions. • Additional detractors from performance included Iridium Communications, Inc., 3D Systems Corp., Intuitive Machines, Inc., and QUALCOMM, Inc. |
| Performance Past Does Not Indicate Future [Text] |
Past performance does not guarantee future results.
|
| Line Graph [Table Text Block] |
| ARK Autonomous Technology & Robotics ETF - NAV | MSCI World Index (Net) | S&P 500 Index | Nasdaq Industrials Index |
|---|
7/31/15 | $10,000 | $10,000 | $10,000 | $10,000 |
|---|
7/31/16 | $10,770 | $9,954 | $10,561 | $10,291 |
|---|
7/31/17 | $15,351 | $11,559 | $12,256 | $12,243 |
|---|
7/31/18 | $18,400 | $12,932 | $14,246 | $14,612 |
|---|
7/31/19 | $17,911 | $13,400 | $15,384 | $15,537 |
|---|
7/31/20 | $28,555 | $14,369 | $17,223 | $19,797 |
|---|
7/31/21 | $44,348 | $19,409 | $23,500 | $25,606 |
|---|
7/31/22 | $30,921 | $17,630 | $22,410 | $21,692 |
|---|
7/31/23 | $32,420 | $20,007 | $25,327 | $22,483 |
|---|
7/31/24 | $31,170 | $23,675 | $30,936 | $24,050 |
|---|
7/31/25 | $53,504 | $27,396 | $35,989 | $28,813 |
|---|
|
| Average Annual Return [Table Text Block] |
AVERAGE ANNUAL TOTAL RETURNS | 1 Year | 5 years | 10 Years |
|---|
ARK Autonomous Technology & Robotics ETF - NAV | 71.66% | 13.38% | 18.26% |
|---|
MSCI World Index (Net) | 15.72% | 13.78% | 10.60% |
|---|
S&P 500 Index | 16.33% | 15.88% | 13.66% |
|---|
Nasdaq Industrials Index | 19.80% | 7.79% | 11.16% |
|---|
|
| No Deduction of Taxes [Text Block] |
The returns for the Fund do not reflect the deduction of taxes that a shareholder would pay on Fund distributions or upon sale of Fund shares.
|
| Updated Performance Information Location [Text Block] |
To obtain performance information current to the most recent month end, please visit www.arkfunds.com.
|
| AssetsNet |
$ 1,252,402,839
|
| Holdings Count | Holding |
35
|
| Advisory Fees Paid, Amount |
$ 6,775,464
|
| InvestmentCompanyPortfolioTurnover |
27.00%
|
| Additional Fund Statistics [Text Block] |
The following table outlines key Fund statistics that you should pay attention to: - Fund net assets$1,252,402,839
- Total number of portfolio holdings35
- Total advisory fees paid$6,775,464
- Period portfolio turnover rate27%
|
| Holdings [Text Block] |
Graphical Representation of HoldingsThe table below shows the investment makeup of the Fund. The allocations may not be representative of the Fund's future investments. Sector Diversification | % of Total Investments |
|---|
Industrials | 44.2% |
|---|
Information Technology | 30.2% |
|---|
Consumer Discretionary | 15.5% |
|---|
Communication Services | 6.2% |
|---|
Energy | 1.6% |
|---|
Utilities | 1.2% |
|---|
Health Care | 0.9% |
|---|
Financials (Money Market Fund) | 0.2% |
|---|
Total | 100.0% |
|---|
|
| Material Fund Change [Text Block] |
|
| C000133121 |
|
| Shareholder Report [Line Items] |
|
| Fund Name |
ARK Innovation ETF
|
| Class Name |
ARK Innovation ETF
|
| Trading Symbol |
ARKK
|
| Security Exchange Name |
CboeBZX
|
| Annual or Semi-Annual Statement [Text Block] |
ANNUAL SHAREHOLDER REPORT
|
| Shareholder Report Annual or Semi-Annual |
annual shareholder report
|
| Additional Information [Text Block] |
You can find additional information about the Fund at https://www.ark-funds.com/download-fund-materials/. You can also request this information by contacting us at (727) 810-8160.
|
| Additional Information Phone Number |
(727) 810-8160
|
| Additional Information Website |
<span style="box-sizing: border-box; color: rgb(0, 0, 0); display: inline; flex-wrap: nowrap; font-size: 12px; font-weight: 400; grid-area: auto; line-height: 18px; margin: 0px; overflow: visible; text-align: left; text-align-last: auto; white-space-collapse: preserve-breaks;">https://www.ark-funds.com/download-fund-materials/</span>
|
| Expenses [Text Block] |
What were the Fund’s cost for the period? (based on a hypothetical $10,000 investment) Fund | Costs of a $10,000 investment | Costs paid as a percentage of a $10,000 investment |
|---|
ARK Innovation ETF | $99 | 0.75% |
|---|
|
| Expenses Paid, Amount |
$ 99
|
| Expense Ratio, Percent |
0.75%
|
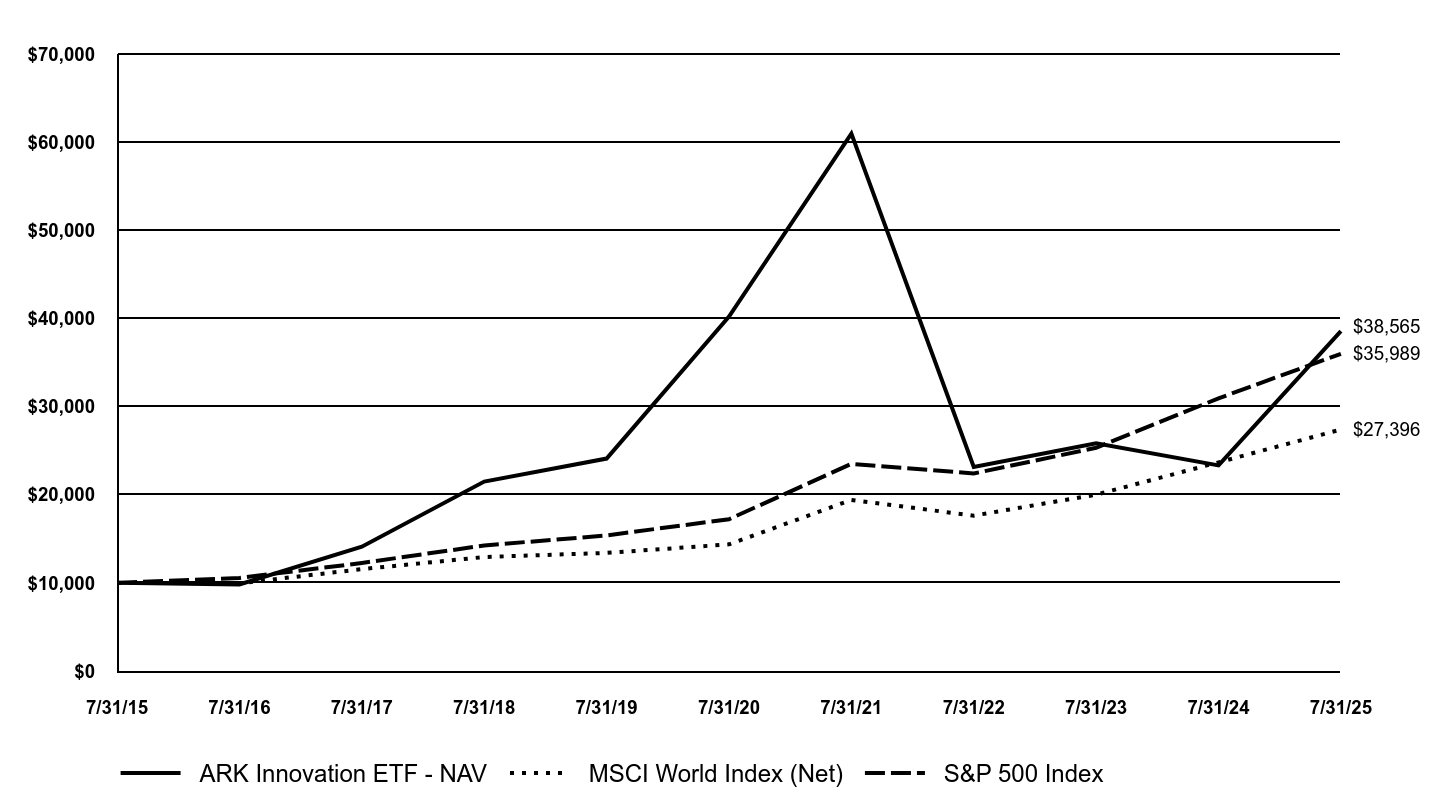
| Factors Affecting Performance [Text Block] |
Management’s Discussion of Fund PerformanceThe Fund outperformed both the S&P 500 Index and the MSCI World Index for the 12-month period ending July 31, 2025. The headwinds that once pressured disruptive technologies shifted into structural tailwinds, supported by broadening market participation, favorable policy shifts around crypto, AI, and healthcare, and potential fiscal catalysts like tax cuts. Still, many companies in the genomics space remain under pressure as they prioritize long-term growth over near-term profitability. ARK’s research suggests that a rolling recession began in the spring of 2022, when the Federal Reserve raised interest rates 22-fold in just over a year. We believe that waning pricing power is likely to force corporations into further employment cutbacks to preserve margins. Innovation often takes root in turbulent times: when consumers and businesses confront uncertainty, they are more willing to adopt better, faster, and less costly solutions. Top contributors to relative performance • The top contributor to performance during the period was Palantir Technologies, Inc. (PLTR). Shares of PLTR contributed to the Fund’s performance during the period following a strong Q42024 earnings report that showcased significant growth in U.S. customers and commercial revenue. The stock surged as the company reported a 64% increase in U.S. commercial revenue year-over-year and provided an optimistic outlook for fiscal year 2025, indicating continued demand for its AI-driven platforms, particularly from government clients. The company also launched partnerships with R1, L3Harris, and the U.S. Army, further bolstering its positioning in healthcare and defense. • Additional contributors to performance included ROBLOX Corp., Robinhood Markets, Inc., Circle Internet Group, Inc., and Coinbase Global, Inc. Biggest detractors from relative performance • The biggest detractor from performance during the period was Intellia Therapeutics, Inc. (NTLA). Shares of NTLA detracted from the Fund’s performance after the company released data from its Phase 2 trials for NTLA-2002, an in-vivo CRISPR-Cas9 therapy for hereditary angioedema (HAE). With no serious adverse side-effects, NTLA-2002 at the 50mg dose level reduced mean monthly attack rates by 77% and 81% during weeks 1-16 and 5-16, respectively, compared to the placebo. Importantly, eight of eleven patients had no attacks. • Additional detractors from performance included Beam Therapeutics, Inc., Twist Bioscience Corp., Recursion Pharmaceuticals, Inc., and 10x Genomics, Inc. |
| Performance Past Does Not Indicate Future [Text] |
Past performance does not guarantee future results.
|
| Line Graph [Table Text Block] |
| ARK Innovation ETF - NAV | MSCI World Index (Net) | S&P 500 Index |
|---|
7/31/15 | $10,000 | $10,000 | $10,000 |
|---|
7/31/16 | $9,828 | $9,954 | $10,561 |
|---|
7/31/17 | $14,103 | $11,559 | $12,256 |
|---|
7/31/18 | $21,489 | $12,932 | $14,246 |
|---|
7/31/19 | $24,100 | $13,400 | $15,384 |
|---|
7/31/20 | $40,203 | $14,369 | $17,223 |
|---|
7/31/21 | $60,966 | $19,409 | $23,500 |
|---|
7/31/22 | $23,141 | $17,630 | $22,410 |
|---|
7/31/23 | $25,850 | $20,007 | $25,327 |
|---|
7/31/24 | $23,329 | $23,675 | $30,936 |
|---|
7/31/25 | $38,565 | $27,396 | $35,989 |
|---|
|
| Average Annual Return [Table Text Block] |
AVERAGE ANNUAL TOTAL RETURNS | 1 Year | 5 years | 10 Years |
|---|
ARK Innovation ETF - NAV | 65.31% | -0.83% | 14.45% |
|---|
MSCI World Index (Net) | 15.72% | 13.78% | 10.60% |
|---|
S&P 500 Index | 16.33% | 15.88% | 13.66% |
|---|
|
| No Deduction of Taxes [Text Block] |
The returns for the Fund do not reflect the deduction of taxes that a shareholder would pay on Fund distributions or upon sale of Fund shares.
|
| Updated Performance Information Location [Text Block] |
To obtain performance information current to the most recent month end, please visit www.arkfunds.com.
|
| AssetsNet |
$ 8,037,586,439
|
| Holdings Count | Holding |
42
|
| Advisory Fees Paid, Amount |
$ 45,202,657
|
| InvestmentCompanyPortfolioTurnover |
43.00%
|
| Additional Fund Statistics [Text Block] |
The following table outlines key Fund statistics that you should pay attention to: - Fund net assets$8,037,586,439
- Total number of portfolio holdings42
- Total advisory fees paid$45,202,657
- Period portfolio turnover rate43%
|
| Holdings [Text Block] |
Graphical Representation of HoldingsThe table below shows the investment makeup of the Fund. The allocations may not be representative of the Fund's future investments. Sector Diversification | % of Total Investments |
|---|
Information Technology | 26.1% |
|---|
Health Care | 22.0% |
|---|
Communication Services | 18.8% |
|---|
Consumer Discretionary | 14.2% |
|---|
Financials | 13.5% |
|---|
Industrials | 5.2% |
|---|
Financials (Money Market Fund) | 0.2% |
|---|
Total | 100.0% |
|---|
|
| Material Fund Change [Text Block] |
|
| C000133122 |
|
| Shareholder Report [Line Items] |
|
| Fund Name |
ARK Next Generation Internet ETF
|
| Class Name |
ARK Next Generation Internet ETF
|
| Trading Symbol |
ARKW
|
| Security Exchange Name |
CboeBZX
|
| Annual or Semi-Annual Statement [Text Block] |
ANNUAL SHAREHOLDER REPORT
|
| Shareholder Report Annual or Semi-Annual |
annual shareholder report
|
| Additional Information [Text Block] |
You can find additional information about the Fund at https://www.ark-funds.com/download-fund-materials/. You can also request this information by contacting us at (727) 810-8160.
|
| Additional Information Phone Number |
(727) 810-8160
|
| Additional Information Website |
<span style="box-sizing: border-box; color: rgb(0, 0, 0); display: inline; flex-wrap: nowrap; font-size: 12px; font-weight: 400; grid-area: auto; line-height: 18px; margin: 0px; overflow: visible; text-align: left; text-align-last: auto; white-space-collapse: preserve-breaks;">https://www.ark-funds.com/download-fund-materials/</span>
|
| Expenses [Text Block] |
What were the Fund’s cost for the period? (based on a hypothetical $10,000 investment) Fund | Costs of a $10,000 investment | Costs paid as a percentage of a $10,000 investment |
|---|
ARK Next Generation Internet ETF | $113 | 0.75% |
|---|
|
| Expenses Paid, Amount |
$ 113
|
| Expense Ratio, Percent |
0.75%
|
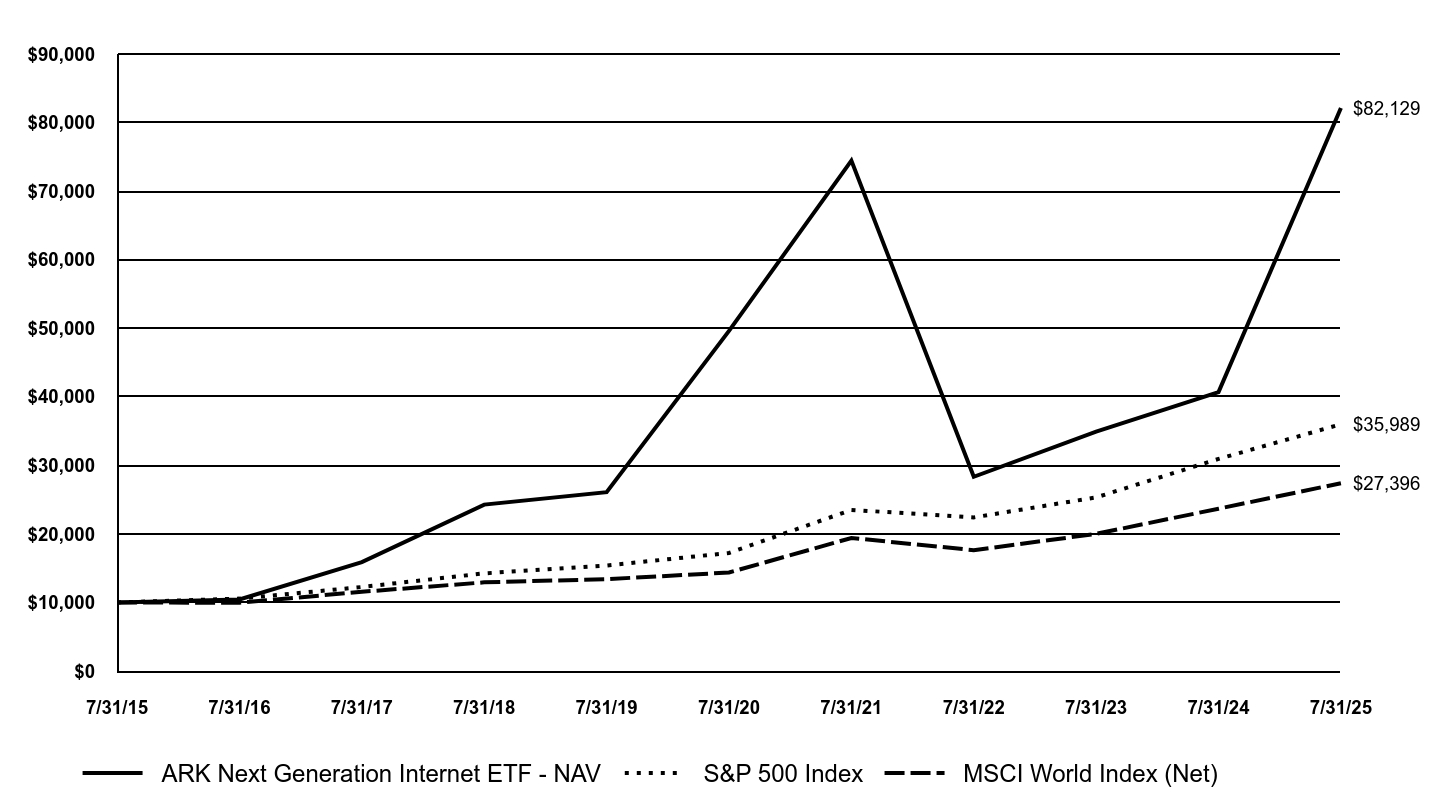
| Factors Affecting Performance [Text Block] |
Management’s Discussion of Fund PerformanceThe Fund outperformed both the S&P 500 Index and the MSCI World Index for the 12-month period ending July 31, 2025. The headwinds that once pressured disruptive technologies shifted into structural tailwinds, supported by broadening market participation, favorable policy shifts around crypto, AI, and healthcare, and potential fiscal catalysts like tax cuts. ARK’s research suggests that a rolling recession began in the spring of 2022, when the Federal Reserve raised interest rates 22-fold in just over a year. We believe that waning pricing power is likely to force corporations into further employment cutbacks to preserve margins. Innovation often takes root in turbulent times: when consumers and businesses confront uncertainty, they are more willing to adopt better, faster, and less costly solutions. Top contributors to relative performance • The top contributor to performance during the period was Robinhood Markets, Inc. (HOOD). The company reported strong first quarter earnings, including revenue growth of 50% year-over-year that beat Wall Street expectations. The company also demonstrated exceptional product velocity, unveiling several new features and hosting a dedicated event focused on its crypto strategy. As part of its crypto push, the company launched a promotion matching 2% of any crypto deposits made to the platform. At its highly anticipated crypto event, the company announced the introduction of tokenized stocks and ETFs for EU customers, the launch of 24/5 commission-free trading of tokenized U.S. securities, and the development of a proprietary Layer 2 blockchain built on Arbitrum to support tokenized assets. The company also introduced advanced Robinhood Legend charts on its mobile app and added crypto rewards to its Robinhood Gold credit card. • Additional contributors to performance included Palantir Technologies, Inc., ROBLOX Corp., ARK 21Shares Bitcoin ETF, and Circle Internet Group, Inc. Biggest detractors from relative performance • The biggest detractor from performance during the period was Nextdoor Holdings, Inc. (NXDR). Shares of NXDR traded down following the company's fourth-quarter earnings report. While the company posted 17% year-over-year revenue growth to $65 million and delivered its first positive quarterly Adjusted EBITDA as a public company, investor focus appeared to shift toward the company’s long-term strategy. Management emphasized a decisive transition from vision to execution with its product transformation initiative, "NEXT," set to roll out by mid-2025. While early signals from the initiative have been encouraging, the market may be reacting to the timeline and execution risks associated with the shift. CEO Nirav Tolia expressed confidence in the strategy, highlighting its potential to drive engagement and enhance advertiser performance on the platform. • Additional detractors from performance included PagerDuty, Inc., GitLab, Inc., Salesforce, Inc., and QUALCOMM, Inc. |
| Performance Past Does Not Indicate Future [Text] |
Past performance does not guarantee future results.
|
| Line Graph [Table Text Block] |
| ARK Next Generation Internet ETF - NAV | S&P 500 Index | MSCI World Index (Net) |
|---|
7/31/15 | $10,000 | $10,000 | $10,000 |
|---|
7/31/16 | $10,444 | $10,561 | $9,954 |
|---|
7/31/17 | $15,896 | $12,256 | $11,559 |
|---|
7/31/18 | $24,276 | $14,246 | $12,932 |
|---|
7/31/19 | $26,093 | $15,384 | $13,400 |
|---|
7/31/20 | $49,610 | $17,223 | $14,369 |
|---|
7/31/21 | $74,448 | $23,500 | $19,409 |
|---|
7/31/22 | $28,332 | $22,410 | $17,630 |
|---|
7/31/23 | $34,918 | $25,327 | $20,007 |
|---|
7/31/24 | $40,686 | $30,936 | $23,675 |
|---|
7/31/25 | $82,129 | $35,989 | $27,396 |
|---|
|
| Average Annual Return [Table Text Block] |
AVERAGE ANNUAL TOTAL RETURNS | 1 Year | 5 years | 10 Years |
|---|
ARK Next Generation Internet ETF - NAV | 101.87% | 10.61% | 23.44% |
|---|
S&P 500 Index | 16.33% | 15.88% | 13.66% |
|---|
MSCI World Index (Net) | 15.72% | 13.78% | 10.60% |
|---|
|
| No Deduction of Taxes [Text Block] |
The returns for the Fund do not reflect the deduction of taxes that a shareholder would pay on Fund distributions or upon sale of Fund shares.
|
| Updated Performance Information Location [Text Block] |
To obtain performance information current to the most recent month end, please visit www.arkfunds.com.
|
| AssetsNet |
$ 2,506,358,485
|
| Holdings Count | Holding |
45
|
| Advisory Fees Paid, Amount |
$ 12,496,502
|
| InvestmentCompanyPortfolioTurnover |
44.00%
|
| Additional Fund Statistics [Text Block] |
The following table outlines key Fund statistics that you should pay attention to: - Fund net assets$2,506,358,485
- Total number of portfolio holdings45
- Total advisory fees paid$12,496,502
- Period portfolio turnover rate44%
|
| Holdings [Text Block] |
Graphical Representation of HoldingsThe table below shows the investment makeup of the Fund. The allocations may not be representative of the Fund's future investments. Sector Diversification | % of Total Investments |
|---|
Information Technology | 37.9% |
|---|
Financials | 24.0% |
|---|
Communication Services | 22.1% |
|---|
Consumer Discretionary | 15.8% |
|---|
Financials (Money Market Fund) | 0.2% |
|---|
Total | 100.0% |
|---|
|
| Material Fund Change [Text Block] |
|
| C000209702 |
|
| Shareholder Report [Line Items] |
|
| Fund Name |
ARK Fintech Innovation ETF
|
| Class Name |
ARK Fintech Innovation ETF
|
| Trading Symbol |
ARKF
|
| Security Exchange Name |
CboeBZX
|
| Annual or Semi-Annual Statement [Text Block] |
ANNUAL SHAREHOLDER REPORT
|
| Shareholder Report Annual or Semi-Annual |
annual shareholder report
|
| Additional Information [Text Block] |
You can find additional information about the Fund at https://www.ark-funds.com/download-fund-materials/. You can also request this information by contacting us at (727) 810-8160.
|
| Additional Information Phone Number |
(727) 810-8160
|
| Additional Information Website |
<span style="box-sizing: border-box; color: rgb(0, 0, 0); display: inline; flex-wrap: nowrap; font-size: 12px; font-weight: 400; grid-area: auto; line-height: 18px; margin: 0px; overflow: visible; text-align: left; text-align-last: auto; white-space-collapse: preserve-breaks;">https://www.ark-funds.com/download-fund-materials/</span>
|
| Expenses [Text Block] |
What were the Fund’s cost for the period? (based on a hypothetical $10,000 investment) Fund | Costs of a $10,000 investment | Costs paid as a percentage of a $10,000 investment |
|---|
ARK Fintech Innovation ETF | $112 | 0.75% |
|---|
|
| Expenses Paid, Amount |
$ 112
|
| Expense Ratio, Percent |
0.75%
|
| Factors Affecting Performance [Text Block] |
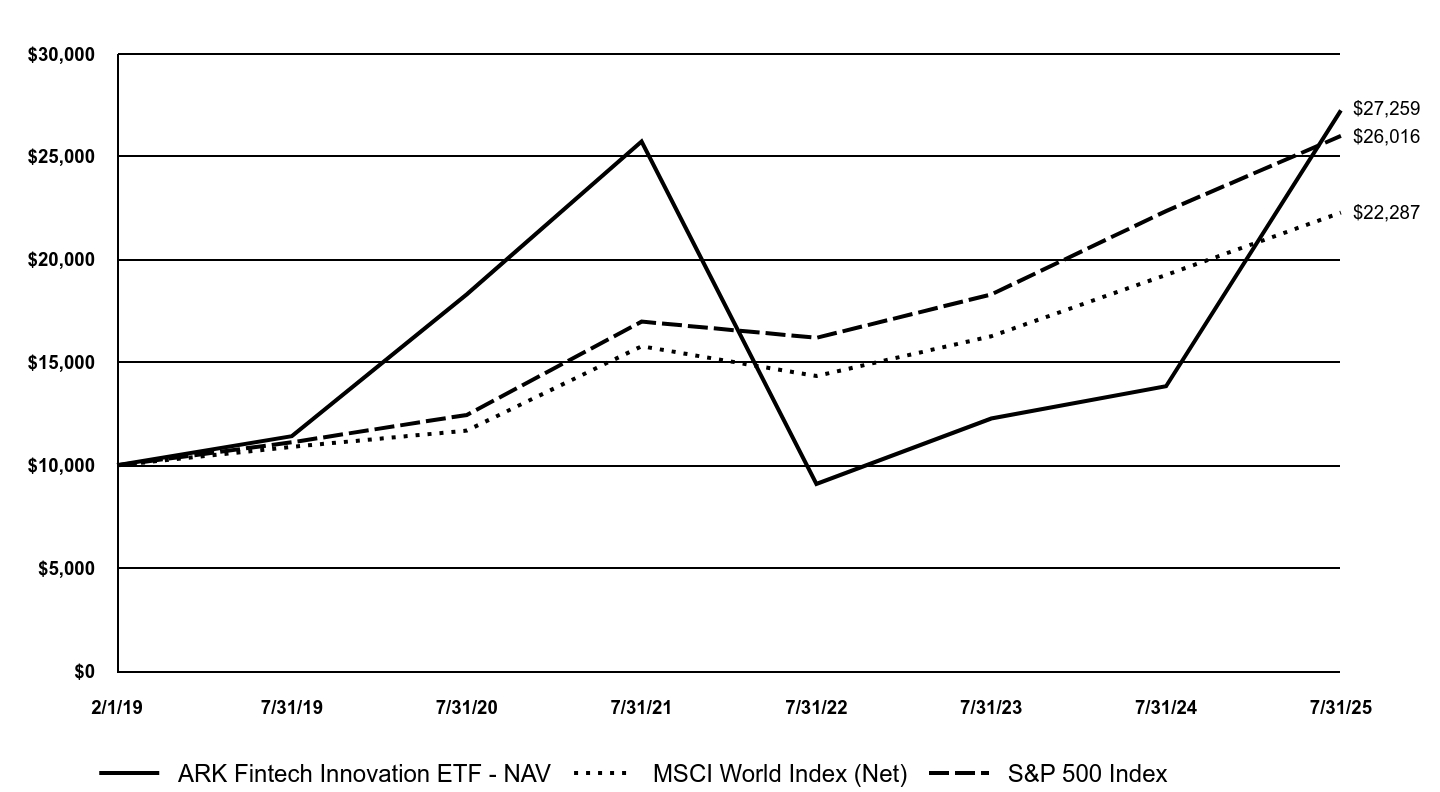
Management’s Discussion of Fund PerformanceThe Fund outperformed both the S&P 500 Index and the MSCI World Index for the 12-month period ending July 31, 2025. The headwinds that once pressured disruptive technologies shifted into structural tailwinds, supported by broadening market participation, favorable policy shifts around crypto, AI, and healthcare, and potential fiscal catalysts like tax cuts. ARK’s research suggests that a rolling recession began in the spring of 2022, when the Federal Reserve raised interest rates 22-fold in just over a year. We believe that waning pricing power is likely to force corporations into further employment cutbacks to preserve margins. Innovation often takes root in turbulent times: when consumers and businesses confront uncertainty, they are more willing to adopt better, faster, and less costly solutions. Top contributors to relative performance • The top contributor to performance during the period was FARO Technologies, Inc. (FARO). Shares of FARO contributed to the Fund’s performance following AMETEK’s agreement to acquire the company for $920 million in cash, pricing the shares at $44 each, subject to regulatory approvals. The transaction closed on July 21, 2025. • Additional contributors to performance included Xometry, Inc., Siemens AG, and Proto Labs, Inc. Biggest detractors from relative performance • The biggest detractor from performance during the period was 3D Systems Corp. (DDD). Shares of DDD detracted from the Fund’s performance following weaker-than-expected first-quarter results amid a challenging capital spending environment. Citing macroeconomic uncertainties, management withdrew its prior full-year guidance while reaffirming its focus on profitability. Later in the period, the company issued a $92 million convertible note to retire existing debt and extend maturities to 2030. • Additional detractors from performance included Nano Dimension Ltd., DENTSPLY SIRONA, Inc., Desktop Metal, Inc., and HP, Inc. |
| Performance Past Does Not Indicate Future [Text] |
Past performance does not guarantee future results.
|
| Line Graph [Table Text Block] |
| ARK Fintech Innovation ETF - NAV | MSCI World Index (Net) | S&P 500 Index |
|---|
2/1/19 | $10,000 | $10,000 | $10,000 |
|---|
7/31/19 | $11,421 | $10,901 | $11,121 |
|---|
7/31/20 | $18,314 | $11,689 | $12,450 |
|---|
7/31/21 | $25,746 | $15,789 | $16,988 |
|---|
7/31/22 | $9,098 | $14,342 | $16,200 |
|---|
7/31/23 | $12,275 | $16,276 | $18,308 |
|---|
7/31/24 | $13,843 | $19,260 | $22,363 |
|---|
7/31/25 | $27,259 | $22,287 | $26,016 |
|---|
|
| Average Annual Return [Table Text Block] |
AVERAGE ANNUAL TOTAL RETURNS | 1 Year | 5 years | Since Inception
2/4/2019 |
|---|
ARK Fintech Innovation ETF - NAV | 96.91% | 8.28% | 16.70% |
|---|
MSCI World Index (Net) | 15.72% | 13.78% | 13.14% |
|---|
S&P 500 Index | 16.33% | 15.88% | 15.86% |
|---|
|
| No Deduction of Taxes [Text Block] |
The returns for the Fund do not reflect the deduction of taxes that a shareholder would pay on Fund distributions or upon sale of Fund shares.
|
| Updated Performance Information Location [Text Block] |
To obtain performance information current to the most recent month end, please visit www.arkfunds.com.
|
| AssetsNet |
$ 1,359,975,197
|
| Holdings Count | Holding |
42
|
| Advisory Fees Paid, Amount |
$ 7,554,930
|
| InvestmentCompanyPortfolioTurnover |
32.00%
|
| Additional Fund Statistics [Text Block] |
The following table outlines key Fund statistics that you should pay attention to: - Fund net assets$1,359,975,197
- Total number of portfolio holdings42
- Total advisory fees paid$7,554,930
- Period portfolio turnover rate32%
|
| Holdings [Text Block] |
Graphical Representation of HoldingsThe table below shows the investment makeup of the Fund. The allocations may not be representative of the Fund's future investments. Sector Diversification | % of Total Investments |
|---|
Financials | 44.1% |
|---|
Information Technology | 25.4% |
|---|
Communication Services | 19.1% |
|---|
Consumer Discretionary | 9.7% |
|---|
Real Estate | 1.6% |
|---|
Financials (Money Market Fund) | 0.1% |
|---|
Total | 100.0% |
|---|
|
| Material Fund Change [Text Block] |
|
| C000226276 |
|
| Shareholder Report [Line Items] |
|
| Fund Name |
ARK Space Exploration & Innovation ETF
|
| Class Name |
ARK Space Exploration & Innovation ETF
|
| Trading Symbol |
ARKX
|
| Security Exchange Name |
CboeBZX
|
| Annual or Semi-Annual Statement [Text Block] |
ANNUAL SHAREHOLDER REPORT
|
| Shareholder Report Annual or Semi-Annual |
annual shareholder report
|
| Additional Information [Text Block] |
You can find additional information about the Fund at https://www.ark-funds.com/download-fund-materials/. You can also request this information by contacting us at (727) 810-8160.
|
| Additional Information Phone Number |
(727) 810-8160
|
| Additional Information Website |
<span style="box-sizing: border-box; color: rgb(0, 0, 0); display: inline; flex-wrap: nowrap; font-size: 12px; font-weight: 400; grid-area: auto; line-height: 18px; margin: 0px; overflow: visible; text-align: left; text-align-last: auto; white-space-collapse: preserve-breaks;">https://www.ark-funds.com/download-fund-materials/</span>
|
| Expenses [Text Block] |
What were the Fund’s cost for the period? (based on a hypothetical $10,000 investment) Fund | Costs of a $10,000 investment | Costs paid as a percentage of a $10,000 investment |
|---|
ARK Space Exploration & Innovation ETF | $100 | 0.74% |
|---|
|
| Expenses Paid, Amount |
$ 100
|
| Expense Ratio, Percent |
0.74%
|
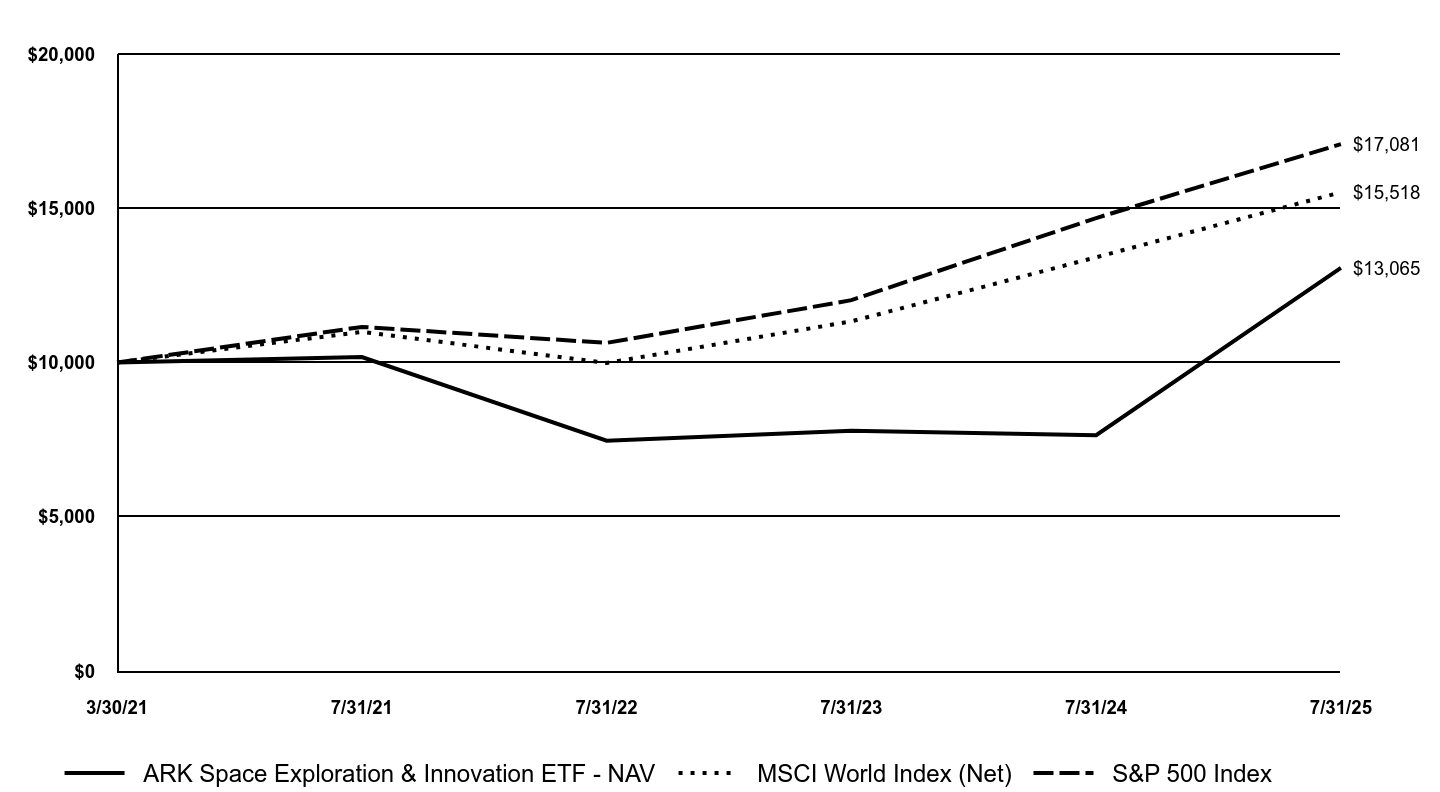
| Factors Affecting Performance [Text Block] |
Management’s Discussion of Fund PerformanceThe Fund outperformed both the S&P 500 Index and the MSCI World Index for the 12-month period ending July 31, 2025. The headwinds that once pressured disruptive technologies shifted into structural tailwinds, supported by broadening market participation, favorable policy shifts around crypto, AI, and healthcare, and potential fiscal catalysts like tax cuts. ARK’s research suggests that a rolling recession began in the spring of 2022, when the Federal Reserve raised interest rates 22-fold in just over a year. We believe that waning pricing power is likely to force corporations into further employment cutbacks to preserve margins. Innovation often takes root in turbulent times: when consumers and businesses confront uncertainty, they are more willing to adopt better, faster, and less costly solutions. Top contributors to relative performance • The top contributor to performance during the period was Rocket Lab Corp (RKLB). Shares of RKLB contributed to performance during the period driven by several positive developments. The company was on-ramped to multi-billion-dollar U.S. and U.K. defense contracts for hypersonic technologies, was selected by Kratos for a MACH-TB 2.0 test launch and secured its first dedicated satellite launch mission for the European Space Agency. The company also agreed to acquire Geost for $275 million, expanding into EO/IR satellite payloads. • Additional contributors to performance included Kratos Defense & Security Solutions, Inc., Palantir Technologies, Inc., Archer Aviation, Inc. and AeroVironment, Inc. Biggest detractors from relative performance • The biggest detractor from performance during the period was Teradyne, Inc. (TER). Shares of TER detracted from the Fund’s performance during the period as continued softness in its industrial automation and robotics segments persisted. In March 2025, management lowered near-term guidance for its semiconductor business at its investor day, citing potential tariffs and trade restrictions. • Additional detractors from performance included Iridium Communications, Inc., Mynaric AG, Intuitive Machines, Inc, and 3D Systems Corp. |
| Performance Past Does Not Indicate Future [Text] |
Past performance does not guarantee future results.
|
| Line Graph [Table Text Block] |
| ARK Space Exploration & Innovation ETF - NAV | MSCI World Index (Net) | S&P 500 Index |
|---|
3/30/21 | $10,000 | $10,000 | $10,000 |
|---|
7/31/21 | $10,177 | $10,994 | $11,154 |
|---|
7/31/22 | $7,466 | $9,986 | $10,636 |
|---|
7/31/23 | $7,785 | $11,333 | $12,021 |
|---|
7/31/24 | $7,643 | $13,411 | $14,683 |
|---|
7/31/25 | $13,065 | $15,518 | $17,081 |
|---|
|
| Average Annual Return [Table Text Block] |
AVERAGE ANNUAL TOTAL RETURNS | 1 Year | Since Inception
3/30/2021 |
|---|
ARK Space Exploration & Innovation ETF - NAV | 70.93% | 6.36% |
|---|
MSCI World Index (Net) | 15.72% | 10.66% |
|---|
S&P 500 Index | 16.33% | 13.14% |
|---|
|
| No Deduction of Taxes [Text Block] |
The returns for the Fund do not reflect the deduction of taxes that a shareholder would pay on Fund distributions or upon sale of Fund shares.
|
| Updated Performance Information Location [Text Block] |
To obtain performance information current to the most recent month end, please visit www.arkfunds.com.
|
| AssetsNet |
$ 399,777,740
|
| Holdings Count | Holding |
32
|
| Advisory Fees Paid, Amount |
$ 2,065,581
|
| InvestmentCompanyPortfolioTurnover |
24.00%
|
| Additional Fund Statistics [Text Block] |
The following table outlines key Fund statistics that you should pay attention to: - Fund net assets$399,777,740
- Total number of portfolio holdings32
- Total advisory fees paid$2,065,581
- Period portfolio turnover rate24%
|
| Holdings [Text Block] |
Graphical Representation of HoldingsThe table below shows the investment makeup of the Fund. The allocations may not be representative of the Fund's future investments. Sector Diversification | % of Total Investments |
|---|
Industrials | 61.4% |
|---|
Information Technology | 24.5% |
|---|
Communication Services | 8.0% |
|---|
Consumer Discretionary | 4.9% |
|---|
Equity Fund | 0.9% |
|---|
Financials (Money Market Fund) | 0.3% |
|---|
Total | 100.0% |
|---|
|
| Material Fund Change [Text Block] |
|
| C000164426 |
|
| Shareholder Report [Line Items] |
|
| Fund Name |
The 3D Printing ETF
|
| Class Name |
The 3D Printing ETF
|
| Trading Symbol |
PRNT
|
| Security Exchange Name |
CboeBZX
|
| Annual or Semi-Annual Statement [Text Block] |
ANNUAL SHAREHOLDER REPORT
|
| Shareholder Report Annual or Semi-Annual |
annual shareholder report
|
| Additional Information [Text Block] |
You can find additional information about the Fund at https://www.ark-funds.com/download-fund-materials/. You can also request this information by contacting us at (727) 810-8160.
|
| Additional Information Phone Number |
(727) 810-8160
|
| Additional Information Website |
<span style="box-sizing: border-box; color: rgb(0, 0, 0); display: inline; flex-wrap: nowrap; font-size: 12px; font-weight: 400; grid-area: auto; line-height: 18px; margin: 0px; overflow: visible; text-align: left; text-align-last: auto; white-space-collapse: preserve-breaks;">https://www.ark-funds.com/download-fund-materials/</span>
|
| Expenses [Text Block] |
What were the Fund’s cost for the period? (based on a hypothetical $10,000 investment) Fund | Costs of a $10,000 investment | Costs paid as a percentage of a $10,000 investment |
|---|
ARK The 3D Printing ETF | $68 | 0.66% |
|---|
|
| Expenses Paid, Amount |
$ 68
|
| Expense Ratio, Percent |
0.66%
|
| Factors Affecting Performance [Text Block] |
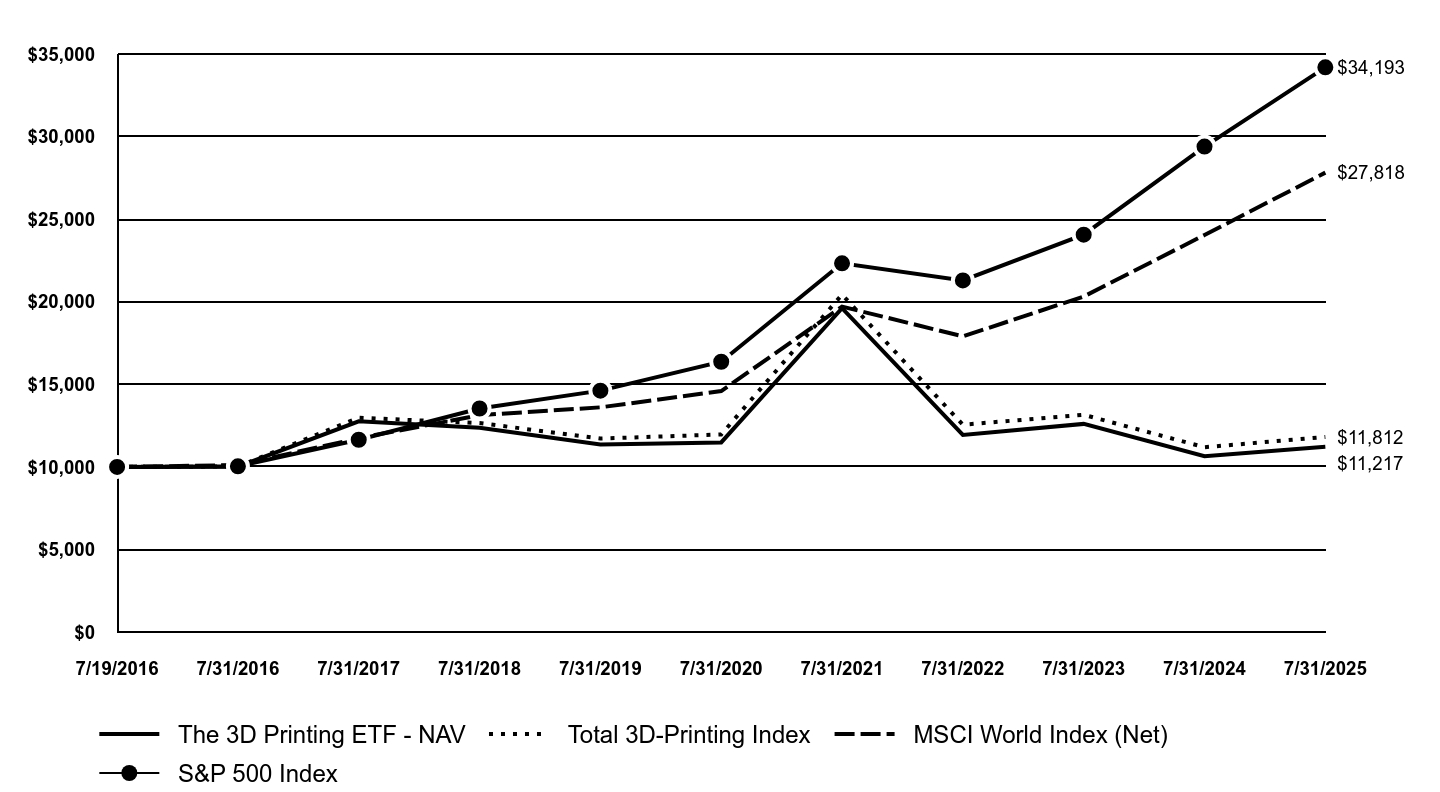
Management’s Discussion of Fund PerformanceThe Fund underperformed both the S&P 500 Index and the MSCI World Index for the 12-month period ending July 31, 2025. The headwinds that once pressured disruptive technologies shifted into structural tailwinds, supported by broadening market participation, favorable policy shifts around crypto, AI, and healthcare, and potential fiscal catalysts like tax cuts. ARK’s research suggests that a rolling recession began in the spring of 2022, when the Federal Reserve raised interest rates 22-fold in just over a year. We believe that waning pricing power is likely to force corporations into further employment cutbacks to preserve margins. Innovation often takes root in turbulent times: when consumers and businesses confront uncertainty, they are more willing to adopt better, faster, and less costly solutions. Top contributors to relative performance • The top contributor to performance during the period was FARO Technologies, Inc. (FARO). Shares of FARO contributed to the Fund’s performance following AMETEK’s agreement to acquire the company for $920 million in cash, pricing the shares at $44 each, subject to regulatory approvals. The transaction closed on July 21, 2025. • Additional contributors to performance included Xometry, Inc., Siemens AG, and Proto Labs, Inc. Biggest detractors from relative performance • The biggest detractor from performance during the period was 3D Systems Corp. (DDD). Shares of DDD detracted from the Fund’s performance following weaker-than-expected first-quarter results amid a challenging capital spending environment. Citing macroeconomic uncertainties, management withdrew its prior full-year guidance while reaffirming its focus on profitability. Later in the period, the company issued a $92 million convertible note to retire existing debt and extend maturities to 2030. • Additional detractors from performance included Nano Dimension Ltd., DENTSPLY SIRONA, Inc., Desktop Metal, Inc., and HP, Inc. |
| Performance Past Does Not Indicate Future [Text] |
Past performance does not guarantee future results.
|
| Line Graph [Table Text Block] |
| The 3D Printing ETF - NAV | Total 3D-Printing Index | MSCI World Index (Net) | S&P 500 Index |
|---|
7/19/2016 | $10,000 | $10,000 | $10,000 | $10,000 |
|---|
7/31/2016 | $10,015 | $10,022 | $10,107 | $10,034 |
|---|
7/31/2017 | $12,760 | $12,977 | $11,736 | $11,644 |
|---|
7/31/2018 | $12,371 | $12,653 | $13,131 | $13,535 |
|---|
7/31/2019 | $11,351 | $11,717 | $13,606 | $14,616 |
|---|
7/31/2020 | $11,482 | $11,963 | $14,590 | $16,364 |
|---|
7/31/2021 | $19,607 | $20,433 | $19,707 | $22,328 |
|---|
7/31/2022 | $11,934 | $12,554 | $17,901 | $21,292 |
|---|
7/31/2023 | $12,603 | $13,154 | $20,315 | $24,063 |
|---|
7/31/2024 | $10,647 | $11,190 | $24,040 | $29,392 |
|---|
7/31/2025 | $11,217 | $11,812 | $27,818 | $34,193 |
|---|
|
| Average Annual Return [Table Text Block] |
AVERAGE ANNUAL TOTAL RETURNS | 1 Year | 5 years | Since Inception
7/19/2016 |
|---|
The 3D Printing ETF - NAV | 5.36% | -0.47% | 1.28% |
|---|
Total 3D-Printing Index | 5.56% | -0.25% | 1.86% |
|---|
MSCI World Index (Net) | 15.72% | 13.78% | 11.99% |
|---|
S&P 500 Index | 16.33% | 15.88% | 14.58% |
|---|
|
| No Deduction of Taxes [Text Block] |
The returns for the Fund do not reflect the deduction of taxes that a shareholder would pay on Fund distributions or upon sale of Fund shares.
|
| Updated Performance Information Location [Text Block] |
To obtain performance information current to the most recent month end, please visit www.arkfunds.com.
|
| AssetsNet |
$ 74,717,040
|
| Holdings Count | Holding |
49
|
| Advisory Fees Paid, Amount |
$ 572,515
|
| InvestmentCompanyPortfolioTurnover |
42.00%
|
| Additional Fund Statistics [Text Block] |
The following table outlines key Fund statistics that you should pay attention to: - Fund net assets$74,717,040
- Total number of portfolio holdings49
- Total advisory fees paid$572,515
- Period portfolio turnover rate42%
|
| Holdings [Text Block] |
Graphical Representation of HoldingsThe table below shows the investment makeup of the Fund. The allocations may not be representative of the Fund's future investments. Sector Diversification | % of Total Investments |
|---|
Industrials | 40.7% |
|---|
Information Technology | 28.0% |
|---|
Health Care | 13.3% |
|---|
Materials | 6.1% |
|---|
Financials (Money Market Fund) | 6.0% |
|---|
Consumer Discretionary | 5.8% |
|---|
Consumer Staples | 0.1% |
|---|
Total | 100.0% |
|---|
|
| Material Fund Change [Text Block] |
|
| C000164427 |
|
| Shareholder Report [Line Items] |
|
| Fund Name |
ARK Israel Innovative Technology ETF
|
| Class Name |
ARK Israel Innovative Technology ETF
|
| Trading Symbol |
IZRL
|
| Security Exchange Name |
CboeBZX
|
| Annual or Semi-Annual Statement [Text Block] |
ANNUAL SHAREHOLDER REPORT
|
| Shareholder Report Annual or Semi-Annual |
annual shareholder report
|
| Additional Information [Text Block] |
You can find additional information about the Fund at https://www.ark-funds.com/download-fund-materials/. You can also request this information by contacting us at (727) 810-8160.
|
| Additional Information Phone Number |
(727) 810-8160
|
| Additional Information Website |
<span style="box-sizing: border-box; color: rgb(0, 0, 0); display: inline; flex-wrap: nowrap; font-size: 12px; font-weight: 400; grid-area: auto; line-height: 18px; margin: 0px; overflow: visible; text-align: left; text-align-last: auto; white-space-collapse: preserve-breaks;">https://www.ark-funds.com/download-fund-materials/</span>
|
| Expenses [Text Block] |
What were the Fund’s cost for the period? (based on a hypothetical $10,000 investment) Fund | Costs of a $10,000 investment | Costs paid as a percentage of a $10,000 investment |
|---|
ARK Israel Innovative Technology ETF | $60 | 0.49% |
|---|
|
| Expenses Paid, Amount |
$ 60
|
| Expense Ratio, Percent |
0.49%
|
| Factors Affecting Performance [Text Block] |
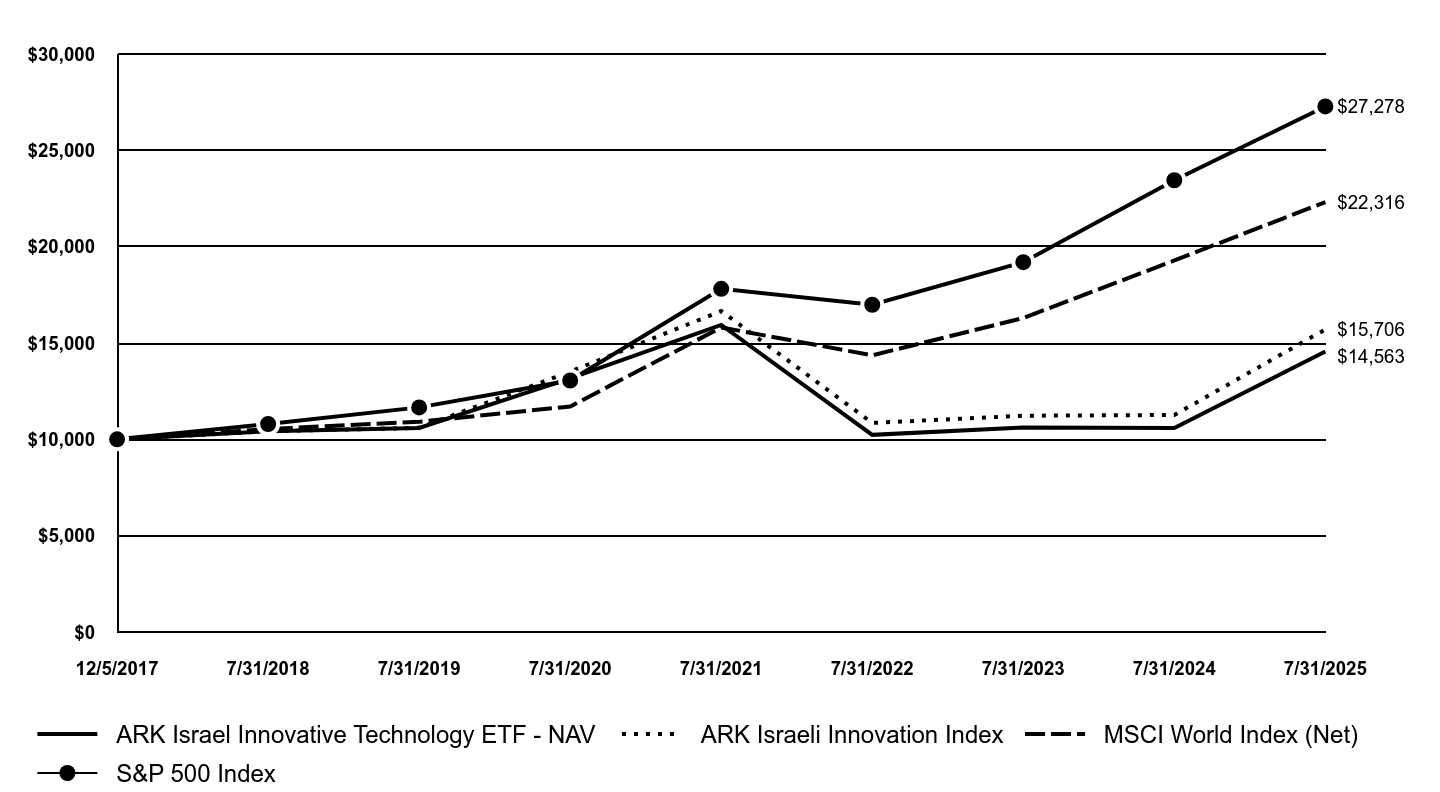
Management’s Discussion of Fund PerformanceThe Fund outperformed both the S&P 500 Index and the MSCI World Index for the 12-month period ending July 31, 2025. The headwinds that once pressured disruptive technologies shifted into structural tailwinds, supported by broadening market participation, favorable policy shifts around crypto, AI, and healthcare, and potential fiscal catalysts like tax cuts. ARK’s research suggests that a rolling recession began in the spring of 2022, when the Federal Reserve raised interest rates 22-fold in just over a year. We believe that waning pricing power is likely to force corporations into further employment cutbacks to preserve margins. Innovation often takes root in turbulent times: when consumers and businesses confront uncertainty, they are more willing to adopt better, faster, and less costly solutions. Top contributors to relative performance • The top contributor to performance during the period was Qualitau Ltd. (QLTU). Shares of QLTU contributed to the Fund’s performance as the company delivered strong revenue and earnings growth, supported by robust margins and efficient capital allocation. Net income rose 13% year-over-year to $13.9 million. The company also maintained a solid balance sheet with ample cash and minimal debt, alongside a growing dividend program. • Additional contributors to performance included Bet Shemesh Engines Holdings 1997 Ltd., Aryt Industries Ltd., Pagaya Technologies Ltd., and Elbit Systems Ltd. Biggest detractors from relative performance • The biggest detractor from performance during the period was Nano-X Imaging Ltd. (NNOX). Shares of NNOX detracted from the Fund’s performance due to its widening net loss, $14.1 million in Q4 2024, up from $10.2 million a year earlier, and persistently negative margins, including a gross loss of $2.9 million, which weighed on valuations despite operational progress. • Additional detractors from performance included Valens Semiconductor Ltd., Playtika Holdings Corp., Compugen Ltd., Sapiens International Corp. NV, and Inmode Ltd. |
| Performance Past Does Not Indicate Future [Text] |
Past performance does not guarantee future results.
|
| Line Graph [Table Text Block] |
| ARK Israel Innovative Technology ETF - NAV | ARK Israeli Innovation Index | MSCI World Index (Net) | S&P 500 Index |
|---|
12/5/2017 | $10,000 | $10,000 | $10,000 | $10,000 |
|---|
7/31/2018 | $10,427 | $10,420 | $10,534 | $10,798 |
|---|
7/31/2019 | $10,591 | $10,600 | $10,915 | $11,660 |
|---|
7/31/2020 | $13,165 | $13,514 | $11,705 | $13,054 |
|---|
7/31/2021 | $15,937 | $16,662 | $15,810 | $17,812 |
|---|
7/31/2022 | $10,233 | $10,852 | $14,361 | $16,986 |
|---|
7/31/2023 | $10,614 | $11,227 | $16,297 | $19,196 |
|---|
7/31/2024 | $10,591 | $11,264 | $19,285 | $23,448 |
|---|
7/31/2025 | $14,563 | $15,706 | $22,316 | $27,278 |
|---|
|
| Average Annual Return [Table Text Block] |
AVERAGE ANNUAL TOTAL RETURNS | 1 Year | 5 years | Since Inception
12/5/2017 |
|---|
ARK Israel Innovative Technology ETF - NAV | 37.51% | 2.04% | 5.03% |
|---|
ARK Israeli Innovation Index | 39.44% | 3.05% | 6.08% |
|---|
MSCI World Index (Net) | 15.72% | 13.78% | 11.06% |
|---|
S&P 500 Index | 16.33% | 15.88% | 14.01% |
|---|
|
| No Deduction of Taxes [Text Block] |
The returns for the Fund do not reflect the deduction of taxes that a shareholder would pay on Fund distributions or upon sale of Fund shares.
|
| Updated Performance Information Location [Text Block] |
To obtain performance information current to the most recent month end, please visit www.arkfunds.com.
|
| AssetsNet |
$ 117,972,169
|
| Holdings Count | Holding |
60
|
| Advisory Fees Paid, Amount |
$ 489,379
|
| InvestmentCompanyPortfolioTurnover |
56.00%
|
| Additional Fund Statistics [Text Block] |
The following table outlines key Fund statistics that you should pay attention to: - Fund net assets$117,972,169
- Total number of portfolio holdings60
- Total advisory fees paid$489,379
- Period portfolio turnover rate56%
|
| Holdings [Text Block] |
Graphical Representation of HoldingsThe table below shows the investment makeup of the Fund. The allocations may not be representative of the Fund's future investments. Sector Diversification | % of Total Investments |
|---|
Information Technology | 51.4% |
|---|
Industrials | 15.8% |
|---|
Communication Services | 11.5% |
|---|
Health Care | 10.3% |
|---|
Consumer Discretionary | 6.7% |
|---|
Financials | 1.8% |
|---|
Consumer Staples | 1.7% |
|---|
Financials (Money Market Fund) | 0.8% |
|---|
Total | 100.0% |
|---|
|
| Material Fund Change [Text Block] |
|