Shareholder Report
Jul. 31, 2025
USD ($)
Holding
WHAT WERE THE FUND COSTS FOR THE LAST YEAR?
(Based on a hypothetical $10,000 investment)
| Fund | Costs of a $10,000 investment | Costs paid as a percentage of a $10,000 investment |
| First Trust Large Cap Core AlphaDEX® Fund | $61 | 0.57% |
HOW DID THE FUND PERFORM LAST YEAR? WHAT AFFECTED THE FUND’S PERFORMANCE?
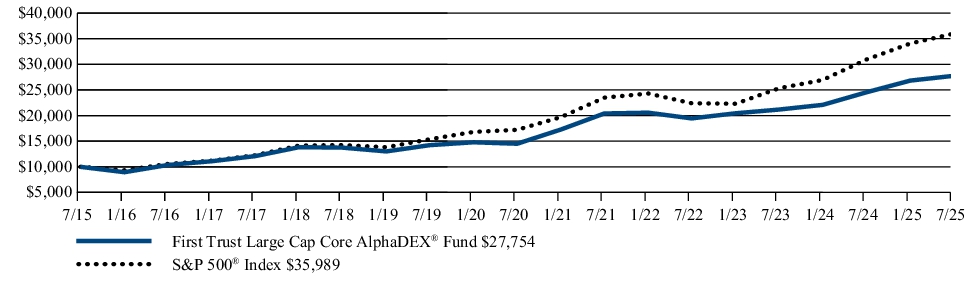
The Fund returned 13.12% during the 12 months ended July 31, 2025. The Fund underperformed its benchmark, the S&P 500® Index, which returned 16.33% for the same Period.
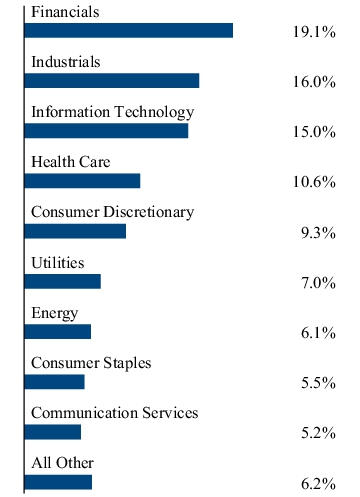
During the Period, investments in the Financials sector received the greatest allocation of any sector with an average weight of 19.4%, and contributed 5.0% to the Fund’s overall return, which was the greatest contribution of any sector. With an average weight of 8.1%, investments in the Health Care sector contributed -1.0% to the Fund’s overall return, which was the most negative contribution of any sector.
FUND PERFORMANCE (July 31, 2015 to July 31, 2025)
The performance line graph below shows the performance of a hypothetical $10,000 initial investment in the Fund over a ten-year period (or for the life of the Fund, if shorter). The subsequent account value as of the end of the Period is listed next to the name of the Fund or index, as applicable. The performance table below shows the average annual total returns of the Fund for the past one-, five-, and ten-year periods, as applicable (or for the life of the Fund, if shorter), as of the end of the Period. Both the line graph and performance table compare the Fund’s performance to an appropriate broad-based index and may compare to additional indices reflecting the market segment(s) in which the Fund invests over the same periods.
Investment Performance of $10,000
| Average Annual Total Returns (as of July 31, 2025) | 1 Year | 5 Year | 10 Year |
| First Trust Large Cap Core AlphaDEX® Fund | 13.12% | 13.86% | 10.75% |
| Nasdaq AlphaDEX Large Cap CoreTMIndex(1) | 13.79% | 14.56% | |
| Nasdaq US 500 Large CapTMIndex(1) | 17.67% | 15.72% | |
| S&P 500® Index | 16.33% | 15.88% | 13.66% |
|
(1)
|
Performance data is not available for all the periods shown in the table for the index because performance data does not exist for some of the entire periods.
|
Visit www.ftportfolios.com/etf/FEX for more recent performance information.
KEY FUND STATISTICS (As of July 31, 2025)
| Fund net assets | $1,320,055,548 |
| Total number of portfolio holdings | 376 |
| Total advisory fee paid | $6,403,294 |
| Portfolio turnover rate | 83% |
WHAT DID THE FUND INVEST IN? (As of July 31, 2025)
The tables below show the investment makeup of the Fund, representing the percentage of total investments of the Fund.
Top Ten Holdings
| Comfort Systems USA, Inc. | 0.6% |
| ROBLOX Corp., Class A | 0.6% |
| GE Vernova, Inc. | 0.5% |
| SoFi Technologies, Inc. | 0.5% |
| Western Digital Corp. | 0.5% |
| Super Micro Computer, Inc. | 0.5% |
| Interactive Brokers Group, Inc., Class A | 0.5% |
| EMCOR Group, Inc. | 0.5% |
| Palantir Technologies, Inc., Class A | 0.5% |
| Carvana Co. | 0.5% |
Sector Allocation
Top Ten Holdings
| Comfort Systems USA, Inc. | 0.6% |
| ROBLOX Corp., Class A | 0.6% |
| GE Vernova, Inc. | 0.5% |
| SoFi Technologies, Inc. | 0.5% |
| Western Digital Corp. | 0.5% |
| Super Micro Computer, Inc. | 0.5% |
| Interactive Brokers Group, Inc., Class A | 0.5% |
| EMCOR Group, Inc. | 0.5% |
| Palantir Technologies, Inc., Class A | 0.5% |
| Carvana Co. | 0.5% |
WHAT WERE THE FUND COSTS FOR THE LAST YEAR?
(Based on a hypothetical $10,000 investment)
| Fund | Costs of a $10,000 investment | Costs paid as a percentage of a $10,000 investment |
| First Trust Mid Cap Core AlphaDEX® Fund | $59 | 0.58% |
HOW DID THE FUND PERFORM LAST YEAR? WHAT AFFECTED THE FUND’S PERFORMANCE?
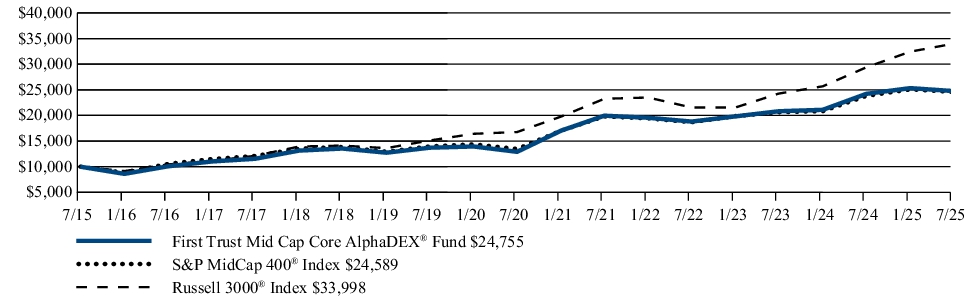
The Fund returned 2.23% during the 12 months ended July 31, 2025. The Fund underperformed its benchmark, the S&P MidCap 400® Index, which returned 3.28% for the same Period.
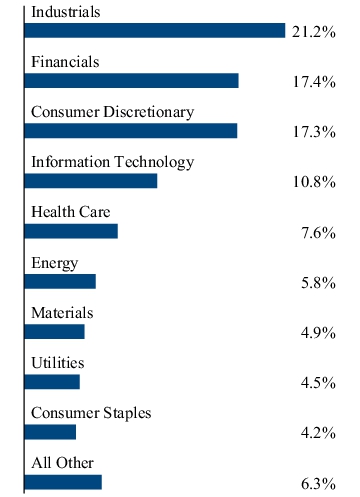
During the Period, investments in the Financials sector received the greatest allocation of any sector, with an average weight of 19.4%, which contributed 2.6% to the Fund’s overall return, which was the greatest of any sector. With an average weight of 7.0%, investments in the Energy sector contributed -2.6% to the Fund’s overall return, which was the most negative return for any sector.
FUND PERFORMANCE (July 31, 2015 to July 31, 2025)
The performance line graph below shows the performance of a hypothetical $10,000 initial investment in the Fund over a ten-year period (or for the life of the Fund, if shorter). The subsequent account value as of the end of the Period is listed next to the name of the Fund or index, as applicable. The performance table below shows the average annual total returns of the Fund for the past one-, five-, and ten-year periods, as applicable (or for the life of the Fund, if shorter), as of the end of the Period. Both the line graph and performance table compare the Fund’s performance to an appropriate broad-based index and may compare to additional indices reflecting the market segment(s) in which the Fund invests over the same periods.
Investment Performance of $10,000
| Average Annual Total Returns (as of July 31, 2025) | 1 Year | 5 Year | 10 Year |
| First Trust Mid Cap Core AlphaDEX® Fund | 2.23% | 13.91% | 9.49% |
| Nasdaq AlphaDEX Mid Cap CoreTMIndex(1) | 2.83% | 14.62% | |
| Nasdaq US 600 Mid CapTMIndex(1) | 4.95% | 11.11% | |
| S&P MidCap 400® Index | 3.28% | 12.79% | 9.41% |
| Russell 3000® Index | 15.68% | 15.19% | 13.02% |
|
(1)
|
Performance data is not available for all the periods shown in the table for the index because performance data does not exist for some of the entire periods.
|
Visit www.ftportfolios.com/etf/FNX for more recent performance information.
KEY FUND STATISTICS (As of July 31, 2025)
| Fund net assets | $1,130,978,761 |
| Total number of portfolio holdings | 455 |
| Total advisory fee paid | $5,958,217 |
| Portfolio turnover rate | 96% |
WHAT DID THE FUND INVEST IN? (As of July 31, 2025)
The tables below show the investment makeup of the Fund, representing the percentage of total investments of the Fund.
Top Ten Holdings
| Bloom Energy Corp., Class A | 0.6% |
| Invesco Ltd. | 0.5% |
| Hims & Hers Health, Inc. | 0.5% |
| Talen Energy Corp. | 0.5% |
| Rocket Lab Corp. | 0.5% |
| Upstart Holdings, Inc. | 0.5% |
| Primoris Services Corp. | 0.4% |
| Credo Technology Group Holding Ltd. | 0.4% |
| Gentex Corp. | 0.4% |
| IES Holdings, Inc. | 0.4% |
Sector Allocation
Top Ten Holdings
| Bloom Energy Corp., Class A | 0.6% |
| Invesco Ltd. | 0.5% |
| Hims & Hers Health, Inc. | 0.5% |
| Talen Energy Corp. | 0.5% |
| Rocket Lab Corp. | 0.5% |
| Upstart Holdings, Inc. | 0.5% |
| Primoris Services Corp. | 0.4% |
| Credo Technology Group Holding Ltd. | 0.4% |
| Gentex Corp. | 0.4% |
| IES Holdings, Inc. | 0.4% |
WHAT WERE THE FUND COSTS FOR THE LAST YEAR?
(Based on a hypothetical $10,000 investment)
| Fund | Costs of a $10,000 investment | Costs paid as a percentage of a $10,000 investment |
| First Trust Small Cap Core AlphaDEX® Fund | $58 | 0.58% |
HOW DID THE FUND PERFORM LAST YEAR? WHAT AFFECTED THE FUND’S PERFORMANCE?
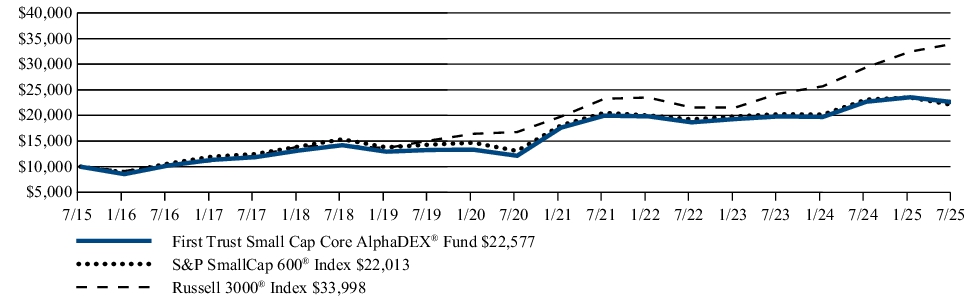
The Fund returned -0.44% during the 12 months ended July 31, 2025. The Fund outperformed its benchmark, the S&P SmallCap 600® Index, which returned -4.72% for the same Period.
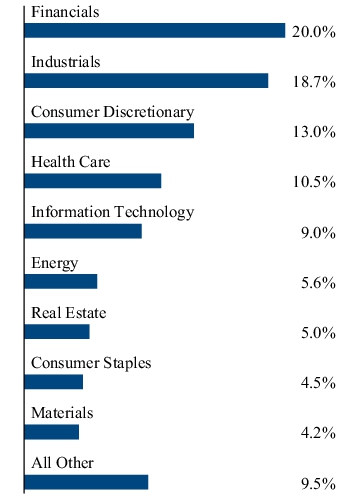
During the Period, investments in the Financials sector received the greatest allocation of any sector, with an average weight of 22.3%, which contributed 2.0% to the Fund’s overall return. With an average weight of 17.5%, investments in the Industrials sector contributed 2.7% to the Fund’s overall return, which was the greatest of any sector. Investments in the Communication Services sector, with an average weight of 4.1%, contributed
-1.1% to the Fund’s overall return, which was the most negative contribution of any sector.
-1.1% to the Fund’s overall return, which was the most negative contribution of any sector.
FUND PERFORMANCE (July 31, 2015 to July 31, 2025)
The performance line graph below shows the performance of a hypothetical $10,000 initial investment in the Fund over a ten-year period (or for the life of the Fund, if shorter). The subsequent account value as of the end of the Period is listed next to the name of the Fund or index, as applicable. The performance table below shows the average annual total returns of the Fund for the past one-, five-, and ten-year periods, as applicable (or for the life of the Fund, if shorter), as of the end of the Period. Both the line graph and performance table compare the Fund’s performance to an appropriate broad-based index and may compare to additional indices reflecting the market segment(s) in which the Fund invests over the same periods.
Investment Performance of $10,000
| Average Annual Total Returns (as of July 31, 2025) | 1 Year | 5 Year | 10 Year |
| First Trust Small Cap Core AlphaDEX® Fund | -0.44% | 13.22% | 8.48% |
| Nasdaq AlphaDEX Small Cap CoreTMIndex(1) | 0.22% | 13.99% | |
| Nasdaq US 700 Small CapTMIndex(1) | 2.38% | 11.51% | |
| S&P SmallCap 600® Index | -4.72% | 10.99% | 8.21% |
| Russell 3000® Index | 15.68% | 15.19% | 13.02% |
|
(1)
|
Performance data is not available for all the periods shown in the table for the index because performance data does not exist for some of the entire periods.
|
Visit www.ftportfolios.com/etf/FYX for more recent performance information.
KEY FUND STATISTICS (As of July 31, 2025)
| Fund net assets | $817,642,920 |
| Total number of portfolio holdings | 530 |
| Total advisory fee paid | $4,437,456 |
| Portfolio turnover rate | 102% |
WHAT DID THE FUND INVEST IN? (As of July 31, 2025)
The tables below show the investment makeup of the Fund, representing the percentage of total investments of the Fund.
Top Ten Holdings
| JPMorgan Chase & Co. | 1.5% |
| Bank of America Corp. | 1.1% |
| Mizuho Financial Group, Inc. | 1.0% |
| Symbotic, Inc. | 0.4% |
| DXP Enterprises, Inc. | 0.4% |
| Kohl’s Corp. | 0.4% |
| NuScale Power Corp. | 0.4% |
| Expro Group Holdings N.V. | 0.4% |
| Forestar Group, Inc. | 0.4% |
| Peabody Energy Corp. | 0.4% |
Sector Allocation
Top Ten Holdings
| JPMorgan Chase & Co. | 1.5% |
| Bank of America Corp. | 1.1% |
| Mizuho Financial Group, Inc. | 1.0% |
| Symbotic, Inc. | 0.4% |
| DXP Enterprises, Inc. | 0.4% |
| Kohl’s Corp. | 0.4% |
| NuScale Power Corp. | 0.4% |
| Expro Group Holdings N.V. | 0.4% |
| Forestar Group, Inc. | 0.4% |
| Peabody Energy Corp. | 0.4% |
WHAT WERE THE FUND COSTS FOR THE LAST YEAR?
(Based on a hypothetical $10,000 investment)
| Fund | Costs of a $10,000 investment | Costs paid as a percentage of a $10,000 investment |
| First Trust Large Cap Value AlphaDEX® Fund | $59 | 0.58% |
HOW DID THE FUND PERFORM LAST YEAR? WHAT AFFECTED THE FUND’S PERFORMANCE?
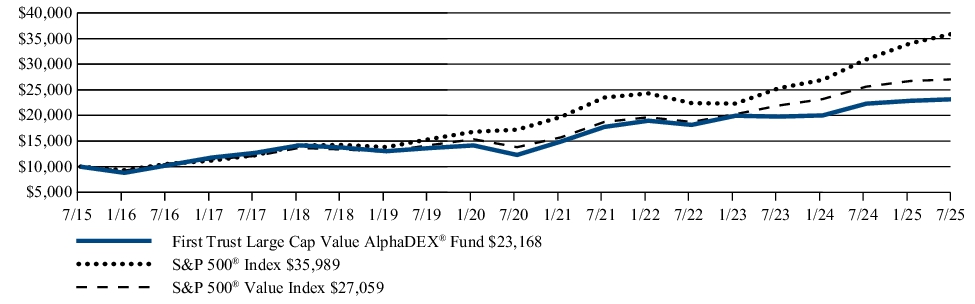
The Fund returned 3.88% during the 12 months ended July 31, 2025. The Fund underperformed its benchmark, the S&P 500® Value Index, which returned 5.59% for the same Period.
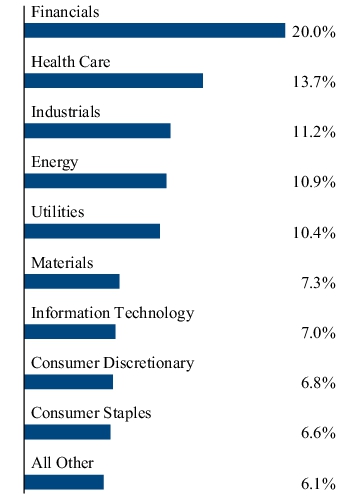
During the Period, investments in the Financials sector received the greatest allocation of any sector, with an average weight of 20.5% and contributed 4.5% to the Fund’s overall return, which was the greatest of any sector. With an average weight of 8.2%, investments in the Health Care sector contributed -1.7% to the Funds overall return, which was the most negative return of any sector.
FUND PERFORMANCE (July 31, 2015 to July 31, 2025)
The performance line graph below shows the performance of a hypothetical $10,000 initial investment in the Fund over a ten-year period (or for the life of the Fund, if shorter). The subsequent account value as of the end of the Period is listed next to the name of the Fund or index, as applicable. The performance table below shows the average annual total returns of the Fund for the past one-, five-, and ten-year periods, as applicable (or for the life of the Fund, if shorter), as of the end of the Period. Both the line graph and performance table compare the Fund’s performance to an appropriate broad-based index and may compare to additional indices reflecting the market segment(s) in which the Fund invests over the same periods.
Investment Performance of $10,000
| Average Annual Total Returns (as of July 31, 2025) | 1 Year | 5 Year | 10 Year |
| First Trust Large Cap Value AlphaDEX® Fund | 3.88% | 13.51% | 8.76% |
| Nasdaq AlphaDEX Large Cap ValueTMIndex(1) | 4.47% | 14.22% | |
| Nasdaq US 500 Large Cap ValueTMIndex(1) | 2.60% | 13.43% | |
| S&P 500® Index | 16.33% | 15.88% | 13.66% |
| S&P 500® Value Index | 5.59% | 14.40% | 10.47% |
|
(1)
|
Performance data is not available for all the periods shown in the table for the index because performance data does not exist for some of the entire periods.
|
Visit www.ftportfolios.com/etf/FTA for more recent performance information.
KEY FUND STATISTICS (As of July 31, 2025)
| Fund net assets | $1,098,298,289 |
| Total number of portfolio holdings | 192 |
| Total advisory fee paid | $5,825,128 |
| Portfolio turnover rate | 75% |
WHAT DID THE FUND INVEST IN? (As of July 31, 2025)
The tables below show the investment makeup of the Fund, representing the percentage of total investments of the Fund.
Top Ten Holdings
| D.R. Horton, Inc. | 1.0% |
| Halliburton Co. | 1.0% |
| Builders FirstSource, Inc. | 1.0% |
| General Motors Co. | 1.0% |
| Diamondback Energy, Inc. | 1.0% |
| PulteGroup, Inc. | 1.0% |
| Newmont Corp. | 1.0% |
| Kraft Heinz (The) Co. | 1.0% |
| ConocoPhillips | 1.0% |
| Chevron Corp. | 1.0% |
Sector Allocation
Top Ten Holdings
| D.R. Horton, Inc. | 1.0% |
| Halliburton Co. | 1.0% |
| Builders FirstSource, Inc. | 1.0% |
| General Motors Co. | 1.0% |
| Diamondback Energy, Inc. | 1.0% |
| PulteGroup, Inc. | 1.0% |
| Newmont Corp. | 1.0% |
| Kraft Heinz (The) Co. | 1.0% |
| ConocoPhillips | 1.0% |
| Chevron Corp. | 1.0% |
WHAT WERE THE FUND COSTS FOR THE LAST YEAR?
(Based on a hypothetical $10,000 investment)
| Fund | Costs of a $10,000 investment | Costs paid as a percentage of a $10,000 investment |
| First Trust Large Cap Growth AlphaDEX® Fund | $66 | 0.58% |
HOW DID THE FUND PERFORM LAST YEAR? WHAT AFFECTED THE FUND’S PERFORMANCE?
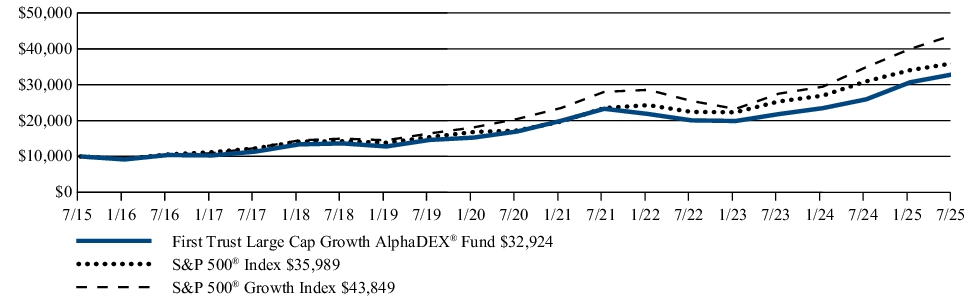
The Fund returned 26.96% during the 12 months ended July 31, 2025. The Fund outperformed its benchmark, the S&P 500® Growth Index, which returned 25.63% for the same Period.
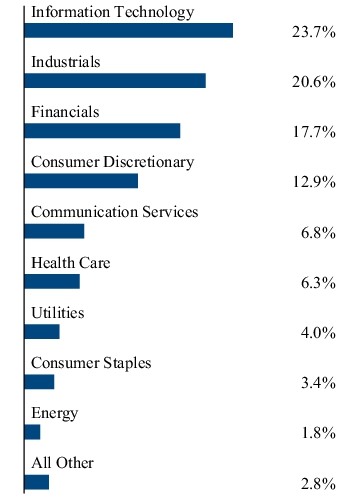
During the Period, investments in the Information Technology sector received the greatest allocation of any sector, with an average weight of 19.5%, and contributed 6.1% to the Fund’s overall return. With an average weight of 18.9%, investments in the Financials sector contributed 6.4% to the Funds overall return, which was the greatest of any sector. Investments in the Real Estate sector, with an average weight of 3.6%, contributed
-0.1% to the Fund’s overall return, which was the most negative contribution of any sector.
-0.1% to the Fund’s overall return, which was the most negative contribution of any sector.
FUND PERFORMANCE (July 31, 2015 to July 31, 2025)
The performance line graph below shows the performance of a hypothetical $10,000 initial investment in the Fund over a ten-year period (or for the life of the Fund, if shorter). The subsequent account value as of the end of the Period is listed next to the name of the Fund or index, as applicable. The performance table below shows the average annual total returns of the Fund for the past one-, five-, and ten-year periods, as applicable (or for the life of the Fund, if shorter), as of the end of the Period. Both the line graph and performance table compare the Fund’s performance to an appropriate broad-based index and may compare to additional indices reflecting the market segment(s) in which the Fund invests over the same periods.
Investment Performance of $10,000
| Average Annual Total Returns (as of July 31, 2025) | 1 Year | 5 Year | 10 Year |
| First Trust Large Cap Growth AlphaDEX® Fund | 26.96% | 14.19% | 12.66% |
| Nasdaq AlphaDEX Large Cap GrowthTMIndex(1) | 27.73% | 14.87% | |
| Nasdaq US 500 Large Cap GrowthTMIndex(1) | 24.68% | 16.42% | |
| S&P 500® Index | 16.33% | 15.88% | 13.66% |
| S&P 500® Growth Index | 25.63% | 16.50% | 15.93% |
|
(1)
|
Performance data is not available for all the periods shown in the table for the index because performance data does not exist for some of the entire periods.
|
Visit www.ftportfolios.com/etf/FTC for more recent performance information.
KEY FUND STATISTICS (As of July 31, 2025)
| Fund net assets | $1,224,662,575 |
| Total number of portfolio holdings | 188 |
| Total advisory fee paid | $5,575,337 |
| Portfolio turnover rate | 114% |
WHAT DID THE FUND INVEST IN? (As of July 31, 2025)
The tables below show the investment makeup of the Fund, representing the percentage of total investments of the Fund.
Top Ten Holdings
| Comfort Systems USA, Inc. | 1.1% |
| ROBLOX Corp., Class A | 1.1% |
| GE Vernova, Inc. | 1.1% |
| SoFi Technologies, Inc. | 1.1% |
| Super Micro Computer, Inc. | 1.0% |
| Interactive Brokers Group, Inc., Class A | 1.0% |
| EMCOR Group, Inc. | 1.0% |
| Palantir Technologies, Inc., Class A | 1.0% |
| Carvana Co. | 1.0% |
| Vertiv Holdings Co., Class A | 1.0% |
Sector Allocation
Top Ten Holdings
| Comfort Systems USA, Inc. | 1.1% |
| ROBLOX Corp., Class A | 1.1% |
| GE Vernova, Inc. | 1.1% |
| SoFi Technologies, Inc. | 1.1% |
| Super Micro Computer, Inc. | 1.0% |
| Interactive Brokers Group, Inc., Class A | 1.0% |
| EMCOR Group, Inc. | 1.0% |
| Palantir Technologies, Inc., Class A | 1.0% |
| Carvana Co. | 1.0% |
| Vertiv Holdings Co., Class A | 1.0% |
WHAT WERE THE FUND COSTS FOR THE LAST YEAR?
(Based on a hypothetical $10,000 investment)
| Fund | Costs of a $10,000 investment | Costs paid as a percentage of a $10,000 investment |
| First Trust Multi Cap Value AlphaDEX® Fund | $65 | 0.65% |
HOW DID THE FUND PERFORM LAST YEAR? WHAT AFFECTED THE FUND’S PERFORMANCE?
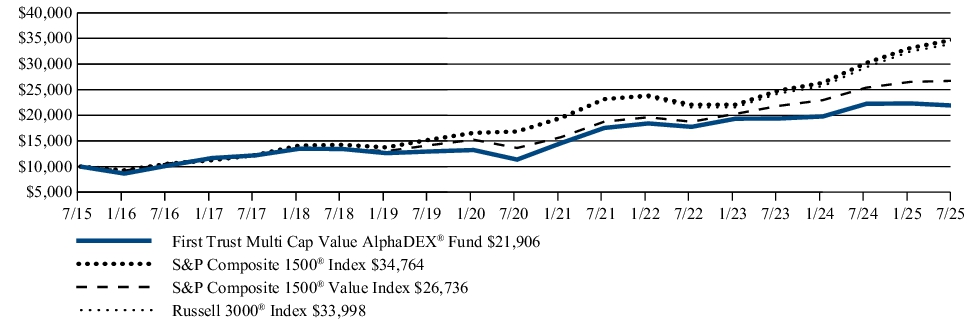
The Fund returned -1.53% during the 12 months ended July 31, 2025. The Fund underperformed its benchmark, the S&P Composite 1500® Value Index, which returned 5.25% for the same Period.
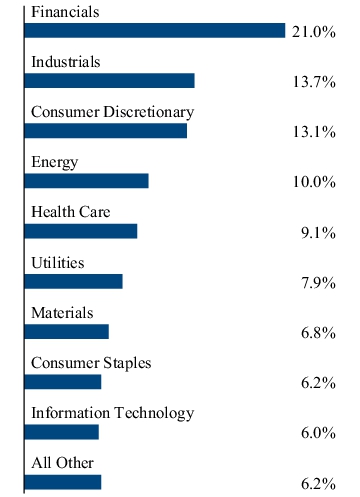
During the Period, the average allocation to the Financials sector was 21.7%, the greatest of any sector, and also had the greatest contribution to the Fund’s overall return, accounting for 3.0% of Fund performance. The negative return in the Fund came from multiple sector allocations, but most notably from the average allocation to the Energy sector. Investments in this sector received an average allocation of 11.2% and had a -2.0% contribution to the Fund’s overall return.
FUND PERFORMANCE (July 31, 2015 to July 31, 2025)
The performance line graph below shows the performance of a hypothetical $10,000 initial investment in the Fund over a ten-year period (or for the life of the Fund, if shorter). The subsequent account value as of the end of the Period is listed next to the name of the Fund or index, as applicable. The performance table below shows the average annual total returns of the Fund for the past one-, five-, and ten-year periods, as applicable (or for the life of the Fund, if shorter), as of the end of the Period. Both the line graph and performance table compare the Fund’s performance to an appropriate broad-based index and may compare to additional indices reflecting the market segment(s) in which the Fund invests over the same periods.
Investment Performance of $10,000
| Average Annual Total Returns (as of July 31, 2025) | 1 Year | 5 Year | 10 Year |
| First Trust Multi Cap Value AlphaDEX® Fund | -1.53% | 14.02% | 8.16% |
| Nasdaq AlphaDEX Multi Cap ValueTMIndex(1) | -0.87% | 14.81% | |
| Nasdaq US Multi Cap ValueTMIndex(1) | 1.97% | 13.54% | |
| S&P Composite 1500® Index | 15.03% | 15.60% | 13.27% |
| S&P Composite 1500® Value Index | 5.25% | 14.43% | 10.33% |
| Russell 3000® Index | 15.68% | 15.19% | 13.02% |
|
(1)
|
Performance data is not available for all the periods shown in the table for the index because performance data does not exist for some of the entire periods.
|
Visit www.ftportfolios.com/etf/FAB for more recent performance information.
KEY FUND STATISTICS (As of July 31, 2025)
| Fund net assets | $119,335,671 |
| Total number of portfolio holdings | 679 |
| Total advisory fee paid | $646,063 |
| Portfolio turnover rate | 86% |
WHAT DID THE FUND INVEST IN? (As of July 31, 2025)
The tables below show the investment makeup of the Fund, representing the percentage of total investments of the Fund.
Top Ten Holdings
| D.R. Horton, Inc. | 0.5% |
| Halliburton Co. | 0.5% |
| Builders FirstSource, Inc. | 0.5% |
| General Motors Co. | 0.5% |
| Diamondback Energy, Inc. | 0.5% |
| PulteGroup, Inc. | 0.5% |
| Newmont Corp. | 0.5% |
| Kraft Heinz (The) Co. | 0.5% |
| ConocoPhillips | 0.5% |
| Chevron Corp. | 0.5% |
Sector Allocation
Top Ten Holdings
| D.R. Horton, Inc. | 0.5% |
| Halliburton Co. | 0.5% |
| Builders FirstSource, Inc. | 0.5% |
| General Motors Co. | 0.5% |
| Diamondback Energy, Inc. | 0.5% |
| PulteGroup, Inc. | 0.5% |
| Newmont Corp. | 0.5% |
| Kraft Heinz (The) Co. | 0.5% |
| ConocoPhillips | 0.5% |
| Chevron Corp. | 0.5% |
WHAT WERE THE FUND COSTS FOR THE LAST YEAR?
(Based on a hypothetical $10,000 investment)
| Fund | Costs of a $10,000 investment | Costs paid as a percentage of a $10,000 investment |
| First Trust Multi Cap Growth AlphaDEX® Fund | $68 | 0.62% |
HOW DID THE FUND PERFORM LAST YEAR? WHAT AFFECTED THE FUND’S PERFORMANCE?
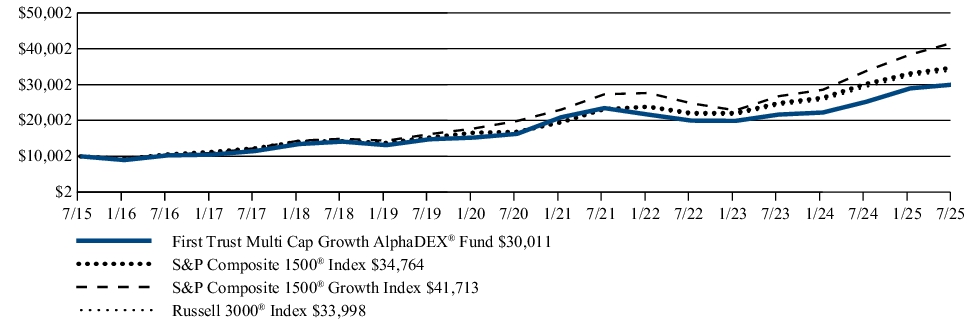
The Fund returned 19.06% during the 12 months ended July 31, 2025. The Fund underperformed its benchmark, the S&P Composite 1500® Growth Index, which returned 23.48% for the same Period.
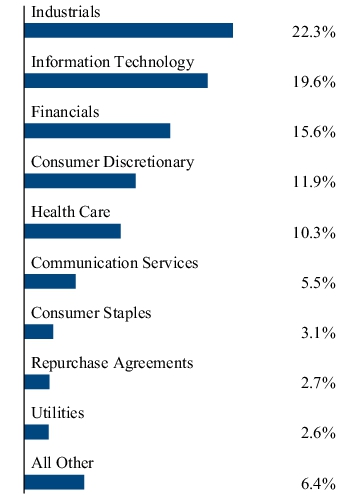
During the Period, the Fund’s greatest allocations were to the Industrials sector and the Financials sector. These two sectors were also the greatest drivers of overall Fund performance. The Industrials sector received an average allocation of 19.7% and contributed 5.4% to the Fund’s overall return while the 17.7% average allocation to the Financials sector contributed 5.0% to the Fund’s return. No sector had a meaningfully negative impact on the Fund’s return, although the Materials sector, with an average allocation of 2.3%, caused a -0.1% drag on the Fund’s performance due in particular to holdings Aspen Aerogels, Inc. and The Scotts Miracle-Gro Co., which were each down significantly during the Period.
FUND PERFORMANCE (July 31, 2015 to July 31, 2025)
The performance line graph below shows the performance of a hypothetical $10,000 initial investment in the Fund over a ten-year period (or for the life of the Fund, if shorter). The subsequent account value as of the end of the Period is listed next to the name of the Fund or index, as applicable. The performance table below shows the average annual total returns of the Fund for the past one-, five-, and ten-year periods, as applicable (or for the life of the Fund, if shorter), as of the end of the Period. Both the line graph and performance table compare the Fund’s performance to an appropriate broad-based index and may compare to additional indices reflecting the market segment(s) in which the Fund invests over the same periods.
Investment Performance of $10,000
| Average Annual Total Returns (as of July 31, 2025) | 1 Year | 5 Year | 10 Year |
| First Trust Multi Cap Growth AlphaDEX® Fund | 19.06% | 13.03% | 11.62% |
| Nasdaq AlphaDEX Multi Cap GrowthTMIndex(1) | 19.85% | 13.78% | |
| Nasdaq US Multi Cap GrowthTMIndex(1) | 23.70% | 15.74% | |
| S&P Composite 1500® Index | 15.03% | 15.60% | 13.27% |
| S&P Composite 1500® Growth Index | 23.48% | 16.02% | 15.35% |
| Russell 3000® Index | 15.68% | 15.19% | 13.02% |
|
(1)
|
Performance data is not available for all the periods shown in the table for the index because performance data does not exist for some of the entire periods.
|
Visit www.ftportfolios.com/etf/FAD for more recent performance information.
KEY FUND STATISTICS (As of July 31, 2025)
| Fund net assets | $300,577,982 |
| Total number of portfolio holdings | 681 |
| Total advisory fee paid | $1,176,511 |
| Portfolio turnover rate | 110% |
WHAT DID THE FUND INVEST IN? (As of July 31, 2025)
The tables below show the investment makeup of the Fund, representing the percentage of total investments of the Fund.
Top Ten Holdings
| JPMorgan Chase & Co. | 1.1% |
| Bank of America Corp. | 0.8% |
| Mizuho Financial Group, Inc. | 0.7% |
| Comfort Systems USA, Inc. | 0.6% |
| ROBLOX Corp., Class A | 0.6% |
| GE Vernova, Inc. | 0.5% |
| SoFi Technologies, Inc. | 0.5% |
| Super Micro Computer, Inc. | 0.5% |
| Interactive Brokers Group, Inc., Class A | 0.5% |
| EMCOR Group, Inc. | 0.5% |
Sector Allocation
Top Ten Holdings
| JPMorgan Chase & Co. | 1.1% |
| Bank of America Corp. | 0.8% |
| Mizuho Financial Group, Inc. | 0.7% |
| Comfort Systems USA, Inc. | 0.6% |
| ROBLOX Corp., Class A | 0.6% |
| GE Vernova, Inc. | 0.5% |
| SoFi Technologies, Inc. | 0.5% |
| Super Micro Computer, Inc. | 0.5% |
| Interactive Brokers Group, Inc., Class A | 0.5% |
| EMCOR Group, Inc. | 0.5% |
WHAT WERE THE FUND COSTS FOR THE LAST YEAR?
(Based on a hypothetical $10,000 investment)
| Fund | Costs of a $10,000 investment | Costs paid as a percentage of a $10,000 investment |
| First Trust Consumer Discretionary AlphaDEX® Fund | $62 | 0.60% |
HOW DID THE FUND PERFORM LAST YEAR? WHAT AFFECTED THE FUND’S PERFORMANCE?
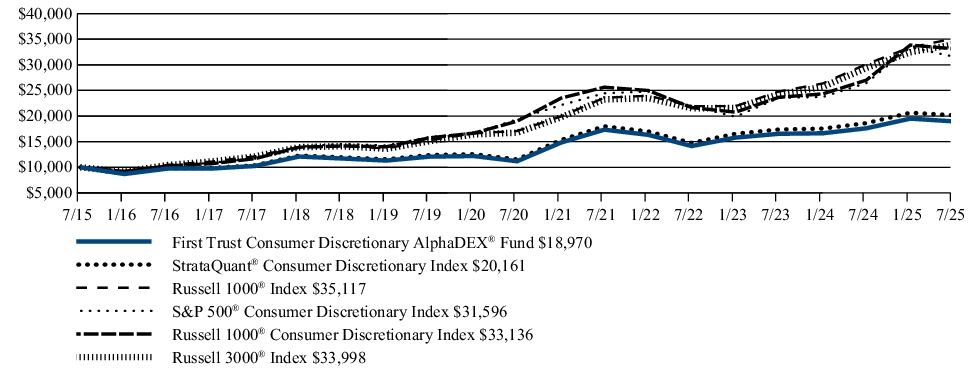
The Fund returned 7.69% during the 12 months ended July 31, 2025. The Fund underperformed its benchmark, the S&P 500® Consumer Discretionary Index, which returned 19.54% for the same Period.
During the Period, investments in the Hotels, Restaurants & Leisure industry received the greatest allocation of any industry with an average weight of 17.8% and a contribution of 3.3% to the Fund’s overall return. With an average weight of 8.1%, investments in the Entertainment industry contributed 4.6% to the Fund’s overall return, which was the greatest return contribution of any industry. With an average weight of 8.0%, investments in the Textiles, Apparel & Luxury Goods industry contributed -0.9% to the Fund’s overall return, which was the most negative return contribution of any industry.
FUND PERFORMANCE (July 31, 2015 to July 31, 2025)
The performance line graph below shows the performance of a hypothetical $10,000 initial investment in the Fund over a ten-year period (or for the life of the Fund, if shorter). The subsequent account value as of the end of the Period is listed next to the name of the Fund or index, as applicable. The performance table below shows the average annual total returns of the Fund for the past one-, five-, and ten-year periods, as applicable (or for the life of the Fund, if shorter), as of the end of the Period. Both the line graph and performance table compare the Fund’s performance to an appropriate broad-based index and may compare to additional indices reflecting the market segment(s) in which the Fund invests over the same periods.
Investment Performance of $10,000
| Average Annual Total Returns (as of July 31, 2025) | 1 Year | 5 Year | 10 Year |
| First Trust Consumer Discretionary AlphaDEX® Fund | 7.69% | 11.13% | 6.61% |
| StrataQuant® Consumer Discretionary Index | 8.26% | 11.80% | 7.26% |
| Russell 1000® Index | 16.54% | 15.49% | 13.38% |
| S&P 500® Consumer Discretionary Index | 19.54% | 10.32% | 12.19% |
| Russell 1000® Consumer Discretionary Index | 22.68% | 11.78% | 12.73% |
| Russell 3000® Index | 15.68% | 15.19% | 13.02% |
Visit www.ftportfolios.com/etf/FXD for more recent performance information.
KEY FUND STATISTICS (As of July 31, 2025)
| Fund net assets | $319,912,691 |
| Total number of portfolio holdings | 123 |
| Total advisory fee paid | $5,636,999 |
| Portfolio turnover rate | 68% |
WHAT DID THE FUND INVEST IN? (As of July 31, 2025)
The tables below show the investment makeup of the Fund, representing the percentage of total investments of the Fund.
Top Ten Holdings
| ROBLOX Corp., Class A | 1.9% |
| Gentex Corp. | 1.7% |
| Carvana Co. | 1.6% |
| Dillard’s, Inc., Class A | 1.6% |
| D.R. Horton, Inc. | 1.6% |
| Viking Holdings Ltd. | 1.6% |
| General Motors Co. | 1.5% |
| Macy’s, Inc. | 1.5% |
| PulteGroup, Inc. | 1.5% |
| PVH Corp. | 1.5% |
Sector Allocation
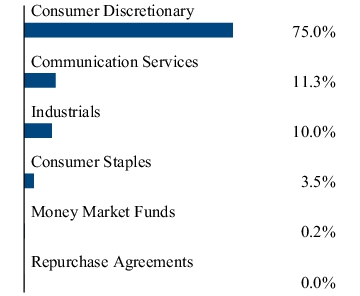
Any amount shown as 0.0% represents less than 0.1%.
Top Ten Holdings
| ROBLOX Corp., Class A | 1.9% |
| Gentex Corp. | 1.7% |
| Carvana Co. | 1.6% |
| Dillard’s, Inc., Class A | 1.6% |
| D.R. Horton, Inc. | 1.6% |
| Viking Holdings Ltd. | 1.6% |
| General Motors Co. | 1.5% |
| Macy’s, Inc. | 1.5% |
| PulteGroup, Inc. | 1.5% |
| PVH Corp. | 1.5% |
WHAT WERE THE FUND COSTS FOR THE LAST YEAR?
(Based on a hypothetical $10,000 investment)
| Fund | Costs of a $10,000 investment | Costs paid as a percentage of a $10,000 investment |
| First Trust Consumer Staples AlphaDEX® Fund | $62 | 0.63% |
HOW DID THE FUND PERFORM LAST YEAR? WHAT AFFECTED THE FUND’S PERFORMANCE?
The Fund returned -2.69% during the 12 months ended July 31, 2025. The Fund underperformed its benchmark, the S&P 500® Consumer Staples Index, which returned 7.43% for the same Period.
During the Period, investments in the Food Products industry received the greatest allocation of any industry with an average weight of 48.4% and contributed -4.0% to the Fund’s overall return, which was the most negative contribution of any industry. With an average weight of 16.9%, investments in the Consumer Staples Distribution & Retail industry contributed 2.9% to the Fund’s overall return, which was the greatest return contribution of any industry.
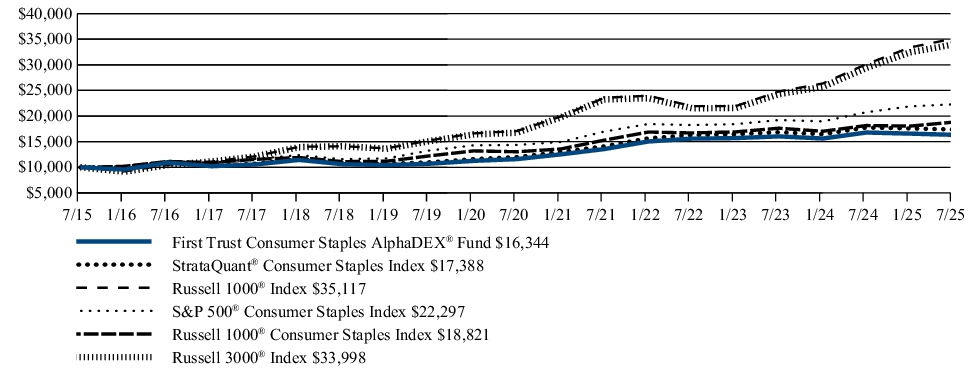
FUND PERFORMANCE (July 31, 2015 to July 31, 2025)
The performance line graph below shows the performance of a hypothetical $10,000 initial investment in the Fund over a ten-year period (or for the life of the Fund, if shorter). The subsequent account value as of the end of the Period is listed next to the name of the Fund or index, as applicable. The performance table below shows the average annual total returns of the Fund for the past one-, five-, and ten-year periods, as applicable (or for the life of the Fund, if shorter), as of the end of the Period. Both the line graph and performance table compare the Fund’s performance to an appropriate broad-based index and may compare to additional indices reflecting the market segment(s) in which the Fund invests over the same periods.
Investment Performance of $10,000
| Average Annual Total Returns (as of July 31, 2025) | 1 Year | 5 Year | 10 Year |
| First Trust Consumer Staples AlphaDEX® Fund | -2.69% | 7.08% | 5.04% |
| StrataQuant® Consumer Staples Index | -2.08% | 7.69% | 5.69% |
| Russell 1000® Index | 16.54% | 15.49% | 13.38% |
| S&P 500® Consumer Staples Index | 7.43% | 9.19% | 8.35% |
| Russell 1000® Consumer Staples Index | 3.68% | 7.62% | 6.53% |
| Russell 3000® Index | 15.68% | 15.19% | 13.02% |
Visit www.ftportfolios.com/etf/FXG for more recent performance information.
KEY FUND STATISTICS (As of July 31, 2025)
| Fund net assets | $284,384,336 |
| Total number of portfolio holdings | 45 |
| Total advisory fee paid | $1,717,342 |
| Portfolio turnover rate | 81% |
WHAT DID THE FUND INVEST IN? (As of July 31, 2025)
The tables below show the investment makeup of the Fund, representing the percentage of total investments of the Fund.
Top Ten Holdings
| Kraft Heinz (The) Co. | 4.5% |
| Pilgrim’s Pride Corp. | 4.4% |
| Casey’s General Stores, Inc. | 4.3% |
| Molson Coors Beverage Co., Class B | 4.2% |
| Bunge Global S.A. | 4.2% |
| Cencora, Inc. | 4.0% |
| McKesson Corp. | 4.0% |
| Sprouts Farmers Market, Inc. | 3.9% |
| Performance Food Group Co. | 3.8% |
| Reynolds Consumer Products, Inc. | 3.5% |
Sector Allocation
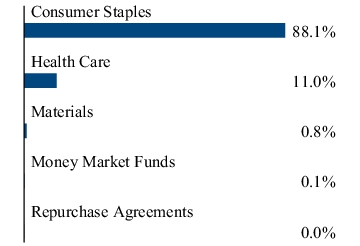
Any amount shown as 0.0% represents less than 0.1%.
Top Ten Holdings
| Kraft Heinz (The) Co. | 4.5% |
| Pilgrim’s Pride Corp. | 4.4% |
| Casey’s General Stores, Inc. | 4.3% |
| Molson Coors Beverage Co., Class B | 4.2% |
| Bunge Global S.A. | 4.2% |
| Cencora, Inc. | 4.0% |
| McKesson Corp. | 4.0% |
| Sprouts Farmers Market, Inc. | 3.9% |
| Performance Food Group Co. | 3.8% |
| Reynolds Consumer Products, Inc. | 3.5% |
WHAT WERE THE FUND COSTS FOR THE LAST YEAR?
(Based on a hypothetical $10,000 investment)
| Fund | Costs of a $10,000 investment | Costs paid as a percentage of a $10,000 investment |
| First Trust Energy AlphaDEX® Fund | $59 | 0.63% |
HOW DID THE FUND PERFORM LAST YEAR? WHAT AFFECTED THE FUND’S PERFORMANCE?
The Fund returned -11.32% during the 12 months ended July 31, 2025. The Fund underperformed its benchmark, the S&P 500® Energy Index, which returned -3.19% for the same Period.
During the Period, investments in the Oil, Gas & Consumable Fuels industry received the greatest allocation of any industry with an average weight of 83.8% and contributed -7.3% to the Fund’s overall return, which was the most negative return contribution of any industry. With an average weight of 2.8%, investments in the Semiconductors & Semiconductor Equipment industry contributed 0.2% to the Fund’s overall return, which was the greatest return contribution of any industry.
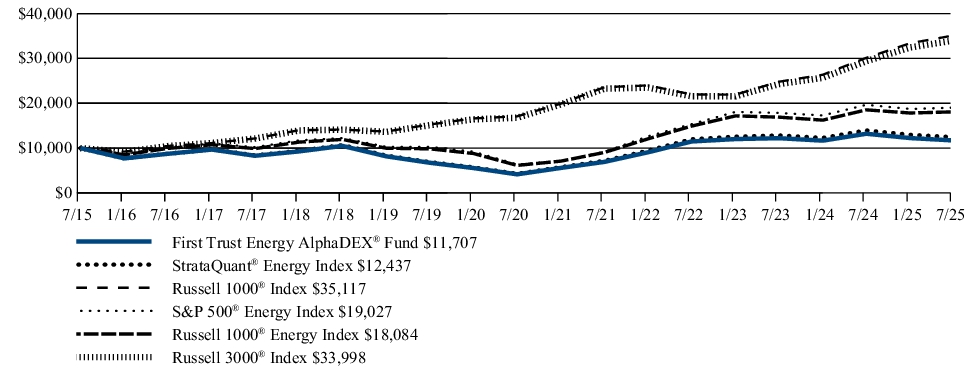
FUND PERFORMANCE (July 31, 2015 to July 31, 2025)
The performance line graph below shows the performance of a hypothetical $10,000 initial investment in the Fund over a ten-year period (or for the life of the Fund, if shorter). The subsequent account value as of the end of the Period is listed next to the name of the Fund or index, as applicable. The performance table below shows the average annual total returns of the Fund for the past one-, five-, and ten-year periods, as applicable (or for the life of the Fund, if shorter), as of the end of the Period. Both the line graph and performance table compare the Fund’s performance to an appropriate broad-based index and may compare to additional indices reflecting the market segment(s) in which the Fund invests over the same periods.
Investment Performance of $10,000
| Average Annual Total Returns (as of July 31, 2025) | 1 Year | 5 Year | 10 Year |
| First Trust Energy AlphaDEX® Fund | -11.32% | 23.01% | 1.59% |
| StrataQuant® Energy Index | -10.79% | 23.91% | 2.21% |
| Russell 1000® Index | 16.54% | 15.49% | 13.38% |
| S&P 500® Energy Index | -3.19% | 24.55% | 6.64% |
| Russell 1000® Energy Index | -2.40% | 24.10% | 6.10% |
| Russell 3000® Index | 15.68% | 15.19% | 13.02% |
Visit www.ftportfolios.com/etf/FXN for more recent performance information.
KEY FUND STATISTICS (As of July 31, 2025)
| Fund net assets | $271,958,045 |
| Total number of portfolio holdings | 44 |
| Total advisory fee paid | $1,849,310 |
| Portfolio turnover rate | 50% |
WHAT DID THE FUND INVEST IN? (As of July 31, 2025)
The tables below show the investment makeup of the Fund, representing the percentage of total investments of the Fund.
Top Ten Holdings
| Chord Energy Corp. | 5.2% |
| Civitas Resources, Inc. | 5.1% |
| Diamondback Energy, Inc. | 5.0% |
| Matador Resources Co. | 4.8% |
| Devon Energy Corp. | 4.8% |
| Permian Resources Corp. | 4.8% |
| NOV, Inc. | 4.6% |
| Weatherford International PLC | 3.6% |
| Halliburton Co. | 3.5% |
| ConocoPhillips | 3.4% |
Sector Allocation
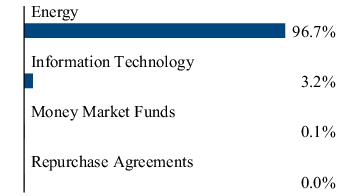
Any amount shown as 0.0% represents less than 0.1%.
Top Ten Holdings
| Chord Energy Corp. | 5.2% |
| Civitas Resources, Inc. | 5.1% |
| Diamondback Energy, Inc. | 5.0% |
| Matador Resources Co. | 4.8% |
| Devon Energy Corp. | 4.8% |
| Permian Resources Corp. | 4.8% |
| NOV, Inc. | 4.6% |
| Weatherford International PLC | 3.6% |
| Halliburton Co. | 3.5% |
| ConocoPhillips | 3.4% |
WHAT WERE THE FUND COSTS FOR THE LAST YEAR?
(Based on a hypothetical $10,000 investment)
| Fund | Costs of a $10,000 investment | Costs paid as a percentage of a $10,000 investment |
| First Trust Financials AlphaDEX® Fund | $65 | 0.60% |
HOW DID THE FUND PERFORM LAST YEAR? WHAT AFFECTED THE FUND’S PERFORMANCE?
The Fund returned 15.31% during the 12 months ended July 31, 2025. The Fund underperformed its benchmark, the S&P 500® Financials Index, which returned 21.54% for the same Period.
During the Period, investments in the Insurance industry received the greatest allocation of any industry with an average weight of 32.9% and contributed 3.1% to the Fund’s overall return. With an average weight of 28.5%, investments in the Capital Markets industry contributed 6.5% to the Fund’s overall return, which was the greatest return contribution of any industry. No industry had a negative contribution to overall Fund return.
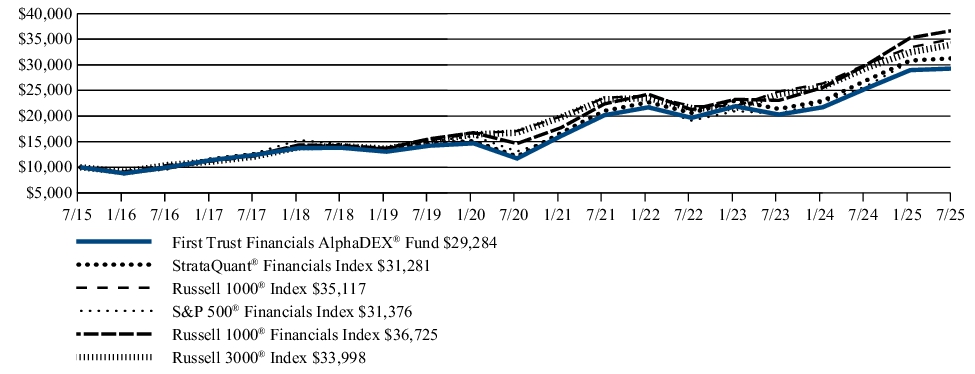
FUND PERFORMANCE (July 31, 2015 to July 31, 2025)
The performance line graph below shows the performance of a hypothetical $10,000 initial investment in the Fund over a ten-year period (or for the life of the Fund, if shorter). The subsequent account value as of the end of the Period is listed next to the name of the Fund or index, as applicable. The performance table below shows the average annual total returns of the Fund for the past one-, five-, and ten-year periods, as applicable (or for the life of the Fund, if shorter), as of the end of the Period. Both the line graph and performance table compare the Fund’s performance to an appropriate broad-based index and may compare to additional indices reflecting the market segment(s) in which the Fund invests over the same periods.
Investment Performance of $10,000
| Average Annual Total Returns (as of July 31, 2025) | 1 Year | 5 Year | 10 Year |
| First Trust Financials AlphaDEX® Fund | 15.31% | 20.09% | 11.34% |
| StrataQuant® Financials Index | 16.02% | 20.86% | 12.08% |
| Russell 1000® Index | 16.54% | 15.49% | 13.38% |
| S&P 500® Financials Index | 21.54% | 19.09% | 12.11% |
| Russell 1000® Financials Index | 22.47% | 20.20% | 13.89% |
| Russell 3000® Index | 15.68% | 15.19% | 13.02% |
Visit www.ftportfolios.com/etf/FXO for more recent performance information.
KEY FUND STATISTICS (As of July 31, 2025)
| Fund net assets | $2,184,967,852 |
| Total number of portfolio holdings | 110 |
| Total advisory fee paid | $8,359,923 |
| Portfolio turnover rate | 90% |
WHAT DID THE FUND INVEST IN? (As of July 31, 2025)
The tables below show the investment makeup of the Fund, representing the percentage of total investments of the Fund.
Top Ten Holdings
| Invesco Ltd. | 2.1% |
| SoFi Technologies, Inc. | 1.9% |
| Interactive Brokers Group, Inc., Class A | 1.8% |
| Bank of New York Mellon (The) Corp. | 1.7% |
| Lincoln National Corp. | 1.7% |
| Citigroup, Inc. | 1.7% |
| Robinhood Markets, Inc., Class A | 1.7% |
| Coinbase Global, Inc., Class A | 1.7% |
| LPL Financial Holdings, Inc. | 1.6% |
| T. Rowe Price Group, Inc. | 1.6% |
Sector Allocation
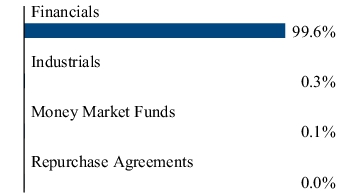
Any amount shown as 0.0% represents less than 0.1%.
Top Ten Holdings
| Invesco Ltd. | 2.1% |
| SoFi Technologies, Inc. | 1.9% |
| Interactive Brokers Group, Inc., Class A | 1.8% |
| Bank of New York Mellon (The) Corp. | 1.7% |
| Lincoln National Corp. | 1.7% |
| Citigroup, Inc. | 1.7% |
| Robinhood Markets, Inc., Class A | 1.7% |
| Coinbase Global, Inc., Class A | 1.7% |
| LPL Financial Holdings, Inc. | 1.6% |
| T. Rowe Price Group, Inc. | 1.6% |
WHAT WERE THE FUND COSTS FOR THE LAST YEAR?
(Based on a hypothetical $10,000 investment)
| Fund | Costs of a $10,000 investment | Costs paid as a percentage of a $10,000 investment |
| First Trust Health Care AlphaDEX® Fund | $58 | 0.61% |
HOW DID THE FUND PERFORM LAST YEAR? WHAT AFFECTED THE FUND’S PERFORMANCE?
The Fund returned -9.12% during the 12 months ended July 31, 2025. The Fund outperformed its benchmark, the S&P 500® Health Care Index, which returned -11.32% for the same Period.
During the Period, investments in the Health Care Providers & Services industry received the greatest allocation of any industry with an average weight of 29.9% and contributed -5.0% to the Fund’s overall return, which was the most negative return of any industry. With an average weight of 3.2%, investments in the Health Care Technology industry contributed 1.7% to the Fund’s overall return, which was the greatest return contribution of any industry.
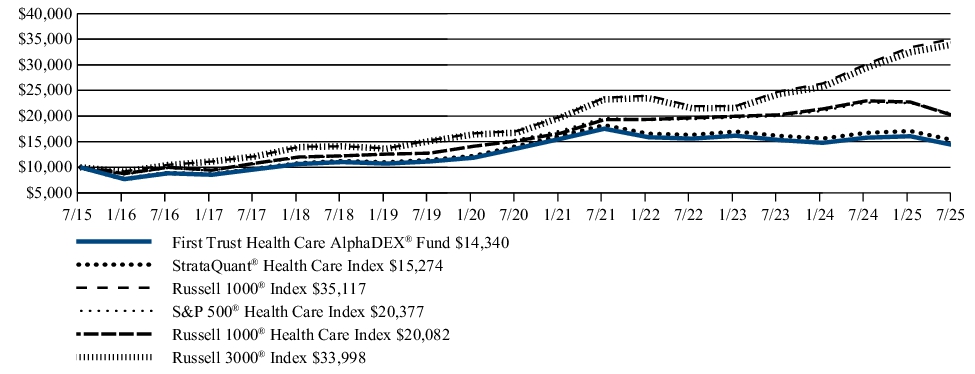
FUND PERFORMANCE (July 31, 2015 to July 31, 2025)
The performance line graph below shows the performance of a hypothetical $10,000 initial investment in the Fund over a ten-year period (or for the life of the Fund, if shorter). The subsequent account value as of the end of the Period is listed next to the name of the Fund or index, as applicable. The performance table below shows the average annual total returns of the Fund for the past one-, five-, and ten-year periods, as applicable (or for the life of the Fund, if shorter), as of the end of the Period. Both the line graph and performance table compare the Fund’s performance to an appropriate broad-based index and may compare to additional indices reflecting the market segment(s) in which the Fund invests over the same periods.
Investment Performance of $10,000
| Average Annual Total Returns (as of July 31, 2025) | 1 Year | 5 Year | 10 Year |
| First Trust Health Care AlphaDEX® Fund | -9.12% | 0.94% | 3.67% |
| StrataQuant® Health Care Index | -8.68% | 1.55% | 4.33% |
| Russell 1000® Index | 16.54% | 15.49% | 13.38% |
| S&P 500® Health Care Index | -11.32% | 6.09% | 7.38% |
| Russell 1000® Health Care Index | -11.23% | 5.40% | 7.22% |
| Russell 3000® Index | 15.68% | 15.19% | 13.02% |
Visit www.ftportfolios.com/etf/FXH for more recent performance information.
KEY FUND STATISTICS (As of July 31, 2025)
| Fund net assets | $845,450,303 |
| Total number of portfolio holdings | 81 |
| Total advisory fee paid | $5,316,835 |
| Portfolio turnover rate | 85% |
WHAT DID THE FUND INVEST IN? (As of July 31, 2025)
The tables below show the investment makeup of the Fund, representing the percentage of total investments of the Fund.
Top Ten Holdings
| Jazz Pharmaceuticals PLC | 2.5% |
| Insmed, Inc. | 2.4% |
| Regeneron Pharmaceuticals, Inc. | 2.4% |
| Biogen, Inc. | 2.3% |
| Zimmer Biomet Holdings, Inc. | 2.3% |
| Avantor, Inc. | 2.3% |
| Merck & Co., Inc. | 2.3% |
| Alnylam Pharmaceuticals, Inc. | 2.2% |
| Acadia Healthcare Co., Inc. | 2.2% |
| Elanco Animal Health, Inc. | 2.2% |
Sector Allocation
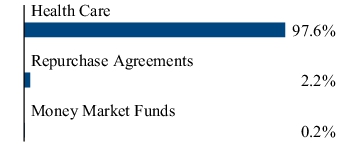
Top Ten Holdings
| Jazz Pharmaceuticals PLC | 2.5% |
| Insmed, Inc. | 2.4% |
| Regeneron Pharmaceuticals, Inc. | 2.4% |
| Biogen, Inc. | 2.3% |
| Zimmer Biomet Holdings, Inc. | 2.3% |
| Avantor, Inc. | 2.3% |
| Merck & Co., Inc. | 2.3% |
| Alnylam Pharmaceuticals, Inc. | 2.2% |
| Acadia Healthcare Co., Inc. | 2.2% |
| Elanco Animal Health, Inc. | 2.2% |
WHAT WERE THE FUND COSTS FOR THE LAST YEAR?
(Based on a hypothetical $10,000 investment)
| Fund | Costs of a $10,000 investment | Costs paid as a percentage of a $10,000 investment |
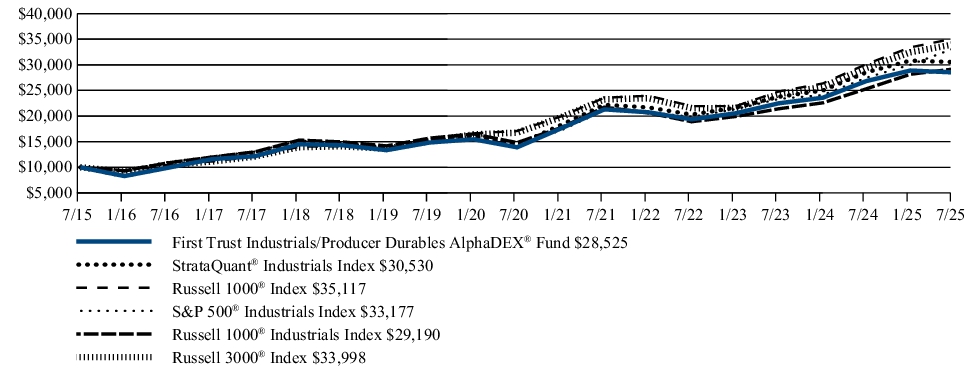
| First Trust Industrials/Producer Durables AlphaDEX® Fund | $62 | 0.60% |
HOW DID THE FUND PERFORM LAST YEAR? WHAT AFFECTED THE FUND’S PERFORMANCE?
The Fund returned 6.30% during the 12 months ended July 31, 2025. The Fund underperformed its benchmark, the S&P 500® Industrials Index, which returned 20.67% for the same Period.
During the Period, investments in the Machinery industry received the greatest allocation of any industry with an average weight of 16.1% and contributed 2.4% to the Fund’s overall return. With an average weight of 10.4%, investments in the Aerospace & Defense industry contributed 3.5% to the Fund’s overall return, the greatest return contribution of any industry. With an average weight of 5.8%, investments in the Containers & Packaging industry contributed -0.7% to the Fund’s overall return, which was the most negative return contribution of any industry.
FUND PERFORMANCE (July 31, 2015 to July 31, 2025)
The performance line graph below shows the performance of a hypothetical $10,000 initial investment in the Fund over a ten-year period (or for the life of the Fund, if shorter). The subsequent account value as of the end of the Period is listed next to the name of the Fund or index, as applicable. The performance table below shows the average annual total returns of the Fund for the past one-, five-, and ten-year periods, as applicable (or for the life of the Fund, if shorter), as of the end of the Period. Both the line graph and performance table compare the Fund’s performance to an appropriate broad-based index and may compare to additional indices reflecting the market segment(s) in which the Fund invests over the same periods.
Investment Performance of $10,000
| Average Annual Total Returns (as of July 31, 2025) | 1 Year | 5 Year | 10 Year |
| First Trust Industrials/Producer Durables AlphaDEX® Fund | 6.30% | 15.45% | 11.05% |
| StrataQuant® Industrials Index | 6.98% | 16.23% | 11.81% |
| Russell 1000® Index | 16.54% | 15.49% | 13.38% |
| S&P 500® Industrials Index | 20.67% | 18.13% | 12.74% |
| Russell 1000® Industrials Index | 15.29% | 14.51% | 11.31% |
| Russell 3000® Index | 15.68% | 15.19% | 13.02% |
Visit www.ftportfolios.com/etf/FXR for more recent performance information.
KEY FUND STATISTICS (As of July 31, 2025)
| Fund net assets | $1,856,646,675 |
| Total number of portfolio holdings | 146 |
| Total advisory fee paid | $9,503,153 |
| Portfolio turnover rate | 76% |
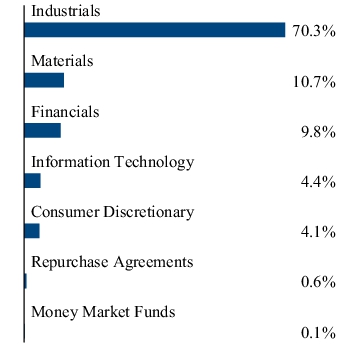
WHAT DID THE FUND INVEST IN? (As of July 31, 2025)
The tables below show the investment makeup of the Fund, representing the percentage of total investments of the Fund.
Top Ten Holdings
| Comfort Systems USA, Inc. | 1.5% |
| Rocket Lab Corp. | 1.5% |
| GE Vernova, Inc. | 1.4% |
| EMCOR Group, Inc. | 1.3% |
| Oshkosh Corp. | 1.3% |
| MasTec, Inc. | 1.3% |
| Eagle Materials, Inc. | 1.3% |
| Trimble, Inc. | 1.3% |
| Mohawk Industries, Inc. | 1.2% |
| Builders FirstSource, Inc. | 1.2% |
Sector Allocation
Top Ten Holdings
| Comfort Systems USA, Inc. | 1.5% |
| Rocket Lab Corp. | 1.5% |
| GE Vernova, Inc. | 1.4% |
| EMCOR Group, Inc. | 1.3% |
| Oshkosh Corp. | 1.3% |
| MasTec, Inc. | 1.3% |
| Eagle Materials, Inc. | 1.3% |
| Trimble, Inc. | 1.3% |
| Mohawk Industries, Inc. | 1.2% |
| Builders FirstSource, Inc. | 1.2% |
WHAT WERE THE FUND COSTS FOR THE LAST YEAR?
(Based on a hypothetical $10,000 investment)
| Fund | Costs of a $10,000 investment | Costs paid as a percentage of a $10,000 investment |
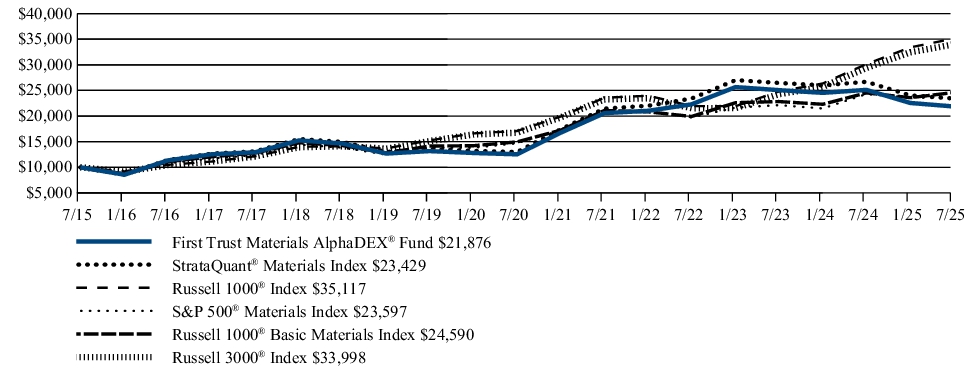
| First Trust Materials AlphaDEX® Fund | $60 | 0.64% |
HOW DID THE FUND PERFORM LAST YEAR? WHAT AFFECTED THE FUND’S PERFORMANCE?
The Fund returned -12.88% during the 12 months ended July 31, 2025. The Fund underperformed its benchmark, the S&P 500® Materials Index, which returned -2.85% for the same Period.
During the Period, investments in the Chemicals industry received the greatest allocation of any industry with an average weight of 52.9% and contributed -12.7% to the Fund’s overall return, which was the most negative return of any industry. With average weights of 2.1% and 32.1%, respectively, investments in the Trading Companies & Distributors and Metals & Mining industries each contributed 0.5% to the Fund’s overall return, which were the greatest return contributions of any industry.
FUND PERFORMANCE (July 31, 2015 to July 31, 2025)
The performance line graph below shows the performance of a hypothetical $10,000 initial investment in the Fund over a ten-year period (or for the life of the Fund, if shorter). The subsequent account value as of the end of the Period is listed next to the name of the Fund or index, as applicable. The performance table below shows the average annual total returns of the Fund for the past one-, five-, and ten-year periods, as applicable (or for the life of the Fund, if shorter), as of the end of the Period. Both the line graph and performance table compare the Fund’s performance to an appropriate broad-based index and may compare to additional indices reflecting the market segment(s) in which the Fund invests over the same periods.
Investment Performance of $10,000
| Average Annual Total Returns (as of July 31, 2025) | 1 Year | 5 Year | 10 Year |
| First Trust Materials AlphaDEX® Fund | -12.88% | 11.77% | 8.14% |
| StrataQuant® Materials Index | -12.24% | 12.52% | 8.89% |
| Russell 1000® Index | 16.54% | 15.49% | 13.38% |
| S&P 500® Materials Index | -2.85% | 9.94% | 8.96% |
| Russell 1000® Basic Materials Index | 0.27% | 10.44% | 9.41% |
| Russell 3000® Index | 15.68% | 15.19% | 13.02% |
Visit www.ftportfolios.com/etf/FXZ for more recent performance information.
KEY FUND STATISTICS (As of July 31, 2025)
| Fund net assets | $215,703,925 |
| Total number of portfolio holdings | 42 |
| Total advisory fee paid | $1,356,303 |
| Portfolio turnover rate | 62% |
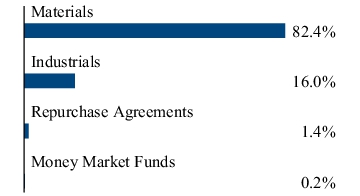
WHAT DID THE FUND INVEST IN? (As of July 31, 2025)
The tables below show the investment makeup of the Fund, representing the percentage of total investments of the Fund.
Top Ten Holdings
| Mueller Industries, Inc. | 5.0% |
| Newmont Corp. | 5.0% |
| Alcoa Corp. | 4.7% |
| Anglogold Ashanti PLC | 4.7% |
| CF Industries Holdings, Inc. | 4.7% |
| Eastman Chemical Co. | 4.5% |
| Carpenter Technology Corp. | 4.2% |
| Timken (The) Co. | 3.9% |
| Westlake Corp. | 3.9% |
| Steel Dynamics, Inc. | 3.7% |
Sector Allocation
Top Ten Holdings
| Mueller Industries, Inc. | 5.0% |
| Newmont Corp. | 5.0% |
| Alcoa Corp. | 4.7% |
| Anglogold Ashanti PLC | 4.7% |
| CF Industries Holdings, Inc. | 4.7% |
| Eastman Chemical Co. | 4.5% |
| Carpenter Technology Corp. | 4.2% |
| Timken (The) Co. | 3.9% |
| Westlake Corp. | 3.9% |
| Steel Dynamics, Inc. | 3.7% |
WHAT WERE THE FUND COSTS FOR THE LAST YEAR?
(Based on a hypothetical $10,000 investment)
| Fund | Costs of a $10,000 investment | Costs paid as a percentage of a $10,000 investment |
| First Trust Technology AlphaDEX® Fund | $66 | 0.60% |
HOW DID THE FUND PERFORM LAST YEAR? WHAT AFFECTED THE FUND’S PERFORMANCE?
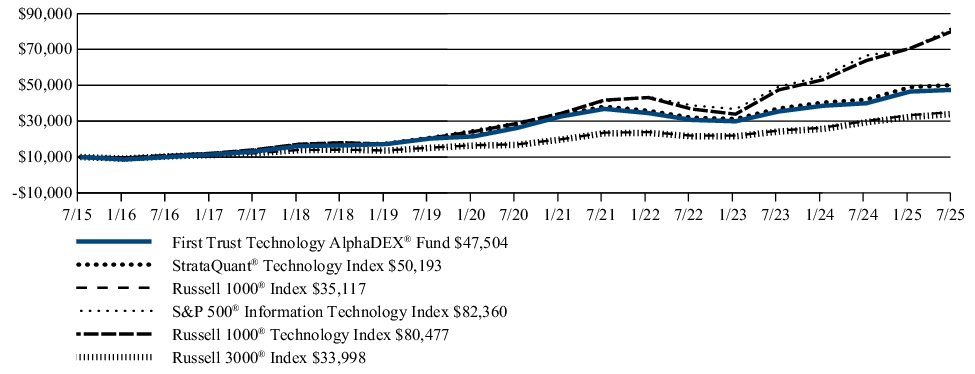
The Fund returned 18.71% during the 12 months ended July 31, 2025. The Fund underperformed its benchmark, the S&P 500® Information Technology Index, which returned 23.65% for the same Period.
During the Period, investments in the Software industry received the greatest allocation of any industry with an average weight of 32.2% and contributed 11.1% to the Fund’s overall return, which was the greatest return contribution of any industry. With an average weight of 18.5%, investments in the Semiconductors & Semiconductor Equipment industry contributed -1.8% to the Fund’s overall return, which was the most negative contribution of any industry.
FUND PERFORMANCE (July 31, 2015 to July 31, 2025)
The performance line graph below shows the performance of a hypothetical $10,000 initial investment in the Fund over a ten-year period (or for the life of the Fund, if shorter). The subsequent account value as of the end of the Period is listed next to the name of the Fund or index, as applicable. The performance table below shows the average annual total returns of the Fund for the past one-, five-, and ten-year periods, as applicable (or for the life of the Fund, if shorter), as of the end of the Period. Both the line graph and performance table compare the Fund’s performance to an appropriate broad-based index and may compare to additional indices reflecting the market segment(s) in which the Fund invests over the same periods.
Investment Performance of $10,000
| Average Annual Total Returns (as of July 31, 2025) | 1 Year | 5 Year | 10 Year |
| First Trust Technology AlphaDEX® Fund | 18.71% | 12.59% | 16.86% |
| StrataQuant Technology® Index | 19.52% | 13.23% | 17.51% |
| Russell 1000® Index | 16.54% | 15.49% | 13.38% |
| S&P 500® Information Technology Index | 23.65% | 22.92% | 23.47% |
| Russell 1000® Technology Index | 26.14% | 22.86% | 23.19% |
| Russell 3000® Index | 15.68% | 15.19% | 13.02% |
Visit www.ftportfolios.com/etf/FXL for more recent performance information.
KEY FUND STATISTICS (As of July 31, 2025)
| Fund net assets | $1,372,093,245 |
| Total number of portfolio holdings | 105 |
| Total advisory fee paid | $6,696,104 |
| Portfolio turnover rate | 104% |
WHAT DID THE FUND INVEST IN? (As of July 31, 2025)
The tables below show the investment makeup of the Fund, representing the percentage of total investments of the Fund.
Top Ten Holdings
| Super Micro Computer, Inc. | 2.0% |
| Palantir Technologies, Inc., Class A | 1.9% |
| Vertiv Holdings Co., Class A | 1.9% |
| Toast, Inc., Class A | 1.8% |
| Pegasystems, Inc. | 1.8% |
| Amphenol Corp., Class A | 1.8% |
| Amkor Technology, Inc. | 1.8% |
| Broadcom, Inc. | 1.7% |
| Cloudflare, Inc., Class A | 1.7% |
| Rubrik, Inc., Class A | 1.7% |
Sector Allocation
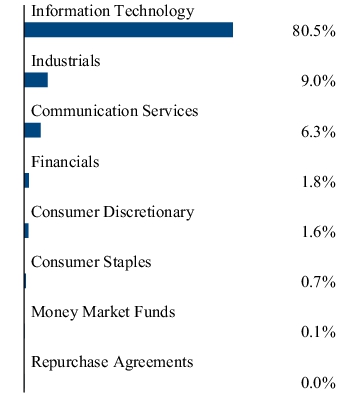
Any amount shown as 0.0% represents less than 0.1%.
Top Ten Holdings
| Super Micro Computer, Inc. | 2.0% |
| Palantir Technologies, Inc., Class A | 1.9% |
| Vertiv Holdings Co., Class A | 1.9% |
| Toast, Inc., Class A | 1.8% |
| Pegasystems, Inc. | 1.8% |
| Amphenol Corp., Class A | 1.8% |
| Amkor Technology, Inc. | 1.8% |
| Broadcom, Inc. | 1.7% |
| Cloudflare, Inc., Class A | 1.7% |
| Rubrik, Inc., Class A | 1.7% |
WHAT WERE THE FUND COSTS FOR THE LAST YEAR?
(Based on a hypothetical $10,000 investment)
| Fund | Costs of a $10,000 investment | Costs paid as a percentage of a $10,000 investment |
| First Trust Utilities AlphaDEX® Fund | $70 | 0.61% |
HOW DID THE FUND PERFORM LAST YEAR? WHAT AFFECTED THE FUND’S PERFORMANCE?
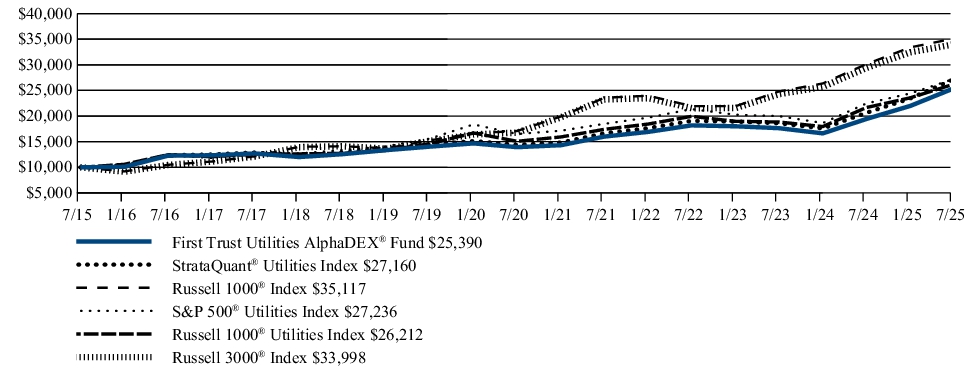
The Fund returned 30.64% during the 12 months ended July 31, 2025. The Fund outperformed its benchmark, the S&P 500® Utilities Index, which returned 21.26% for the same Period.
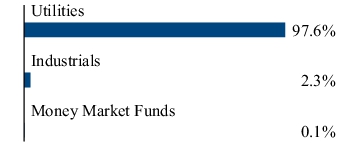
During the Period, investments in the Electric Utilities industry received the greatest allocation of any industry with an average weight of 50.4% and contributed 15.3% to the Fund’s overall return, which was the greatest return contribution of any industry. With an average weight of 3.7%, investments in the Water Utilities industry contributed -0.1% to the Fund’s overall return, the only negative return contribution of any industry.
FUND PERFORMANCE (July 31, 2015 to July 31, 2025)
The performance line graph below shows the performance of a hypothetical $10,000 initial investment in the Fund over a ten-year period (or for the life of the Fund, if shorter). The subsequent account value as of the end of the Period is listed next to the name of the Fund or index, as applicable. The performance table below shows the average annual total returns of the Fund for the past one-, five-, and ten-year periods, as applicable (or for the life of the Fund, if shorter), as of the end of the Period. Both the line graph and performance table compare the Fund’s performance to an appropriate broad-based index and may compare to additional indices reflecting the market segment(s) in which the Fund invests over the same periods.
Investment Performance of $10,000
| Average Annual Total Returns (as of July 31, 2025) | 1 Year | 5 Year | 10 Year |
| First Trust Utilities AlphaDEX® Fund | 30.64% | 12.74% | 9.77% |
| StrataQuant® Utilities Index | 31.67% | 13.55% | 10.51% |
| Russell 1000® Index | 16.54% | 15.49% | 13.38% |
| S&P 500® Utilities Index | 21.26% | 10.54% | 10.54% |
| Russell 1000® Utilities Index | 21.02% | 11.69% | 10.12% |
| Russell 3000® Index | 15.68% | 15.19% | 13.02% |
Visit www.ftportfolios.com/etf/FXU for more recent performance information.
KEY FUND STATISTICS (As of July 31, 2025)
| Fund net assets | $1,705,014,935 |
| Total number of portfolio holdings | 41 |
| Total advisory fee paid | $3,770,101 |
| Portfolio turnover rate | 68% |
WHAT DID THE FUND INVEST IN? (As of July 31, 2025)
The tables below show the investment makeup of the Fund, representing the percentage of total investments of the Fund.
Top Ten Holdings
| Sempra | 4.3% |
| Vistra Corp. | 4.3% |
| NRG Energy, Inc. | 4.1% |
| Exelon Corp. | 4.1% |
| Evergy, Inc. | 4.1% |
| Edison International | 4.0% |
| PG&E Corp. | 4.0% |
| AES (The) Corp. | 4.0% |
| UGI Corp. | 3.9% |
| Xcel Energy, Inc. | 3.4% |
Sector Allocation
Top Ten Holdings
| Sempra | 4.3% |
| Vistra Corp. | 4.3% |
| NRG Energy, Inc. | 4.1% |
| Exelon Corp. | 4.1% |
| Evergy, Inc. | 4.1% |
| Edison International | 4.0% |
| PG&E Corp. | 4.0% |
| AES (The) Corp. | 4.0% |
| UGI Corp. | 3.9% |
| Xcel Energy, Inc. | 3.4% |
WHAT WERE THE FUND COSTS FOR THE LAST YEAR?
(Based on a hypothetical $10,000 investment)
| Fund | Costs of a $10,000 investment | Costs paid as a percentage of a $10,000 investment |
| First Trust Mid Cap Growth AlphaDEX® Fund | $74 | 0.70% |
HOW DID THE FUND PERFORM LAST YEAR? WHAT AFFECTED THE FUND’S PERFORMANCE?
The Fund returned 10.64% during the 12 months ended July 31, 2025. The Fund outperformed its benchmark, the S&P MidCap 400® Growth Index, which returned 2.24% for the same Period.
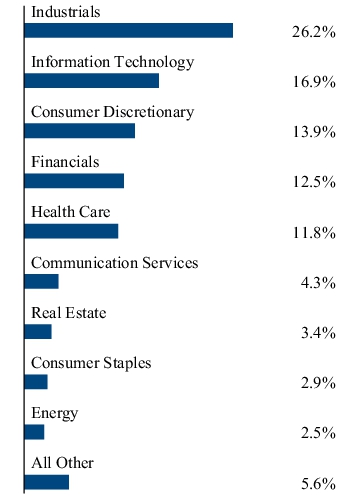
During the Period, investments in the Industrials sector received the greatest allocation of any sector, with an average weight of 21.8%, and contributed 4.4% to the Fund’s overall return, which was the greatest of any sector. Investments in the Materials sector, with an average weight of 4.0%, contributed -0.4% to the Fund’s overall return, which was the most negative contribution of any sector.
FUND PERFORMANCE (July 31, 2015 to July 31, 2025)
The performance line graph below shows the performance of a hypothetical $10,000 initial investment in the Fund over a ten-year period (or for the life of the Fund, if shorter). The subsequent account value as of the end of the Period is listed next to the name of the Fund or index, as applicable. The performance table below shows the average annual total returns of the Fund for the past one-, five-, and ten-year periods, as applicable (or for the life of the Fund, if shorter), as of the end of the Period. Both the line graph and performance table compare the Fund’s performance to an appropriate broad-based index and may compare to additional indices reflecting the market segment(s) in which the Fund invests over the same periods.
Investment Performance of $10,000
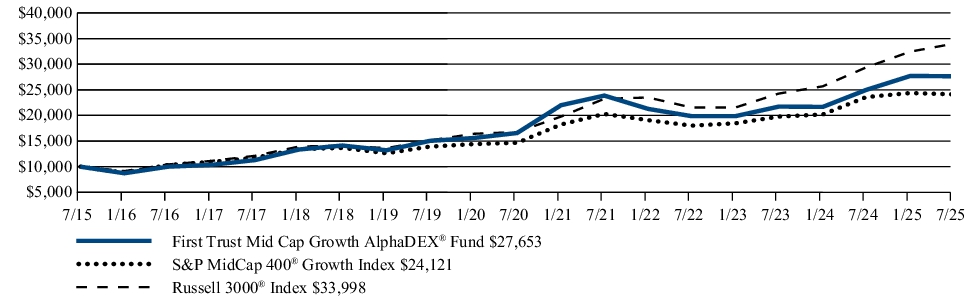
| Average Annual Total Returns (as of July 31, 2025) | 1 Year | 5 Year | 10 Year |
| First Trust Mid Cap Growth AlphaDEX® Fund | 10.64% | 10.77% | 10.71% |
| Nasdaq AlphaDEX Mid Cap GrowthTMIndex(1) | 11.48% | 11.59% | |
| Nasdaq US 600 Mid Cap GrowthTMIndex(1) | 10.40% | 7.69% | |
| S&P MidCap 400® Growth Index | 2.24% | 10.46% | 9.20% |
| Russell 3000® Index | 15.68% | 15.19% | 13.02% |
|
(1)
|
Performance data is not available for all the periods shown in the table for the index because performance data does not exist for some of the entire periods.
|
Visit www.ftportfolios.com/etf/FNY for more recent performance information.
KEY FUND STATISTICS (As of July 31, 2025)
| Fund net assets | $400,286,368 |
| Total number of portfolio holdings | 230 |
| Total advisory fee paid | $2,614,936 |
| Portfolio turnover rate | 130% |
WHAT DID THE FUND INVEST IN? (As of July 31, 2025)
The tables below show the investment makeup of the Fund, representing the percentage of total investments of the Fund.
Top Ten Holdings
| Bloom Energy Corp., Class A | 1.1% |
| Hims & Hers Health, Inc. | 0.9% |
| Talen Energy Corp. | 0.9% |
| Rocket Lab Corp. | 0.9% |
| Upstart Holdings, Inc. | 0.9% |
| Kratos Defense & Security Solutions, Inc. | 0.9% |
| Primoris Services Corp. | 0.9% |
| Credo Technology Group Holding Ltd. | 0.9% |
| IES Holdings, Inc. | 0.8% |
| Sterling Infrastructure, Inc. | 0.8% |
Sector Allocation
Top Ten Holdings
| Bloom Energy Corp., Class A | 1.1% |
| Hims & Hers Health, Inc. | 0.9% |
| Talen Energy Corp. | 0.9% |
| Rocket Lab Corp. | 0.9% |
| Upstart Holdings, Inc. | 0.9% |
| Kratos Defense & Security Solutions, Inc. | 0.9% |
| Primoris Services Corp. | 0.9% |
| Credo Technology Group Holding Ltd. | 0.9% |
| IES Holdings, Inc. | 0.8% |
| Sterling Infrastructure, Inc. | 0.8% |
WHAT WERE THE FUND COSTS FOR THE LAST YEAR?
(Based on a hypothetical $10,000 investment)
| Fund | Costs of a $10,000 investment | Costs paid as a percentage of a $10,000 investment |
| First Trust Mid Cap Value AlphaDEX® Fund | $69 | 0.70% |
HOW DID THE FUND PERFORM LAST YEAR? WHAT AFFECTED THE FUND’S PERFORMANCE?
The Fund returned -4.02% during the 12 months ended July 31, 2025. The Fund underperformed its benchmark, the S&P MidCap 400® Value Index, which returned 4.32% for the same Period.
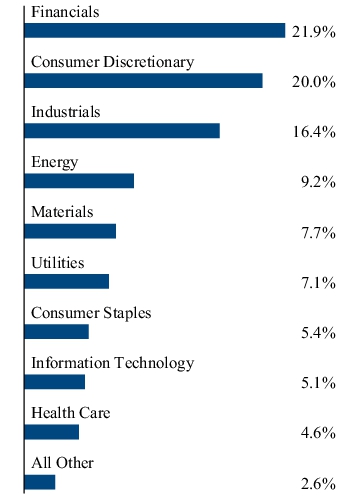
During the Period, investments in the Financials sector received the greatest allocation of any sector, with an average weight of 21.8%, and contributed 2.8% to the Fund’s overall return, which was the greatest of any sector. Investments in the Energy sector, with an average weight 11.6%, contributed -3.7% to the Fund’s overall return, which was the most negative return contribution of any sector.
FUND PERFORMANCE (July 31, 2015 to July 31, 2025)
The performance line graph below shows the performance of a hypothetical $10,000 initial investment in the Fund over a ten-year period (or for the life of the Fund, if shorter). The subsequent account value as of the end of the Period is listed next to the name of the Fund or index, as applicable. The performance table below shows the average annual total returns of the Fund for the past one-, five-, and ten-year periods, as applicable (or for the life of the Fund, if shorter), as of the end of the Period. Both the line graph and performance table compare the Fund’s performance to an appropriate broad-based index and may compare to additional indices reflecting the market segment(s) in which the Fund invests over the same periods.
Investment Performance of $10,000
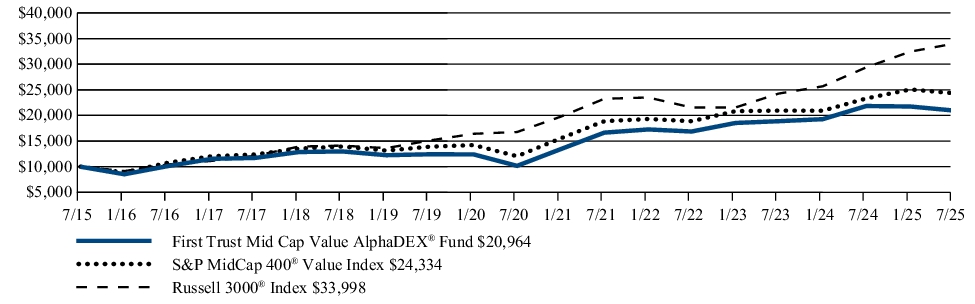
| Average Annual Total Returns (as of July 31, 2025) | 1 Year | 5 Year | 10 Year |
| First Trust Mid Cap Value AlphaDEX® Fund | -4.02% | 15.57% | 7.68% |
| Nasdaq AlphaDEX Mid Cap ValueTMIndex(1) | -3.32% | 16.46% | |
| Nasdaq US 600 Mid Cap ValueTMIndex(1) | -0.54% | 14.07% | |
| S&P MidCap 400® Value Index | 4.32% | 15.11% | 9.30% |
| Russell 3000® Index | 15.68% | 15.19% | 13.02% |
|
(1)
|
Performance data is not available for all the periods shown in the table for the index because performance data does not exist for some of the entire periods.
|
Visit www.ftportfolios.com/etf/FNK for more recent performance information.
KEY FUND STATISTICS (As of July 31, 2025)
| Fund net assets | $191,744,794 |
| Total number of portfolio holdings | 230 |
| Total advisory fee paid | $1,484,777 |
| Portfolio turnover rate | 87% |
WHAT DID THE FUND INVEST IN? (As of July 31, 2025)
The tables below show the investment makeup of the Fund, representing the percentage of total investments of the Fund.
Top Ten Holdings
| Invesco Ltd. | 1.0% |
| Chord Energy Corp. | 0.8% |
| Weatherford International PLC | 0.8% |
| SM Energy Co. | 0.8% |
| Fluor Corp. | 0.8% |
| Civitas Resources, Inc. | 0.8% |
| Murphy Oil Corp. | 0.8% |
| Mohawk Industries, Inc. | 0.8% |
| Macy’s, Inc. | 0.8% |
| Ovintiv, Inc. | 0.8% |
Sector Allocation
Top Ten Holdings
| Invesco Ltd. | 1.0% |
| Chord Energy Corp. | 0.8% |
| Weatherford International PLC | 0.8% |
| SM Energy Co. | 0.8% |
| Fluor Corp. | 0.8% |
| Civitas Resources, Inc. | 0.8% |
| Murphy Oil Corp. | 0.8% |
| Mohawk Industries, Inc. | 0.8% |
| Macy’s, Inc. | 0.8% |
| Ovintiv, Inc. | 0.8% |
WHAT WERE THE FUND COSTS FOR THE LAST YEAR?
(Based on a hypothetical $10,000 investment)
| Fund | Costs of a $10,000 investment | Costs paid as a percentage of a $10,000 investment |
| First Trust Small Cap Growth AlphaDEX® Fund | $75(1) | 0.70%(1) |
|
(1)
|
Excludes any Acquired Fund Fees and Expenses of underlying investment companies in which the Fund invests.
|
HOW DID THE FUND PERFORM LAST YEAR? WHAT AFFECTED THE FUND’S PERFORMANCE?
The Fund returned 12.93% during the 12 months ended July 31, 2025. The Fund outperformed its benchmark, the S&P SmallCap 600® Growth Index, which returned -4.14% for the same Period.
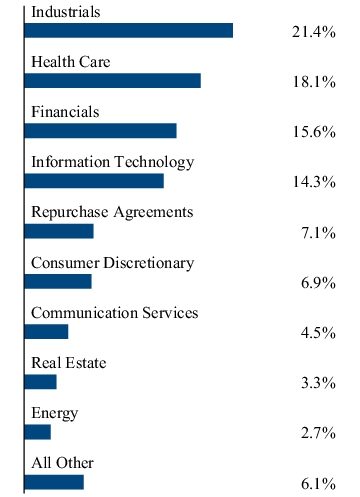
During the Period, the Health Care sector received the greatest allocation of any sector, with an average weight of 20.6%. However, the largest positive contributions to the Fund’s return came from the Industrials sector at 7.1%, and the Financials sector at 5.2%. The largest negative contribution to the Fund’s return came from the Communication Services sector at -0.7%.
FUND PERFORMANCE (July 31, 2015 to July 31, 2025)
The performance line graph below shows the performance of a hypothetical $10,000 initial investment in the Fund over a ten-year period (or for the life of the Fund, if shorter). The subsequent account value as of the end of the Period is listed next to the name of the Fund or index, as applicable. The performance table below shows the average annual total returns of the Fund for the past one-, five-, and ten-year periods, as applicable (or for the life of the Fund, if shorter), as of the end of the Period. Both the line graph and performance table compare the Fund’s performance to an appropriate broad-based index and may compare to additional indices reflecting the market segment(s) in which the Fund invests over the same periods.
Investment Performance of $10,000
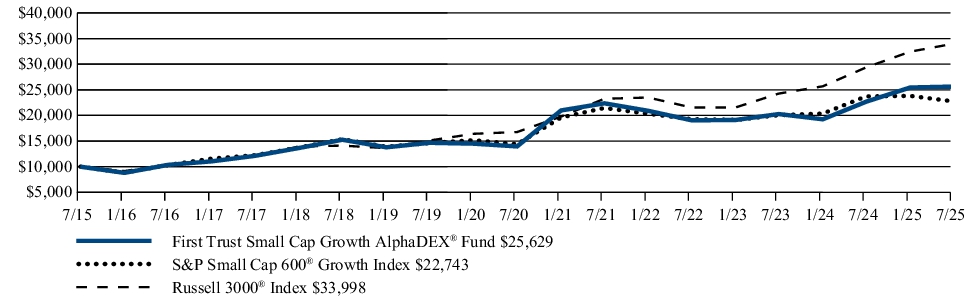
| Average Annual Total Returns (as of July 31, 2025) | 1 Year | 5 Year | 10 Year |
| First Trust Small Cap Growth AlphaDEX® Fund | 12.93% | 12.91% | 9.87% |
| Nasdaq AlphaDEX Small Cap GrowthTMIndex(1) | 13.80% | 13.79% | |
| Nasdaq US 700 Small Cap GrowthTMIndex(1) | 10.53% | 9.60% | |
| S&P SmallCap 600® Growth Index | -4.14% | 9.58% | 8.56% |
| Russell 3000® Index | 15.68% | 15.19% | 13.02% |
|
(1)
|
Performance data is not available for all the periods shown in the table for the index because performance data does not exist for some of the entire periods.
|
Visit www.ftportfolios.com/etf/FYC for more recent performance information.
KEY FUND STATISTICS (As of July 31, 2025)
| Fund net assets | $459,253,167 |
| Total number of portfolio holdings | 269 |
| Total advisory fee paid | $2,878,022 |
| Portfolio turnover rate | 137% |
WHAT DID THE FUND INVEST IN? (As of July 31, 2025)
The tables below show the investment makeup of the Fund, representing the percentage of total investments of the Fund.
Top Ten Holdings
| JPMorgan Chase & Co. | 2.7% |
| Bank of America Corp. | 2.0% |
| Mizuho Financial Group, Inc. | 1.9% |
| Symbotic, Inc. | 0.8% |
| Rush Street Interactive, Inc. | 0.8% |
| DXP Enterprises, Inc. | 0.8% |
| NuScale Power Corp. | 0.7% |
| Centrus Energy Corp., Class A | 0.7% |
| Life360, Inc. | 0.7% |
| Perimeter Solutions, Inc. | 0.7% |
Sector Allocation
Top Ten Holdings
| JPMorgan Chase & Co. | 2.7% |
| Bank of America Corp. | 2.0% |
| Mizuho Financial Group, Inc. | 1.9% |
| Symbotic, Inc. | 0.8% |
| Rush Street Interactive, Inc. | 0.8% |
| DXP Enterprises, Inc. | 0.8% |
| NuScale Power Corp. | 0.7% |
| Centrus Energy Corp., Class A | 0.7% |
| Life360, Inc. | 0.7% |
| Perimeter Solutions, Inc. | 0.7% |
WHAT WERE THE FUND COSTS FOR THE LAST YEAR?
(Based on a hypothetical $10,000 investment)
| Fund | Costs of a $10,000 investment | Costs paid as a percentage of a $10,000 investment |
| First Trust Small Cap Value AlphaDEX® Fund | $66(1) | 0.70%(1) |
|
(1)
|
Excludes any Acquired Fund Fees and Expenses of underlying investment companies in which the Fund invests.
|
HOW DID THE FUND PERFORM LAST YEAR? WHAT AFFECTED THE FUND’S PERFORMANCE?
The Fund returned -10.75% during the 12 months ended July 31, 2025. The Fund underperformed its benchmark, the S&P SmallCap 600® Value Index, which returned -5.45% for the same Period.
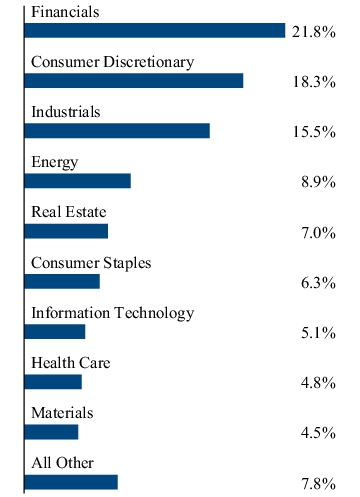
During the Period, almost every sector allocation had a negative contribution to the Fund’s return. The most notable source of negative performance came from the allocations to the Consumer Discretionary sector. Investments in this sector received an average allocation of 18.2% and accounted for a -2.7% hit to the Fund’s overall performance. The sector with the greatest allocation was the Financials sector. Investments in this sector received an average allocation of 24.9% but had contribution to the Fund’s return of only -0.3%. One sector did have a positive contribution to return and that was the Information Technology sector which was a boon for the Fund. While the average allocation to this sector was only 5.5%, the contribution to the Fund’s return was 0.5%.
FUND PERFORMANCE (July 31, 2015 to July 31, 2025)
The performance line graph below shows the performance of a hypothetical $10,000 initial investment in the Fund over a ten-year period (or for the life of the Fund, if shorter). The subsequent account value as of the end of the Period is listed next to the name of the Fund or index, as applicable. The performance table below shows the average annual total returns of the Fund for the past one-, five-, and ten-year periods, as applicable (or for the life of the Fund, if shorter), as of the end of the Period. Both the line graph and performance table compare the Fund’s performance to an appropriate broad-based index and may compare to additional indices reflecting the market segment(s) in which the Fund invests over the same periods.
Investment Performance of $10,000
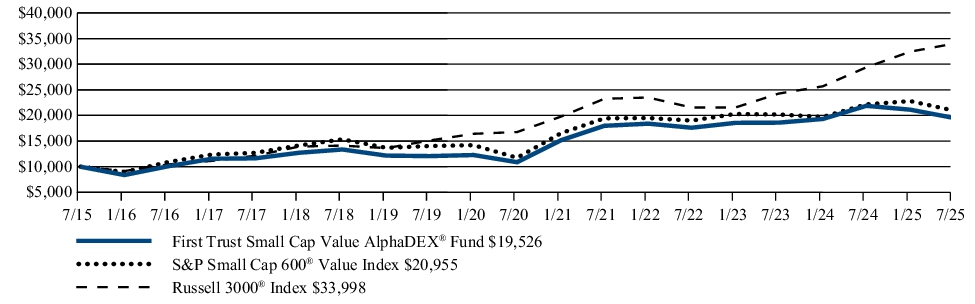
| Average Annual Total Returns (as of July 31, 2025) | 1 Year | 5 Year | 10 Year |
| First Trust Small Cap Value AlphaDEX® Fund | -10.75% | 12.41% | 6.92% |
| Nasdaq AlphaDEX Small Cap ValueTMIndex(1) | -10.04% | 13.31% | |
| Nasdaq US 700 Small Cap ValueTMIndex(1) | -5.97% | 13.07% | |
| S&P SmallCap 600® Value Index | -5.45% | 12.28% | 7.68% |
| Russell 3000® Index | 15.68% | 15.19% | 13.02% |
|
(1)
|
Performance data is not available for all the periods shown in the table for the index because performance data does not exist for some of the entire periods.
|
Visit www.ftportfolios.com/etf/FYT for more recent performance information.
KEY FUND STATISTICS (As of July 31, 2025)
| Fund net assets | $126,113,632 |
| Total number of portfolio holdings | 267 |
| Total advisory fee paid | $1,068,935 |
| Portfolio turnover rate | 113% |
WHAT DID THE FUND INVEST IN? (As of July 31, 2025)
The tables below show the investment makeup of the Fund, representing the percentage of total investments of the Fund.
Top Ten Holdings
| JPMorgan Chase & Co. | 0.8% |
| Kohl’s Corp. | 0.8% |
| Expro Group Holdings N.V. | 0.8% |
| Krispy Kreme, Inc. | 0.8% |
| Forestar Group, Inc. | 0.8% |
| Peabody Energy Corp. | 0.7% |
| Vital Energy, Inc. | 0.7% |
| Fresh Del Monte Produce, Inc. | 0.7% |
| Academy Sports & Outdoors, Inc. | 0.7% |
| American Eagle Outfitters, Inc. | 0.7% |
Sector Allocation
Top Ten Holdings
| JPMorgan Chase & Co. | 0.8% |
| Kohl’s Corp. | 0.8% |
| Expro Group Holdings N.V. | 0.8% |
| Krispy Kreme, Inc. | 0.8% |
| Forestar Group, Inc. | 0.8% |
| Peabody Energy Corp. | 0.7% |
| Vital Energy, Inc. | 0.7% |
| Fresh Del Monte Produce, Inc. | 0.7% |
| Academy Sports & Outdoors, Inc. | 0.7% |
| American Eagle Outfitters, Inc. | 0.7% |
| [1] | Excludes any Acquired Fund Fees and Expenses of underlying investment companies in which the Fund invests. |
| [2] | Excludes any Acquired Fund Fees and Expenses of underlying investment companies in which the Fund invests. |