Shareholder Report
Jul. 31, 2025
USD ($)
Holding
What were the Fund costs for the last year?
(Based on a hypothetical $10,000 investment)
| Class Name | Costs of a $10,000 investment | Costs paid as a percentage of a $10,000 investment |
| Class A | $88 | 0.82% |
How did the Fund perform last year and what affected Fund performance?
- For the fiscal year ended July 31, 2025, the Fund’s Class A shares at NAV returned 14.26%. For the same period, the Fund’s broad-based benchmarks, the MSCI All Country World NR Index and the Bloomberg U.S. Aggregate Bond Total Return Index, returned 15.87% and 3.38%, respectively. The performance benchmark, a blended benchmark (35% MSCI All Country World NR Index and 65% Bloomberg U.S. Aggregate Bond Index), returned 9.22% over the period.
- For the period, equity holdings emerged as the primary performance driver, with a strategically diversified allocation across both domestic and international markets, when compared to the performance benchmark. Additionally, the Fund’s allocations within fixed income to Mortgage Backed Securities (MBS) and US Treasuries both contributed positively to performance over the period, when compared to the performance benchmark.
- During a period marked by strong equity market advances, the Fund’s equity futures hedging strategy served as the primary performance detractor, when compared to the performance benchmark. These futures positions represent a deliberate risk management approach designed to buffer against potential market volatility, which is particularly important given the elevated the Fund’s equity exposure.
Fund Performance
The line graph below shows the change in value of a $10,000 investment made in Class A shares of the Fund at public offering price during the periods shown, compared to that of the MSCI All Country World NR Index, the Bloomberg U.S. Aggregate Bond Total Return Index, and the blended benchmark (65% MSCI All Country World NR Index and 35% Bloomberg U.S. Aggregate Bond Total Return Index).
GROWTH OF $10,000
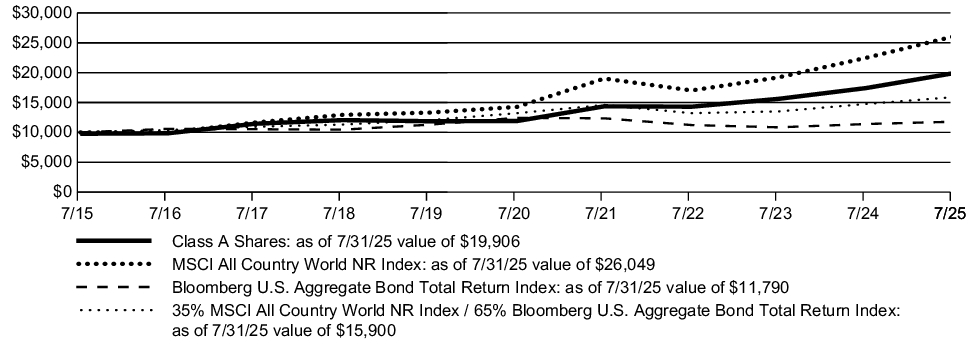
| AVERAGE ANNUAL TOTAL RETURN | 1 Year | 5 Years | 10 Years |
| Class A (with sales charge) | 11.69% | 10.34% | 7.13% |
| Class A (without sales charge) | 14.26% | 10.83% | 7.37% |
| MSCI All Country World NR Index | 15.87% | 12.79% | 10.05% |
| Bloomberg U.S. Aggregate Bond Total Return Index | 3.38% | -1.07% | 1.66% |
| 35% MSCI All Country World NR Index / 65% Bloomberg U.S. Aggregate Bond Total Return Index | 0.30% | 3.76% | 4.75% |
The graph and table do not reflect the deduction of taxes that a shareholder would pay on fund distributions or redemption of fund shares.
KEY FUND STATISTICS
(as of July 31, 2025)
(as of July 31, 2025)
| Fund net assets | $5,642,200,679 |
| Total number of portfolio holdings | 523^^ |
| Total advisory fee paid | $20,411,813 |
| Portfolio turnover rate | 62% |
| ^^ |
Excluding short‑term investments and all derivative contracts except for options purchased. |
SECTOR DISTRIBUTION
(as of July 31, 2025 )*
(as of July 31, 2025 )*
| Financials | 35.6% |
| U.S. Government | 20.9% |
| Information Technology | 6.3% |
| Energy | 6.2% |
| Health Care | 5.4% |
| Basic Materials | 4.6% |
| Industrials | 3.7% |
| Utilities | 3.6% |
| Mortgage Securities | 3.4% |
| Consumer Discretionary | 2.2% |
| Technology | 1.5% |
| Foreign Government | 1.4% |
| Asset Backed Securities | 1.4% |
| Consumer Staples | 1.2% |
| Consumer, Cyclical | 1.1% |
| Materials | 0.5% |
| Real Estate | 0.4% |
| Communication Services | 0.4% |
| Closed-End Funds | 0.2% |
| Consumer, Non‑cyclical† | 0.0% |
| Over The Counter Exchange Traded Put Option Purchased† | 0.0% |
| * |
As a percentage of total investments excluding short-term investments and all derivative contracts except for options purchased. |
| † |
Amount rounds to less than 0.1%. |
Material Fund Changes
Effective May 2, 2025, Pioneer Multi-Asset Income Fund (the “Predecessor Fund”) reorganized with Victory Pioneer Multi-Asset Income Fund (the “Reorganization”) pursuant to an agreement and plan of reorganization approved by the shareholders of the Predecessor Fund on April 28, 2025. The Predecessor Fund is the accounting survivor of the Reorganization. Accordingly, the Predecessor Fund’s performance and financial history have become the performance and financial history of the Fund.
In the Reorganization, shareholders holding Class A and Class R shares of the Predecessor Fund received Class A shares of the Fund.
Victory Capital Management Inc. (the “Adviser”) is the Fund’s investment adviser. Effective April 1, 2025, Amundi Asset Management US, Inc. (“Amundi US”), the Predecessor Fund’s investment adviser, was combined with Victory Capital Holdings, Inc., the parent company of the Adviser. The portfolio managers of Amundi US became employees of the Adviser.
Effective May 2, 2025, Pioneer Multi-Asset Income Fund (the “Predecessor Fund”) reorganized with Victory Pioneer Multi-Asset Income Fund (the “Reorganization”) pursuant to an agreement and plan of reorganization approved by the shareholders of the Predecessor Fund on April 28, 2025. The Predecessor Fund is the accounting survivor of the Reorganization. Accordingly, the Predecessor Fund’s performance and financial history have become the performance and financial history of the Fund.
Victory Capital Management Inc. (the “Adviser”) is the Fund’s investment adviser. Effective April 1, 2025, Amundi Asset Management US, Inc. (“Amundi US”), the Predecessor Fund’s investment adviser, was combined with Victory Capital Holdings, Inc., the parent company of the Adviser. The portfolio managers of Amundi US became employees of the Adviser.
What were the Fund costs for the last year?
(Based on a hypothetical $10,000 investment)
| Class Name | Costs of a $10,000 investment | Costs paid as a percentage of a $10,000 investment |
| Class C | $169 | 1.58% |
How did the Fund perform last year and what affected Fund performance?
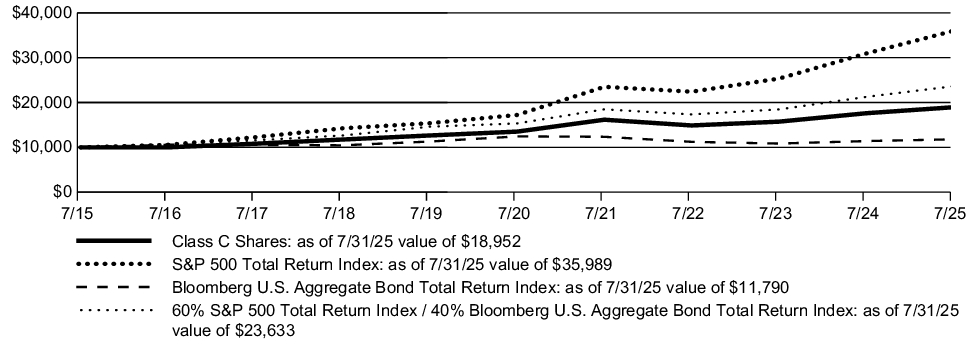
- For the fiscal year ended July 31, 2025, the Fund’s Class C shares at NAV returned 13.34%. For the same period, the Fund’s broad-based benchmarks, the MSCI All Country World NR Index and the Bloomberg U.S. Aggregate Bond Total Return Index, returned 15.87% and 3.38%, respectively. The performance benchmark, a blended benchmark (35% MSCI All Country World NR Index and 65% Bloomberg U.S. Aggregate Bond Index), returned 9.22% over the period.
- For the period, equity holdings emerged as the primary performance driver, with a strategically diversified allocation across both domestic and international markets, when compared to the performance benchmark. Additionally, the Fund’s allocations within fixed income to Mortgage Backed Securities (MBS) and US Treasuries both contributed positively to performance over the period, when compared to the performance benchmark.
- During a period marked by strong equity market advances, the Fund’s equity futures hedging strategy served as the primary performance detractor, when compared to the performance benchmark. These futures positions represent a deliberate risk management approach designed to buffer against potential market volatility, which is particularly important given the elevated the Fund’s equity exposure.
Fund Performance
The line graph below shows the change in value of a $10,000 investment made in Class C shares of the Fund during the periods shown, compared to that of the MSCI All Country World NR Index, the Bloomberg U.S. Aggregate Bond Total Return Index, and the blended benchmark (65% MSCI All Country World NR Index and 35% Bloomberg U.S. Aggregate Bond Total Return Index).
GROWTH OF $10,000
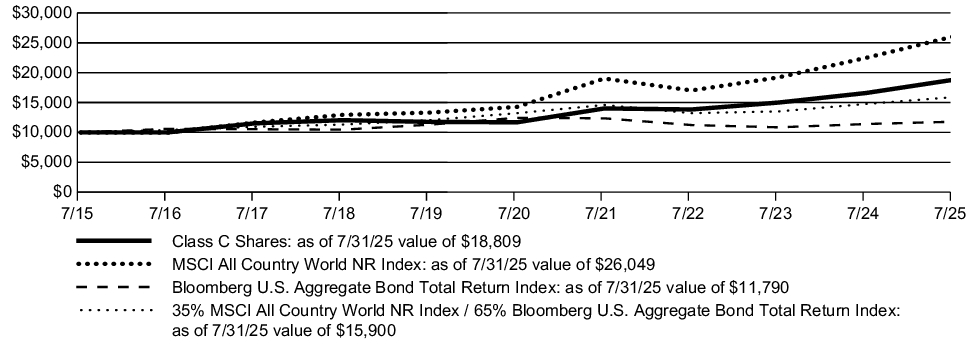
| AVERAGE ANNUAL TOTAL RETURN | 1 Year | 5 Years | 10 Years |
| Class C (with contingent deferred sales charge) | 12.34% | 9.97% | 6.52% |
| Class C (without contingent deferred sales charge) | 13.34% | 9.97% | 6.52% |
| MSCI All Country World NR Index | 15.87% | 12.79% | 10.05% |
| Bloomberg U.S. Aggregate Bond Total Return Index | 3.38% | -1.07% | 1.66% |
| 35% MSCI All Country World NR Index / 65% Bloomberg U.S. Aggregate Bond Total Return Index | 0.30% | 3.76% | 4.75% |
The graph and table do not reflect the deduction of taxes that a shareholder would pay on fund distributions or redemption of fund shares.
KEY FUND STATISTICS
(as of July 31, 2025)
(as of July 31, 2025)
| Fund net assets | $5,642,200,679 |
| Total number of portfolio holdings | 523^^ |
| Total advisory fee paid | $20,411,813 |
| Portfolio turnover rate | 62% |
| ^^ |
Excluding short‑term investments and all derivative contracts except for options purchased. |
SECTOR DISTRIBUTION
(as of July 31, 2025 )*
(as of July 31, 2025 )*
| Financials | 35.6% |
| U.S. Government | 20.9% |
| Information Technology | 6.3% |
| Energy | 6.2% |
| Health Care | 5.4% |
| Basic Materials | 4.6% |
| Industrials | 3.7% |
| Utilities | 3.6% |
| Mortgage Securities | 3.4% |
| Consumer Discretionary | 2.2% |
| Technology | 1.5% |
| Foreign Government | 1.4% |
| Asset Backed Securities | 1.4% |
| Consumer Staples | 1.2% |
| Consumer, Cyclical | 1.1% |
| Materials | 0.5% |
| Real Estate | 0.4% |
| Communication Services | 0.4% |
| Closed-End Funds | 0.2% |
| Consumer, Non‑cyclical† | 0.0% |
| Over The Counter Exchange Traded Put Option Purchased† | 0.0% |
| * |
As a percentage of total investments excluding short-term investments and all derivative contracts except for options purchased. |
| † |
Amount rounds to less than 0.1%. |
Material Fund Changes
Effective May 2, 2025, Pioneer Multi-Asset Income Fund (the “Predecessor Fund”) reorganized with Victory Pioneer Multi-Asset Income Fund (the “Reorganization”) pursuant to an agreement and plan of reorganization approved by the shareholders of the Predecessor Fund on April 28, 2025. The Predecessor Fund is the accounting survivor of the Reorganization. Accordingly, the Predecessor Fund’s performance and financial history have become the performance and financial history of the Fund.
In the Reorganization, shareholders holding Class C shares of the Predecessor Fund received Class C shares of the Fund.
Victory Capital Management Inc. (the “Adviser”) is the Fund’s investment adviser. Effective April 1, 2025, Amundi Asset Management US, Inc. (“Amundi US”), the Predecessor Fund’s investment adviser, was combined with Victory Capital Holdings, Inc., the parent company of the Adviser. The portfolio managers of Amundi US became employees of the Adviser.
Effective May 2, 2025, Pioneer Multi-Asset Income Fund (the “Predecessor Fund”) reorganized with Victory Pioneer Multi-Asset Income Fund (the “Reorganization”) pursuant to an agreement and plan of reorganization approved by the shareholders of the Predecessor Fund on April 28, 2025. The Predecessor Fund is the accounting survivor of the Reorganization. Accordingly, the Predecessor Fund’s performance and financial history have become the performance and financial history of the Fund.
Victory Capital Management Inc. (the “Adviser”) is the Fund’s investment adviser. Effective April 1, 2025, Amundi Asset Management US, Inc. (“Amundi US”), the Predecessor Fund’s investment adviser, was combined with Victory Capital Holdings, Inc., the parent company of the Adviser. The portfolio managers of Amundi US became employees of the Adviser.
What were the Fund costs for the last year?
(Based on a hypothetical $10,000 investment)
| Class Name | Costs of a $10,000 investment | Costs paid as a percentage of a $10,000 investment |
| Class Y | $68 | 0.63% |
How did the Fund perform last year and what affected Fund performance?
- For the fiscal year ended July 31, 2025, the Fund’s Class Y shares at NAV returned 14.33%. For the same period, the Fund’s broad-based benchmarks, the MSCI All Country World NR Index and the Bloomberg U.S. Aggregate Bond Total Return Index, returned 15.87% and 3.38%, respectively. The performance benchmark, a blended benchmark (35% MSCI All Country World NR Index and 65% Bloomberg U.S. Aggregate Bond Index), returned 9.22% over the period.
- For the period, equity holdings emerged as the primary performance driver, with a strategically diversified allocation across both domestic and international markets, when compared to the performance benchmark. Additionally, the Fund’s allocations within fixed income to Mortgage Backed Securities (MBS) and US Treasuries both contributed positively to performance over the period, when compared to the performance benchmark.
- During a period marked by strong equity market advances, the Fund’s equity futures hedging strategy served as the primary performance detractor, when compared to the performance benchmark. These futures positions represent a deliberate risk management approach designed to buffer against potential market volatility, which is particularly important given the elevated the Fund’s equity exposure.
Fund Performance
The line graph below shows the change in value of a $5 million investment made in Class Y shares of the Fund during the periods shown, compared to that of the MSCI All Country World NR Index, the Bloomberg U.S. Aggregate Bond Total Return Index, and the blended benchmark (65% MSCI All Country World NR Index and 35% Bloomberg U.S. Aggregate Bond Total Return Index).
GROWTH OF $5 million
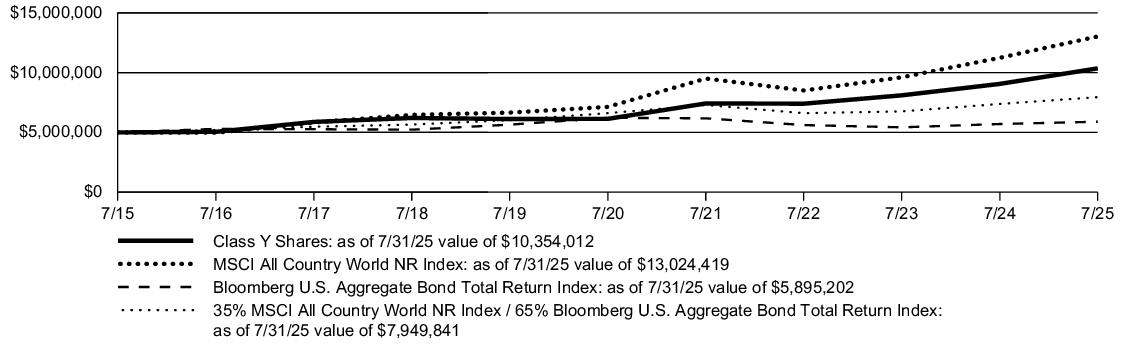
| AVERAGE ANNUAL TOTAL RETURN | 1 Year | 5 Years | 10 Years |
| Class Y | 14.33% | 11.04% | 7.55% |
| MSCI All Country World NR Index | 15.87% | 12.79% | 10.05% |
| Bloomberg U.S. Aggregate Bond Total Return Index | 3.38% | -1.07% | 1.66% |
| 35% MSCI All Country World NR Index / 65% Bloomberg U.S. Aggregate Bond Total Return Index | 0.30% | 3.76% | 4.75% |
The graph and table do not reflect the deduction of taxes that a shareholder would pay on fund distributions or redemption of fund shares.
KEY FUND STATISTICS
(as of July 31, 2025)
(as of July 31, 2025)
| Fund net assets | $5,642,200,679 |
| Total number of portfolio holdings | 523^^ |
| Total advisory fee paid | $20,411,813 |
| Portfolio turnover rate | 62% |
| ^^ |
Excluding short‑term investments and all derivative contracts except for options purchased. |
SECTOR DISTRIBUTION
(as of July 31, 2025 )*
(as of July 31, 2025 )*
| Financials | 35.6% |
| U.S. Government | 20.9% |
| Information Technology | 6.3% |
| Energy | 6.2% |
| Health Care | 5.4% |
| Basic Materials | 4.6% |
| Industrials | 3.7% |
| Utilities | 3.6% |
| Mortgage Securities | 3.4% |
| Consumer Discretionary | 2.2% |
| Technology | 1.5% |
| Foreign Government | 1.4% |
| Asset Backed Securities | 1.4% |
| Consumer Staples | 1.2% |
| Consumer, Cyclical | 1.1% |
| Materials | 0.5% |
| Real Estate | 0.4% |
| Communication Services | 0.4% |
| Closed-End Funds | 0.2% |
| Consumer, Non‑cyclical† | 0.0% |
| Over The Counter Exchange Traded Put Option Purchased† | 0.0% |
| * |
As a percentage of total investments excluding short-term investments and all derivative contracts except for options purchased. |
| † |
Amount rounds to less than 0.1%. |
Material Fund Changes
Effective May 2, 2025, Pioneer Multi-Asset Income Fund (the “Predecessor Fund”) reorganized with Victory Pioneer Multi-Asset Income Fund (the “Reorganization”) pursuant to an agreement and plan of reorganization approved by the shareholders of the Predecessor Fund on April 28, 2025. The Predecessor Fund is the accounting survivor of the Reorganization. Accordingly, the Predecessor Fund’s performance and financial history have become the performance and financial history of the Fund.
In the Reorganization, shareholders holding Class Y shares of the Predecessor Fund received Class Y shares of the Fund.
Victory Capital Management Inc. (the “Adviser”) is the Fund’s investment adviser. Effective April 1, 2025, Amundi Asset Management US, Inc. (“Amundi US”), the Predecessor Fund’s investment adviser, was combined with Victory Capital Holdings, Inc., the parent company of the Adviser. The portfolio managers of Amundi US became employees of the Adviser.
Effective May 2, 2025, Pioneer Multi-Asset Income Fund (the “Predecessor Fund”) reorganized with Victory Pioneer Multi-Asset Income Fund (the “Reorganization”) pursuant to an agreement and plan of reorganization approved by the shareholders of the Predecessor Fund on April 28, 2025. The Predecessor Fund is the accounting survivor of the Reorganization. Accordingly, the Predecessor Fund’s performance and financial history have become the performance and financial history of the Fund.
Victory Capital Management Inc. (the “Adviser”) is the Fund’s investment adviser. Effective April 1, 2025, Amundi Asset Management US, Inc. (“Amundi US”), the Predecessor Fund’s investment adviser, was combined with Victory Capital Holdings, Inc., the parent company of the Adviser. The portfolio managers of Amundi US became employees of the Adviser.
What were the Fund costs for the last year?
(Based on a hypothetical $10,000 investment)
| Class Name | Costs of a $10,000 investment | Costs paid as a percentage of a $10,000 investment |
| Class R6 | $56 | 0.52% |
How did the Fund perform last year and what affected Fund performance?
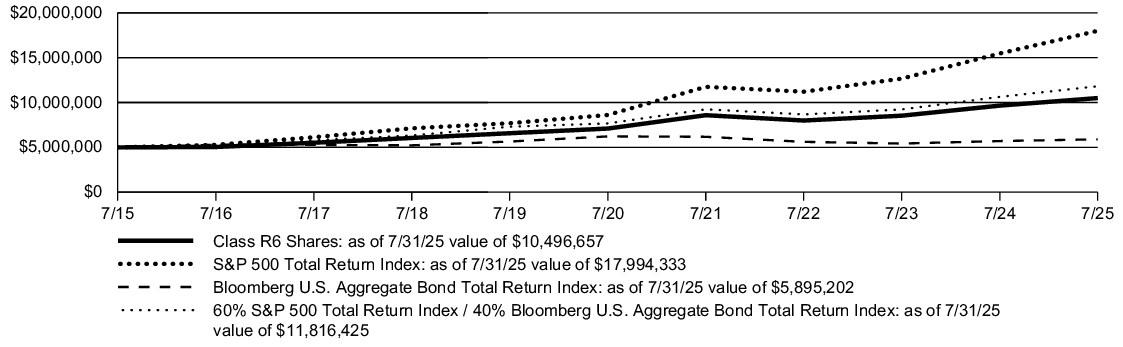
- For the fiscal year ended July 31, 2025, the Fund’s Class R6 shares at NAV returned 14.54%. For the same period, the Fund’s broad-based benchmarks, the MSCI All Country World NR Index and the Bloomberg U.S. Aggregate Bond Total Return Index, returned 15.87% and 3.38%, respectively. The performance benchmark, a blended benchmark (35% MSCI All Country World NR Index and 65% Bloomberg U.S. Aggregate Bond Index), returned 9.22% over the period.
- For the period, equity holdings emerged as the primary performance driver, with a strategically diversified allocation across both domestic and international markets, when compared to the performance benchmark. Additionally, the Fund’s allocations within fixed income to Mortgage Backed Securities (MBS) and US Treasuries both contributed positively to performance over the period, when compared to the performance benchmark.
- During a period marked by strong equity market advances, the Fund’s equity futures hedging strategy served as the primary performance detractor, when compared to the performance benchmark. These futures positions represent a deliberate risk management approach designed to buffer against potential market volatility, which is particularly important given the elevated the Fund’s equity exposure.
Fund Performance
The line graph below shows the change in value of a $5 million investment made in Class R6 shares of the Fund during the periods shown, compared to that of the MSCI All Country World NR Index, the Bloomberg U.S. Aggregate Bond Total Return Index, and the blended benchmark (65% MSCI All Country World NR Index and 35% Bloomberg U.S. Aggregate Bond Total Return Index).
GROWTH OF $5 million
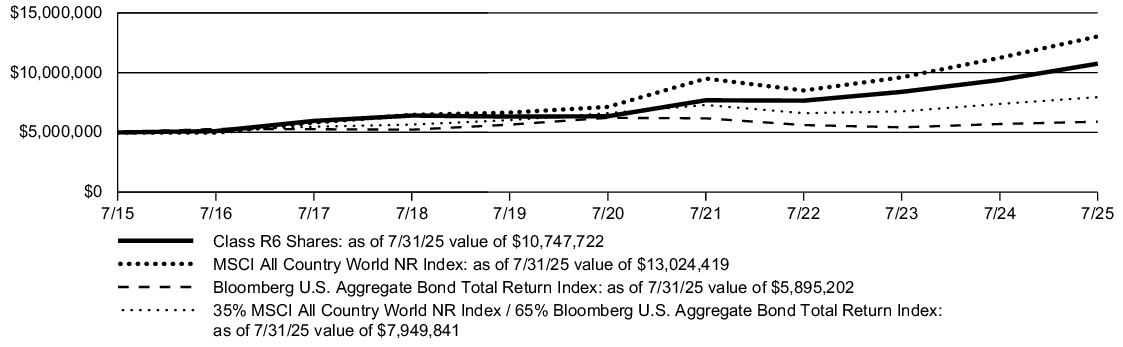
| AVERAGE ANNUAL TOTAL RETURN | 1 Year | 5 Years | 10 Years |
| Class R6 | 14.54% | 11.10% | 7.95% |
| MSCI All Country World NR Index | 15.87% | 12.79% | 10.05% |
| Bloomberg U.S. Aggregate Bond Total Return Index | 3.38% | -1.07% | 1.66% |
| 35% MSCI All Country World NR Index / 65% Bloomberg U.S. Aggregate Bond Total Return Index | 0.30% | 3.76% | 4.75% |
The graph and table do not reflect the deduction of taxes that a shareholder would pay on fund distributions or redemption of fund shares.
KEY FUND STATISTICS
(as of July 31, 2025)
(as of July 31, 2025)
| Fund net assets | $5,642,200,679 |
| Total number of portfolio holdings | 523^^ |
| Total advisory fee paid | $20,411,813 |
| Portfolio turnover rate | 62% |
| ^^ |
Excluding short‑term investments and all derivative contracts except for options purchased. |
SECTOR DISTRIBUTION
(as of July 31, 2025 )*
(as of July 31, 2025 )*
| Financials | 35.6% |
| U.S. Government | 20.9% |
| Information Technology | 6.3% |
| Energy | 6.2% |
| Health Care | 5.4% |
| Basic Materials | 4.6% |
| Industrials | 3.7% |
| Utilities | 3.6% |
| Mortgage Securities | 3.4% |
| Consumer Discretionary | 2.2% |
| Technology | 1.5% |
| Foreign Government | 1.4% |
| Asset Backed Securities | 1.4% |
| Consumer Staples | 1.2% |
| Consumer, Cyclical | 1.1% |
| Materials | 0.5% |
| Real Estate | 0.4% |
| Communication Services | 0.4% |
| Closed-End Funds | 0.2% |
| Consumer, Non‑cyclical† | 0.0% |
| Over The Counter Exchange Traded Put Option Purchased† | 0.0% |
| * |
As a percentage of total investments excluding short-term investments and all derivative contracts except for options purchased. |
| † |
Amount rounds to less than 0.1%. |
Material Fund Changes
Effective May 2, 2025, Pioneer Multi-Asset Income Fund (the “Predecessor Fund”) reorganized with Victory Pioneer Multi-Asset Income Fund (the “Reorganization”) pursuant to an agreement and plan of reorganization approved by the shareholders of the Predecessor Fund on April 28, 2025. The Predecessor Fund is the accounting survivor of the Reorganization. Accordingly, the Predecessor Fund’s performance and financial history have become the performance and financial history of the Fund.
In the Reorganization, shareholders holding Class K shares of the Predecessor Fund received Class R6 shares of the Fund.
Victory Capital Management Inc. (the “Adviser”) is the Fund’s investment adviser. Effective April 1, 2025, Amundi Asset Management US, Inc. (“Amundi US”), the Predecessor Fund’s investment adviser, was combined with Victory Capital Holdings, Inc., the parent company of the Adviser. The portfolio managers of Amundi US became employees of the Adviser.
Effective May 2, 2025, Pioneer Multi-Asset Income Fund (the “Predecessor Fund”) reorganized with Victory Pioneer Multi-Asset Income Fund (the “Reorganization”) pursuant to an agreement and plan of reorganization approved by the shareholders of the Predecessor Fund on April 28, 2025. The Predecessor Fund is the accounting survivor of the Reorganization. Accordingly, the Predecessor Fund’s performance and financial history have become the performance and financial history of the Fund.
Victory Capital Management Inc. (the “Adviser”) is the Fund’s investment adviser. Effective April 1, 2025, Amundi Asset Management US, Inc. (“Amundi US”), the Predecessor Fund’s investment adviser, was combined with Victory Capital Holdings, Inc., the parent company of the Adviser. The portfolio managers of Amundi US became employees of the Adviser.
What were the Fund costs for the last year?
(Based on a hypothetical $10,000 investment)
| Class Name | Costs of a $10,000 investment | Costs paid as a percentage of a $10,000 investment |
| Class A | $94 | 0.90% |
How did the Fund perform last year and what affected Fund performance?
- For the fiscal year ended July 31, 2025, the Fund’s Class A shares at NAV returned 7.89%. For the same period, the Fund’s broad-based benchmark, the Bloomberg U.S. Aggregate Bond Total Return Index, returned 3.38%. The Fund’s performance benchmark, the Bloomberg U.S. Securitized MBS/ABS/CMBS Total Return Index, returned 3.51% over the period.
- The Fund experienced positive absolute returns and positive relative returns compared to the performance benchmark across nearly all sectors, as the portfolio’s A-rated and lower credit positions surpassed the performance of the performance benchmark’s higher quality positions.
- Asset-backed securities were the largest contributor to absolute returns, with residential Mortgage Back Securities (MBS) following closely behind. Throughout the year, credit spreads narrowed, resulting in higher price returns.
- The entire business securitizations sector was the sole negative contributor in absolute terms, as the choice of securities in this area led to negative returns compared to the performance benchmark.
- Interest rates rallied on the short end of the curve but rose on the long end of the curve, benefitting the Fund’s short-duration positioning.
Fund Performance
The line graph below shows the change in value of a $10,000 investment made in Class A shares of the Fund at public offering price during the periods shown, compared to that of the Bloomberg U.S. Aggregate Bond Total Return Index and the Bloomberg U.S. Securitized MBS/ABS/CMBS Total Return Index.
GROWTH OF $10,000
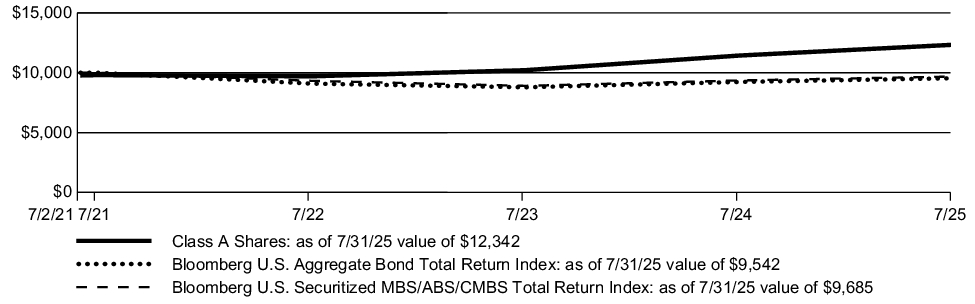
| AVERAGE ANNUAL TOTAL RETURN | 1 Year | Since Inception* |
| Class A (with sales charge) | 5.44% | 5.29% |
| Class A (without sales charge) | 7.89% | 5.87% |
| Bloomberg U.S. Aggregate Bond Total Return Index | 3.38% | -3.63% |
| Bloomberg U.S. Securitized MBS/ABS/CMBS Total Return Index | 3.51% | -2.60% |
| * |
Performance of Class A shares shown in the graph above is from the inception of Class A shares on 7/2/21 through 7/31/25. Index information shown in the graph above is from 7/31/21 through 7/31/25. |
The graph and table do not reflect the deduction of taxes that a shareholder would pay on fund distributions or redemption of fund shares.
KEY FUND STATISTICS
(as of July 31, 2025)
(as of July 31, 2025)
| Fund net assets | $239,556,147 |
| Total number of portfolio holdings | 298^^ |
| Total advisory fee paid | $720,800 |
| Portfolio turnover rate | 12% |
| ^^ |
Excluding short-term investments and all derivative contracts except for options purchased. |
PORTFOLIO DIVERSIFICATION
(as of July 31, 2025 ) *
(as of July 31, 2025 ) *
| Collateralized Mortgage Obligations | 38.9% |
| Asset Backed Securities | 32.8% |
| U.S. Government and Agency Obligations | 15.6% |
| Commercial Mortgage-Backed Securities | 12.7% |
| Corporate Bonds† | 0.0% |
| * |
As a percentage of total investments excluding short-term investments and all derivative contracts except for options purchased. |
| † |
Amount rounds to less than 0.1%. |
Material Fund Changes
Effective May 2, 2025, Pioneer Securitized Income Fund (the “Predecessor Fund”) reorganized with Victory Pioneer Securitized Income Fund (the “Reorganization”) pursuant to an agreement and plan of reorganization approved by the shareholders of the Predecessor Fund on April 28, 2025. The Predecessor Fund is the accounting survivor of the Reorganization. Accordingly, the Predecessor Fund’s performance and financial history have become the performance and financial history of the Fund.
In the Reorganization, shareholders holding Class A shares of the Predecessor Fund received Class A shares of the Fund.
Victory Capital Management Inc. (the “Adviser”) is the Fund’s investment adviser. Effective April 1, 2025, Amundi Asset Management US, Inc. (“Amundi US”), the Predecessor Fund’s investment adviser, was combined with Victory Capital Holdings, Inc., the parent company of the Adviser. The portfolio managers of Amundi US became employees of the Adviser.
Effective May 2, 2025, Pioneer Securitized Income Fund (the “Predecessor Fund”) reorganized with Victory Pioneer Securitized Income Fund (the “Reorganization”) pursuant to an agreement and plan of reorganization approved by the shareholders of the Predecessor Fund on April 28, 2025. The Predecessor Fund is the accounting survivor of the Reorganization. Accordingly, the Predecessor Fund’s performance and financial history have become the performance and financial history of the Fund.
Victory Capital Management Inc. (the “Adviser”) is the Fund’s investment adviser. Effective April 1, 2025, Amundi Asset Management US, Inc. (“Amundi US”), the Predecessor Fund’s investment adviser, was combined with Victory Capital Holdings, Inc., the parent company of the Adviser. The portfolio managers of Amundi US became employees of the Adviser.
What were the Fund costs for the last year?
(Based on a hypothetical $10,000 investment)
| Class Name | Costs of a $10,000 investment | Costs paid as a percentage of a $10,000 investment |
| Class Y | $68 | 0.65% |
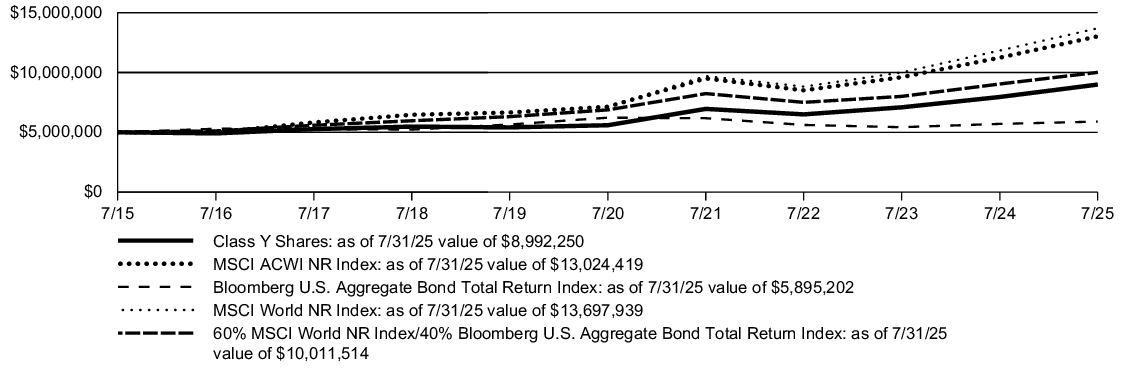
How did the Fund perform last year and what affected Fund performance?
- For the fiscal year ended July 31, 2025, the Fund’s Class Y shares at NAV returned 8.15%. For the same period, the Fund’s broad-based benchmark, the Bloomberg U.S. Aggregate Bond Total Return Index, returned 3.38%. The Fund’s performance benchmark, the Bloomberg U.S. Securitized MBS/ABS/CMBS Total Return Index, returned 3.51% over the period.
- The Fund experienced positive absolute returns and positive relative returns compared to the performance benchmark across nearly all sectors, as the portfolio’s A-rated and lower credit positions surpassed the performance of the performance benchmark’s higher quality positions.
- Asset-backed securities were the largest contributor to absolute returns, with residential Mortgage Back Securities (MBS) following closely behind. Throughout the year, credit spreads narrowed, resulting in higher price returns.
- The entire business securitizations sector was the sole negative contributor in absolute terms, as the choice of securities in this area led to negative returns compared to the performance benchmark.
- Interest rates rallied on the short end of the curve but rose on the long end of the curve, benefitting the Fund’s short-duration positioning.
Fund Performance
The line graph below shows the change in value of a $5 million investment made in Class Y shares of the Fund during the periods shown, compared to that of the Bloomberg U.S. Aggregate Bond Total Return Index and the Bloomberg U.S. Securitized MBS/ABS/CMBS Total Return Index.
GROWTH OF $5 million
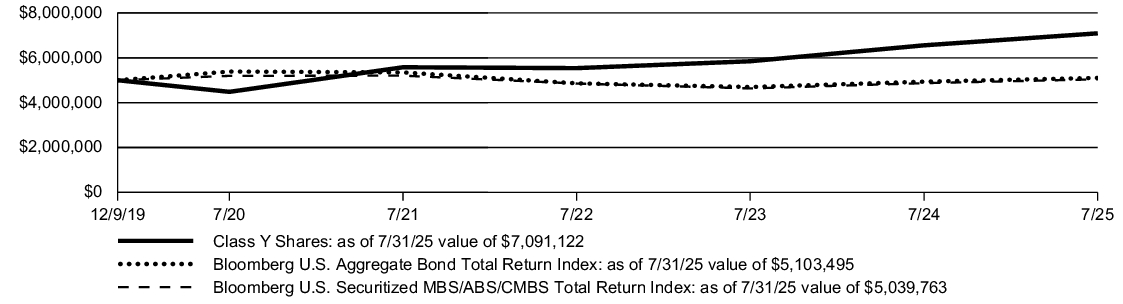
| AVERAGE ANNUAL TOTAL RETURN | 1 Year | 5 Years | Since Inception* |
| Class Y | 8.15% | 9.61% | 6.39% |
| Bloomberg U.S. Aggregate Bond Total Return Index | 3.38% | -1.07% | 2.11% |
| Bloomberg U.S. Securitized MBS/ABS/CMBS Total Return Index | 3.51% | -0.60% | 1.06% |
| * |
Performance of Class Y shares shown in the graph above is from the inception of Class Y shares on 12/10/19 through 7/31/25. Index information shown in the graph above is from 12/31/19 through 7/31/25. |
The graph and table do not reflect the deduction of taxes that a shareholder would pay on fund distributions or redemption of fund shares.
KEY FUND STATISTICS
(as of July 31, 2025)
(as of July 31, 2025)
| Fund net assets | $239,556,147 |
| Total number of portfolio holdings | 298^^ |
| Total advisory fee paid | $720,800 |
| Portfolio turnover rate | 12% |
| ^^ |
Excluding short-term investments and all derivative contracts except for options purchased. |
PORTFOLIO DIVERSIFICATION
(as of July 31, 2025 ) *
(as of July 31, 2025 ) *
| Collateralized Mortgage Obligations | 38.9% |
| Asset Backed Securities | 32.8% |
| U.S. Government and Agency Obligations | 15.6% |
| Commercial Mortgage-Backed Securities | 12.7% |
| Corporate Bonds† | 0.0% |
| * |
As a percentage of total investments excluding short-term investments and all derivative contracts except for options purchased. |
| † |
Amount rounds to less than 0.1%. |
Material Fund Changes
Effective May 2, 2025, Pioneer Securitized Income Fund (the “Predecessor Fund”) reorganized with Victory Pioneer Securitized Income Fund (the “Reorganization”) pursuant to an agreement and plan of reorganization approved by the shareholders of the Predecessor Fund on April 28, 2025. The Predecessor Fund is the accounting survivor of the Reorganization. Accordingly, the Predecessor Fund’s performance and financial history have become the performance and financial history of the Fund.
In the Reorganization, shareholders holding Class Y shares of the Predecessor Fund received Class Y shares of the Fund.
Victory Capital Management Inc. (the “Adviser”) is the Fund’s investment adviser. Effective April 1, 2025, Amundi Asset Management US, Inc. (“Amundi US”), the Predecessor Fund’s investment adviser, was combined with Victory Capital Holdings, Inc., the parent company of the Adviser. The portfolio managers of Amundi US became employees of the Adviser.
Effective May 2, 2025, Pioneer Securitized Income Fund (the “Predecessor Fund”) reorganized with Victory Pioneer Securitized Income Fund (the “Reorganization”) pursuant to an agreement and plan of reorganization approved by the shareholders of the Predecessor Fund on April 28, 2025. The Predecessor Fund is the accounting survivor of the Reorganization. Accordingly, the Predecessor Fund’s performance and financial history have become the performance and financial history of the Fund.
Victory Capital Management Inc. (the “Adviser”) is the Fund’s investment adviser. Effective April 1, 2025, Amundi Asset Management US, Inc. (“Amundi US”), the Predecessor Fund’s investment adviser, was combined with Victory Capital Holdings, Inc., the parent company of the Adviser. The portfolio managers of Amundi US became employees of the Adviser.
What were the Fund costs for the last year?
(Based on a hypothetical $10,000 investment)
| Class Name | Costs of a $10,000 investment | Costs paid as a percentage of a $10,000 investment |
| Class A | $43 | 0.40% |
How did the Fund perform last year and what affected Fund performance?
- For the fiscal year ended July 31, 2025, the Fund’s Class A shares at NAV returned 12.85%. For the same period, the Fund’s broad-based benchmark, the MSCI ACWI NR Index returned 15.87%. The Fund's primary benchmarks, the MSCI World NR Index and the Bloomberg U.S. Aggregate Bond Total Return Index, returned 15.72% and 3.38%, respectively. The performance benchmark, a blended benchmark (60% MSCI World NR Index and 40% Bloomberg US Aggregate Bond Index), returned 10.75% over the period.
- All of the underlying funds had positive returns over the period lead by Victory Pioneer Global Equity (20.33%) and Victory Pioneer (15.26%). The largest weight holding, Victory Pioneer Multi-Asset Income, also had strong performance (14.52%) over the period.
- Fixed income funds underperformed compared to equity and multi-asset funds during this period. Although these funds achieved returns that surpassed the Bloomberg U.S. Aggregate Bond Total Return Index, they still fell short of the overall Fund returns. The returns were as follows: Victory Pioneer Multi-Asset Ultrashort Income (5.53%), Victory Pioneer Bond (5.21%), and Victory Pioneer Short Term Income (5.62%).
Fund Performance
The line graph below shows the change in value of a $10,000 investment made in Class A shares of the Fund at public offering price during the periods shown, compared to that of the MSCI World NR Index, the Bloomberg U.S. Aggregate Bond Total Return Index and the blended benchmark (60% MSCI World NR Index/40% Bloomberg U.S. Aggregate Bond Total Return Index).
GROWTH OF $10,000
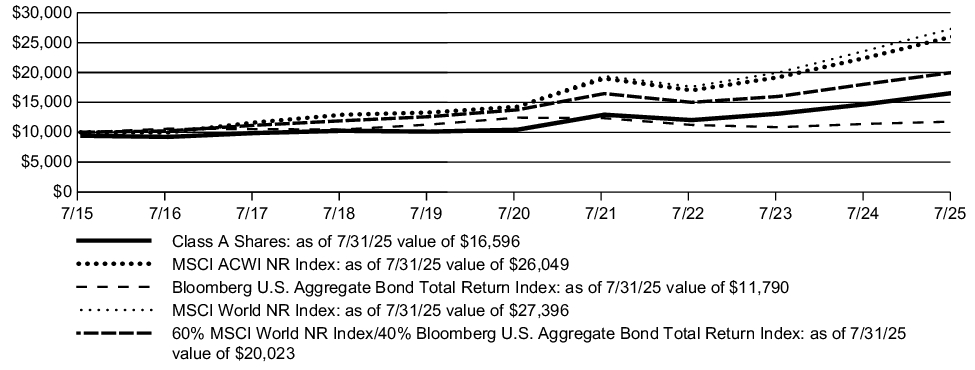
| AVERAGE ANNUAL TOTAL RETURN | 1 Year | 5 Years | 10 Years |
| Class A (with sales charge) | 6.32% | 8.45% | 5.20% |
| Class A (without sales charge) | 12.85% | 9.75% | 5.82% |
| MSCI ACWI NR Index | 15.87% | 12.79% | 10.05% |
| Bloomberg U.S. Aggregate Bond Total Return Index | 3.38% | -1.07% | 1.66% |
| MSCI World NR Index | 15.72% | 13.78% | 10.60% |
| 60% MSCI World NR Index/40% Bloomberg U.S. Aggregate Bond Total Return Index | 10.75% | 7.81% | 7.19% |
The graph and table do not reflect the deduction of taxes that a shareholder would pay on fund distributions or redemption of fund shares.
KEY FUND STATISTICS
(as of July 31, 2025)
(as of July 31, 2025)
| Fund net assets | $407,667,426 |
| Total number of portfolio holdings | 15^^ |
| Total advisory fee paid | $0 |
| Portfolio turnover rate | 23% |
| ^^ |
Excluding short‑term investments and all derivative contracts except for options purchased. |
ASSET ALLOCATIONS
(as of July 31, 2025 )*
(as of July 31, 2025 )*
| Balanced/Flexible | 40.4% |
| International Equities | 31.2% |
| Fixed Income | 25.8% |
| U.S. Equities | 2.6% |
| * | As a percentage of total investments excluding short-term investments and all derivative contracts except for options purchased. |
Material Fund Changes
Effective April 1, 2025, Pioneer Solutions - Balanced Fund (the “Predecessor Fund”) reorganized with Victory Pioneer Solutions - Balanced Fund (the “Reorganization”) pursuant to an agreement and plan of reorganization approved by the shareholders of the Predecessor Fund on March 27, 2025. The Predecessor Fund is the accounting survivor of the Reorganization. Accordingly, the Predecessor Fund’s performance and financial history have become the performance and financial history of the Fund.
In the Reorganization, shareholders holding Class A and Class R shares of the Predecessor Fund received Class A shares of the Fund.
Victory Capital Management Inc. (the “Adviser”) is the Fund’s investment adviser. Effective April 1, 2025, Amundi Asset Management US, Inc. (“Amundi US”), the Predecessor Fund’s investment adviser, was combined with Victory Capital Holdings, Inc., the parent company of the Adviser. The portfolio managers of Amundi US became employees of the Adviser.
Effective April 1, 2025, Pioneer Solutions - Balanced Fund (the “Predecessor Fund”) reorganized with Victory Pioneer Solutions - Balanced Fund (the “Reorganization”) pursuant to an agreement and plan of reorganization approved by the shareholders of the Predecessor Fund on March 27, 2025. The Predecessor Fund is the accounting survivor of the Reorganization. Accordingly, the Predecessor Fund’s performance and financial history have become the performance and financial history of the Fund.
Victory Capital Management Inc. (the “Adviser”) is the Fund’s investment adviser. Effective April 1, 2025, Amundi Asset Management US, Inc. (“Amundi US”), the Predecessor Fund’s investment adviser, was combined with Victory Capital Holdings, Inc., the parent company of the Adviser. The portfolio managers of Amundi US became employees of the Adviser.
What were the Fund costs for the last year?
(Based on a hypothetical $10,000 investment)
| Class Name | Costs of a $10,000 investment | Costs paid as a percentage of a $10,000 investment |
| Class C | $120 | 1.13% |
How did the Fund perform last year and what affected Fund performance?
- For the fiscal year ended July 31, 2025, the Fund’s Class C shares at NAV returned 12.09%. For the same period, the Fund’s broad-based benchmark, the MSCI ACWI NR Index returned 15.87%. The Fund's primary benchmarks, the MSCI World NR Index and the Bloomberg U.S. Aggregate Bond Total Return Index, returned 15.72% and 3.38%, respectively. The performance benchmark, a blended benchmark (60% MSCI World NR Index and 40% Bloomberg US Aggregate Bond Index), returned 10.75% over the period.
- All of the underlying funds had positive returns over the period lead by Victory Pioneer Global Equity (20.33%) and Victory Pioneer (15.26%). The largest weight holding, Victory Pioneer Multi-Asset Income, also had strong performance (14.52%) over the period.
- Fixed income funds underperformed compared to equity and multi-asset funds during this period. Although these funds achieved returns that surpassed the Bloomberg U.S. Aggregate Bond Total Return Index, they still fell short of the overall Fund returns. The returns were as follows: Victory Pioneer Multi-Asset Ultrashort Income (5.53%), Victory Pioneer Bond (5.21%), and Victory Pioneer Short Term Income (5.62%).
Fund Performance
The line graph below shows the change in value of a $10,000 investment made in Class C shares of the Fund during the periods shown, compared to that of the MSCI World NR Index, the Bloomberg U.S. Aggregate Bond Total Return Index and the blended benchmark (60% MSCI World NR Index/40% Bloomberg U.S. Aggregate Bond Total Return Index).
GROWTH OF $10,000
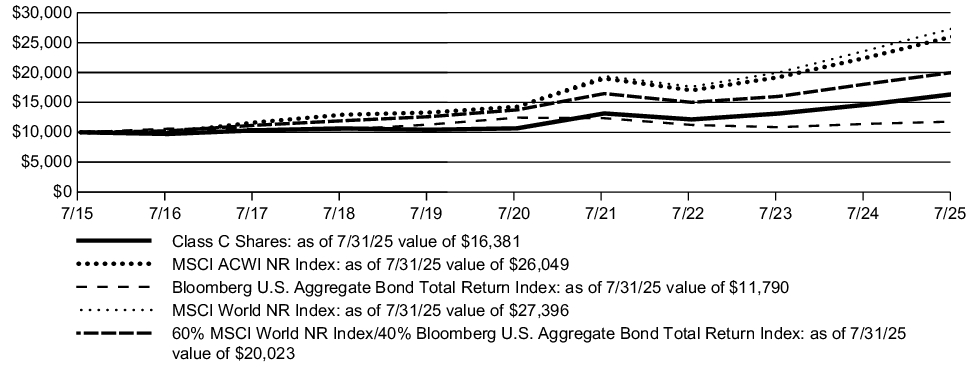
| AVERAGE ANNUAL TOTAL RETURN | 1 Year | 5 Years | 10 Years |
| Class C (with contingent deferred sales charge) | 11.09% | 8.96% | 5.06% |
| Class C (without contingent deferred sales charge) | 12.09% | 8.96% | 5.06% |
| MSCI ACWI NR Index | 15.87% | 12.79% | 10.05% |
| Bloomberg U.S. Aggregate Bond Total Return Index | 3.38% | -1.07% | 1.66% |
| MSCI World NR Index | 15.72% | 13.78% | 10.60% |
| 60% MSCI World NR Index/40% Bloomberg U.S. Aggregate Bond Total Return Index | 10.75% | 7.81% | 7.19% |
The graph and table do not reflect the deduction of taxes that a shareholder would pay on fund distributions or redemption of fund shares.
KEY FUND STATISTICS
(as of July 31, 2025)
(as of July 31, 2025)
| Fund net assets | $407,667,426 |
| Total number of portfolio holdings | 15^^ |
| Total advisory fee paid | $0 |
| Portfolio turnover rate | 23% |
| ^^ |
Excluding short‑term investments and all derivative contracts except for options purchased. |
ASSET ALLOCATIONS
(as of July 31, 2025 )*
(as of July 31, 2025 )*
| Balanced/Flexible | 40.4% |
| International Equities | 31.2% |
| Fixed Income | 25.8% |
| U.S. Equities | 2.6% |
| * | As a percentage of total investments excluding short-term investments and all derivative contracts except for options purchased. |
Material Fund Changes
Effective April 1, 2025, Pioneer Solutions - Balanced Fund (the “Predecessor Fund”) reorganized with Victory Pioneer Solutions - Balanced Fund (the “Reorganization”) pursuant to an agreement and plan of reorganization approved by the shareholders of the Predecessor Fund on March 27, 2025. The Predecessor Fund is the accounting survivor of the Reorganization. Accordingly, the Predecessor Fund’s performance and financial history have become the performance and financial history of the Fund.
In the Reorganization, shareholders holding Class C shares of the Predecessor Fund received Class C shares of the Fund.
Victory Capital Management Inc. (the “Adviser”) is the Fund’s investment adviser. Effective April 1, 2025, Amundi Asset Management US, Inc. (“Amundi US”), the Predecessor Fund’s investment adviser, was combined with Victory Capital Holdings, Inc., the parent company of the Adviser. The portfolio managers of Amundi US became employees of the Adviser.
Effective April 1, 2025, Pioneer Solutions - Balanced Fund (the “Predecessor Fund”) reorganized with Victory Pioneer Solutions - Balanced Fund (the “Reorganization”) pursuant to an agreement and plan of reorganization approved by the shareholders of the Predecessor Fund on March 27, 2025. The Predecessor Fund is the accounting survivor of the Reorganization. Accordingly, the Predecessor Fund’s performance and financial history have become the performance and financial history of the Fund.
Victory Capital Management Inc. (the “Adviser”) is the Fund’s investment adviser. Effective April 1, 2025, Amundi Asset Management US, Inc. (“Amundi US”), the Predecessor Fund’s investment adviser, was combined with Victory Capital Holdings, Inc., the parent company of the Adviser. The portfolio managers of Amundi US became employees of the Adviser.
What were the Fund costs for the last year?
(Based on a hypothetical $10,000 investment)
| Class Name | Costs of a $10,000 investment | Costs paid as a percentage of a $10,000 investment |
| Class A | $94 | 0.90% |
How did the Fund perform last year and what affected Fund performance?
- For the fiscal year ended July 31, 2025, the Fund’s Class A shares, when compared to the performance benchmark at NAV returned 8.31%. For the same period, the Fund’s broad-based benchmarks, the Standard & Poor's 500 (S&P 500) Total Return Index and the Bloomberg U.S. Aggregate Bond Total Return Index, returned 16.33% and 3.38%, respectively. The performance benchmark, a blended benchmark (60% S&P 500 Total Return Index and 40% Bloomberg U.S. Aggregate Bond Total Return Index), returned 11.16% over the period.
- Asset allocation was a positive contributor over the period. The higher allocation to Equity was beneficial as equities outperformed the performance benchmark during this time. Additionally, allocations to financials and securitized fixed income also had a positive contribution compared to the performance benchmark.
- Security selection detracted from performance over the period. Select stocks within the information technology, materials and health care sectors underperformed over the period.
Fund Performance
The line graph below shows the change in value of a $10,000 investment made in Class A shares of the Fund at public offering price during the periods shown, compared to that of the S&P 500 Total Return Index, the Bloomberg U.S. Aggregate Bond Total Return Index, and the blended benchmark (60% S&P 500 Total Return Index and 40% Bloomberg U.S. Aggregate Bond Total Return Index).
GROWTH OF $10,000
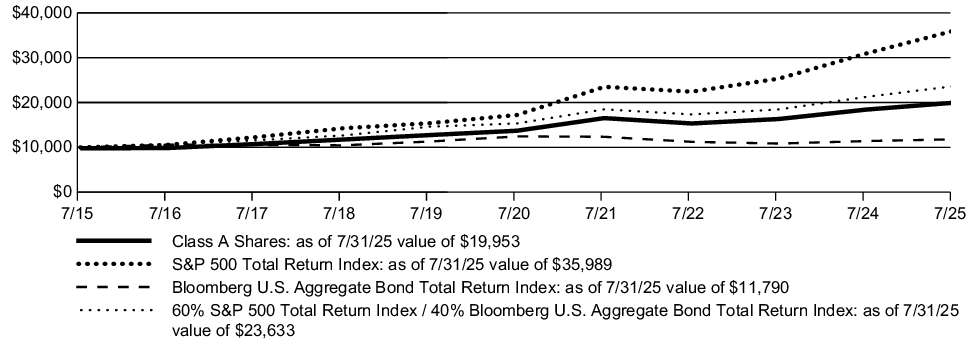
| AVERAGE ANNUAL TOTAL RETURN | 1 Year | 5 Years | 10 Years |
| Class A (with sales charge) | 5.90% | 7.31% | 7.15% |
| Class A (without sales charge) | 8.31% | 7.79% | 7.40% |
| S&P 500 Total Return Index | 16.33% | 15.88% | 13.66% |
| Bloomberg U.S. Aggregate Bond Total Return Index | 3.38% | -1.07% | 1.66% |
| 60% S&P 500 Total Return Index / 40% Bloomberg U.S. Aggregate Bond Total Return Index | 11.16% | 9.03% | 8.98% |
The graph and table do not reflect the deduction of taxes that a shareholder would pay on fund distributions or redemption of fund shares.
KEY FUND STATISTICS
(as of July 31, 2025)
(as of July 31, 2025)
| Fund net assets | $410,875,446 |
| Total number of portfolio holdings | 768^^ |
| Total advisory fee paid | $2,036,150 |
| Portfolio turnover rate | 29%≈ |
| ^^ |
Excluding short-term investments, TBA sales commitments and all derivative contracts except for options purchased. |
| ≈ |
Portfolio turnover excludes the value of portfolio securities received or delivered as a result of in-kind fund share transactions. |
SECTOR DISTRIBUTION
(as of July 31, 2025 )*
(as of July 31, 2025 )*
| Information Technology | 20.6% |
| Financials | 16.8% |
| U.S. Government | 11.0% |
| Industrials | 7.7% |
| Health Care | 7.7% |
| Communication Services | 6.7% |
| Consumer Discretionary | 4.7% |
| Mortgage Securities | 4.5% |
| Energy | 3.7% |
| Asset Backed Securities | 3.6% |
| Basic Materials | 3.5% |
| Real Estate | 2.9% |
| Consumer Staples | 2.0% |
| Utilities | 1.8% |
| Consumer, Cyclical | 1.6% |
| Consumer, Non-cyclical | 0.6% |
| Affiliated Closed-End Fund∞ | 0.3% |
| Foreign Government | 0.2% |
| Government | 0.1% |
| * |
As a percentage of total investments excluding short‑term investments, TBA sales commitments and all derivative contracts except for options purchased. |
| ∞ |
Pioneer ILS Interval Fund is an affiliated closed-end fund managed by Victory Capital Management, Inc. |
Material Fund Changes
Effective April 1, 2025, Pioneer Balanced ESG Fund (the “Predecessor Fund”) reorganized with Victory Pioneer Balanced Fund (the “Reorganization”) pursuant to an agreement and plan of reorganization approved by the shareholders of the Predecessor Fund on March 27, 2025. The Predecessor Fund is the accounting survivor of the Reorganization. Accordingly, the Predecessor Fund’s performance and financial history have become the performance and financial history of the Fund.
In the Reorganization, shareholders holding Class A and Class R shares of the Predecessor Fund received Class A shares of the Fund.
Victory Capital Management Inc. (the “Adviser”) is the Fund’s investment adviser. Effective April 1, 2025, Amundi Asset Management US, Inc. (“Amundi US”), the Predecessor Fund’s investment adviser, was combined with Victory Capital Holdings, Inc., the parent company of the Adviser. The portfolio managers of Amundi US became employees of the Adviser.
Effective April 1, 2025, Pioneer Balanced ESG Fund (the “Predecessor Fund”) reorganized with Victory Pioneer Balanced Fund (the “Reorganization”) pursuant to an agreement and plan of reorganization approved by the shareholders of the Predecessor Fund on March 27, 2025. The Predecessor Fund is the accounting survivor of the Reorganization. Accordingly, the Predecessor Fund’s performance and financial history have become the performance and financial history of the Fund.
Victory Capital Management Inc. (the “Adviser”) is the Fund’s investment adviser. Effective April 1, 2025, Amundi Asset Management US, Inc. (“Amundi US”), the Predecessor Fund’s investment adviser, was combined with Victory Capital Holdings, Inc., the parent company of the Adviser. The portfolio managers of Amundi US became employees of the Adviser.
What were the Fund costs for the last year?
(Based on a hypothetical $10,000 investment)
| Class Name | Costs of a $10,000 investment | Costs paid as a percentage of a $10,000 investment |
| Class Y | $22 | 0.21% |
How did the Fund perform last year and what affected Fund performance?
- For the fiscal year ended July 31, 2025, the Fund’s Class Y shares at NAV returned 13.08%. For the same period, the Fund’s broad-based benchmark, the MSCI ACWI NR Index returned 15.87%. The Fund's primary benchmarks, the MSCI World NR Index and the Bloomberg U.S. Aggregate Bond Total Return Index, returned 15.72% and 3.38%, respectively. The performance benchmark, a blended benchmark (60% MSCI World NR Index and 40% Bloomberg US Aggregate Bond Index), returned 10.75% over the period.
- All of the underlying funds had positive returns over the period lead by Victory Pioneer Global Equity (20.33%) and Victory Pioneer (15.26%). The largest weight holding, Victory Pioneer Multi-Asset Income, also had strong performance (14.52%) over the period.
- Fixed income funds underperformed compared to equity and multi-asset funds during this period. Although these funds achieved returns that surpassed the Bloomberg U.S. Aggregate Bond Total Return Index, they still fell short of the overall Fund returns. The returns were as follows: Victory Pioneer Multi-Asset Ultrashort Income (5.53%), Victory Pioneer Bond (5.21%), and Victory Pioneer Short Term Income (5.62%).
Fund Performance
The line graph below shows the change in value of a $5 million investment made in Class Y shares of the Fund during the periods shown, compared to that of the MSCI World NR Index, the Bloomberg U.S. Aggregate Bond Total Return Index and the blended benchmark (60% MSCI World NR Index/40% Bloomberg U.S. Aggregate Bond Total Return Index).
GROWTH OF $5 million
| AVERAGE ANNUAL TOTAL RETURN | 1 Year | 5 Years | 10 Years |
| Class Y | 13.08% | 9.97% | 6.04% |
| MSCI ACWI NR Index | 15.87% | 12.79% | 10.05% |
| Bloomberg U.S. Aggregate Bond Total Return Index | 3.38% | -1.07% | 1.66% |
| MSCI World NR Index | 15.72% | 13.78% | 10.60% |
| 60% MSCI World NR Index/40% Bloomberg U.S. Aggregate Bond Total Return Index | 10.75% | 7.81% | 7.19% |
The graph and table do not reflect the deduction of taxes that a shareholder would pay on fund distributions or redemption of fund shares.
KEY FUND STATISTICS
(as of July 31, 2025)
(as of July 31, 2025)
| Fund net assets | $407,667,426 |
| Total number of portfolio holdings | 15^^ |
| Total advisory fee paid | $0 |
| Portfolio turnover rate | 23% |
| ^^ |
Excluding short‑term investments and all derivative contracts except for options purchased. |
ASSET ALLOCATIONS
(as of July 31, 2025 )*
(as of July 31, 2025 )*
| Balanced/Flexible | 40.4% |
| International Equities | 31.2% |
| Fixed Income | 25.8% |
| U.S. Equities | 2.6% |
| * | As a percentage of total investments excluding short-term investments and all derivative contracts except for options purchased. |
Material Fund Changes
Effective April 1, 2025, Pioneer Solutions - Balanced Fund (the “Predecessor Fund”) reorganized with Victory Pioneer Solutions - Balanced Fund (the “Reorganization”) pursuant to an agreement and plan of reorganization approved by the shareholders of the Predecessor Fund on March 27, 2025. The Predecessor Fund is the accounting survivor of the Reorganization. Accordingly, the Predecessor Fund’s performance and financial history have become the performance and financial history of the Fund.
In the Reorganization, shareholders holding Class Y shares of the Predecessor Fund received Class Y shares of the Fund.
Victory Capital Management Inc. (the “Adviser”) is the Fund’s investment adviser. Effective April 1, 2025, Amundi Asset Management US, Inc. (“Amundi US”), the Predecessor Fund’s investment adviser, was combined with Victory Capital Holdings, Inc., the parent company of the Adviser. The portfolio managers of Amundi US became employees of the Adviser.
Effective April 1, 2025, Pioneer Solutions - Balanced Fund (the “Predecessor Fund”) reorganized with Victory Pioneer Solutions - Balanced Fund (the “Reorganization”) pursuant to an agreement and plan of reorganization approved by the shareholders of the Predecessor Fund on March 27, 2025. The Predecessor Fund is the accounting survivor of the Reorganization. Accordingly, the Predecessor Fund’s performance and financial history have become the performance and financial history of the Fund.
Victory Capital Management Inc. (the “Adviser”) is the Fund’s investment adviser. Effective April 1, 2025, Amundi Asset Management US, Inc. (“Amundi US”), the Predecessor Fund’s investment adviser, was combined with Victory Capital Holdings, Inc., the parent company of the Adviser. The portfolio managers of Amundi US became employees of the Adviser.
What were the Fund costs for the last year?
(Based on a hypothetical $10,000 investment)
| Class Name | Costs of a $10,000 investment | Costs paid as a percentage of a $10,000 investment |
| Class C | $171 | 1.65% |
How did the Fund perform last year and what affected Fund performance?
- For the fiscal year ended July 31, 2025, the Fund’s Class C shares, when compared to the performance benchmark at NAV returned 7.61%. For the same period, the Fund’s broad-based benchmarks, the Standard & Poor's 500 (S&P 500) Total Return Index and the Bloomberg U.S. Aggregate Bond Total Return Index, returned 16.33% and 3.38%, respectively. The performance benchmark, a blended benchmark (60% S&P 500 Total Return Index and 40% Bloomberg U.S. Aggregate Bond Total Return Index), returned 11.16% over the period.
- Asset allocation was a positive contributor over the period. The higher allocation to Equity was beneficial as equities outperformed the performance benchmark during this time. Additionally, allocations to financials and securitized fixed income also had a positive contribution compared to the performance benchmark.
- Security selection detracted from performance over the period. Select stocks within the information technology, materials and health care sectors underperformed over the period.
Fund Performance
The line graph below shows the change in value of a $10,000 investment made in Class C shares of the Fund during the periods shown, compared to that of the S&P 500 Total Return Index, the Bloomberg U.S. Aggregate Bond Total Return Index, and the blended benchmark (60% S&P 500 Total Return Index and 40% Bloomberg U.S. Aggregate Bond Total Return Index).
GROWTH OF $10,000
| AVERAGE ANNUAL TOTAL RETURN | 1 Year | 5 Years | 10 Years |
| Class C (with contingent deferred sales charge) | 6.61% | 7.00% | 6.60% |
| Class C (without contingent deferred sales charge) | 7.61% | 7.00% | 6.60% |
| S&P 500 Total Return Index | 16.33% | 15.88% | 13.66% |
| Bloomberg U.S. Aggregate Bond Total Return Index | 3.38% | -1.07% | 1.66% |
| 60% S&P 500 Total Return Index / 40% Bloomberg U.S. Aggregate Bond Total Return Index | 11.16% | 9.03% | 8.98% |
The graph and table do not reflect the deduction of taxes that a shareholder would pay on fund distributions or redemption of fund shares.
KEY FUND STATISTICS
(as of July 31, 2025)
(as of July 31, 2025)
| Fund net assets | $410,875,446 |
| Total number of portfolio holdings | 768^^ |
| Total advisory fee paid | $2,036,150 |
| Portfolio turnover rate | 29%≈ |
| ^^ |
Excluding short-term investments, TBA sales commitments and all derivative contracts except for options purchased. |
| ≈ |
Portfolio turnover excludes the value of portfolio securities received or delivered as a result of in-kind fund share transactions. |
SECTOR DISTRIBUTION
(as of July 31, 2025 )*
(as of July 31, 2025 )*
| Information Technology | 20.6% |
| Financials | 16.8% |
| U.S. Government | 11.0% |
| Industrials | 7.7% |
| Health Care | 7.7% |
| Communication Services | 6.7% |
| Consumer Discretionary | 4.7% |
| Mortgage Securities | 4.5% |
| Energy | 3.7% |
| Asset Backed Securities | 3.6% |
| Basic Materials | 3.5% |
| Real Estate | 2.9% |
| Consumer Staples | 2.0% |
| Utilities | 1.8% |
| Consumer, Cyclical | 1.6% |
| Consumer, Non-cyclical | 0.6% |
| Affiliated Closed-End Fund∞ | 0.3% |
| Foreign Government | 0.2% |
| Government | 0.1% |
| * |
As a percentage of total investments excluding short‑term investments, TBA sales commitments and all derivative contracts except for options purchased. |
| ∞ |
Pioneer ILS Interval Fund is an affiliated closed-end fund managed by Victory Capital Management, Inc. |
Material Fund Changes
Effective April 1, 2025, Pioneer Balanced ESG Fund (the “Predecessor Fund”) reorganized with Victory Pioneer Balanced Fund (the “Reorganization”) pursuant to an agreement and plan of reorganization approved by the shareholders of the Predecessor Fund on March 27, 2025. The Predecessor Fund is the accounting survivor of the Reorganization. Accordingly, the Predecessor Fund’s performance and financial history have become the performance and financial history of the Fund.
In the Reorganization, shareholders holding Class C shares of the Predecessor Fund received Class C shares of the Fund.
Victory Capital Management Inc. (the “Adviser”) is the Fund’s investment adviser. Effective April 1, 2025, Amundi Asset Management US, Inc. (“Amundi US”), the Predecessor Fund’s investment adviser, was combined with Victory Capital Holdings, Inc., the parent company of the Adviser. The portfolio managers of Amundi US became employees of the Adviser.
Effective April 1, 2025, Pioneer Balanced ESG Fund (the “Predecessor Fund”) reorganized with Victory Pioneer Balanced Fund (the “Reorganization”) pursuant to an agreement and plan of reorganization approved by the shareholders of the Predecessor Fund on March 27, 2025. The Predecessor Fund is the accounting survivor of the Reorganization. Accordingly, the Predecessor Fund’s performance and financial history have become the performance and financial history of the Fund.
Victory Capital Management Inc. (the “Adviser”) is the Fund’s investment adviser. Effective April 1, 2025, Amundi Asset Management US, Inc. (“Amundi US”), the Predecessor Fund’s investment adviser, was combined with Victory Capital Holdings, Inc., the parent company of the Adviser. The portfolio managers of Amundi US became employees of the Adviser.
What were the Fund costs for the last year?
(Based on a hypothetical $10,000 investment)
| Class Name | Costs of a $10,000 investment | Costs paid as a percentage of a $10,000 investment |
| Class R6 | $63 | 0.60% |
How did the Fund perform last year and what affected Fund performance?
- For the fiscal year ended July 31, 2025, the Fund’s Class R6 shares, when compared to the performance benchmark at NAV returned 8.71%. For the same period, the Fund’s broad-based benchmarks, the Standard & Poor's 500 (S&P 500) Total Return Index and the Bloomberg U.S. Aggregate Bond Total Return Index, returned 16.33% and 3.38%, respectively. The performance benchmark, a blended benchmark (60% S&P 500 Total Return Index and 40% Bloomberg U.S. Aggregate Bond Total Return Index), returned 11.16% over the period.
- Asset allocation was a positive contributor over the period. The higher allocation to Equity was beneficial as equities outperformed the performance benchmark during this time. Additionally, allocations to financials and securitized fixed income also had a positive contribution compared to the performance benchmark.
- Security selection detracted from performance over the period. Select stocks within the information technology, materials and health care sectors underperformed over the period.
Fund Performance
The line graph below shows the change in value of a $5 million investment made in Class R6 shares of the Fund during the periods shown, compared to that of the S&P 500 Total Return Index, the Bloomberg U.S. Aggregate Bond Total Return Index, and the blended benchmark (60% S&P 500 Total Return Index and 40% Bloomberg U.S. Aggregate Bond Total Return Index).
GROWTH OF $5 million
| AVERAGE ANNUAL TOTAL RETURN | 1 Year | 5 Years | 10 Years |
| Class R6 | 8.71% | 8.14% | 7.70% |
| S&P 500 Total Return Index | 16.33% | 15.88% | 13.66% |
| Bloomberg U.S. Aggregate Bond Total Return Index | 3.38% | -1.07% | 1.66% |
| 60% S&P 500 Total Return Index / 40% Bloomberg U.S. Aggregate Bond Total Return Index | 11.16% | 9.03% | 8.98% |
The graph and table do not reflect the deduction of taxes that a shareholder would pay on fund distributions or redemption of fund shares.
KEY FUND STATISTICS
(as of July 31, 2025)
(as of July 31, 2025)
| Fund net assets | $410,875,446 |
| Total number of portfolio holdings | 768^^ |
| Total advisory fee paid | $2,036,150 |
| Portfolio turnover rate | 29%≈ |
| ^^ |
Excluding short-term investments, TBA sales commitments and all derivative contracts except for options purchased. |
| ≈ |
Portfolio turnover excludes the value of portfolio securities received or delivered as a result of in-kind fund share transactions. |
SECTOR DISTRIBUTION
(as of July 31, 2025 )*
(as of July 31, 2025 )*
| Information Technology | 20.6% |
| Financials | 16.8% |
| U.S. Government | 11.0% |
| Industrials | 7.7% |
| Health Care | 7.7% |
| Communication Services | 6.7% |
| Consumer Discretionary | 4.7% |
| Mortgage Securities | 4.5% |
| Energy | 3.7% |
| Asset Backed Securities | 3.6% |
| Basic Materials | 3.5% |
| Real Estate | 2.9% |
| Consumer Staples | 2.0% |
| Utilities | 1.8% |
| Consumer, Cyclical | 1.6% |
| Consumer, Non-cyclical | 0.6% |
| Affiliated Closed-End Fund∞ | 0.3% |
| Foreign Government | 0.2% |
| Government | 0.1% |
| * |
As a percentage of total investments excluding short‑term investments, TBA sales commitments and all derivative contracts except for options purchased. |
| ∞ |
Pioneer ILS Interval Fund is an affiliated closed-end fund managed by Victory Capital Management, Inc. |
Material Fund Changes
Effective April 1, 2025, Pioneer Balanced ESG Fund (the “Predecessor Fund”) reorganized with Victory Pioneer Balanced Fund (the “Reorganization”) pursuant to an agreement and plan of reorganization approved by the shareholders of the Predecessor Fund on March 27, 2025. The Predecessor Fund is the accounting survivor of the Reorganization. Accordingly, the Predecessor Fund’s performance and financial history have become the performance and financial history of the Fund.
In the Reorganization, shareholders holding Class K shares of the Predecessor Fund received Class R6 shares of the Fund.
Victory Capital Management Inc. (the “Adviser”) is the Fund’s investment adviser. Effective April 1, 2025, Amundi Asset Management US, Inc. (“Amundi US”), the Predecessor Fund’s investment adviser, was combined with Victory Capital Holdings, Inc., the parent company of the Adviser. The portfolio managers of Amundi US became employees of the Adviser.
Effective April 1, 2025, Pioneer Balanced ESG Fund (the “Predecessor Fund”) reorganized with Victory Pioneer Balanced Fund (the “Reorganization”) pursuant to an agreement and plan of reorganization approved by the shareholders of the Predecessor Fund on March 27, 2025. The Predecessor Fund is the accounting survivor of the Reorganization. Accordingly, the Predecessor Fund’s performance and financial history have become the performance and financial history of the Fund.
Victory Capital Management Inc. (the “Adviser”) is the Fund’s investment adviser. Effective April 1, 2025, Amundi Asset Management US, Inc. (“Amundi US”), the Predecessor Fund’s investment adviser, was combined with Victory Capital Holdings, Inc., the parent company of the Adviser. The portfolio managers of Amundi US became employees of the Adviser.
What were the Fund costs for the last year?
(Based on a hypothetical $10,000 investment)
| Class Name | Costs of a $10,000 investment | Costs paid as a percentage of a $10,000 investment |
| Class Y | $73 | 0.70% |
How did the Fund perform last year and what affected Fund performance?
- For the fiscal year ended July 31, 2025, the Fund’s Class Y shares, when compared to the performance benchmark at NAV returned 8.59%. For the same period, the Fund’s broad-based benchmarks, the Standard & Poor's 500 (S&P 500) Total Return Index and the Bloomberg U.S. Aggregate Bond Total Return Index, returned 16.33% and 3.38%, respectively. The performance benchmark, a blended benchmark (60% S&P 500 Total Return Index and 40% Bloomberg U.S. Aggregate Bond Total Return Index), returned 11.16% over the period.
- Asset allocation was a positive contributor over the period. The higher allocation to Equity was beneficial as equities outperformed the performance benchmark during this time. Additionally, allocations to financials and securitized fixed income also had a positive contribution compared to the performance benchmark.
- Security selection detracted from performance over the period. Select stocks within the information technology, materials and health care sectors underperformed over the period.
Fund Performance
The line graph below shows the change in value of a $5 million investment made in Class Y shares of the Fund during the periods shown, compared to that of the S&P 500 Total Return Index, the Bloomberg U.S. Aggregate Bond Total Return Index, and the blended benchmark (60% S&P 500 Total Return Index and 40% Bloomberg U.S. Aggregate Bond Total Return Index).
GROWTH OF $5 million
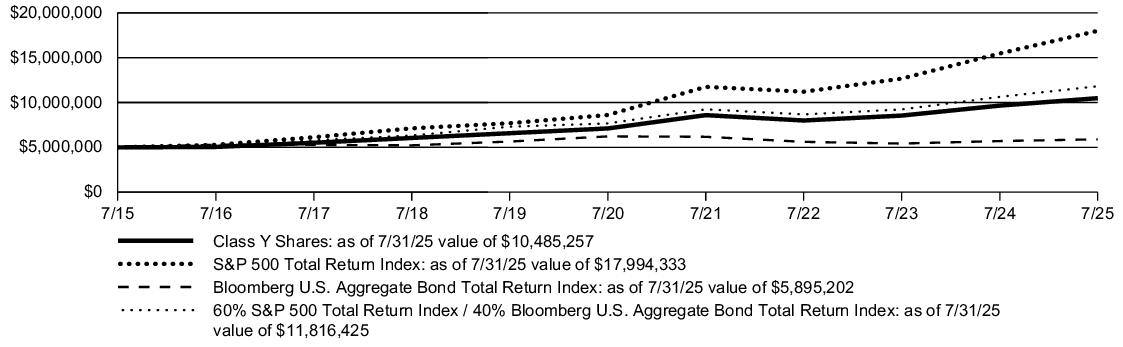
| AVERAGE ANNUAL TOTAL RETURN | 1 Year | 5 Years | 10 Years |
| Class Y | 8.59% | 8.08% | 7.69% |
| S&P 500 Total Return Index | 16.33% | 15.88% | 13.66% |
| Bloomberg U.S. Aggregate Bond Total Return Index | 3.38% | -1.07% | 1.66% |
| 60% S&P 500 Total Return Index / 40% Bloomberg U.S. Aggregate Bond Total Return Index | 11.16% | 9.03% | 8.98% |
The graph and table do not reflect the deduction of taxes that a shareholder would pay on fund distributions or redemption of fund shares.
KEY FUND STATISTICS
(as of July 31, 2025)
(as of July 31, 2025)
| Fund net assets | $410,875,446 |
| Total number of portfolio holdings | 768^^ |
| Total advisory fee paid | $2,036,150 |
| Portfolio turnover rate | 29%≈ |
| ^^ |
Excluding short-term investments, TBA sales commitments and all derivative contracts except for options purchased. |
| ≈ |
Portfolio turnover excludes the value of portfolio securities received or delivered as a result of in-kind fund share transactions. |
SECTOR DISTRIBUTION
(as of July 31, 2025 )*
(as of July 31, 2025 )*
| Information Technology | 20.6% |
| Financials | 16.8% |
| U.S. Government | 11.0% |
| Industrials | 7.7% |
| Health Care | 7.7% |
| Communication Services | 6.7% |
| Consumer Discretionary | 4.7% |
| Mortgage Securities | 4.5% |
| Energy | 3.7% |
| Asset Backed Securities | 3.6% |
| Basic Materials | 3.5% |
| Real Estate | 2.9% |
| Consumer Staples | 2.0% |
| Utilities | 1.8% |
| Consumer, Cyclical | 1.6% |
| Consumer, Non-cyclical | 0.6% |
| Affiliated Closed-End Fund∞ | 0.3% |
| Foreign Government | 0.2% |
| Government | 0.1% |
| * |
As a percentage of total investments excluding short‑term investments, TBA sales commitments and all derivative contracts except for options purchased. |
| ∞ |
Pioneer ILS Interval Fund is an affiliated closed-end fund managed by Victory Capital Management, Inc. |
Material Fund Changes
Effective April 1, 2025, Pioneer Balanced ESG Fund (the “Predecessor Fund”) reorganized with Victory Pioneer Balanced Fund (the “Reorganization”) pursuant to an agreement and plan of reorganization approved by the shareholders of the Predecessor Fund on March 27, 2025. The Predecessor Fund is the accounting survivor of the Reorganization. Accordingly, the Predecessor Fund’s performance and financial history have become the performance and financial history of the Fund.
In the Reorganization, shareholders holding Class Y shares of the Predecessor Fund received Class Y shares of the Fund.
Victory Capital Management Inc. (the “Adviser”) is the Fund’s investment adviser. Effective April 1, 2025, Amundi Asset Management US, Inc. (“Amundi US”), the Predecessor Fund’s investment adviser, was combined with Victory Capital Holdings, Inc., the parent company of the Adviser. The portfolio managers of Amundi US became employees of the Adviser.
Effective April 1, 2025, Pioneer Balanced ESG Fund (the “Predecessor Fund”) reorganized with Victory Pioneer Balanced Fund (the “Reorganization”) pursuant to an agreement and plan of reorganization approved by the shareholders of the Predecessor Fund on March 27, 2025. The Predecessor Fund is the accounting survivor of the Reorganization. Accordingly, the Predecessor Fund’s performance and financial history have become the performance and financial history of the Fund.
Victory Capital Management Inc. (the “Adviser”) is the Fund’s investment adviser. Effective April 1, 2025, Amundi Asset Management US, Inc. (“Amundi US”), the Predecessor Fund’s investment adviser, was combined with Victory Capital Holdings, Inc., the parent company of the Adviser. The portfolio managers of Amundi US became employees of the Adviser.
| [1] | Excluding short‑term investments and all derivative contracts except for options purchased. |
| [2] | Excluding short‑term investments and all derivative contracts except for options purchased. |
| [3] | Excluding short‑term investments and all derivative contracts except for options purchased. |
| [4] | Excluding short‑term investments and all derivative contracts except for options purchased. |
| [5] | Excluding short-term investments and all derivative contracts except for options purchased. |
| [6] | Excluding short-term investments and all derivative contracts except for options purchased. |
| [7] | Excluding short‑term investments and all derivative contracts except for options purchased. |
| [8] | Excluding short‑term investments and all derivative contracts except for options purchased. |
| [9] | Excluding short-term investments, TBA sales commitments and all derivative contracts except for options purchased. |
| [10] | Portfolio turnover excludes the value of portfolio securities received or delivered as a result of in-kind fund share transactions. |
| [11] | Excluding short‑term investments and all derivative contracts except for options purchased. |
| [12] | Excluding short-term investments, TBA sales commitments and all derivative contracts except for options purchased. |
| [13] | Portfolio turnover excludes the value of portfolio securities received or delivered as a result of in-kind fund share transactions. |
| [14] | Excluding short-term investments, TBA sales commitments and all derivative contracts except for options purchased. |
| [15] | Portfolio turnover excludes the value of portfolio securities received or delivered as a result of in-kind fund share transactions. |
| [16] | Excluding short-term investments, TBA sales commitments and all derivative contracts except for options purchased. |
| [17] | Portfolio turnover excludes the value of portfolio securities received or delivered as a result of in-kind fund share transactions. |