Shareholder Report
Jul. 31, 2025
USD ($)
Holding
WHAT WERE THE FUND COSTS FOR THE LAST YEAR?
(Based on a hypothetical $10,000 investment)
| Fund | Costs of a $10,000 investment | Costs paid as a percentage of a $10,000 investment |
| First Trust Core Investment Grade ETF | $56(1) | 0.55%(1) |
|
(1) |
Excludes any Acquired Fund Fees and Expenses of underlying investment companies in which the Fund invests. |
HOW DID THE FUND PERFORM LAST YEAR? WHAT AFFECTED THE FUND’S PERFORMANCE?
The Fund returned 4.13% for the 12 months ended July 31, 2025. The Fund outperformed its benchmark, the Bloomberg US Aggregate Bond Index, which returned 3.38% for the same Period.
This 75 basis points (“bps”) of outperformance was due to several factors during the Period:
-
Overall, the Fund generated a greater level of income than the benchmark which was beneficial to relative performance.
-
The Fund benefited from its overweight allocations to Agency Mortgage-Backed Securities and Securitized Credit as spreads tightened over the Period.
-
The Fund benefited from security selection within the corporate sector, particularly in the Industrial and Financial subsectors.
-
Active yield curve positioning aided Fund performance.
-
The use of derivatives was a net benefit to the Fund.
FUND PERFORMANCE (November 7, 2023 to July 31, 2025)
The performance line graph below shows the performance of a hypothetical $10,000 initial investment in the Fund over a ten-year period (or for the life of the Fund, if shorter). The subsequent account value as of the end of the Period is listed next to the name of the Fund or index, as applicable. The performance table below shows the average annual total returns of the Fund for the past one-, five-, and ten-year periods, as applicable (or for the life of the Fund, if shorter), as of the end of the Period. Both the line graph and performance table compare the Fund’s performance to an appropriate broad-based index and may compare to additional indices reflecting the market segment(s) in which the Fund invests over the same periods.
Investment Performance of $10,000
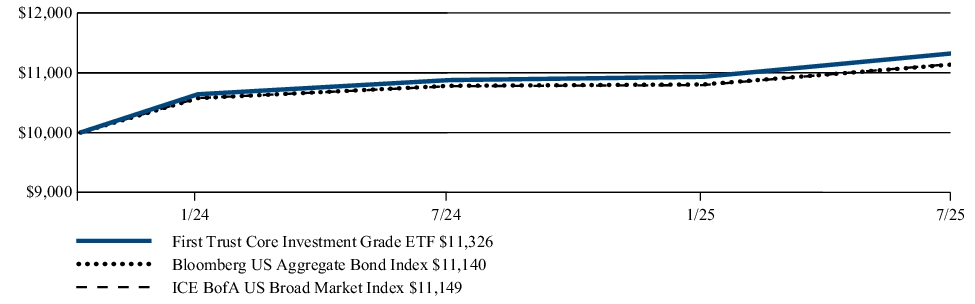
| Average Annual Total Returns (as of July 31, 2025) | 1 Year | Since Inception (11/7/23) |
| First Trust Core Investment Grade ETF | 4.13% | 7.46% |
| Bloomberg US Aggregate Bond Index | 3.38% | 6.44% |
| ICE BofA US Broad Market Index | 3.40% | 6.49% |
Visit www.ftportfolios.com/etf/FTCB for more recent performance information.
KEY FUND STATISTICS (As of July 31, 2025)
| Fund net assets | $1,273,166,619 |
| Total number of portfolio holdings | 625 |
| Total advisory fee paid | $2,817,021 |
| Portfolio turnover rate | 183% |
WHAT DID THE FUND INVEST IN? (As of July 31, 2025)
The tables below show the investment makeup of the Fund, representing the percentage of net assets and percentage of total investments, respectively, of the Fund.
Fund Allocation
| U.S. Government Agency Mortgage-Backed Securities | 36.5% |
| Corporate Bonds and Notes | 20.3% |
| Mortgage-Backed Securities | 17.5% |
| U.S. Government Bonds and Notes | 15.7% |
| Asset-Backed Securities | 5.5% |
| Foreign Corporate Bonds and Notes | 3.7% |
| U.S. Government Agency Securities | 1.1% |
| Municipal Bonds | 0.5% |
| Exchange-Traded Funds | 0.0% |
| U.S. Treasury Bills | 3.1% |
| Money Market Funds | 1.6% |
| Purchased Options | 0.0% |
| U.S. Government Agency Mortgage-Backed Securities Sold Short | (0.6%) |
| Written Options | (0.1%) |
| Net Other Assets and Liabilities(1) | (4.8%) |
| Total | 100.0% |
Credit Quality (2)
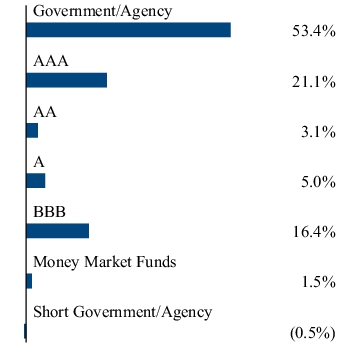
Any amount shown as 0.0% represents less than 0.1%.
(1) Includes variation margin on futures contracts.
(2) The ratings are by one or more nationally recognized statistical rating organizations (NRSROs), including S&P Global Ratings, Moody’s Investors Service, Inc., Fitch Ratings, DBRS, Inc., Kroll Bond Rating Agency, Inc. or a comparably rated NRSRO. For situations in which a security is rated by more than one NRSRO and the ratings are not equivalent, the highest rating is used. A credit rating is an assessment provided by a NRSRO of the creditworthiness of an issuer with respect to debt obligations. Ratings are measured on a scale that generally ranges from AAA (highest) to D (lowest). Investment grade is defined as those issuers that have a long-term credit rating of BBB- or higher. “NR” indicates no rating. The credit ratings shown relate to the creditworthiness of the issuers of the underlying securities in the Fund, and not to the Fund or its shares. U.S. Agency, U.S. Agency mortgage-backed, and U.S. Treasury securities appear under “Government & Agency.” Credit ratings are subject to change.
This report describes changes to the Fund that occurred during and after the reporting period.
WHAT WERE THE FUND COSTS FOR THE LAST YEAR?
(Based on a hypothetical $10,000 investment)
| Fund | Costs of a $10,000 investment | Costs paid as a percentage of a $10,000 investment |
| First Trust Commercial Mortgage Opportunities ETF | $57 | 0.55%(1) |
|
(1) |
Includes excise tax. If this excise tax expense was not included, the expense ratio would have been 0.54%. |
HOW DID THE FUND PERFORM LAST YEAR? WHAT AFFECTED THE FUND’S PERFORMANCE?
The Fund returned 6.08% for the 12 months ended July 31, 2025. The Fund underperformed its benchmark, the Bloomberg Non-Agency Investment Grade CMBS: US Aggregate Eligible Aaa Index, which returned 6.10% for the same Period.
This 2 basis points (“bps”) of underperformance was due to several factors during the Period:
-
Overall, the Fund generated a greater level of income than the benchmark, which aided performance.
-
The Fund was overweight to single-asset single-borrower floaters and Conduit Commercial Mortgage-Backed Securities Interest-Only tranches. The allocation to these sectors was beneficial to the Fund’s performance.
-
Security selection within in-benchmark securities, fixed rate Conduit Principal & Interest bonds, generated relative underperformance.
-
While utilized to primarily manage yield curve risk, the use of derivatives was mildly detrimental to the Fund’s performance.
FUND PERFORMANCE (February 27, 2024 to July 31, 2025)
The performance line graph below shows the performance of a hypothetical $10,000 initial investment in the Fund over a ten-year period (or for the life of the Fund, if shorter). The subsequent account value as of the end of the Period is listed next to the name of the Fund or index, as applicable. The performance table below shows the average annual total returns of the Fund for the past one-, five-, and ten-year periods, as applicable (or for the life of the Fund, if shorter), as of the end of the Period. Both the line graph and performance table compare the Fund’s performance to an appropriate broad-based index and may compare to additional indices reflecting the market segment(s) in which the Fund invests over the same periods.
Investment Performance of $10,000
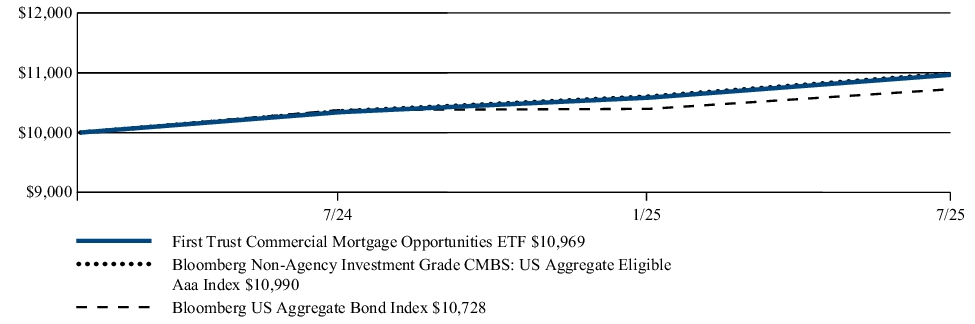
| Average Annual Total Returns (as of July 31, 2025) | 1 Year | Since Inception (2/27/24) |
| First Trust Commercial Mortgage Opportunities ETF | 6.08% | 6.71% |
| Bloomberg Non-Agency Investment Grade CMBS: US Aggregate Eligible Aaa Index | 6.10% | 6.86% |
| Bloomberg US Aggregate Bond Index | 3.38% | 5.07% |
Visit www.ftportfolios.com/etf/CAAA for more recent performance information.
KEY FUND STATISTICS (As of July 31, 2025)
| Fund net assets | $18,286,259 |
| Total number of portfolio holdings | 70 |
| Total advisory fee paid | $78,749 |
| Portfolio turnover rate | 92% |
WHAT DID THE FUND INVEST IN? (As of July 31, 2025)
The tables below show the investment makeup of the Fund, representing the percentage of net assets and percentage of total investments, respectively, of the Fund.
Fund Allocation
| Mortgage-Backed Securities | 95.0% |
| U.S. Government Agency Mortgage-Backed Securities | 0.6% |
| Money Market Funds | 3.6% |
| Net Other Assets and Liabilities(1) | 0.8% |
| Total | 100.0% |
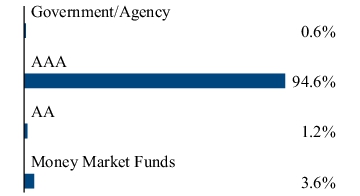
Credit Quality (2)
(1) Includes variation margin on futures contracts.
(2) The ratings are by one or more nationally recognized statistical rating organizations (NRSROs), including S&P Global Ratings, Moody’s Investors Service, Inc., Fitch Ratings, DBRS, Inc., Kroll Bond Rating Agency, Inc. or a comparably rated NRSRO. For situations in which a security is rated by more than one NRSRO and the ratings are not equivalent, the highest rating is used. A credit rating is an assessment provided by a NRSRO of the creditworthiness of an issuer with respect to debt obligations. Ratings are measured on a scale that generally ranges from AAA (highest) to D (lowest). Investment grade is defined as those issuers that have a long-term credit rating of BBB- or higher. “NR” indicates no rating. The credit ratings shown relate to the creditworthiness of the issuers of the underlying securities in the Fund, and not to the Fund or its shares. U.S. Agency, U.S. Agency mortgage-backed, and U.S. Treasury securities appear under “Government & Agency.” Credit ratings are subject to change.
HOW HAS THE FUND MATERIALLY CHANGED?
This is a summary of certain changes to the Fund since August 1, 2024. For more complete information, you may review the Fund’s prospectus and any applicable supplements at www.ftportfolios.com/fund-documents/etf/CAAA or upon request at 1-800-621-1675 or info@ftportfolios.com.
Effective June 30, 2025, the Fund’s annual unitary management fee was reduced from 0.55% to 0.45% of the Fund’s average daily net assets.
Effective September 2, 2025, the Fund changed its name from First Trust Commercial Mortgage Opportunities ETF to First Trust AAA CMBS ETF. In connection with the change to the Fund’s name, the Fund’s non-fundamental investment policy adopted pursuant to Rule 35d-1 under the Investment Company Act of 1940 was revised as follows:
Under normal market conditions, the Fund will invest at least 80% of its net assets (plus any borrowings for investment purposes) in commercial mortgage-backed securities with a ‘AAA’ rating (or equivalent) at the time of purchase, as determined by at least one nationally recognized statistical rating organization or, if unrated, as determined by the Advisor to be of comparable credit quality at the time of purchase.
Effective June 30, 2025, the Fund’s annual unitary management fee was reduced from 0.55% to 0.45% of the Fund’s average daily net assets.
This is a summary of certain changes to the Fund since August 1, 2024. For more complete information, you may review the Fund’s prospectus and any applicable supplements at www.ftportfolios.com/fund-documents/etf/CAAA or upon request at 1-800-621-1675 or info@ftportfolios.com.
This report describes changes to the Fund that occurred during the reporting period.
WHAT WERE THE FUND COSTS FOR THE LAST YEAR?
(Based on a hypothetical $10,000 investment)
| Fund | Costs of a $10,000 investment | Costs paid as a percentage of a $10,000 investment |
| First Trust Structured Credit Income Opportunities ETF | $98 | 0.94% |
HOW DID THE FUND PERFORM LAST YEAR? WHAT AFFECTED THE FUND’S PERFORMANCE?
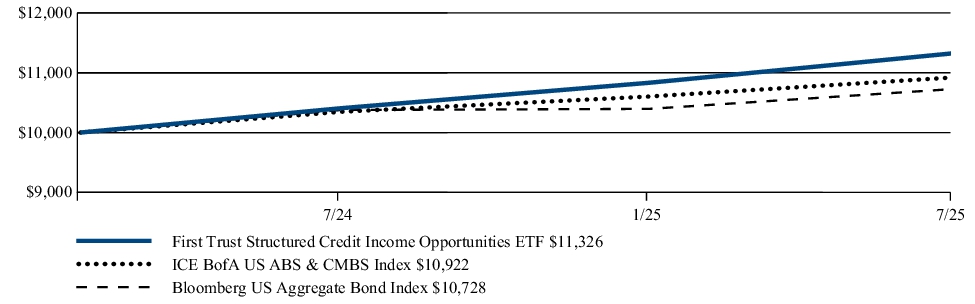
The Fund returned 8.85% for the 12 months ended July 31, 2025. The Fund outperformed its benchmark, the ICE BofA ABS & CMBS Index, which returned 5.57% for the same Period.
This 328 basis points (“bps”) of outperformance was due to several factors during the Period:
-
The Fund generated a significantly higher level of income than its benchmark, which aided relative Fund performance.
-
Overall, the Fund’s allocation to lower rated securitized credit sectors aided performance, as spreads tightened over the Period.
-
While generally used to manage yield curve exposures, the use of derivatives was a net benefit to the Fund’s performance.
FUND PERFORMANCE (February 27, 2024 to July 31, 2025)
The performance line graph below shows the performance of a hypothetical $10,000 initial investment in the Fund over a ten-year period (or for the life of the Fund, if shorter). The subsequent account value as of the end of the Period is listed next to the name of the Fund or index, as applicable. The performance table below shows the average annual total returns of the Fund for the past one-, five-, and ten-year periods, as applicable (or for the life of the Fund, if shorter), as of the end of the Period. Both the line graph and performance table compare the Fund’s performance to an appropriate broad-based index and may compare to additional indices reflecting the market segment(s) in which the Fund invests over the same periods.
Investment Performance of $10,000
| Average Annual Total Returns (as of July 31, 2025) | 1 Year | Since Inception (2/27/24) |
| First Trust Structured Credit Income Opportunities ETF | 8.85% | 9.13% |
| ICE BofA US ABS & CMBS Index | 5.57% | 6.40% |
| Bloomberg US Aggregate Bond Index | 3.38% | 5.07% |
Visit www.ftportfolios.com/etf/SCIO for more recent performance information.
KEY FUND STATISTICS (As of July 31, 2025)
| Fund net assets | $25,684,046 |
| Total number of portfolio holdings | 89 |
| Total advisory fee paid | $130,237 |
| Portfolio turnover rate | 100% |
WHAT DID THE FUND INVEST IN? (As of July 31, 2025)
The tables below show the investment makeup of the Fund, representing the percentage of net assets and percentage of total investments, respectively, of the Fund.
Fund Allocation
| Mortgage-Backed Securities | 55.1% |
| Asset-Backed Securities | 31.7% |
| U.S. Government Agency Mortgage-Backed Securities | 6.5% |
| Money Market Funds | 11.9% |
| Purchased Options | 0.0% |
| Net Other Assets and Liabilities(1) | (5.2%) |
| Total | 100.0% |
Credit Quality (2)
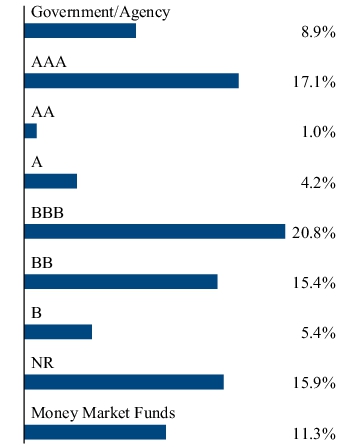
Any amount shown as 0.0% represents less than 0.1%.
(1) Includes variation margin on futures contracts.
(2) The ratings are by one or more nationally recognized statistical rating organizations (NRSROs), including S&P Global Ratings, Moody’s Investors Service, Inc., Fitch Ratings, DBRS, Inc., Kroll Bond Rating Agency, Inc. or a comparably rated NRSRO. For situations in which a security is rated by more than one NRSRO and the ratings are not equivalent, the highest rating is used. A credit rating is an assessment provided by a NRSRO of the creditworthiness of an issuer with respect to debt obligations. Ratings are measured on a scale that generally ranges from AAA (highest) to D (lowest). Investment grade is defined as those issuers that have a long-term credit rating of BBB- or higher. “NR” indicates no rating. The credit ratings shown relate to the creditworthiness of the issuers of the underlying securities in the Fund, and not to the Fund or its shares. U.S. Agency, U.S. Agency mortgage-backed, and U.S. Treasury securities appear under “Government & Agency.” Credit ratings are subject to change.
HOW HAS THE FUND MATERIALLY CHANGED?
This is a summary of certain changes to the Fund since August 1, 2024. For more complete information, you may review the Fund’s prospectus and any applicable supplements at www.ftportfolios.com/fund-documents/etf/SCIO or upon request at 1-800-621-1675 or info@ftportfolios.com.
Effective June 30, 2025, the Fund’s annual unitary management fee was reduced from 0.95% to 0.85% of the Fund’s average daily net assets.
Effective June 30, 2025, the Fund’s annual unitary management fee was reduced from 0.95% to 0.85% of the Fund’s average daily net assets.
This is a summary of certain changes to the Fund since August 1, 2024. For more complete information, you may review the Fund’s prospectus and any applicable supplements at www.ftportfolios.com/fund-documents/etf/SCIO or upon request at 1-800-621-1675 or info@ftportfolios.com.
| [1] | Excludes any Acquired Fund Fees and Expenses of underlying investment companies in which the Fund invests. |
| [2] | Includes excise tax. If this excise tax expense was not included, the expense ratio would have been 0.54%. |