Shareholder Report
Jul. 31, 2025
USD ($)
Holding
Fund Expenses
What were the Portfolio costs for the last six months ?
(Based on a hypothetical $10,000 investment)
| Portfolio (Class) | Costs of a $10,000 investment | Costs paid as a percentage of a $10,000 investment |
| SA JPMorgan Emerging Markets Portfolio (Class 3)* | $78 | 1.45%** |
| * |
The expenses shown in the table are meant to highlight your ongoing costs only and do not reflect any fees and expenses that may be charged by the variable annuity contracts and variable life insurance policies that invest in the Portfolio.
|
| ** |
Annualized
|
Key Fund Statistics
The following table outlines key fund statistics.
| Net assets | $198M |
| Total number of portfolio holdings | 150 |
| Total net advisory fee paid | $0.9M |
| Portfolio turnover rate during the reporting period | 41% |
Graphical Representation of Holdings
The information below represents the composition of the Portfolio's net assets as of the end of the period.
Top Industries*
| Banks | 20.2% |
| Semiconductors | 19.0% |
| Internet | 11.8% |
| Insurance | 5.2% |
| Computers | 3.0% |
| Telecommunications | 2.9% |
| Software | 2.8% |
| Diversified Financial Services | 2.6% |
| Auto Manufacturers | 2.5% |
| Airlines | 1.9% |
| Food | 1.8% |
| Retail | 1.8% |
| Oil & Gas | 1.7% |
| Electric | 1.7% |
| Auto Parts & Equipment | 1.6% |
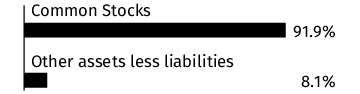
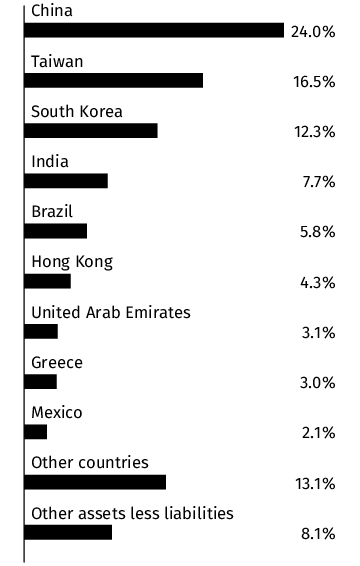
Portfolio Composition

Country

* Percentages exclude derivatives (other than purchased options), if any.
Changes in and Disagreements with Accountants
There were no disagreements with the accountants during the period.
Fund Expenses
What were the Portfolio costs for the last six months ?
(Based on a hypothetical $10,000 investment)
| Portfolio (Class) | Costs of a $10,000 investment | Costs paid as a percentage of a $10,000 investment |
| SA JPMorgan Emerging Markets Portfolio (Class 1)* | $64 | 1.20%** |
| * |
The expenses shown in the table are meant to highlight your ongoing costs only and do not reflect any fees and expenses that may be charged by the variable annuity contracts and variable life insurance policies that invest in the Portfolio.
|
| ** |
Annualized
|
Key Fund Statistics
The following table outlines key fund statistics.
| Net assets | $198M |
| Total number of portfolio holdings | 150 |
| Total net advisory fee paid | $0.9M |
| Portfolio turnover rate during the reporting period | 41% |
Graphical Representation of Holdings
The information below represents the composition of the Portfolio's net assets as of the end of the period.
Top Industries*
| Banks | 20.2% |
| Semiconductors | 19.0% |
| Internet | 11.8% |
| Insurance | 5.2% |
| Computers | 3.0% |
| Telecommunications | 2.9% |
| Software | 2.8% |
| Diversified Financial Services | 2.6% |
| Auto Manufacturers | 2.5% |
| Airlines | 1.9% |
| Food | 1.8% |
| Retail | 1.8% |
| Oil & Gas | 1.7% |
| Electric | 1.7% |
| Auto Parts & Equipment | 1.6% |
Portfolio Composition
Country
* Percentages exclude derivatives (other than purchased options), if any.
Changes in and Disagreements with Accountants
There were no disagreements with the accountants during the period.
Fund Expenses
What were the Portfolio costs for the last six months ?
(Based on a hypothetical $10,000 investment)
| Portfolio (Class) | Costs of a $10,000 investment | Costs paid as a percentage of a $10,000 investment |
| SA JPMorgan Emerging Markets Portfolio (Class 2)* | $72 | 1.35%** |
| * |
The expenses shown in the table are meant to highlight your ongoing costs only and do not reflect any fees and expenses that may be charged by the variable annuity contracts and variable life insurance policies that invest in the Portfolio.
|
| ** |
Annualized
|
Key Fund Statistics
The following table outlines key fund statistics.
| Net assets | $198M |
| Total number of portfolio holdings | 150 |
| Total net advisory fee paid | $0.9M |
| Portfolio turnover rate during the reporting period | 41% |
Graphical Representation of Holdings
The information below represents the composition of the Portfolio's net assets as of the end of the period.
Top Industries*
| Banks | 20.2% |
| Semiconductors | 19.0% |
| Internet | 11.8% |
| Insurance | 5.2% |
| Computers | 3.0% |
| Telecommunications | 2.9% |
| Software | 2.8% |
| Diversified Financial Services | 2.6% |
| Auto Manufacturers | 2.5% |
| Airlines | 1.9% |
| Food | 1.8% |
| Retail | 1.8% |
| Oil & Gas | 1.7% |
| Electric | 1.7% |
| Auto Parts & Equipment | 1.6% |
Portfolio Composition

Country

* Percentages exclude derivatives (other than purchased options), if any.
Changes in and Disagreements with Accountants
There were no disagreements with the accountants during the period.
Fund Expenses
What were the Portfolio costs for the last six months ?
(Based on a hypothetical $10,000 investment)
| Portfolio (Class) | Costs of a $10,000 investment | Costs paid as a percentage of a $10,000 investment |
| SA Morgan Stanley International Equities Portfolio (Class 1)* | $45 | 0.87%** |
| * |
The expenses shown in the table are meant to highlight your ongoing costs only and do not reflect any fees and expenses that may be charged by the variable annuity contracts and variable life insurance policies that invest in the Portfolio.
|
| ** |
Annualized
|
Key Fund Statistics
The following table outlines key fund statistics.
| Net assets | $344M |
| Total number of portfolio holdings | 58 |
| Total net advisory fee paid | $1.3M |
| Portfolio turnover rate during the reporting period | 30% |
Graphical Representation of Holdings
The information below represents the composition of the Portfolio's net assets as of the end of the period.
Top Industries*
| Machinery-Diversified | 10.0% |
| Semiconductors | 9.4% |
| Software | 7.2% |
| Cosmetics/Personal Care | 6.5% |
| Banks | 5.9% |
| Pharmaceuticals | 5.0% |
| Insurance | 4.7% |
| Electronics | 4.2% |
| Computers | 3.7% |
| Retail | 3.2% |
| Diversified Financial Services | 3.1% |
| Commercial Services | 3.0% |
| Aerospace/Defense | 2.8% |
| Internet | 2.8% |
| Beverages | 2.7% |
Portfolio Composition
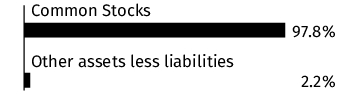
Country
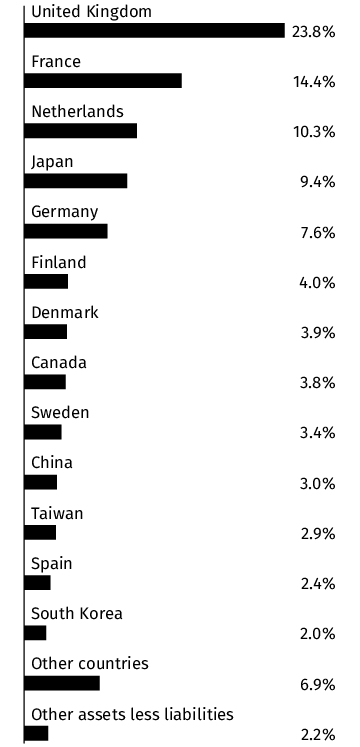
* Percentages exclude derivatives (other than purchased options), if any.
Changes in and Disagreements with Accountants
There were no disagreements with the accountants during the period.
Fund Expenses
What were the Portfolio costs for the last six months ?
(Based on a hypothetical $10,000 investment)
| Portfolio (Class) | Costs of a $10,000 investment | Costs paid as a percentage of a $10,000 investment |
| SA Morgan Stanley International Equities Portfolio (Class 2)* | $53 | 1.02%** |
| * |
The expenses shown in the table are meant to highlight your ongoing costs only and do not reflect any fees and expenses that may be charged by the variable annuity contracts and variable life insurance policies that invest in the Portfolio.
|
| ** |
Annualized
|
Key Fund Statistics
The following table outlines key fund statistics.
| Net assets | $344M |
| Total number of portfolio holdings | 58 |
| Total net advisory fee paid | $1.3M |
| Portfolio turnover rate during the reporting period | 30% |
Graphical Representation of Holdings
The information below represents the composition of the Portfolio's net assets as of the end of the period.
Top Industries*
| Machinery-Diversified | 10.0% |
| Semiconductors | 9.4% |
| Software | 7.2% |
| Cosmetics/Personal Care | 6.5% |
| Banks | 5.9% |
| Pharmaceuticals | 5.0% |
| Insurance | 4.7% |
| Electronics | 4.2% |
| Computers | 3.7% |
| Retail | 3.2% |
| Diversified Financial Services | 3.1% |
| Commercial Services | 3.0% |
| Aerospace/Defense | 2.8% |
| Internet | 2.8% |
| Beverages | 2.7% |
Portfolio Composition

Country

* Percentages exclude derivatives (other than purchased options), if any.
Changes in and Disagreements with Accountants
There were no disagreements with the accountants during the period.
Fund Expenses
What were the Portfolio costs for the last six months ?
(Based on a hypothetical $10,000 investment)
| Portfolio (Class) | Costs of a $10,000 investment | Costs paid as a percentage of a $10,000 investment |
| SA Morgan Stanley International Equities Portfolio (Class 3)* | $58 | 1.12%** |
| * |
The expenses shown in the table are meant to highlight your ongoing costs only and do not reflect any fees and expenses that may be charged by the variable annuity contracts and variable life insurance policies that invest in the Portfolio.
|
| ** |
Annualized
|
Key Fund Statistics
The following table outlines key fund statistics.
| Net assets | $344M |
| Total number of portfolio holdings | 58 |
| Total net advisory fee paid | $1.3M |
| Portfolio turnover rate during the reporting period | 30% |
Graphical Representation of Holdings
The information below represents the composition of the Portfolio's net assets as of the end of the period.
Top Industries*
| Machinery-Diversified | 10.0% |
| Semiconductors | 9.4% |
| Software | 7.2% |
| Cosmetics/Personal Care | 6.5% |
| Banks | 5.9% |
| Pharmaceuticals | 5.0% |
| Insurance | 4.7% |
| Electronics | 4.2% |
| Computers | 3.7% |
| Retail | 3.2% |
| Diversified Financial Services | 3.1% |
| Commercial Services | 3.0% |
| Aerospace/Defense | 2.8% |
| Internet | 2.8% |
| Beverages | 2.7% |
Portfolio Composition

Country

* Percentages exclude derivatives (other than purchased options), if any.
Changes in and Disagreements with Accountants
There were no disagreements with the accountants during the period.
Fund Expenses
What were the Portfolio costs for the last six months ?
(Based on a hypothetical $10,000 investment)
| Portfolio (Class) | Costs of a $10,000 investment | Costs paid as a percentage of a $10,000 investment |
| SA PineBridge High-Yield Bond Portfolio (Class 3)* | $49 | 0.98%** |
| * |
The expenses shown in the table are meant to highlight your ongoing costs only and do not reflect any fees and expenses that may be charged by the variable annuity contracts and variable life insurance policies that invest in the Portfolio.
|
| ** |
Annualized
|
Key Fund Statistics
The following table outlines key fund statistics.
| Net assets | $263M |
| Total number of portfolio holdings | 269 |
| Total net advisory fee paid | $0.8M |
| Portfolio turnover rate during the reporting period | 23% |
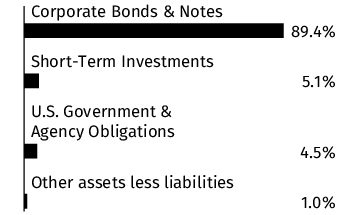
Graphical Representation of Holdings
The information below represents the composition of the Portfolio as of the end of the period.
Top Industries*
(% of net assets)
(% of net assets)
| Diversified Financial Services | 7.1% |
| Commercial Services | 6.8% |
| Telecommunications | 6.4% |
| Pipelines | 6.4% |
| Oil & Gas | 6.2% |
| Media | 6.0% |
| Retail | 4.5% |
| Electric | 4.3% |
| REITS | 3.4% |
| Leisure Time | 2.9% |
| Insurance | 2.8% |
| Entertainment | 2.8% |
| Iron/Steel | 2.8% |
| Pharmaceuticals | 2.7% |
| Packaging & Containers | 2.6% |
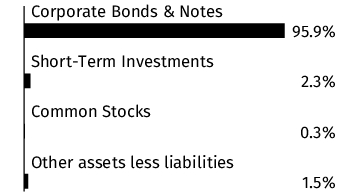
Portfolio Composition
(% of net assets)
(% of net assets)

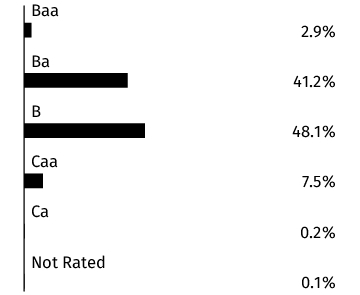
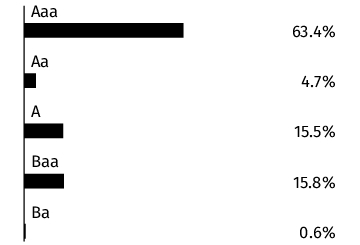
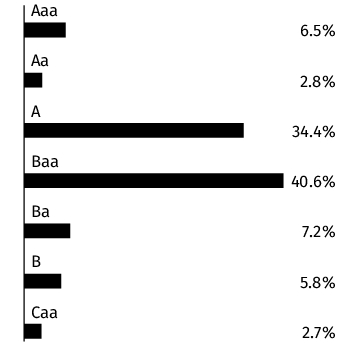
Credit Quality **
(% of total debt issues)
(% of total debt issues)
* Percentages exclude derivatives (other than purchased options), if any.
** Credit quality ratings shown above reflect the rating assigned by Moody's Investors Service, Inc. Where Moody's ratings are not available, we have used Standard & Poor's ratings. Unrated investments do not necessarily indicate low credit quality. Credit quality ratings are subject to change. Percentages exclude short-term securities.
Changes in and Disagreements with Accountants
There were no disagreements with the accountants during the period.
Fund Expenses
What were the Portfolio costs for the last six months ?
(Based on a hypothetical $10,000 investment)
| Portfolio (Class) | Costs of a $10,000 investment | Costs paid as a percentage of a $10,000 investment |
| SA PineBridge High-Yield Bond Portfolio (Class 2)* | $44 | 0.88%** |
| * |
The expenses shown in the table are meant to highlight your ongoing costs only and do not reflect any fees and expenses that may be charged by the variable annuity contracts and variable life insurance policies that invest in the Portfolio.
|
| ** |
Annualized
|
Key Fund Statistics
The following table outlines key fund statistics.
| Net assets | $263M |
| Total number of portfolio holdings | 269 |
| Total net advisory fee paid | $0.8M |
| Portfolio turnover rate during the reporting period | 23% |
Graphical Representation of Holdings
The information below represents the composition of the Portfolio as of the end of the period.
Top Industries*
(% of net assets)
(% of net assets)
| Diversified Financial Services | 7.1% |
| Commercial Services | 6.8% |
| Telecommunications | 6.4% |
| Pipelines | 6.4% |
| Oil & Gas | 6.2% |
| Media | 6.0% |
| Retail | 4.5% |
| Electric | 4.3% |
| REITS | 3.4% |
| Leisure Time | 2.9% |
| Insurance | 2.8% |
| Entertainment | 2.8% |
| Iron/Steel | 2.8% |
| Pharmaceuticals | 2.7% |
| Packaging & Containers | 2.6% |
Portfolio Composition
(% of net assets)
(% of net assets)

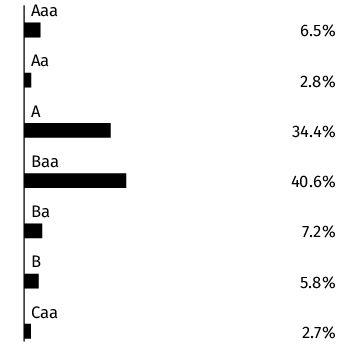
Credit Quality **
(% of total debt issues)
(% of total debt issues)

* Percentages exclude derivatives (other than purchased options), if any.
** Credit quality ratings shown above reflect the rating assigned by Moody's Investors Service, Inc. Where Moody's ratings are not available, we have used Standard & Poor's ratings. Unrated investments do not necessarily indicate low credit quality. Credit quality ratings are subject to change. Percentages exclude short-term securities.
Changes in and Disagreements with Accountants
There were no disagreements with the accountants during the period.
Fund Expenses
What were the Portfolio costs for the last six months ?
(Based on a hypothetical $10,000 investment)
| Portfolio (Class) | Costs of a $10,000 investment | Costs paid as a percentage of a $10,000 investment |
| SA PineBridge High-Yield Bond Portfolio (Class 1)* | $37 | 0.73%** |
| * |
The expenses shown in the table are meant to highlight your ongoing costs only and do not reflect any fees and expenses that may be charged by the variable annuity contracts and variable life insurance policies that invest in the Portfolio.
|
| ** |
Annualized
|
Key Fund Statistics
The following table outlines key fund statistics.
| Net assets | $263M |
| Total number of portfolio holdings | 269 |
| Total net advisory fee paid | $0.8M |
| Portfolio turnover rate during the reporting period | 23% |
Graphical Representation of Holdings
The information below represents the composition of the Portfolio as of the end of the period.
Top Industries*
(% of net assets)
(% of net assets)
| Diversified Financial Services | 7.1% |
| Commercial Services | 6.8% |
| Telecommunications | 6.4% |
| Pipelines | 6.4% |
| Oil & Gas | 6.2% |
| Media | 6.0% |
| Retail | 4.5% |
| Electric | 4.3% |
| REITS | 3.4% |
| Leisure Time | 2.9% |
| Insurance | 2.8% |
| Entertainment | 2.8% |
| Iron/Steel | 2.8% |
| Pharmaceuticals | 2.7% |
| Packaging & Containers | 2.6% |
Portfolio Composition
(% of net assets)
(% of net assets)
Credit Quality **
(% of total debt issues)
(% of total debt issues)

* Percentages exclude derivatives (other than purchased options), if any.
** Credit quality ratings shown above reflect the rating assigned by Moody's Investors Service, Inc. Where Moody's ratings are not available, we have used Standard & Poor's ratings. Unrated investments do not necessarily indicate low credit quality. Credit quality ratings are subject to change. Percentages exclude short-term securities.
Changes in and Disagreements with Accountants
There were no disagreements with the accountants during the period.
Fund Expenses
What were the Portfolio costs for the last six months ?
(Based on a hypothetical $10,000 investment)
| Portfolio (Class) | Costs of a $10,000 investment | Costs paid as a percentage of a $10,000 investment |
| SA Emerging Markets Equity Index Portfolio (Class 3)* | $44 | 0.83%** |
| * |
The expenses shown in the table are meant to highlight your ongoing costs only and do not reflect any fees and expenses that may be charged by the variable annuity contracts and variable life insurance policies that invest in the Portfolio.
|
| ** |
Annualized
|
Key Fund Statistics
The following table outlines key fund statistics.
| Net assets | $104M |
| Total number of portfolio holdings | 1,005 |
| Total net advisory fee paid | $0.2M |
| Portfolio turnover rate during the reporting period | 12% |
Graphical Representation of Holdings
The information below represents the composition of the Portfolio's net assets as of the end of the period.
Top Industries*
| Semiconductors | 16.9% |
| Banks | 16.7% |
| Internet | 13.5% |
| Diversified Financial Services | 4.6% |
| Telecommunications | 4.3% |
| Oil & Gas | 4.0% |
| Auto Manufacturers | 3.0% |
| Insurance | 2.7% |
| Computers | 2.6% |
| Mining | 2.2% |
| Electronics | 2.2% |
| Retail | 1.9% |
| Pharmaceuticals | 1.9% |
| Electric | 1.7% |
| Real Estate | 1.6% |
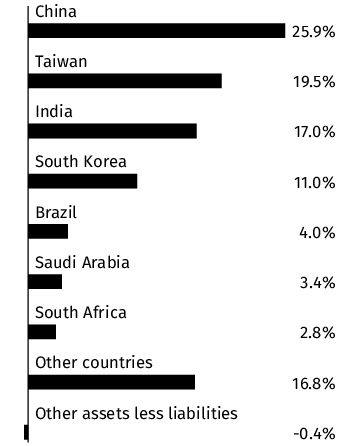
Portfolio Composition

Country

* Percentages exclude derivatives (other than purchased options), if any.
Changes in and Disagreements with Accountants
There were no disagreements with the accountants during the period.
Fund Expenses
What were the Portfolio costs for the last six months ?
(Based on a hypothetical $10,000 investment)
| Portfolio (Class) | Costs of a $10,000 investment | Costs paid as a percentage of a $10,000 investment |
| SA Emerging Markets Equity Index Portfolio (Class 1)* | $31 | 0.58%** |
| * |
The expenses shown in the table are meant to highlight your ongoing costs only and do not reflect any fees and expenses that may be charged by the variable annuity contracts and variable life insurance policies that invest in the Portfolio.
|
| ** |
Annualized
|
Key Fund Statistics
The following table outlines key fund statistics.
| Net assets | $104M |
| Total number of portfolio holdings | 1,005 |
| Total net advisory fee paid | $0.2M |
| Portfolio turnover rate during the reporting period | 12% |
Graphical Representation of Holdings
The information below represents the composition of the Portfolio's net assets as of the end of the period.
Top Industries*
| Semiconductors | 16.9% |
| Banks | 16.7% |
| Internet | 13.5% |
| Diversified Financial Services | 4.6% |
| Telecommunications | 4.3% |
| Oil & Gas | 4.0% |
| Auto Manufacturers | 3.0% |
| Insurance | 2.7% |
| Computers | 2.6% |
| Mining | 2.2% |
| Electronics | 2.2% |
| Retail | 1.9% |
| Pharmaceuticals | 1.9% |
| Electric | 1.7% |
| Real Estate | 1.6% |
Portfolio Composition
Country
* Percentages exclude derivatives (other than purchased options), if any.
Changes in and Disagreements with Accountants
There were no disagreements with the accountants during the period.
Fund Expenses
What were the Portfolio costs for the last six months ?
(Based on a hypothetical $10,000 investment)
| Portfolio (Class) | Costs of a $10,000 investment | Costs paid as a percentage of a $10,000 investment |
| SA Goldman Sachs Multi-Asset Insights Portfolio (Class 1)* | $42 | 0.83%** |
| * |
The expenses shown in the table are meant to highlight your ongoing costs only and do not reflect any fees and expenses that may be charged by the variable annuity contracts and variable life insurance policies that invest in the Portfolio.
|
| ** |
Annualized
|
Key Fund Statistics
The following table outlines key fund statistics.
| Net assets | $50M |
| Total number of portfolio holdings | 291 |
| Total net advisory fee paid | $0.2M |
| Portfolio turnover rate during the reporting period | 79% |
Graphical Representation of Holdings
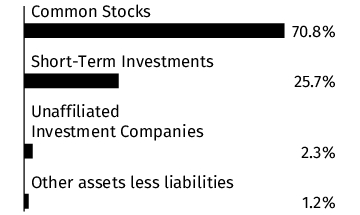
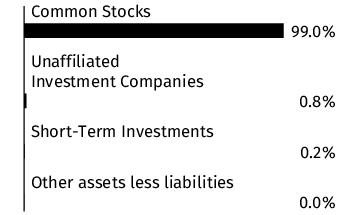
The information below represents the composition of the Portfolio's net assets as of the end of the period.
Top Industries*
| Short-Term Investments | 25.7% |
| Internet | 7.4% |
| Semiconductors | 6.1% |
| Banks | 6.0% |
| Software | 4.7% |
| Diversified Financial Services | 4.0% |
| Insurance | 3.3% |
| Aerospace/Defense | 3.1% |
| Computers | 3.0% |
| Pharmaceuticals | 2.7% |
| Unaffiliated Investment Companies | 2.3% |
| REITS | 2.2% |
| Telecommunications | 2.0% |
| Commercial Services | 1.6% |
| Electronics | 1.6% |
Portfolio Composition

* Percentages exclude derivatives (other than purchased options), if any.
Changes in and Disagreements with Accountants
There were no disagreements with the accountants during the period.
Fund Expenses
What were the Portfolio costs for the last six months ?
(Based on a hypothetical $10,000 investment)
| Portfolio (Class) | Costs of a $10,000 investment | Costs paid as a percentage of a $10,000 investment |
| SA Goldman Sachs Multi-Asset Insights Portfolio (Class 3)* | $55 | 1.08%** |
| * |
The expenses shown in the table are meant to highlight your ongoing costs only and do not reflect any fees and expenses that may be charged by the variable annuity contracts and variable life insurance policies that invest in the Portfolio.
|
| ** |
Annualized
|
Key Fund Statistics
The following table outlines key fund statistics.
| Net assets | $50M |
| Total number of portfolio holdings | 291 |
| Total net advisory fee paid | $0.2M |
| Portfolio turnover rate during the reporting period | 79% |
Graphical Representation of Holdings
The information below represents the composition of the Portfolio's net assets as of the end of the period.
Top Industries*
| Short-Term Investments | 25.7% |
| Internet | 7.4% |
| Semiconductors | 6.1% |
| Banks | 6.0% |
| Software | 4.7% |
| Diversified Financial Services | 4.0% |
| Insurance | 3.3% |
| Aerospace/Defense | 3.1% |
| Computers | 3.0% |
| Pharmaceuticals | 2.7% |
| Unaffiliated Investment Companies | 2.3% |
| REITS | 2.2% |
| Telecommunications | 2.0% |
| Commercial Services | 1.6% |
| Electronics | 1.6% |
Portfolio Composition
* Percentages exclude derivatives (other than purchased options), if any.
Changes in and Disagreements with Accountants
There were no disagreements with the accountants during the period.
Fund Expenses
What were the Portfolio costs for the last six months ?
(Based on a hypothetical $10,000 investment)
| Portfolio (Class) | Costs of a $10,000 investment | Costs paid as a percentage of a $10,000 investment |
| SA Fixed Income Intermediate Index Portfolio (Class 1)* | $17 | 0.33%** |
| * |
The expenses shown in the table are meant to highlight your ongoing costs only and do not reflect any fees and expenses that may be charged by the variable annuity contracts and variable life insurance policies that invest in the Portfolio.
|
| ** |
Annualized
|
Key Fund Statistics
The following table outlines key fund statistics.
| Net assets | $494M |
| Total number of portfolio holdings | 1,009 |
| Total net advisory fee paid | $0.7M |
| Portfolio turnover rate during the reporting period | 70% |
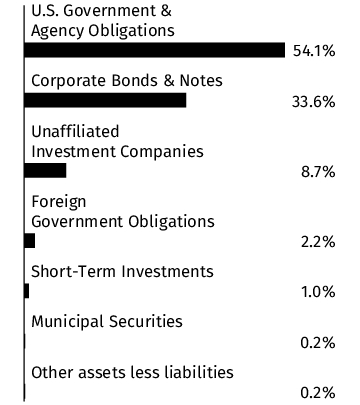
Graphical Representation of Holdings
The information below represents the composition of the Portfolio as of the end of the period.
Top Industries*
(% of net assets)
(% of net assets)
| U.S. Government & Agency Obligations | 54.1% |
| Banks | 9.4% |
| Unaffiliated Investment Companies | 8.7% |
| Multi-National | 2.7% |
| Electric | 2.3% |
| Foreign Government Obligations | 2.2% |
| Pharmaceuticals | 1.4% |
| REITS | 1.3% |
| Diversified Financial Services | 1.2% |
| Telecommunications | 1.0% |
| Short-Term Investments | 1.0% |
| Oil & Gas | 0.9% |
| Auto Manufacturers | 0.9% |
| Pipelines | 0.9% |
| Semiconductors | 0.8% |
Portfolio Composition
(% of net assets)
(% of net assets)
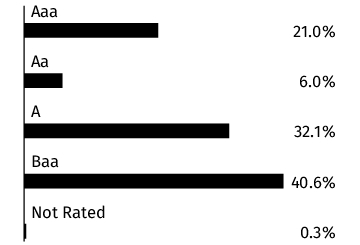
Credit Quality **
(% of total debt issues)
(% of total debt issues)

* Percentages exclude derivatives (other than purchased options), if any.
** Credit quality ratings shown above reflect the rating assigned by Moody's Investors Service, Inc. Where Moody's ratings are not available, we have used Standard & Poor's ratings. Unrated investments do not necessarily indicate low credit quality. Credit quality ratings are subject to change. Percentages exclude short-term securities.
Changes in and Disagreements with Accountants
There were no disagreements with the accountants during the period.
Fund Expenses
What were the Portfolio costs for the last six months ?
(Based on a hypothetical $10,000 investment)
| Portfolio (Class) | Costs of a $10,000 investment | Costs paid as a percentage of a $10,000 investment |
| SA Fixed Income Intermediate Index Portfolio (Class 3)* | $29 | 0.58%** |
| * |
The expenses shown in the table are meant to highlight your ongoing costs only and do not reflect any fees and expenses that may be charged by the variable annuity contracts and variable life insurance policies that invest in the Portfolio.
|
| ** |
Annualized
|
Key Fund Statistics
The following table outlines key fund statistics.
| Net assets | $494M |
| Total number of portfolio holdings | 1,009 |
| Total net advisory fee paid | $0.7M |
| Portfolio turnover rate during the reporting period | 70% |
Graphical Representation of Holdings
The information below represents the composition of the Portfolio as of the end of the period.
Top Industries*
(% of net assets)
(% of net assets)
| U.S. Government & Agency Obligations | 54.1% |
| Banks | 9.4% |
| Unaffiliated Investment Companies | 8.7% |
| Multi-National | 2.7% |
| Electric | 2.3% |
| Foreign Government Obligations | 2.2% |
| Pharmaceuticals | 1.4% |
| REITS | 1.3% |
| Diversified Financial Services | 1.2% |
| Telecommunications | 1.0% |
| Short-Term Investments | 1.0% |
| Oil & Gas | 0.9% |
| Auto Manufacturers | 0.9% |
| Pipelines | 0.9% |
| Semiconductors | 0.8% |
Portfolio Composition
(% of net assets)
(% of net assets)

Credit Quality **
(% of total debt issues)
(% of total debt issues)
* Percentages exclude derivatives (other than purchased options), if any.
** Credit quality ratings shown above reflect the rating assigned by Moody's Investors Service, Inc. Where Moody's ratings are not available, we have used Standard & Poor's ratings. Unrated investments do not necessarily indicate low credit quality. Credit quality ratings are subject to change. Percentages exclude short-term securities.
Changes in and Disagreements with Accountants
There were no disagreements with the accountants during the period.
Fund Expenses
What were the Portfolio costs for the last six months ?
(Based on a hypothetical $10,000 investment)
| Portfolio (Class) | Costs of a $10,000 investment | Costs paid as a percentage of a $10,000 investment |
| SA Federated Hermes Corporate Bond Portfolio (Class 3)* | $40 | 0.80%** |
| * |
The expenses shown in the table are meant to highlight your ongoing costs only and do not reflect any fees and expenses that may be charged by the variable annuity contracts and variable life insurance policies that invest in the Portfolio.
|
| ** |
Annualized
|
Key Fund Statistics
The following table outlines key fund statistics.
| Net assets | $1,533M |
| Total number of portfolio holdings | 812 |
| Total net advisory fee paid | $3.8M |
| Portfolio turnover rate during the reporting period | 11% |
Graphical Representation of Holdings
The information below represents the composition of the Portfolio as of the end of the period.
Top Industries*
(% of net assets)
(% of net assets)
| Banks | 17.1% |
| Short-Term Investments | 5.1% |
| Telecommunications | 5.1% |
| Electric | 4.9% |
| U.S. Government & Agency Obligations | 4.5% |
| Pharmaceuticals | 4.3% |
| Software | 3.5% |
| Oil & Gas | 3.3% |
| Pipelines | 3.3% |
| Media | 3.1% |
| Commercial Services | 2.8% |
| Computers | 2.6% |
| Beverages | 2.6% |
| Retail | 2.5% |
| Insurance | 2.4% |
Portfolio Composition
(% of net assets)
(% of net assets)
Credit Quality **
(% of total debt issues)
(% of total debt issues)
* Percentages exclude derivatives (other than purchased options), if any.
** Credit quality ratings shown above reflect the rating assigned by Moody's Investors Service, Inc. Where Moody's ratings are not available, we have used Standard & Poor's ratings. Unrated investments do not necessarily indicate low credit quality. Credit quality ratings are subject to change. Percentages exclude short-term securities.
Changes in and Disagreements with Accountants
There were no disagreements with the accountants during the period.
Fund Expenses
What were the Portfolio costs for the last six months ?
(Based on a hypothetical $10,000 investment)
| Portfolio (Class) | Costs of a $10,000 investment | Costs paid as a percentage of a $10,000 investment |
| SA Federated Hermes Corporate Bond Portfolio (Class 1)* | $28 | 0.55%** |
| * |
The expenses shown in the table are meant to highlight your ongoing costs only and do not reflect any fees and expenses that may be charged by the variable annuity contracts and variable life insurance policies that invest in the Portfolio.
|
| ** |
Annualized
|
Key Fund Statistics
The following table outlines key fund statistics.
| Net assets | $1,533M |
| Total number of portfolio holdings | 812 |
| Total net advisory fee paid | $3.8M |
| Portfolio turnover rate during the reporting period | 11% |
Graphical Representation of Holdings
The information below represents the composition of the Portfolio as of the end of the period.
Top Industries*
(% of net assets)
(% of net assets)
| Banks | 17.1% |
| Short-Term Investments | 5.1% |
| Telecommunications | 5.1% |
| Electric | 4.9% |
| U.S. Government & Agency Obligations | 4.5% |
| Pharmaceuticals | 4.3% |
| Software | 3.5% |
| Oil & Gas | 3.3% |
| Pipelines | 3.3% |
| Media | 3.1% |
| Commercial Services | 2.8% |
| Computers | 2.6% |
| Beverages | 2.6% |
| Retail | 2.5% |
| Insurance | 2.4% |
Portfolio Composition
(% of net assets)
(% of net assets)

Credit Quality **
(% of total debt issues)
(% of total debt issues)

* Percentages exclude derivatives (other than purchased options), if any.
** Credit quality ratings shown above reflect the rating assigned by Moody's Investors Service, Inc. Where Moody's ratings are not available, we have used Standard & Poor's ratings. Unrated investments do not necessarily indicate low credit quality. Credit quality ratings are subject to change. Percentages exclude short-term securities.
Changes in and Disagreements with Accountants
There were no disagreements with the accountants during the period.
Fund Expenses
What were the Portfolio costs for the last six months ?
(Based on a hypothetical $10,000 investment)
| Portfolio (Class) | Costs of a $10,000 investment | Costs paid as a percentage of a $10,000 investment |
| SA Federated Hermes Corporate Bond Portfolio (Class 2)* | $35 | 0.70%** |
| * |
The expenses shown in the table are meant to highlight your ongoing costs only and do not reflect any fees and expenses that may be charged by the variable annuity contracts and variable life insurance policies that invest in the Portfolio.
|
| ** |
Annualized
|
Key Fund Statistics
The following table outlines key fund statistics.
| Net assets | $1,533M |
| Total number of portfolio holdings | 812 |
| Total net advisory fee paid | $3.8M |
| Portfolio turnover rate during the reporting period | 11% |
Graphical Representation of Holdings
The information below represents the composition of the Portfolio as of the end of the period.
Top Industries*
(% of net assets)
(% of net assets)
| Banks | 17.1% |
| Short-Term Investments | 5.1% |
| Telecommunications | 5.1% |
| Electric | 4.9% |
| U.S. Government & Agency Obligations | 4.5% |
| Pharmaceuticals | 4.3% |
| Software | 3.5% |
| Oil & Gas | 3.3% |
| Pipelines | 3.3% |
| Media | 3.1% |
| Commercial Services | 2.8% |
| Computers | 2.6% |
| Beverages | 2.6% |
| Retail | 2.5% |
| Insurance | 2.4% |
Portfolio Composition
(% of net assets)
(% of net assets)

Credit Quality **
(% of total debt issues)
(% of total debt issues)
* Percentages exclude derivatives (other than purchased options), if any.
** Credit quality ratings shown above reflect the rating assigned by Moody's Investors Service, Inc. Where Moody's ratings are not available, we have used Standard & Poor's ratings. Unrated investments do not necessarily indicate low credit quality. Credit quality ratings are subject to change. Percentages exclude short-term securities.
Changes in and Disagreements with Accountants
There were no disagreements with the accountants during the period.
Fund Expenses
What were the Portfolio costs for the last six months ?
(Based on a hypothetical $10,000 investment)
| Portfolio (Class) | Costs of a $10,000 investment | Costs paid as a percentage of a $10,000 investment |
| SA AB Growth Portfolio (Class 3)* | $45 | 0.88%** |
| * |
The expenses shown in the table are meant to highlight your ongoing costs only and do not reflect any fees and expenses that may be charged by the variable annuity contracts and variable life insurance policies that invest in the Portfolio.
|
| ** |
Annualized
|
Key Fund Statistics
The following table outlines key fund statistics.
| Net assets | $1,858M |
| Total number of portfolio holdings | 56 |
| Total net advisory fee paid | $5.2M |
| Portfolio turnover rate during the reporting period | 14% |
Graphical Representation of Holdings
The information below represents the composition of the Portfolio's net assets as of the end of the period.
Top Industries*
| Semiconductors | 24.4% |
| Internet | 23.9% |
| Software | 15.8% |
| Retail | 7.1% |
| Diversified Financial Services | 5.6% |
| Healthcare-Products | 3.8% |
| Pharmaceuticals | 3.3% |
| Beverages | 2.3% |
| Commercial Services | 1.9% |
| Biotechnology | 1.6% |
| Telecommunications | 1.4% |
| Chemicals | 1.2% |
| Distribution/Wholesale | 1.0% |
| Machinery-Diversified | 1.0% |
| Insurance | 0.9% |
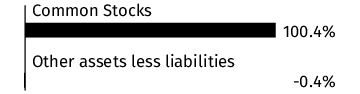
Portfolio Composition

* Percentages exclude derivatives (other than purchased options), if any.
Changes in and Disagreements with Accountants
There were no disagreements with the accountants during the period.
Fund Expenses
What were the Portfolio costs for the last six months ?
(Based on a hypothetical $10,000 investment)
| Portfolio (Class) | Costs of a $10,000 investment | Costs paid as a percentage of a $10,000 investment |
| SA AB Growth Portfolio (Class 2)* | $40 | 0.78%** |
| * |
The expenses shown in the table are meant to highlight your ongoing costs only and do not reflect any fees and expenses that may be charged by the variable annuity contracts and variable life insurance policies that invest in the Portfolio.
|
| ** |
Annualized
|
Key Fund Statistics
The following table outlines key fund statistics.
| Net assets | $1,858M |
| Total number of portfolio holdings | 56 |
| Total net advisory fee paid | $5.2M |
| Portfolio turnover rate during the reporting period | 14% |
Graphical Representation of Holdings
The information below represents the composition of the Portfolio's net assets as of the end of the period.
Top Industries*
| Semiconductors | 24.4% |
| Internet | 23.9% |
| Software | 15.8% |
| Retail | 7.1% |
| Diversified Financial Services | 5.6% |
| Healthcare-Products | 3.8% |
| Pharmaceuticals | 3.3% |
| Beverages | 2.3% |
| Commercial Services | 1.9% |
| Biotechnology | 1.6% |
| Telecommunications | 1.4% |
| Chemicals | 1.2% |
| Distribution/Wholesale | 1.0% |
| Machinery-Diversified | 1.0% |
| Insurance | 0.9% |
Portfolio Composition

* Percentages exclude derivatives (other than purchased options), if any.
Changes in and Disagreements with Accountants
There were no disagreements with the accountants during the period.
Fund Expenses
What were the Portfolio costs for the last six months ?
(Based on a hypothetical $10,000 investment)
| Portfolio (Class) | Costs of a $10,000 investment | Costs paid as a percentage of a $10,000 investment |
| SA AB Growth Portfolio (Class 1)* | $32 | 0.63%** |
| * |
The expenses shown in the table are meant to highlight your ongoing costs only and do not reflect any fees and expenses that may be charged by the variable annuity contracts and variable life insurance policies that invest in the Portfolio.
|
| ** |
Annualized
|
Key Fund Statistics
The following table outlines key fund statistics.
| Net assets | $1,858M |
| Total number of portfolio holdings | 56 |
| Total net advisory fee paid | $5.2M |
| Portfolio turnover rate during the reporting period | 14% |
Graphical Representation of Holdings
The information below represents the composition of the Portfolio's net assets as of the end of the period.
Top Industries*
| Semiconductors | 24.4% |
| Internet | 23.9% |
| Software | 15.8% |
| Retail | 7.1% |
| Diversified Financial Services | 5.6% |
| Healthcare-Products | 3.8% |
| Pharmaceuticals | 3.3% |
| Beverages | 2.3% |
| Commercial Services | 1.9% |
| Biotechnology | 1.6% |
| Telecommunications | 1.4% |
| Chemicals | 1.2% |
| Distribution/Wholesale | 1.0% |
| Machinery-Diversified | 1.0% |
| Insurance | 0.9% |
Portfolio Composition

* Percentages exclude derivatives (other than purchased options), if any.
Changes in and Disagreements with Accountants
There were no disagreements with the accountants during the period.
Fund Expenses
What were the Portfolio costs for the last six months ?
(Based on a hypothetical $10,000 investment)
| Portfolio (Class) | Costs of a $10,000 investment | Costs paid as a percentage of a $10,000 investment |
| SA JPMorgan Mid-Cap Growth Portfolio (Class 1)* | $39 | 0.77%** |
| * |
The expenses shown in the table are meant to highlight your ongoing costs only and do not reflect any fees and expenses that may be charged by the variable annuity contracts and variable life insurance policies that invest in the Portfolio.
|
| ** |
Annualized
|
Key Fund Statistics
The following table outlines key fund statistics.
| Net assets | $715M |
| Total number of portfolio holdings | 107 |
| Total net advisory fee paid | $2.4M |
| Portfolio turnover rate during the reporting period | 44% |
Graphical Representation of Holdings
The information below represents the composition of the Portfolio's net assets as of the end of the period.
Top Industries*
| Software | 17.2% |
| Diversified Financial Services | 8.3% |
| Retail | 7.3% |
| Aerospace/Defense | 5.3% |
| Internet | 5.2% |
| Biotechnology | 4.8% |
| Leisure Time | 4.1% |
| Pharmaceuticals | 3.9% |
| Miscellaneous Manufacturing | 3.9% |
| Electric | 3.3% |
| Healthcare-Products | 3.1% |
| Lodging | 2.9% |
| Computers | 2.9% |
| Commercial Services | 2.8% |
| Entertainment | 2.6% |
Portfolio Composition

* Percentages exclude derivatives (other than purchased options), if any.
Changes in and Disagreements with Accountants
There were no disagreements with the accountants during the period.
This report describes changes to the Portfolio that occurred during the reporting period.
Fund Expenses
What were the Portfolio costs for the last six months ?
(Based on a hypothetical $10,000 investment)
| Portfolio (Class) | Costs of a $10,000 investment | Costs paid as a percentage of a $10,000 investment |
| SA JPMorgan Ultra-Short Bond Portfolio (Class 3)* | $39 | 0.77%** |
| * |
The expenses shown in the table are meant to highlight your ongoing costs only and do not reflect any fees and expenses that may be charged by the variable annuity contracts and variable life insurance policies that invest in the Portfolio.
|
| ** |
Annualized
|
Key Fund Statistics
The following table outlines key fund statistics.
| Net assets | $346M |
| Total number of portfolio holdings | 246 |
| Total net advisory fee paid | $0.8M |
| Portfolio turnover rate during the reporting period | 59% |
Graphical Representation of Holdings
The information below represents the composition of the Portfolio as of the end of the period.
Top Industries*
(% of net assets)
(% of net assets)
| Banks | 23.5% |
| Insurance | 9.5% |
| Other Asset Backed Securities | 8.3% |
| Auto Manufacturers | 7.2% |
| Short-Term Investments | 7.1% |
| Electric | 6.8% |
| U.S. Government & Agency Obligations | 6.6% |
| Auto Loan Receivables | 3.7% |
| Diversified Financial Services | 2.4% |
| Healthcare-Services | 1.7% |
| Retail | 1.4% |
| Pipelines | 1.4% |
| Telecommunications | 1.4% |
| Chemicals | 1.3% |
| Credit Card Receivables | 1.2% |
Portfolio Composition
(% of net assets)
(% of net assets)

Credit Quality **
(% of total debt issues)
(% of total debt issues)
* Percentages exclude derivatives (other than purchased options), if any.
** Credit quality ratings shown above reflect the rating assigned by Moody's Investors Service, Inc. Where Moody's ratings are not available, we have used Standard & Poor's ratings. Unrated investments do not necessarily indicate low credit quality. Credit quality ratings are subject to change. Percentages exclude short-term securities.
Changes in and Disagreements with Accountants
There were no disagreements with the accountants during the period.
This report describes changes to the Portfolio that occurred during the reporting period.
Fund Expenses
What were the Portfolio costs for the last six months ?
(Based on a hypothetical $10,000 investment)
| Portfolio (Class) | Costs of a $10,000 investment | Costs paid as a percentage of a $10,000 investment |
| SA JPMorgan Ultra-Short Bond Portfolio (Class 1)* | $26 | 0.52%** |
| * |
The expenses shown in the table are meant to highlight your ongoing costs only and do not reflect any fees and expenses that may be charged by the variable annuity contracts and variable life insurance policies that invest in the Portfolio.
|
| ** |
Annualized
|
Key Fund Statistics
The following table outlines key fund statistics.
| Net assets | $346M |
| Total number of portfolio holdings | 246 |
| Total net advisory fee paid | $0.8M |
| Portfolio turnover rate during the reporting period | 59% |
Graphical Representation of Holdings
The information below represents the composition of the Portfolio as of the end of the period.
Top Industries*
(% of net assets)
(% of net assets)
| Banks | 23.5% |
| Insurance | 9.5% |
| Other Asset Backed Securities | 8.3% |
| Auto Manufacturers | 7.2% |
| Short-Term Investments | 7.1% |
| Electric | 6.8% |
| U.S. Government & Agency Obligations | 6.6% |
| Auto Loan Receivables | 3.7% |
| Diversified Financial Services | 2.4% |
| Healthcare-Services | 1.7% |
| Retail | 1.4% |
| Pipelines | 1.4% |
| Telecommunications | 1.4% |
| Chemicals | 1.3% |
| Credit Card Receivables | 1.2% |
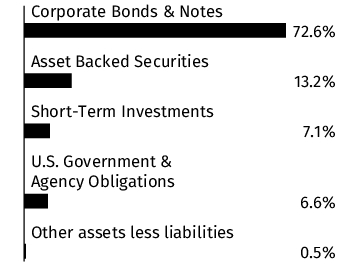
Portfolio Composition
(% of net assets)
(% of net assets)

Credit Quality **
(% of total debt issues)
(% of total debt issues)

* Percentages exclude derivatives (other than purchased options), if any.
** Credit quality ratings shown above reflect the rating assigned by Moody's Investors Service, Inc. Where Moody's ratings are not available, we have used Standard & Poor's ratings. Unrated investments do not necessarily indicate low credit quality. Credit quality ratings are subject to change. Percentages exclude short-term securities.
Changes in and Disagreements with Accountants
There were no disagreements with the accountants during the period.
This report describes changes to the Portfolio that occurred during the reporting period.
Fund Expenses
What were the Portfolio costs for the last six months ?
(Based on a hypothetical $10,000 investment)
| Portfolio (Class) | Costs of a $10,000 investment | Costs paid as a percentage of a $10,000 investment |
| SA JPMorgan Ultra-Short Bond Portfolio (Class 2)* | $34 | 0.67%** |
| * |
The expenses shown in the table are meant to highlight your ongoing costs only and do not reflect any fees and expenses that may be charged by the variable annuity contracts and variable life insurance policies that invest in the Portfolio.
|
| ** |
Annualized
|
Key Fund Statistics
The following table outlines key fund statistics.
| Net assets | $346M |
| Total number of portfolio holdings | 246 |
| Total net advisory fee paid | $0.8M |
| Portfolio turnover rate during the reporting period | 59% |
Graphical Representation of Holdings
The information below represents the composition of the Portfolio as of the end of the period.
Top Industries*
(% of net assets)
(% of net assets)
| Banks | 23.5% |
| Insurance | 9.5% |
| Other Asset Backed Securities | 8.3% |
| Auto Manufacturers | 7.2% |
| Short-Term Investments | 7.1% |
| Electric | 6.8% |
| U.S. Government & Agency Obligations | 6.6% |
| Auto Loan Receivables | 3.7% |
| Diversified Financial Services | 2.4% |
| Healthcare-Services | 1.7% |
| Retail | 1.4% |
| Pipelines | 1.4% |
| Telecommunications | 1.4% |
| Chemicals | 1.3% |
| Credit Card Receivables | 1.2% |
Portfolio Composition
(% of net assets)
(% of net assets)
Credit Quality **
(% of total debt issues)
(% of total debt issues)

* Percentages exclude derivatives (other than purchased options), if any.
** Credit quality ratings shown above reflect the rating assigned by Moody's Investors Service, Inc. Where Moody's ratings are not available, we have used Standard & Poor's ratings. Unrated investments do not necessarily indicate low credit quality. Credit quality ratings are subject to change. Percentages exclude short-term securities.
Changes in and Disagreements with Accountants
There were no disagreements with the accountants during the period.
Fund Expenses
What were the Portfolio costs for the last six months ?
(Based on a hypothetical $10,000 investment)
| Portfolio (Class) | Costs of a $10,000 investment | Costs paid as a percentage of a $10,000 investment |
| SA JPMorgan Large Cap Core Portfolio (Class 3)* | $48 | 0.94%** |
| * |
The expenses shown in the table are meant to highlight your ongoing costs only and do not reflect any fees and expenses that may be charged by the variable annuity contracts and variable life insurance policies that invest in the Portfolio.
|
| ** |
Annualized
|
Key Fund Statistics
The following table outlines key fund statistics.
| Net assets | $586M |
| Total number of portfolio holdings | 52 |
| Total net advisory fee paid | $1.8M |
| Portfolio turnover rate during the reporting period | 25% |
Graphical Representation of Holdings
The information below represents the composition of the Portfolio's net assets as of the end of the period.
Top Industries*
| Semiconductors | 14.0% |
| Software | 12.3% |
| Internet | 12.0% |
| Retail | 6.8% |
| Diversified Financial Services | 6.6% |
| Computers | 5.7% |
| Banks | 4.9% |
| Healthcare-Products | 4.1% |
| Building Materials | 3.7% |
| Electric | 3.6% |
| Insurance | 2.8% |
| Aerospace/Defense | 2.7% |
| Oil & Gas Services | 2.6% |
| Pharmaceuticals | 2.4% |
| Media | 1.9% |
Portfolio Composition

* Percentages exclude derivatives (other than purchased options), if any.
Changes in and Disagreements with Accountants
There were no disagreements with the accountants during the period.
Fund Expenses
What were the Portfolio costs for the last six months ?
(Based on a hypothetical $10,000 investment)
| Portfolio (Class) | Costs of a $10,000 investment | Costs paid as a percentage of a $10,000 investment |
| SA JPMorgan Large Cap Core Portfolio (Class 1)* | $35 | 0.69%** |
| * |
The expenses shown in the table are meant to highlight your ongoing costs only and do not reflect any fees and expenses that may be charged by the variable annuity contracts and variable life insurance policies that invest in the Portfolio.
|
| ** |
Annualized
|
Key Fund Statistics
The following table outlines key fund statistics.
| Net assets | $586M |
| Total number of portfolio holdings | 52 |
| Total net advisory fee paid | $1.8M |
| Portfolio turnover rate during the reporting period | 25% |
Graphical Representation of Holdings
The information below represents the composition of the Portfolio's net assets as of the end of the period.
Top Industries*
| Semiconductors | 14.0% |
| Software | 12.3% |
| Internet | 12.0% |
| Retail | 6.8% |
| Diversified Financial Services | 6.6% |
| Computers | 5.7% |
| Banks | 4.9% |
| Healthcare-Products | 4.1% |
| Building Materials | 3.7% |
| Electric | 3.6% |
| Insurance | 2.8% |
| Aerospace/Defense | 2.7% |
| Oil & Gas Services | 2.6% |
| Pharmaceuticals | 2.4% |
| Media | 1.9% |
Portfolio Composition

* Percentages exclude derivatives (other than purchased options), if any.
Changes in and Disagreements with Accountants
There were no disagreements with the accountants during the period.
Fund Expenses
What were the Portfolio costs for the last six months ?
(Based on a hypothetical $10,000 investment)
| Portfolio (Class) | Costs of a $10,000 investment | Costs paid as a percentage of a $10,000 investment |
| SA JPMorgan Large Cap Core Portfolio (Class 2)* | $43 | 0.84%** |
| * |
The expenses shown in the table are meant to highlight your ongoing costs only and do not reflect any fees and expenses that may be charged by the variable annuity contracts and variable life insurance policies that invest in the Portfolio.
|
| ** |
Annualized
|
Key Fund Statistics
The following table outlines key fund statistics.
| Net assets | $586M |
| Total number of portfolio holdings | 52 |
| Total net advisory fee paid | $1.8M |
| Portfolio turnover rate during the reporting period | 25% |
Graphical Representation of Holdings
The information below represents the composition of the Portfolio's net assets as of the end of the period.
Top Industries*
| Semiconductors | 14.0% |
| Software | 12.3% |
| Internet | 12.0% |
| Retail | 6.8% |
| Diversified Financial Services | 6.6% |
| Computers | 5.7% |
| Banks | 4.9% |
| Healthcare-Products | 4.1% |
| Building Materials | 3.7% |
| Electric | 3.6% |
| Insurance | 2.8% |
| Aerospace/Defense | 2.7% |
| Oil & Gas Services | 2.6% |
| Pharmaceuticals | 2.4% |
| Media | 1.9% |
Portfolio Composition

* Percentages exclude derivatives (other than purchased options), if any.
Changes in and Disagreements with Accountants
There were no disagreements with the accountants during the period.
Fund Expenses
What were the Portfolio costs for the last six months ?
(Based on a hypothetical $10,000 investment)
| Portfolio (Class) | Costs of a $10,000 investment | Costs paid as a percentage of a $10,000 investment |
| SA JPMorgan MFS Core Bond Portfolio (Class 3)* | $39 | 0.78%** |
| * |
The expenses shown in the table are meant to highlight your ongoing costs only and do not reflect any fees and expenses that may be charged by the variable annuity contracts and variable life insurance policies that invest in the Portfolio.
|
| ** |
Annualized
|
Key Fund Statistics
The following table outlines key fund statistics.
| Net assets | $1,830M |
| Total number of portfolio holdings | 1,669 |
| Total net advisory fee paid | $4.4M |
| Portfolio turnover rate during the reporting period | 17% |
Graphical Representation of Holdings
The information below represents the composition of the Portfolio as of the end of the period.
Top Industries*
(% of net assets)
(% of net assets)
| U.S. Government & Agency Obligations | 46.9% |
| Collateralized Mortgage Obligations | 11.3% |
| Banks | 8.5% |
| Other Asset Backed Securities | 6.3% |
| Auto Loan Receivables | 2.7% |
| Diversified Financial Services | 2.4% |
| Electric | 2.4% |
| Pipelines | 1.8% |
| REITS | 1.4% |
| Healthcare-Services | 1.3% |
| Short-Term Investments | 1.0% |
| Insurance | 1.0% |
| Oil & Gas | 0.9% |
| Aerospace/Defense | 0.9% |
| Telecommunications | 0.9% |
Portfolio Composition
(% of net assets)
(% of net assets)

Credit Quality **
(% of total debt issues)
(% of total debt issues)
* Percentages exclude derivatives (other than purchased options), if any.
** Credit quality ratings shown above reflect the rating assigned by Moody's Investors Service, Inc. Where Moody's ratings are not available, we have used Standard & Poor's ratings. Unrated investments do not necessarily indicate low credit quality. Credit quality ratings are subject to change. Percentages exclude short-term securities.
Changes in and Disagreements with Accountants
There were no disagreements with the accountants during the period.
Fund Expenses
What were the Portfolio costs for the last six months ?
(Based on a hypothetical $10,000 investment)
| Portfolio (Class) | Costs of a $10,000 investment | Costs paid as a percentage of a $10,000 investment |
| SA JPMorgan MFS Core Bond Portfolio (Class 1)* | $27 | 0.53%** |
| * |
The expenses shown in the table are meant to highlight your ongoing costs only and do not reflect any fees and expenses that may be charged by the variable annuity contracts and variable life insurance policies that invest in the Portfolio.
|
| ** |
Annualized
|
Key Fund Statistics
The following table outlines key fund statistics.
| Net assets | $1,830M |
| Total number of portfolio holdings | 1,669 |
| Total net advisory fee paid | $4.4M |
| Portfolio turnover rate during the reporting period | 17% |
Graphical Representation of Holdings
The information below represents the composition of the Portfolio as of the end of the period.
Top Industries*
(% of net assets)
(% of net assets)
| U.S. Government & Agency Obligations | 46.9% |
| Collateralized Mortgage Obligations | 11.3% |
| Banks | 8.5% |
| Other Asset Backed Securities | 6.3% |
| Auto Loan Receivables | 2.7% |
| Diversified Financial Services | 2.4% |
| Electric | 2.4% |
| Pipelines | 1.8% |
| REITS | 1.4% |
| Healthcare-Services | 1.3% |
| Short-Term Investments | 1.0% |
| Insurance | 1.0% |
| Oil & Gas | 0.9% |
| Aerospace/Defense | 0.9% |
| Telecommunications | 0.9% |
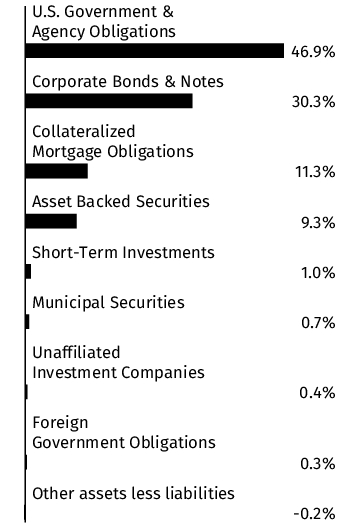
Portfolio Composition
(% of net assets)
(% of net assets)
Credit Quality **
(% of total debt issues)
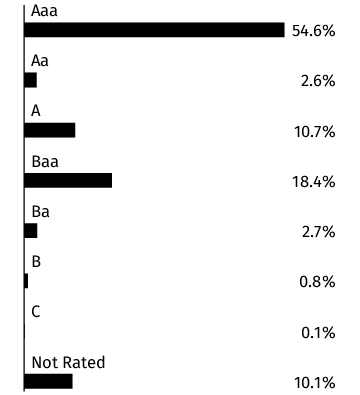
(% of total debt issues)
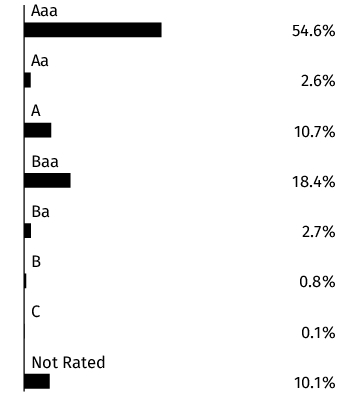
* Percentages exclude derivatives (other than purchased options), if any.
** Credit quality ratings shown above reflect the rating assigned by Moody's Investors Service, Inc. Where Moody's ratings are not available, we have used Standard & Poor's ratings. Unrated investments do not necessarily indicate low credit quality. Credit quality ratings are subject to change. Percentages exclude short-term securities.
Changes in and Disagreements with Accountants
There were no disagreements with the accountants during the period.
Fund Expenses
What were the Portfolio costs for the last six months ?
(Based on a hypothetical $10,000 investment)
| Portfolio (Class) | Costs of a $10,000 investment | Costs paid as a percentage of a $10,000 investment |
| SA JPMorgan MFS Core Bond Portfolio (Class 2)* | $34 | 0.68%** |
| * |
The expenses shown in the table are meant to highlight your ongoing costs only and do not reflect any fees and expenses that may be charged by the variable annuity contracts and variable life insurance policies that invest in the Portfolio.
|
| ** |
Annualized
|
Key Fund Statistics
The following table outlines key fund statistics.
| Net assets | $1,830M |
| Total number of portfolio holdings | 1,669 |
| Total net advisory fee paid | $4.4M |
| Portfolio turnover rate during the reporting period | 17% |
Graphical Representation of Holdings
The information below represents the composition of the Portfolio as of the end of the period.
Top Industries*
(% of net assets)
(% of net assets)
| U.S. Government & Agency Obligations | 46.9% |
| Collateralized Mortgage Obligations | 11.3% |
| Banks | 8.5% |
| Other Asset Backed Securities | 6.3% |
| Auto Loan Receivables | 2.7% |
| Diversified Financial Services | 2.4% |
| Electric | 2.4% |
| Pipelines | 1.8% |
| REITS | 1.4% |
| Healthcare-Services | 1.3% |
| Short-Term Investments | 1.0% |
| Insurance | 1.0% |
| Oil & Gas | 0.9% |
| Aerospace/Defense | 0.9% |
| Telecommunications | 0.9% |
Portfolio Composition
(% of net assets)
(% of net assets)

Credit Quality **
(% of total debt issues)
(% of total debt issues)

* Percentages exclude derivatives (other than purchased options), if any.
** Credit quality ratings shown above reflect the rating assigned by Moody's Investors Service, Inc. Where Moody's ratings are not available, we have used Standard & Poor's ratings. Unrated investments do not necessarily indicate low credit quality. Credit quality ratings are subject to change. Percentages exclude short-term securities.
Changes in and Disagreements with Accountants
There were no disagreements with the accountants during the period.
Fund Expenses
What were the Portfolio costs for the last six months ?
(Based on a hypothetical $10,000 investment)
| Portfolio (Class) | Costs of a $10,000 investment | Costs paid as a percentage of a $10,000 investment |
| SA VCP Dynamic Allocation Portfolio (Class 3)* | $25 | 0.50%** |
| * |
The expenses shown in the table are meant to highlight your ongoing costs only and do not reflect any fees and expenses that may be charged by the variable annuity contracts and variable life insurance policies that invest in the Portfolio.
|
| ** |
Annualized
|
Key Fund Statistics
The following table outlines key fund statistics.
| Net assets | $9,174M |
| Total number of portfolio holdings | 66 |
| Total net advisory fee paid | $8.6M |
| Portfolio turnover rate during the reporting period | 12% |
Graphical Representation of Holdings
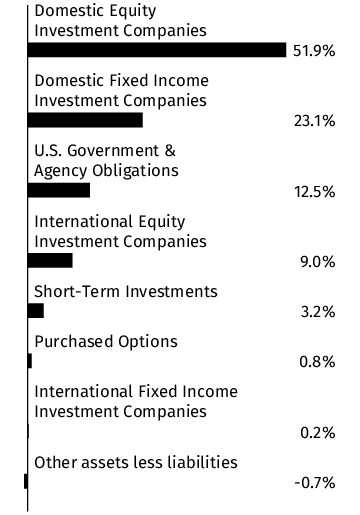
The information below represents the composition of the Portfolio's net assets as of the end of the period.
Portfolio Composition

Changes in and Disagreements with Accountants
There were no disagreements with the accountants during the period.
Fund Expenses
What were the Portfolio costs for the last six months ?
(Based on a hypothetical $10,000 investment)
| Portfolio (Class) | Costs of a $10,000 investment | Costs paid as a percentage of a $10,000 investment |
| SA VCP Dynamic Allocation Portfolio (Class 1)* | $12 | 0.24%** |
| * |
The expenses shown in the table are meant to highlight your ongoing costs only and do not reflect any fees and expenses that may be charged by the variable annuity contracts and variable life insurance policies that invest in the Portfolio.
|
| ** |
Annualized
|
Key Fund Statistics
The following table outlines key fund statistics.
| Net assets | $9,174M |
| Total number of portfolio holdings | 66 |
| Total net advisory fee paid | $8.6M |
| Portfolio turnover rate during the reporting period | 12% |
Graphical Representation of Holdings
The information below represents the composition of the Portfolio's net assets as of the end of the period.
Portfolio Composition
Changes in and Disagreements with Accountants
There were no disagreements with the accountants during the period.
Fund Expenses
What were the Portfolio costs for the last six months ?
(Based on a hypothetical $10,000 investment)
| Portfolio (Class) | Costs of a $10,000 investment | Costs paid as a percentage of a $10,000 investment |
| SA Mid Cap Index Portfolio (Class 3)* | $30 | 0.61%** |
| * |
The expenses shown in the table are meant to highlight your ongoing costs only and do not reflect any fees and expenses that may be charged by the variable annuity contracts and variable life insurance policies that invest in the Portfolio.
|
| ** |
Annualized
|
Key Fund Statistics
The following table outlines key fund statistics.
| Net assets | $497M |
| Total number of portfolio holdings | 405 |
| Total net advisory fee paid | $0.7M |
| Portfolio turnover rate during the reporting period | 10% |
Graphical Representation of Holdings
The information below represents the composition of the Portfolio's net assets as of the end of the period.
Top Industries*
| REITS | 6.8% |
| Banks | 6.4% |
| Retail | 6.1% |
| Insurance | 4.6% |
| Diversified Financial Services | 4.3% |
| Software | 4.1% |
| Commercial Services | 4.0% |
| Machinery-Diversified | 3.9% |
| Computers | 3.5% |
| Electronics | 3.5% |
| Engineering & Construction | 3.5% |
| Oil & Gas | 2.8% |
| Food | 2.7% |
| Biotechnology | 2.4% |
| Semiconductors | 2.3% |
Portfolio Composition

* Percentages exclude derivatives (other than purchased options), if any.
Changes in and Disagreements with Accountants
There were no disagreements with the accountants during the period.
Fund Expenses
What were the Portfolio costs for the last six months ?
(Based on a hypothetical $10,000 investment)
| Portfolio (Class) | Costs of a $10,000 investment | Costs paid as a percentage of a $10,000 investment |
| SA Mid Cap Index Portfolio (Class 1)* | $18 | 0.36%** |
| * |
The expenses shown in the table are meant to highlight your ongoing costs only and do not reflect any fees and expenses that may be charged by the variable annuity contracts and variable life insurance policies that invest in the Portfolio.
|
| ** |
Annualized
|
Key Fund Statistics
The following table outlines key fund statistics.
| Net assets | $497M |
| Total number of portfolio holdings | 405 |
| Total net advisory fee paid | $0.7M |
| Portfolio turnover rate during the reporting period | 10% |
Graphical Representation of Holdings
The information below represents the composition of the Portfolio's net assets as of the end of the period.
Top Industries*
| REITS | 6.8% |
| Banks | 6.4% |
| Retail | 6.1% |
| Insurance | 4.6% |
| Diversified Financial Services | 4.3% |
| Software | 4.1% |
| Commercial Services | 4.0% |
| Machinery-Diversified | 3.9% |
| Computers | 3.5% |
| Electronics | 3.5% |
| Engineering & Construction | 3.5% |
| Oil & Gas | 2.8% |
| Food | 2.7% |
| Biotechnology | 2.4% |
| Semiconductors | 2.3% |
Portfolio Composition

* Percentages exclude derivatives (other than purchased options), if any.
Changes in and Disagreements with Accountants
There were no disagreements with the accountants during the period.
This report describes changes to the Portfolio that occurred during the reporting period.
Fund Expenses
What were the Portfolio costs for the last six months ?
(Based on a hypothetical $10,000 investment)
| Portfolio (Class) | Costs of a $10,000 investment | Costs paid as a percentage of a $10,000 investment |
| SA T. Rowe Price VCP Balanced Portfolio (Class 1)* | $42 | 0.83%** |
| * |
The expenses shown in the table are meant to highlight your ongoing costs only and do not reflect any fees and expenses that may be charged by the variable annuity contracts and variable life insurance policies that invest in the Portfolio.
|
| ** |
Annualized
|
Key Fund Statistics
The following table outlines key fund statistics.
| Net assets | $1,379M |
| Total number of portfolio holdings | 1,599 |
| Total net advisory fee paid | $5.2M |
| Portfolio turnover rate during the reporting period | 20% |
Graphical Representation of Holdings
The information below represents the composition of the Portfolio's net assets as of the end of the period.
Top Industries*
| U.S. Government & Agency Obligations | 15.0% |
| Short-Term Investments | 12.0% |
| Semiconductors | 6.2% |
| Internet | 5.8% |
| Banks | 5.6% |
| Software | 4.8% |
| Insurance | 3.6% |
| Oil & Gas | 3.1% |
| Retail | 2.8% |
| REITS | 2.8% |
| Diversified Financial Services | 2.7% |
| Pharmaceuticals | 2.6% |
| Computers | 2.2% |
| Healthcare-Products | 1.9% |
| Electric | 1.7% |
Portfolio Composition

* Percentages exclude derivatives (other than purchased options), if any.
Changes in and Disagreements with Accountants
There were no disagreements with the accountants during the period.
Fund Expenses
What were the Portfolio costs for the last six months ?
(Based on a hypothetical $10,000 investment)
| Portfolio (Class) | Costs of a $10,000 investment | Costs paid as a percentage of a $10,000 investment |
| SA Large Cap Value Index Portfolio (Class 3)* | $30 | 0.60%** |
| * |
The expenses shown in the table are meant to highlight your ongoing costs only and do not reflect any fees and expenses that may be charged by the variable annuity contracts and variable life insurance policies that invest in the Portfolio.
|
| ** |
Annualized
|
Key Fund Statistics
The following table outlines key fund statistics.
| Net assets | $653M |
| Total number of portfolio holdings | 402 |
| Total net advisory fee paid | $0.9M |
| Portfolio turnover rate during the reporting period | 9% |
Graphical Representation of Holdings
The information below represents the composition of the Portfolio's net assets as of the end of the period.
Top Industries*
| Software | 9.4% |
| Computers | 8.2% |
| Banks | 7.4% |
| Pharmaceuticals | 5.7% |
| Oil & Gas | 5.1% |
| Semiconductors | 5.0% |
| Retail | 4.5% |
| Insurance | 4.3% |
| Internet | 4.1% |
| Healthcare-Products | 4.0% |
| Electric | 3.6% |
| Diversified Financial Services | 3.0% |
| Telecommunications | 3.0% |
| Aerospace/Defense | 2.9% |
| REITS | 2.9% |
Portfolio Composition
* Percentages exclude derivatives (other than purchased options), if any.
Changes in and Disagreements with Accountants
There were no disagreements with the accountants during the period.
Fund Expenses
What were the Portfolio costs for the last six months ?
(Based on a hypothetical $10,000 investment)
| Portfolio (Class) | Costs of a $10,000 investment | Costs paid as a percentage of a $10,000 investment |
| SA Large Cap Value Index Portfolio (Class 1)* | $17 | 0.35%** |
| * |
The expenses shown in the table are meant to highlight your ongoing costs only and do not reflect any fees and expenses that may be charged by the variable annuity contracts and variable life insurance policies that invest in the Portfolio.
|
| ** |
Annualized
|
Key Fund Statistics
The following table outlines key fund statistics.
| Net assets | $653M |
| Total number of portfolio holdings | 402 |
| Total net advisory fee paid | $0.9M |
| Portfolio turnover rate during the reporting period | 9% |
Graphical Representation of Holdings
The information below represents the composition of the Portfolio's net assets as of the end of the period.
Top Industries*
| Software | 9.4% |
| Computers | 8.2% |
| Banks | 7.4% |
| Pharmaceuticals | 5.7% |
| Oil & Gas | 5.1% |
| Semiconductors | 5.0% |
| Retail | 4.5% |
| Insurance | 4.3% |
| Internet | 4.1% |
| Healthcare-Products | 4.0% |
| Electric | 3.6% |
| Diversified Financial Services | 3.0% |
| Telecommunications | 3.0% |
| Aerospace/Defense | 2.9% |
| REITS | 2.9% |
Portfolio Composition

* Percentages exclude derivatives (other than purchased options), if any.
Changes in and Disagreements with Accountants
There were no disagreements with the accountants during the period.
Fund Expenses
What were the Portfolio costs for the last six months ?
(Based on a hypothetical $10,000 investment)
| Portfolio (Class) | Costs of a $10,000 investment | Costs paid as a percentage of a $10,000 investment |
| SA Fidelity Institutional AM® Global Equities Portfolio (Class 1)* | $42 | 0.82%** |
| * |
The expenses shown in the table are meant to highlight your ongoing costs only and do not reflect any fees and expenses that may be charged by the variable annuity contracts and variable life insurance policies that invest in the Portfolio.
|
| ** |
Annualized
|
Key Fund Statistics
The following table outlines key fund statistics.
| Net assets | $340M |
| Total number of portfolio holdings | 346 |
| Total net advisory fee paid | $1.2M |
| Portfolio turnover rate during the reporting period | 84% |
Graphical Representation of Holdings
The information below represents the composition of the Portfolio's net assets as of the end of the period.
Top Industries*
| Internet | 10.5% |
| Banks | 9.1% |
| Semiconductors | 8.9% |
| Software | 8.8% |
| Computers | 5.6% |
| Repurchase Agreements | 4.4% |
| Pharmaceuticals | 3.5% |
| Diversified Financial Services | 3.4% |
| Insurance | 3.1% |
| Aerospace/Defense | 2.8% |
| Telecommunications | 2.8% |
| Oil & Gas | 2.7% |
| Biotechnology | 2.6% |
| Electric | 2.1% |
| Beverages | 2.0% |
Portfolio Composition
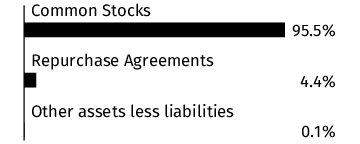
Country

* Percentages exclude derivatives (other than purchased options), if any.
Changes in and Disagreements with Accountants
There were no disagreements with the accountants during the period.
Fund Expenses
What were the Portfolio costs for the last six months ?
(Based on a hypothetical $10,000 investment)
| Portfolio (Class) | Costs of a $10,000 investment | Costs paid as a percentage of a $10,000 investment |
| SA Fidelity Institutional AM® Global Equities Portfolio (Class 2)* | $50 | 0.97%** |
| * |
The expenses shown in the table are meant to highlight your ongoing costs only and do not reflect any fees and expenses that may be charged by the variable annuity contracts and variable life insurance policies that invest in the Portfolio.
|
| ** |
Annualized
|
Key Fund Statistics
The following table outlines key fund statistics.
| Net assets | $340M |
| Total number of portfolio holdings | 346 |
| Total net advisory fee paid | $1.2M |
| Portfolio turnover rate during the reporting period | 84% |
Graphical Representation of Holdings
The information below represents the composition of the Portfolio's net assets as of the end of the period.
Top Industries*
| Internet | 10.5% |
| Banks | 9.1% |
| Semiconductors | 8.9% |
| Software | 8.8% |
| Computers | 5.6% |
| Repurchase Agreements | 4.4% |
| Pharmaceuticals | 3.5% |
| Diversified Financial Services | 3.4% |
| Insurance | 3.1% |
| Aerospace/Defense | 2.8% |
| Telecommunications | 2.8% |
| Oil & Gas | 2.7% |
| Biotechnology | 2.6% |
| Electric | 2.1% |
| Beverages | 2.0% |
Portfolio Composition

Country

* Percentages exclude derivatives (other than purchased options), if any.
Changes in and Disagreements with Accountants
There were no disagreements with the accountants during the period.
Fund Expenses
What were the Portfolio costs for the last six months ?
(Based on a hypothetical $10,000 investment)
| Portfolio (Class) | Costs of a $10,000 investment | Costs paid as a percentage of a $10,000 investment |
| SA Fidelity Institutional AM® Global Equities Portfolio (Class 3)* | $55 | 1.07%** |
| * |
The expenses shown in the table are meant to highlight your ongoing costs only and do not reflect any fees and expenses that may be charged by the variable annuity contracts and variable life insurance policies that invest in the Portfolio.
|
| ** |
Annualized
|
Key Fund Statistics
The following table outlines key fund statistics.
| Net assets | $340M |
| Total number of portfolio holdings | 346 |
| Total net advisory fee paid | $1.2M |
| Portfolio turnover rate during the reporting period | 84% |
Graphical Representation of Holdings
The information below represents the composition of the Portfolio's net assets as of the end of the period.
Top Industries*
| Internet | 10.5% |
| Banks | 9.1% |
| Semiconductors | 8.9% |
| Software | 8.8% |
| Computers | 5.6% |
| Repurchase Agreements | 4.4% |
| Pharmaceuticals | 3.5% |
| Diversified Financial Services | 3.4% |
| Insurance | 3.1% |
| Aerospace/Defense | 2.8% |
| Telecommunications | 2.8% |
| Oil & Gas | 2.7% |
| Biotechnology | 2.6% |
| Electric | 2.1% |
| Beverages | 2.0% |
Portfolio Composition

Country
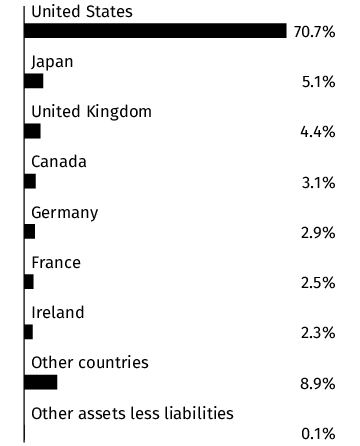
* Percentages exclude derivatives (other than purchased options), if any.
Changes in and Disagreements with Accountants
There were no disagreements with the accountants during the period.
Fund Expenses
What were the Portfolio costs for the last six months ?
(Based on a hypothetical $10,000 investment)
| Portfolio (Class) | Costs of a $10,000 investment | Costs paid as a percentage of a $10,000 investment |
| SA Janus Focused Growth Portfolio (Class 1)* | $42 | 0.80%** |
| * |
The expenses shown in the table are meant to highlight your ongoing costs only and do not reflect any fees and expenses that may be charged by the variable annuity contracts and variable life insurance policies that invest in the Portfolio.
|
| ** |
Annualized
|
Key Fund Statistics
The following table outlines key fund statistics.
| Net assets | $523M |
| Total number of portfolio holdings | 34 |
| Total net advisory fee paid | $1.7M |
| Portfolio turnover rate during the reporting period | 22% |
Graphical Representation of Holdings
The information below represents the composition of the Portfolio's net assets as of the end of the period.
Top Industries*
| Internet | 24.3% |
| Semiconductors | 21.6% |
| Software | 20.6% |
| Diversified Financial Services | 4.9% |
| Aerospace/Defense | 3.6% |
| Computers | 3.5% |
| Pharmaceuticals | 3.5% |
| Private Equity | 3.2% |
| Biotechnology | 2.5% |
| Entertainment | 2.4% |
| Electrical Components & Equipment | 2.1% |
| Healthcare-Products | 2.1% |
| Beverages | 1.7% |
| REITS | 1.1% |
| Healthcare-Services | 1.1% |
Portfolio Composition

* Percentages exclude derivatives (other than purchased options), if any.
Changes in and Disagreements with Accountants
There were no disagreements with the accountants during the period.
Fund Expenses
What were the Portfolio costs for the last six months ?
(Based on a hypothetical $10,000 investment)
| Portfolio (Class) | Costs of a $10,000 investment | Costs paid as a percentage of a $10,000 investment |
| SA Janus Focused Growth Portfolio (Class 3)* | $55 | 1.05%** |
| * |
The expenses shown in the table are meant to highlight your ongoing costs only and do not reflect any fees and expenses that may be charged by the variable annuity contracts and variable life insurance policies that invest in the Portfolio.
|
| ** |
Annualized
|
Key Fund Statistics
The following table outlines key fund statistics.
| Net assets | $523M |
| Total number of portfolio holdings | 34 |
| Total net advisory fee paid | $1.7M |
| Portfolio turnover rate during the reporting period | 22% |
Graphical Representation of Holdings
The information below represents the composition of the Portfolio's net assets as of the end of the period.
Top Industries*
| Internet | 24.3% |
| Semiconductors | 21.6% |
| Software | 20.6% |
| Diversified Financial Services | 4.9% |
| Aerospace/Defense | 3.6% |
| Computers | 3.5% |
| Pharmaceuticals | 3.5% |
| Private Equity | 3.2% |
| Biotechnology | 2.5% |
| Entertainment | 2.4% |
| Electrical Components & Equipment | 2.1% |
| Healthcare-Products | 2.1% |
| Beverages | 1.7% |
| REITS | 1.1% |
| Healthcare-Services | 1.1% |
Portfolio Composition

* Percentages exclude derivatives (other than purchased options), if any.
Changes in and Disagreements with Accountants
There were no disagreements with the accountants during the period.
Fund Expenses
What were the Portfolio costs for the last six months ?
(Based on a hypothetical $10,000 investment)
| Portfolio (Class) | Costs of a $10,000 investment | Costs paid as a percentage of a $10,000 investment |
| SA Janus Focused Growth Portfolio (Class 2)* | $50 | 0.95%** |
| * |
The expenses shown in the table are meant to highlight your ongoing costs only and do not reflect any fees and expenses that may be charged by the variable annuity contracts and variable life insurance policies that invest in the Portfolio.
|
| ** |
Annualized
|
Key Fund Statistics
The following table outlines key fund statistics.
| Net assets | $523M |
| Total number of portfolio holdings | 34 |
| Total net advisory fee paid | $1.7M |
| Portfolio turnover rate during the reporting period | 22% |
Graphical Representation of Holdings
The information below represents the composition of the Portfolio's net assets as of the end of the period.
Top Industries*
| Internet | 24.3% |
| Semiconductors | 21.6% |
| Software | 20.6% |
| Diversified Financial Services | 4.9% |
| Aerospace/Defense | 3.6% |
| Computers | 3.5% |
| Pharmaceuticals | 3.5% |
| Private Equity | 3.2% |
| Biotechnology | 2.5% |
| Entertainment | 2.4% |
| Electrical Components & Equipment | 2.1% |
| Healthcare-Products | 2.1% |
| Beverages | 1.7% |
| REITS | 1.1% |
| Healthcare-Services | 1.1% |
Portfolio Composition
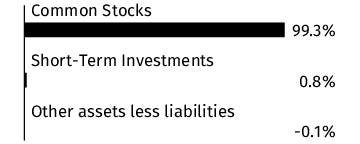
* Percentages exclude derivatives (other than purchased options), if any.
Changes in and Disagreements with Accountants
There were no disagreements with the accountants during the period.
Fund Expenses
What were the Portfolio costs for the last six months ?
(Based on a hypothetical $10,000 investment)
| Portfolio (Class) | Costs of a $10,000 investment | Costs paid as a percentage of a $10,000 investment |
| SA Franklin Systematic U.S. Large Cap Core Portfolio (Class 3)* | $39 | 0.78%** |
| * |
The expenses shown in the table are meant to highlight your ongoing costs only and do not reflect any fees and expenses that may be charged by the variable annuity contracts and variable life insurance policies that invest in the Portfolio.
|
| ** |
Annualized
|
Key Fund Statistics
The following table outlines key fund statistics.
| Net assets | $311M |
| Total number of portfolio holdings | 182 |
| Total net advisory fee paid | $0.7M |
| Portfolio turnover rate during the reporting period | 42% |
Graphical Representation of Holdings
The information below represents the composition of the Portfolio's net assets as of the end of the period.
Top Industries*
| Internet | 16.9% |
| Semiconductors | 14.0% |
| Software | 12.5% |
| Computers | 7.5% |
| Banks | 4.2% |
| Pharmaceuticals | 3.9% |
| Biotechnology | 3.7% |
| Insurance | 3.6% |
| Retail | 2.9% |
| Diversified Financial Services | 2.9% |
| Aerospace/Defense | 2.7% |
| Auto Manufacturers | 2.6% |
| Telecommunications | 2.2% |
| Electric | 1.9% |
| Healthcare-Products | 1.9% |
Portfolio Composition

* Percentages exclude derivatives (other than purchased options), if any.
Changes in and Disagreements with Accountants
There were no disagreements with the accountants during the period.
Fund Expenses
What were the Portfolio costs for the last six months ?
(Based on a hypothetical $10,000 investment)
| Portfolio (Class) | Costs of a $10,000 investment | Costs paid as a percentage of a $10,000 investment |
| SA Franklin Systematic U.S. Large Cap Core Portfolio (Class 1)* | $27 | 0.53%** |
| * |
The expenses shown in the table are meant to highlight your ongoing costs only and do not reflect any fees and expenses that may be charged by the variable annuity contracts and variable life insurance policies that invest in the Portfolio.
|
| ** |
Annualized
|
Key Fund Statistics
The following table outlines key fund statistics.
| Net assets | $311M |
| Total number of portfolio holdings | 182 |
| Total net advisory fee paid | $0.7M |
| Portfolio turnover rate during the reporting period | 42% |
Graphical Representation of Holdings
The information below represents the composition of the Portfolio's net assets as of the end of the period.
Top Industries*
| Internet | 16.9% |
| Semiconductors | 14.0% |
| Software | 12.5% |
| Computers | 7.5% |
| Banks | 4.2% |
| Pharmaceuticals | 3.9% |
| Biotechnology | 3.7% |
| Insurance | 3.6% |
| Retail | 2.9% |
| Diversified Financial Services | 2.9% |
| Aerospace/Defense | 2.7% |
| Auto Manufacturers | 2.6% |
| Telecommunications | 2.2% |
| Electric | 1.9% |
| Healthcare-Products | 1.9% |
Portfolio Composition

* Percentages exclude derivatives (other than purchased options), if any.
Changes in and Disagreements with Accountants
There were no disagreements with the accountants during the period.
Fund Expenses
What were the Portfolio costs for the last six months ?
(Based on a hypothetical $10,000 investment)
| Portfolio (Class) | Costs of a $10,000 investment | Costs paid as a percentage of a $10,000 investment |
| SA Global Index Allocation 75/25 Portfolio (Class 1)* | $9 | 0.18%** |
| * |
The expenses shown in the table are meant to highlight your ongoing costs only and do not reflect any fees and expenses that may be charged by the variable annuity contracts and variable life insurance policies that invest in the Portfolio.
|
| ** |
Annualized
|
Key Fund Statistics
The following table outlines key fund statistics.
| Net assets | $108M |
| Total number of portfolio holdings | 7 |
| Total net advisory fee paid | $0.1M |
| Portfolio turnover rate during the reporting period | 6% |
Graphical Representation of Holdings
The information below represents the composition of the Portfolio's net assets as of the end of the period.
Portfolio Composition

Changes in and Disagreements with Accountants
There were no disagreements with the accountants during the period.
Fund Expenses
What were the Portfolio costs for the last six months ?
(Based on a hypothetical $10,000 investment)
| Portfolio (Class) | Costs of a $10,000 investment | Costs paid as a percentage of a $10,000 investment |
| SA Global Index Allocation 75/25 Portfolio (Class 3)* | $22 | 0.43%** |
| * |
The expenses shown in the table are meant to highlight your ongoing costs only and do not reflect any fees and expenses that may be charged by the variable annuity contracts and variable life insurance policies that invest in the Portfolio.
|
| ** |
Annualized
|
Key Fund Statistics
The following table outlines key fund statistics.
| Net assets | $108M |
| Total number of portfolio holdings | 7 |
| Total net advisory fee paid | $0.1M |
| Portfolio turnover rate during the reporting period | 6% |
Graphical Representation of Holdings
The information below represents the composition of the Portfolio's net assets as of the end of the period.
Portfolio Composition
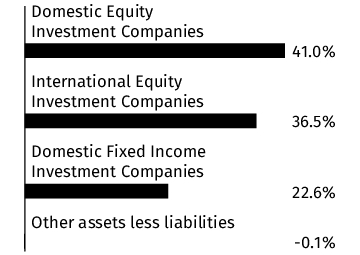
Changes in and Disagreements with Accountants
There were no disagreements with the accountants during the period.
Fund Expenses
What were the Portfolio costs for the last six months ?
(Based on a hypothetical $10,000 investment)
| Portfolio (Class) | Costs of a $10,000 investment | Costs paid as a percentage of a $10,000 investment |
| SA Fidelity Institutional AM® International Growth Portfolio (Class 1)* | $47 | 0.89%** |
| * |
The expenses shown in the table are meant to highlight your ongoing costs only and do not reflect any fees and expenses that may be charged by the variable annuity contracts and variable life insurance policies that invest in the Portfolio.
|
| ** |
Annualized
|
Key Fund Statistics
The following table outlines key fund statistics.
| Net assets | $265M |
| Total number of portfolio holdings | 61 |
| Total net advisory fee paid | $0.9M |
| Portfolio turnover rate during the reporting period | 64% |
Graphical Representation of Holdings
The information below represents the composition of the Portfolio's net assets as of the end of the period.
Top Industries*
| Banks | 9.6% |
| Internet | 9.5% |
| Aerospace/Defense | 8.8% |
| Building Materials | 8.7% |
| Semiconductors | 8.3% |
| Diversified Financial Services | 7.1% |
| Machinery-Construction & Mining | 6.1% |
| Software | 5.8% |
| Insurance | 5.8% |
| Commercial Services | 5.6% |
| Electrical Components & Equipment | 3.8% |
| Engineering & Construction | 2.9% |
| Chemicals | 2.7% |
| Electric | 1.9% |
| Transportation | 1.6% |
Portfolio Composition

Country
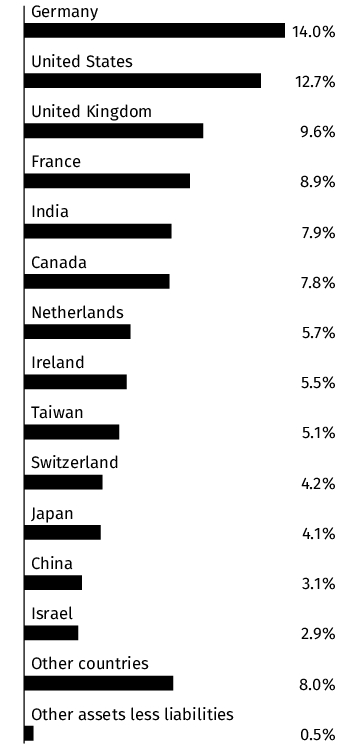
* Percentages exclude derivatives (other than purchased options), if any.
Changes in and Disagreements with Accountants
There were no disagreements with the accountants during the period.
Fund Expenses
What were the Portfolio costs for the last six months ?
(Based on a hypothetical $10,000 investment)
| Portfolio (Class) | Costs of a $10,000 investment | Costs paid as a percentage of a $10,000 investment |
| SA Fidelity Institutional AM® International Growth Portfolio (Class 3)* | $60 | 1.14%** |
| * |
The expenses shown in the table are meant to highlight your ongoing costs only and do not reflect any fees and expenses that may be charged by the variable annuity contracts and variable life insurance policies that invest in the Portfolio.
|
| ** |
Annualized
|
Key Fund Statistics
The following table outlines key fund statistics.
| Net assets | $265M |
| Total number of portfolio holdings | 61 |
| Total net advisory fee paid | $0.9M |
| Portfolio turnover rate during the reporting period | 64% |
Graphical Representation of Holdings
The information below represents the composition of the Portfolio's net assets as of the end of the period.
Top Industries*
| Banks | 9.6% |
| Internet | 9.5% |
| Aerospace/Defense | 8.8% |
| Building Materials | 8.7% |
| Semiconductors | 8.3% |
| Diversified Financial Services | 7.1% |
| Machinery-Construction & Mining | 6.1% |
| Software | 5.8% |
| Insurance | 5.8% |
| Commercial Services | 5.6% |
| Electrical Components & Equipment | 3.8% |
| Engineering & Construction | 2.9% |
| Chemicals | 2.7% |
| Electric | 1.9% |
| Transportation | 1.6% |
Portfolio Composition

Country

* Percentages exclude derivatives (other than purchased options), if any.
Changes in and Disagreements with Accountants
There were no disagreements with the accountants during the period.
Fund Expenses
What were the Portfolio costs for the last six months ?
(Based on a hypothetical $10,000 investment)
| Portfolio (Class) | Costs of a $10,000 investment | Costs paid as a percentage of a $10,000 investment |
| SA Global Index Allocation 60/40 Portfolio (Class 3)* | $22 | 0.43%** |
| * |
The expenses shown in the table are meant to highlight your ongoing costs only and do not reflect any fees and expenses that may be charged by the variable annuity contracts and variable life insurance policies that invest in the Portfolio.
|
| ** |
Annualized
|
Key Fund Statistics
The following table outlines key fund statistics.
| Net assets | $106M |
| Total number of portfolio holdings | 7 |
| Total net advisory fee paid | $0.1M |
| Portfolio turnover rate during the reporting period | 7% |
Graphical Representation of Holdings
The information below represents the composition of the Portfolio's net assets as of the end of the period.
Portfolio Composition

Changes in and Disagreements with Accountants
There were no disagreements with the accountants during the period.
Fund Expenses
What were the Portfolio costs for the last six months ?
(Based on a hypothetical $10,000 investment)
| Portfolio (Class) | Costs of a $10,000 investment | Costs paid as a percentage of a $10,000 investment |
| SA Global Index Allocation 60/40 Portfolio (Class 1)* | $9 | 0.18%** |
| * |
The expenses shown in the table are meant to highlight your ongoing costs only and do not reflect any fees and expenses that may be charged by the variable annuity contracts and variable life insurance policies that invest in the Portfolio.
|
| ** |
Annualized
|
Key Fund Statistics
The following table outlines key fund statistics.
| Net assets | $106M |
| Total number of portfolio holdings | 7 |
| Total net advisory fee paid | $0.1M |
| Portfolio turnover rate during the reporting period | 7% |
Graphical Representation of Holdings
The information below represents the composition of the Portfolio's net assets as of the end of the period.
Portfolio Composition
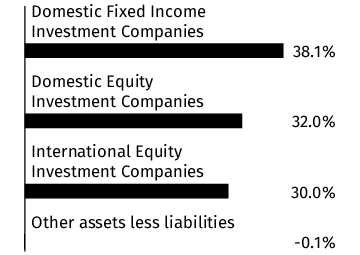
Changes in and Disagreements with Accountants
There were no disagreements with the accountants during the period.
Fund Expenses
What were the Portfolio costs for the last six months ?
(Based on a hypothetical $10,000 investment)
| Portfolio (Class) | Costs of a $10,000 investment | Costs paid as a percentage of a $10,000 investment |
| SA Large Cap Growth Index Portfolio (Class 1)* | $18 | 0.35%** |
| * |
The expenses shown in the table are meant to highlight your ongoing costs only and do not reflect any fees and expenses that may be charged by the variable annuity contracts and variable life insurance policies that invest in the Portfolio.
|
| ** |
Annualized
|
Key Fund Statistics
The following table outlines key fund statistics.
| Net assets | $740M |
| Total number of portfolio holdings | 216 |
| Total net advisory fee paid | $1.0M |
| Portfolio turnover rate during the reporting period | 12% |
Graphical Representation of Holdings
The information below represents the composition of the Portfolio's net assets as of the end of the period.
Top Industries*
| Internet | 21.2% |
| Semiconductors | 20.4% |
| Software | 13.9% |
| Computers | 6.6% |
| Diversified Financial Services | 5.1% |
| Retail | 4.2% |
| Auto Manufacturers | 3.2% |
| Insurance | 2.8% |
| Pharmaceuticals | 2.5% |
| Banks | 2.0% |
| Commercial Services | 1.7% |
| Healthcare-Products | 1.6% |
| Aerospace/Defense | 1.4% |
| Machinery-Construction & Mining | 1.3% |
| Electric | 1.2% |
Portfolio Composition

* Percentages exclude derivatives (other than purchased options), if any.
Changes in and Disagreements with Accountants
There were no disagreements with the accountants during the period.
Fund Expenses
What were the Portfolio costs for the last six months ?
(Based on a hypothetical $10,000 investment)
| Portfolio (Class) | Costs of a $10,000 investment | Costs paid as a percentage of a $10,000 investment |
| SA Large Cap Growth Index Portfolio (Class 3)* | $31 | 0.60%** |
| * |
The expenses shown in the table are meant to highlight your ongoing costs only and do not reflect any fees and expenses that may be charged by the variable annuity contracts and variable life insurance policies that invest in the Portfolio.
|
| ** |
Annualized
|
Key Fund Statistics
The following table outlines key fund statistics.
| Net assets | $740M |
| Total number of portfolio holdings | 216 |
| Total net advisory fee paid | $1.0M |
| Portfolio turnover rate during the reporting period | 12% |
Graphical Representation of Holdings
The information below represents the composition of the Portfolio's net assets as of the end of the period.
Top Industries*
| Internet | 21.2% |
| Semiconductors | 20.4% |
| Software | 13.9% |
| Computers | 6.6% |
| Diversified Financial Services | 5.1% |
| Retail | 4.2% |
| Auto Manufacturers | 3.2% |
| Insurance | 2.8% |
| Pharmaceuticals | 2.5% |
| Banks | 2.0% |
| Commercial Services | 1.7% |
| Healthcare-Products | 1.6% |
| Aerospace/Defense | 1.4% |
| Machinery-Construction & Mining | 1.3% |
| Electric | 1.2% |
Portfolio Composition

* Percentages exclude derivatives (other than purchased options), if any.
Changes in and Disagreements with Accountants
There were no disagreements with the accountants during the period.
This report describes changes to the Portfolio that occurred during the reporting period.
Fund Expenses
What were the Portfolio costs for the last six months ?
(Based on a hypothetical $10,000 investment)
| Portfolio (Class) | Costs of a $10,000 investment | Costs paid as a percentage of a $10,000 investment |
| SA Putnam International Value Portfolio (Class 1)* | $50 | 0.93%** |
| * |
The expenses shown in the table are meant to highlight your ongoing costs only and do not reflect any fees and expenses that may be charged by the variable annuity contracts and variable life insurance policies that invest in the Portfolio.
|
| ** |
Annualized
|
Key Fund Statistics
The following table outlines key fund statistics.
| Net assets | $325M |
| Total number of portfolio holdings | 147 |
| Total net advisory fee paid | $1.3M |
| Portfolio turnover rate during the reporting period | 16% |
Graphical Representation of Holdings
The information below represents the composition of the Portfolio's net assets as of the end of the period.
Top Industries*
| Banks | 24.5% |
| Insurance | 10.4% |
| Oil & Gas | 6.7% |
| Telecommunications | 4.8% |
| Pharmaceuticals | 4.6% |
| Building Materials | 3.7% |
| Miscellaneous Manufacturing | 3.5% |
| Electronics | 3.5% |
| Retail | 3.3% |
| Distribution/Wholesale | 3.0% |
| Beverages | 2.8% |
| Food | 2.7% |
| Aerospace/Defense | 2.5% |
| Cosmetics/Personal Care | 1.8% |
| Mining | 1.7% |
Portfolio Composition

Country

* Percentages exclude derivatives (other than purchased options), if any.
Changes in and Disagreements with Accountants
There were no disagreements with the accountants during the period.
This report describes changes to the Portfolio that occurred during the reporting period.
Fund Expenses
What were the Portfolio costs for the last six months ?
(Based on a hypothetical $10,000 investment)
| Portfolio (Class) | Costs of a $10,000 investment | Costs paid as a percentage of a $10,000 investment |
| SA Putnam International Value Portfolio (Class 2)* | $58 | 1.08%** |
| * |
The expenses shown in the table are meant to highlight your ongoing costs only and do not reflect any fees and expenses that may be charged by the variable annuity contracts and variable life insurance policies that invest in the Portfolio.
|
| ** |
Annualized
|
Key Fund Statistics
The following table outlines key fund statistics.
| Net assets | $325M |
| Total number of portfolio holdings | 147 |
| Total net advisory fee paid | $1.3M |
| Portfolio turnover rate during the reporting period | 16% |
Graphical Representation of Holdings
The information below represents the composition of the Portfolio's net assets as of the end of the period.
Top Industries*
| Banks | 24.5% |
| Insurance | 10.4% |
| Oil & Gas | 6.7% |
| Telecommunications | 4.8% |
| Pharmaceuticals | 4.6% |
| Building Materials | 3.7% |
| Miscellaneous Manufacturing | 3.5% |
| Electronics | 3.5% |
| Retail | 3.3% |
| Distribution/Wholesale | 3.0% |
| Beverages | 2.8% |
| Food | 2.7% |
| Aerospace/Defense | 2.5% |
| Cosmetics/Personal Care | 1.8% |
| Mining | 1.7% |
Portfolio Composition

Country

* Percentages exclude derivatives (other than purchased options), if any.
Changes in and Disagreements with Accountants
There were no disagreements with the accountants during the period.
This report describes changes to the Portfolio that occurred during the reporting period.
Fund Expenses
What were the Portfolio costs for the last six months ?
(Based on a hypothetical $10,000 investment)
| Portfolio (Class) | Costs of a $10,000 investment | Costs paid as a percentage of a $10,000 investment |
| SA Putnam International Value Portfolio (Class 3)* | $64 | 1.18%** |
| * |
The expenses shown in the table are meant to highlight your ongoing costs only and do not reflect any fees and expenses that may be charged by the variable annuity contracts and variable life insurance policies that invest in the Portfolio.
|
| ** |
Annualized
|
Key Fund Statistics
The following table outlines key fund statistics.
| Net assets | $325M |
| Total number of portfolio holdings | 147 |
| Total net advisory fee paid | $1.3M |
| Portfolio turnover rate during the reporting period | 16% |
Graphical Representation of Holdings
The information below represents the composition of the Portfolio's net assets as of the end of the period.
Top Industries*
| Banks | 24.5% |
| Insurance | 10.4% |
| Oil & Gas | 6.7% |
| Telecommunications | 4.8% |
| Pharmaceuticals | 4.6% |
| Building Materials | 3.7% |
| Miscellaneous Manufacturing | 3.5% |
| Electronics | 3.5% |
| Retail | 3.3% |
| Distribution/Wholesale | 3.0% |
| Beverages | 2.8% |
| Food | 2.7% |
| Aerospace/Defense | 2.5% |
| Cosmetics/Personal Care | 1.8% |
| Mining | 1.7% |
Portfolio Composition

Country
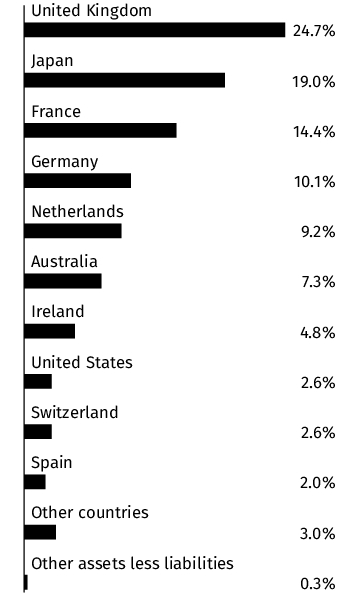
* Percentages exclude derivatives (other than purchased options), if any.
Changes in and Disagreements with Accountants
There were no disagreements with the accountants during the period.
Fund Expenses
What were the Portfolio costs for the last six months ?
(Based on a hypothetical $10,000 investment)
| Portfolio (Class) | Costs of a $10,000 investment | Costs paid as a percentage of a $10,000 investment |
| SA T. Rowe Price Allocation Moderately Aggressive Portfolio (Class 3)* | $50 | 0.99%** |
| * |
The expenses shown in the table are meant to highlight your ongoing costs only and do not reflect any fees and expenses that may be charged by the variable annuity contracts and variable life insurance policies that invest in the Portfolio.
|
| ** |
Annualized
|
Key Fund Statistics
The following table outlines key fund statistics.
| Net assets | $773M |
| Total number of portfolio holdings | 1,487 |
| Total net advisory fee paid | $2.6M |
| Portfolio turnover rate during the reporting period | 16% |
Graphical Representation of Holdings
The information below represents the composition of the Portfolio's net assets as of the end of the period.
Top Industries*
| U.S. Government & Agency Obligations | 10.0% |
| Semiconductors | 8.0% |
| Software | 7.4% |
| Banks | 7.0% |
| Internet | 6.6% |
| Insurance | 4.5% |
| Retail | 4.4% |
| Diversified Financial Services | 3.9% |
| Pharmaceuticals | 3.5% |
| Computers | 3.2% |
| Short-Term Investments | 2.7% |
| Oil & Gas | 2.6% |
| Healthcare-Products | 2.6% |
| Aerospace/Defense | 2.4% |
| Electric | 2.0% |
Portfolio Composition
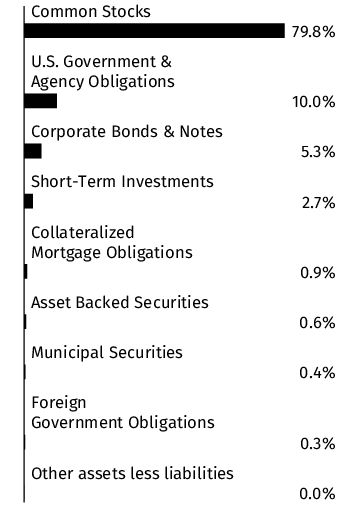
* Percentages exclude derivatives (other than purchased options), if any.
Changes in and Disagreements with Accountants
There were no disagreements with the accountants during the period.
Fund Expenses
What were the Portfolio costs for the last six months ?
(Based on a hypothetical $10,000 investment)
| Portfolio (Class) | Costs of a $10,000 investment | Costs paid as a percentage of a $10,000 investment |
| SA T. Rowe Price Allocation Moderately Aggressive Portfolio (Class 1)* | $38 | 0.74%** |
| * |
The expenses shown in the table are meant to highlight your ongoing costs only and do not reflect any fees and expenses that may be charged by the variable annuity contracts and variable life insurance policies that invest in the Portfolio.
|
| ** |
Annualized
|
Key Fund Statistics
The following table outlines key fund statistics.
| Net assets | $773M |
| Total number of portfolio holdings | 1,487 |
| Total net advisory fee paid | $2.6M |
| Portfolio turnover rate during the reporting period | 16% |
Graphical Representation of Holdings
The information below represents the composition of the Portfolio's net assets as of the end of the period.
Top Industries*
| U.S. Government & Agency Obligations | 10.0% |
| Semiconductors | 8.0% |
| Software | 7.4% |
| Banks | 7.0% |
| Internet | 6.6% |
| Insurance | 4.5% |
| Retail | 4.4% |
| Diversified Financial Services | 3.9% |
| Pharmaceuticals | 3.5% |
| Computers | 3.2% |
| Short-Term Investments | 2.7% |
| Oil & Gas | 2.6% |
| Healthcare-Products | 2.6% |
| Aerospace/Defense | 2.4% |
| Electric | 2.0% |
Portfolio Composition

* Percentages exclude derivatives (other than purchased options), if any.
Changes in and Disagreements with Accountants
There were no disagreements with the accountants during the period.
Fund Expenses
What were the Portfolio costs for the last six months ?
(Based on a hypothetical $10,000 investment)
| Portfolio (Class) | Costs of a $10,000 investment | Costs paid as a percentage of a $10,000 investment |
| SA Fidelity Institutional AM® Real Estate Portfolio (Class 1)* | $41 | 0.85%** |
| * |
The expenses shown in the table are meant to highlight your ongoing costs only and do not reflect any fees and expenses that may be charged by the variable annuity contracts and variable life insurance policies that invest in the Portfolio.
|
| ** |
Annualized
|
Key Fund Statistics
The following table outlines key fund statistics.
| Net assets | $247M |
| Total number of portfolio holdings | 32 |
| Total net advisory fee paid | $0.9M |
| Portfolio turnover rate during the reporting period | 20% |
Graphical Representation of Holdings
The information below represents the composition of the Portfolio's net assets as of the end of the period.
Top Industries*
| REITS | 97.4% |
| Real Estate | 1.2% |
| Internet | 1.1% |
Portfolio Composition

* Percentages exclude derivatives (other than purchased options), if any.
Changes in and Disagreements with Accountants
There were no disagreements with the accountants during the period.
Fund Expenses
What were the Portfolio costs for the last six months ?
(Based on a hypothetical $10,000 investment)
| Portfolio (Class) | Costs of a $10,000 investment | Costs paid as a percentage of a $10,000 investment |
| SA Invesco Growth Opportunities Portfolio (Class 1)* | $40 | 0.82%** |
| * |
The expenses shown in the table are meant to highlight your ongoing costs only and do not reflect any fees and expenses that may be charged by the variable annuity contracts and variable life insurance policies that invest in the Portfolio.
|
| ** |
Annualized
|
Key Fund Statistics
The following table outlines key fund statistics.
| Net assets | $282M |
| Total number of portfolio holdings | 110 |
| Total net advisory fee paid | $1.0M |
| Portfolio turnover rate during the reporting period | 58% |
Graphical Representation of Holdings
The information below represents the composition of the Portfolio's net assets as of the end of the period.
Top Industries*
| Electronics | 8.8% |
| Diversified Financial Services | 6.9% |
| Software | 6.7% |
| Healthcare-Products | 6.6% |
| Retail | 6.0% |
| Biotechnology | 5.3% |
| Semiconductors | 4.7% |
| Aerospace/Defense | 4.2% |
| Machinery-Diversified | 4.0% |
| Commercial Services | 3.9% |
| Miscellaneous Manufacturing | 3.7% |
| Engineering & Construction | 3.5% |
| Healthcare-Services | 3.1% |
| Computers | 3.0% |
| Internet | 2.6% |
Portfolio Composition

* Percentages exclude derivatives (other than purchased options), if any.
Changes in and Disagreements with Accountants
There were no disagreements with the accountants during the period.
Fund Expenses
What were the Portfolio costs for the last six months ?
(Based on a hypothetical $10,000 investment)
| Portfolio (Class) | Costs of a $10,000 investment | Costs paid as a percentage of a $10,000 investment |
| SA Fidelity Institutional AM® Real Estate Portfolio (Class 2)* | $49 | 1.00%** |
| * |
The expenses shown in the table are meant to highlight your ongoing costs only and do not reflect any fees and expenses that may be charged by the variable annuity contracts and variable life insurance policies that invest in the Portfolio.
|
| ** |
Annualized
|
Key Fund Statistics
The following table outlines key fund statistics.
| Net assets | $247M |
| Total number of portfolio holdings | 32 |
| Total net advisory fee paid | $0.9M |
| Portfolio turnover rate during the reporting period | 20% |
Graphical Representation of Holdings
The information below represents the composition of the Portfolio's net assets as of the end of the period.
Top Industries*
| REITS | 97.4% |
| Real Estate | 1.2% |
| Internet | 1.1% |
Portfolio Composition

* Percentages exclude derivatives (other than purchased options), if any.
Changes in and Disagreements with Accountants
There were no disagreements with the accountants during the period.
Fund Expenses
What were the Portfolio costs for the last six months ?
(Based on a hypothetical $10,000 investment)
| Portfolio (Class) | Costs of a $10,000 investment | Costs paid as a percentage of a $10,000 investment |
| SA Fidelity Institutional AM® Real Estate Portfolio (Class 3)* | $54 | 1.10%** |
| * |
The expenses shown in the table are meant to highlight your ongoing costs only and do not reflect any fees and expenses that may be charged by the variable annuity contracts and variable life insurance policies that invest in the Portfolio.
|
| ** |
Annualized
|
Key Fund Statistics
The following table outlines key fund statistics.
| Net assets | $247M |
| Total number of portfolio holdings | 32 |
| Total net advisory fee paid | $0.9M |
| Portfolio turnover rate during the reporting period | 20% |
Graphical Representation of Holdings
The information below represents the composition of the Portfolio's net assets as of the end of the period.
Top Industries*
| REITS | 97.4% |
| Real Estate | 1.2% |
| Internet | 1.1% |
Portfolio Composition

* Percentages exclude derivatives (other than purchased options), if any.
Changes in and Disagreements with Accountants
There were no disagreements with the accountants during the period.
This report describes changes to the Portfolio that occurred during the reporting period.
Fund Expenses
What were the Portfolio costs for the last six months ?
(Based on a hypothetical $10,000 investment)
| Portfolio (Class) | Costs of a $10,000 investment | Costs paid as a percentage of a $10,000 investment |
| SA PIMCO Global Bond Opportunities Portfolio (Class 3)* | $59 | 1.17%** |
| * |
The expenses shown in the table are meant to highlight your ongoing costs only and do not reflect any fees and expenses that may be charged by the variable annuity contracts and variable life insurance policies that invest in the Portfolio.
|
| ** |
Annualized
|
Key Fund Statistics
The following table outlines key fund statistics.
| Net assets | $280M |
| Total number of portfolio holdings | 511 |
| Total net advisory fee paid | $0.9M |
| Portfolio turnover rate during the reporting period | 150% |
Graphical Representation of Holdings
The information below represents the composition of the Portfolio as of the end of the period.
Top Industries*
(% of net assets)
(% of net assets)
| U.S. Government & Agency Obligations | 78.8% |
| Foreign Government Obligations | 33.6% |
| Collateralized Mortgage Obligations | 12.6% |
| Banks | 10.5% |
| Other Asset Backed Securities | 6.7% |
| Short-Term Investments | 5.6% |
| Auto Loan Receivables | 1.3% |
| Investment Companies | 1.1% |
| Pharmaceuticals | 0.6% |
| Credit Card Receivables | 0.5% |
| Diversified Financial Services | 0.4% |
| Healthcare-Products | 0.4% |
| Semiconductors | 0.4% |
| Insurance | 0.3% |
| Agriculture | 0.3% |
Country
(% of net assets)
(% of net assets)

Credit Quality **
(% of total debt issues)
(% of total debt issues)
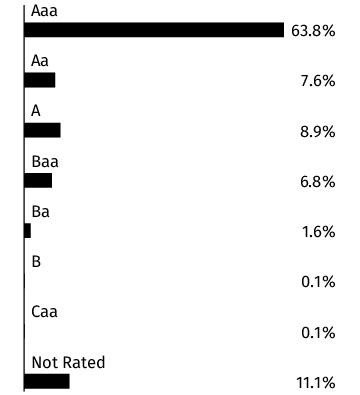
* Percentages exclude derivatives (other than purchased options), if any.
** Credit quality ratings shown above reflect the rating assigned by Moody's Investors Service, Inc. Where Moody's ratings are not available, we have used Standard & Poor's ratings. Unrated investments do not necessarily indicate low credit quality. Credit quality ratings are subject to change. Percentages exclude short-term securities.
Changes in and Disagreements with Accountants
There were no disagreements with the accountants during the period.
This report describes changes to the Portfolio that occurred during the reporting period.
Fund Expenses
What were the Portfolio costs for the last six months ?
(Based on a hypothetical $10,000 investment)
| Portfolio (Class) | Costs of a $10,000 investment | Costs paid as a percentage of a $10,000 investment |
| SA PIMCO Global Bond Opportunities Portfolio (Class 1)* | $46 | 0.92%** |
| * |
The expenses shown in the table are meant to highlight your ongoing costs only and do not reflect any fees and expenses that may be charged by the variable annuity contracts and variable life insurance policies that invest in the Portfolio.
|
| ** |
Annualized
|
Key Fund Statistics
The following table outlines key fund statistics.
| Net assets | $280M |
| Total number of portfolio holdings | 511 |
| Total net advisory fee paid | $0.9M |
| Portfolio turnover rate during the reporting period | 150% |
Graphical Representation of Holdings
The information below represents the composition of the Portfolio as of the end of the period.
Top Industries*
(% of net assets)
(% of net assets)
| U.S. Government & Agency Obligations | 78.8% |
| Foreign Government Obligations | 33.6% |
| Collateralized Mortgage Obligations | 12.6% |
| Banks | 10.5% |
| Other Asset Backed Securities | 6.7% |
| Short-Term Investments | 5.6% |
| Auto Loan Receivables | 1.3% |
| Investment Companies | 1.1% |
| Pharmaceuticals | 0.6% |
| Credit Card Receivables | 0.5% |
| Diversified Financial Services | 0.4% |
| Healthcare-Products | 0.4% |
| Semiconductors | 0.4% |
| Insurance | 0.3% |
| Agriculture | 0.3% |
Country
(% of net assets)
(% of net assets)
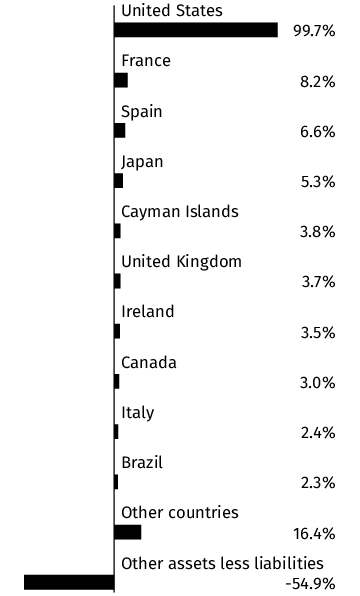
Credit Quality **
(% of total debt issues)
(% of total debt issues)

* Percentages exclude derivatives (other than purchased options), if any.
** Credit quality ratings shown above reflect the rating assigned by Moody's Investors Service, Inc. Where Moody's ratings are not available, we have used Standard & Poor's ratings. Unrated investments do not necessarily indicate low credit quality. Credit quality ratings are subject to change. Percentages exclude short-term securities.
Changes in and Disagreements with Accountants
There were no disagreements with the accountants during the period.
This report describes changes to the Portfolio that occurred during the reporting period.
Fund Expenses
What were the Portfolio costs for the last six months ?
(Based on a hypothetical $10,000 investment)
| Portfolio (Class) | Costs of a $10,000 investment | Costs paid as a percentage of a $10,000 investment |
| SA PIMCO Global Bond Opportunities Portfolio (Class 2)* | $54 | 1.07%** |
| * |
The expenses shown in the table are meant to highlight your ongoing costs only and do not reflect any fees and expenses that may be charged by the variable annuity contracts and variable life insurance policies that invest in the Portfolio.
|
| ** |
Annualized
|
Key Fund Statistics
The following table outlines key fund statistics.
| Net assets | $280M |
| Total number of portfolio holdings | 511 |
| Total net advisory fee paid | $0.9M |
| Portfolio turnover rate during the reporting period | 150% |
Graphical Representation of Holdings
The information below represents the composition of the Portfolio as of the end of the period.
Top Industries*
(% of net assets)
(% of net assets)
| U.S. Government & Agency Obligations | 78.8% |
| Foreign Government Obligations | 33.6% |
| Collateralized Mortgage Obligations | 12.6% |
| Banks | 10.5% |
| Other Asset Backed Securities | 6.7% |
| Short-Term Investments | 5.6% |
| Auto Loan Receivables | 1.3% |
| Investment Companies | 1.1% |
| Pharmaceuticals | 0.6% |
| Credit Card Receivables | 0.5% |
| Diversified Financial Services | 0.4% |
| Healthcare-Products | 0.4% |
| Semiconductors | 0.4% |
| Insurance | 0.3% |
| Agriculture | 0.3% |
Country
(% of net assets)
(% of net assets)

Credit Quality **
(% of total debt issues)
(% of total debt issues)

* Percentages exclude derivatives (other than purchased options), if any.
** Credit quality ratings shown above reflect the rating assigned by Moody's Investors Service, Inc. Where Moody's ratings are not available, we have used Standard & Poor's ratings. Unrated investments do not necessarily indicate low credit quality. Credit quality ratings are subject to change. Percentages exclude short-term securities.
Changes in and Disagreements with Accountants
There were no disagreements with the accountants during the period.
This report describes changes to the Portfolio that occurred during the reporting period.
Fund Expenses
What were the Portfolio costs for the last six months ?
(Based on a hypothetical $10,000 investment)
| Portfolio (Class) | Costs of a $10,000 investment | Costs paid as a percentage of a $10,000 investment |
| SA AB Small & Mid Cap Value Portfolio (Class 1)* | $44 | 0.91%** |
| * |
The expenses shown in the table are meant to highlight your ongoing costs only and do not reflect any fees and expenses that may be charged by the variable annuity contracts and variable life insurance policies that invest in the Portfolio.
|
| ** |
Annualized
|
Key Fund Statistics
The following table outlines key fund statistics.
| Net assets | $476M |
| Total number of portfolio holdings | 92 |
| Total net advisory fee paid | $2.0M |
| Portfolio turnover rate during the reporting period | 44% |
Graphical Representation of Holdings
The information below represents the composition of the Portfolio's net assets as of the end of the period.
Top Industries*
| Banks | 9.6% |
| Retail | 7.0% |
| REITS | 6.6% |
| Commercial Services | 6.6% |
| Computers | 6.0% |
| Transportation | 4.4% |
| Healthcare-Services | 4.3% |
| Diversified Financial Services | 3.6% |
| Oil & Gas | 3.4% |
| Healthcare-Products | 3.4% |
| Insurance | 2.8% |
| Semiconductors | 2.8% |
| Machinery-Diversified | 2.5% |
| Chemicals | 2.5% |
| Packaging & Containers | 2.3% |
Portfolio Composition

* Percentages exclude derivatives (other than purchased options), if any.
Changes in and Disagreements with Accountants
There were no disagreements with the accountants during the period.
This report describes changes to the Portfolio that occurred during the reporting period.
Fund Expenses
What were the Portfolio costs for the last six months ?
(Based on a hypothetical $10,000 investment)
| Portfolio (Class) | Costs of a $10,000 investment | Costs paid as a percentage of a $10,000 investment |
| SA AB Small & Mid Cap Value Portfolio (Class 2)* | $51 | 1.06%** |
| * |
The expenses shown in the table are meant to highlight your ongoing costs only and do not reflect any fees and expenses that may be charged by the variable annuity contracts and variable life insurance policies that invest in the Portfolio.
|
| ** |
Annualized
|
Key Fund Statistics
The following table outlines key fund statistics.
| Net assets | $476M |
| Total number of portfolio holdings | 92 |
| Total net advisory fee paid | $2.0M |
| Portfolio turnover rate during the reporting period | 44% |
Graphical Representation of Holdings
The information below represents the composition of the Portfolio's net assets as of the end of the period.
Top Industries*
| Banks | 9.6% |
| Retail | 7.0% |
| REITS | 6.6% |
| Commercial Services | 6.6% |
| Computers | 6.0% |
| Transportation | 4.4% |
| Healthcare-Services | 4.3% |
| Diversified Financial Services | 3.6% |
| Oil & Gas | 3.4% |
| Healthcare-Products | 3.4% |
| Insurance | 2.8% |
| Semiconductors | 2.8% |
| Machinery-Diversified | 2.5% |
| Chemicals | 2.5% |
| Packaging & Containers | 2.3% |
Portfolio Composition
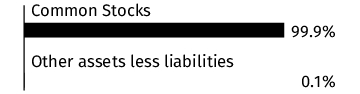
* Percentages exclude derivatives (other than purchased options), if any.
Changes in and Disagreements with Accountants
There were no disagreements with the accountants during the period.
This report describes changes to the Portfolio that occurred during the reporting period.
Fund Expenses
What were the Portfolio costs for the last six months ?
(Based on a hypothetical $10,000 investment)
| Portfolio (Class) | Costs of a $10,000 investment | Costs paid as a percentage of a $10,000 investment |
| SA AB Small & Mid Cap Value Portfolio (Class 3)* | $56 | 1.16%** |
| * |
The expenses shown in the table are meant to highlight your ongoing costs only and do not reflect any fees and expenses that may be charged by the variable annuity contracts and variable life insurance policies that invest in the Portfolio.
|
| ** |
Annualized
|
Key Fund Statistics
The following table outlines key fund statistics.
| Net assets | $476M |
| Total number of portfolio holdings | 92 |
| Total net advisory fee paid | $2.0M |
| Portfolio turnover rate during the reporting period | 44% |
Graphical Representation of Holdings
The information below represents the composition of the Portfolio's net assets as of the end of the period.
Top Industries*
| Banks | 9.6% |
| Retail | 7.0% |
| REITS | 6.6% |
| Commercial Services | 6.6% |
| Computers | 6.0% |
| Transportation | 4.4% |
| Healthcare-Services | 4.3% |
| Diversified Financial Services | 3.6% |
| Oil & Gas | 3.4% |
| Healthcare-Products | 3.4% |
| Insurance | 2.8% |
| Semiconductors | 2.8% |
| Machinery-Diversified | 2.5% |
| Chemicals | 2.5% |
| Packaging & Containers | 2.3% |
Portfolio Composition

* Percentages exclude derivatives (other than purchased options), if any.
Changes in and Disagreements with Accountants
There were no disagreements with the accountants during the period.
Fund Expenses
What were the Portfolio costs for the last six months ?
(Based on a hypothetical $10,000 investment)
| Portfolio (Class) | Costs of a $10,000 investment | Costs paid as a percentage of a $10,000 investment |
| SA PIMCO RAE International Value Portfolio (Class 1)* | $45 | 0.84%** |
| * |
The expenses shown in the table are meant to highlight your ongoing costs only and do not reflect any fees and expenses that may be charged by the variable annuity contracts and variable life insurance policies that invest in the Portfolio.
|
| ** |
Annualized
|
Key Fund Statistics
The following table outlines key fund statistics.
| Net assets | $428M |
| Total number of portfolio holdings | 261 |
| Total net advisory fee paid | $1.6M |
| Portfolio turnover rate during the reporting period | 26% |
Graphical Representation of Holdings
The information below represents the composition of the Portfolio's net assets as of the end of the period.
Top Industries*
| Telecommunications | 11.8% |
| Pharmaceuticals | 10.8% |
| Insurance | 7.7% |
| Chemicals | 6.7% |
| Food | 6.4% |
| Agriculture | 6.1% |
| Transportation | 6.0% |
| Auto Manufacturers | 3.6% |
| Iron/Steel | 3.6% |
| Mining | 3.4% |
| Retail | 3.2% |
| Auto Parts & Equipment | 2.9% |
| Electric | 2.6% |
| Commercial Services | 2.4% |
| Banks | 2.3% |
Portfolio Composition
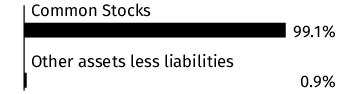
Country

* Percentages exclude derivatives (other than purchased options), if any.
Changes in and Disagreements with Accountants
There were no disagreements with the accountants during the period.
Fund Expenses
What were the Portfolio costs for the last six months ?
(Based on a hypothetical $10,000 investment)
| Portfolio (Class) | Costs of a $10,000 investment | Costs paid as a percentage of a $10,000 investment |
| SA PIMCO RAE International Value Portfolio (Class 2)* | $53 | 0.99%** |
| * |
The expenses shown in the table are meant to highlight your ongoing costs only and do not reflect any fees and expenses that may be charged by the variable annuity contracts and variable life insurance policies that invest in the Portfolio.
|
| ** |
Annualized
|
Key Fund Statistics
The following table outlines key fund statistics.
| Net assets | $428M |
| Total number of portfolio holdings | 261 |
| Total net advisory fee paid | $1.6M |
| Portfolio turnover rate during the reporting period | 26% |
Graphical Representation of Holdings
The information below represents the composition of the Portfolio's net assets as of the end of the period.
Top Industries*
| Telecommunications | 11.8% |
| Pharmaceuticals | 10.8% |
| Insurance | 7.7% |
| Chemicals | 6.7% |
| Food | 6.4% |
| Agriculture | 6.1% |
| Transportation | 6.0% |
| Auto Manufacturers | 3.6% |
| Iron/Steel | 3.6% |
| Mining | 3.4% |
| Retail | 3.2% |
| Auto Parts & Equipment | 2.9% |
| Electric | 2.6% |
| Commercial Services | 2.4% |
| Banks | 2.3% |
Portfolio Composition

Country
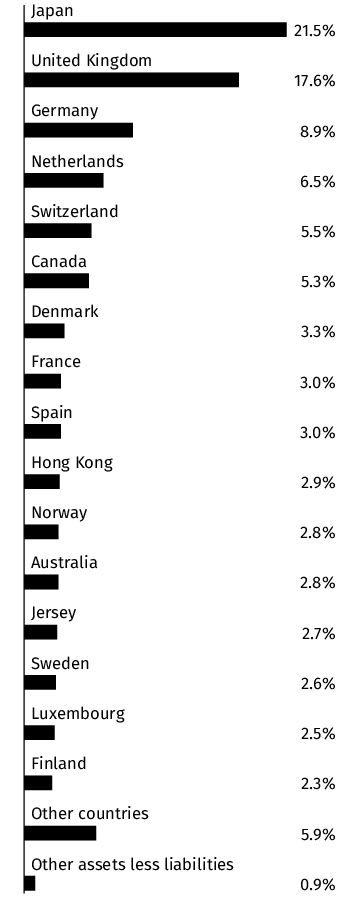
* Percentages exclude derivatives (other than purchased options), if any.
Changes in and Disagreements with Accountants
There were no disagreements with the accountants during the period.
Fund Expenses
What were the Portfolio costs for the last six months ?
(Based on a hypothetical $10,000 investment)
| Portfolio (Class) | Costs of a $10,000 investment | Costs paid as a percentage of a $10,000 investment |
| SA JPMorgan Diversified Balanced Portfolio (Class 3)* | $49 | 0.96%** |
| * |
The expenses shown in the table are meant to highlight your ongoing costs only and do not reflect any fees and expenses that may be charged by the variable annuity contracts and variable life insurance policies that invest in the Portfolio.
|
| ** |
Annualized
|
Key Fund Statistics
The following table outlines key fund statistics.
| Net assets | $429M |
| Total number of portfolio holdings | 1,614 |
| Total net advisory fee paid | $1.2M |
| Portfolio turnover rate during the reporting period | 31% |
Graphical Representation of Holdings
The information below represents the composition of the Portfolio's net assets as of the end of the period.
Top Industries*
| Banks | 10.3% |
| U.S. Government & Agency Obligations | 8.3% |
| Internet | 6.7% |
| Semiconductors | 6.4% |
| Software | 5.6% |
| Unaffiliated Investment Companies | 4.3% |
| Other Asset Backed Securities | 3.6% |
| Diversified Financial Services | 3.5% |
| Electric | 3.3% |
| Pharmaceuticals | 3.2% |
| Retail | 3.2% |
| Short-Term Investments | 2.5% |
| Collateralized Mortgage Obligations | 2.5% |
| Computers | 2.4% |
| Insurance | 2.2% |
Portfolio Composition

* Percentages exclude derivatives (other than purchased options), if any.
Changes in and Disagreements with Accountants
There were no disagreements with the accountants during the period.
Fund Expenses
What were the Portfolio costs for the last six months ?
(Based on a hypothetical $10,000 investment)
| Portfolio (Class) | Costs of a $10,000 investment | Costs paid as a percentage of a $10,000 investment |
| SA JPMorgan Diversified Balanced Portfolio (Class 1)* | $36 | 0.71%** |
| * |
The expenses shown in the table are meant to highlight your ongoing costs only and do not reflect any fees and expenses that may be charged by the variable annuity contracts and variable life insurance policies that invest in the Portfolio.
|
| ** |
Annualized
|
Key Fund Statistics
The following table outlines key fund statistics.
| Net assets | $429M |
| Total number of portfolio holdings | 1,614 |
| Total net advisory fee paid | $1.2M |
| Portfolio turnover rate during the reporting period | 31% |
Graphical Representation of Holdings
The information below represents the composition of the Portfolio's net assets as of the end of the period.
Top Industries*
| Banks | 10.3% |
| U.S. Government & Agency Obligations | 8.3% |
| Internet | 6.7% |
| Semiconductors | 6.4% |
| Software | 5.6% |
| Unaffiliated Investment Companies | 4.3% |
| Other Asset Backed Securities | 3.6% |
| Diversified Financial Services | 3.5% |
| Electric | 3.3% |
| Pharmaceuticals | 3.2% |
| Retail | 3.2% |
| Short-Term Investments | 2.5% |
| Collateralized Mortgage Obligations | 2.5% |
| Computers | 2.4% |
| Insurance | 2.2% |
Portfolio Composition

* Percentages exclude derivatives (other than purchased options), if any.
Changes in and Disagreements with Accountants
There were no disagreements with the accountants during the period.
Fund Expenses
What were the Portfolio costs for the last six months ?
(Based on a hypothetical $10,000 investment)
| Portfolio (Class) | Costs of a $10,000 investment | Costs paid as a percentage of a $10,000 investment |
| SA JPMorgan Diversified Balanced Portfolio (Class 2)* | $44 | 0.86%** |
| * |
The expenses shown in the table are meant to highlight your ongoing costs only and do not reflect any fees and expenses that may be charged by the variable annuity contracts and variable life insurance policies that invest in the Portfolio.
|
| ** |
Annualized
|
Key Fund Statistics
The following table outlines key fund statistics.
| Net assets | $429M |
| Total number of portfolio holdings | 1,614 |
| Total net advisory fee paid | $1.2M |
| Portfolio turnover rate during the reporting period | 31% |
Graphical Representation of Holdings
The information below represents the composition of the Portfolio's net assets as of the end of the period.
Top Industries*
| Banks | 10.3% |
| U.S. Government & Agency Obligations | 8.3% |
| Internet | 6.7% |
| Semiconductors | 6.4% |
| Software | 5.6% |
| Unaffiliated Investment Companies | 4.3% |
| Other Asset Backed Securities | 3.6% |
| Diversified Financial Services | 3.5% |
| Electric | 3.3% |
| Pharmaceuticals | 3.2% |
| Retail | 3.2% |
| Short-Term Investments | 2.5% |
| Collateralized Mortgage Obligations | 2.5% |
| Computers | 2.4% |
| Insurance | 2.2% |
Portfolio Composition
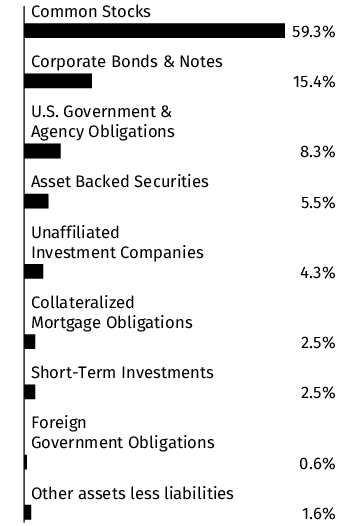
* Percentages exclude derivatives (other than purchased options), if any.
Changes in and Disagreements with Accountants
There were no disagreements with the accountants during the period.
Fund Expenses
What were the Portfolio costs for the last six months ?
(Based on a hypothetical $10,000 investment)
| Portfolio (Class) | Costs of a $10,000 investment | Costs paid as a percentage of a $10,000 investment |
| SA PIMCO RAE International Value Portfolio (Class 3)* | $58 | 1.09%** |
| * |
The expenses shown in the table are meant to highlight your ongoing costs only and do not reflect any fees and expenses that may be charged by the variable annuity contracts and variable life insurance policies that invest in the Portfolio.
|
| ** |
Annualized
|
Key Fund Statistics
The following table outlines key fund statistics.
| Net assets | $428M |
| Total number of portfolio holdings | 261 |
| Total net advisory fee paid | $1.6M |
| Portfolio turnover rate during the reporting period | 26% |
Graphical Representation of Holdings
The information below represents the composition of the Portfolio's net assets as of the end of the period.
Top Industries*
| Telecommunications | 11.8% |
| Pharmaceuticals | 10.8% |
| Insurance | 7.7% |
| Chemicals | 6.7% |
| Food | 6.4% |
| Agriculture | 6.1% |
| Transportation | 6.0% |
| Auto Manufacturers | 3.6% |
| Iron/Steel | 3.6% |
| Mining | 3.4% |
| Retail | 3.2% |
| Auto Parts & Equipment | 2.9% |
| Electric | 2.6% |
| Commercial Services | 2.4% |
| Banks | 2.3% |
Portfolio Composition

Country

* Percentages exclude derivatives (other than purchased options), if any.
Changes in and Disagreements with Accountants
There were no disagreements with the accountants during the period.
Fund Expenses
What were the Portfolio costs for the last six months ?
(Based on a hypothetical $10,000 investment)
| Portfolio (Class) | Costs of a $10,000 investment | Costs paid as a percentage of a $10,000 investment |
| SA Global Index Allocation 90/10 Portfolio (Class 1)* | $7 | 0.13%** |
| * |
The expenses shown in the table are meant to highlight your ongoing costs only and do not reflect any fees and expenses that may be charged by the variable annuity contracts and variable life insurance policies that invest in the Portfolio.
|
| ** |
Annualized
|
Key Fund Statistics
The following table outlines key fund statistics.
| Net assets | $397M |
| Total number of portfolio holdings | 7 |
| Total net advisory fee paid | $0.2M |
| Portfolio turnover rate during the reporting period | 5% |
Graphical Representation of Holdings
The information below represents the composition of the Portfolio's net assets as of the end of the period.
Portfolio Composition

Changes in and Disagreements with Accountants
There were no disagreements with the accountants during the period.
Fund Expenses
What were the Portfolio costs for the last six months ?
(Based on a hypothetical $10,000 investment)
| Portfolio (Class) | Costs of a $10,000 investment | Costs paid as a percentage of a $10,000 investment |
| SA Global Index Allocation 90/10 Portfolio (Class 3)* | $19 | 0.38%** |
| * |
The expenses shown in the table are meant to highlight your ongoing costs only and do not reflect any fees and expenses that may be charged by the variable annuity contracts and variable life insurance policies that invest in the Portfolio.
|
| ** |
Annualized
|
Key Fund Statistics
The following table outlines key fund statistics.
| Net assets | $397M |
| Total number of portfolio holdings | 7 |
| Total net advisory fee paid | $0.2M |
| Portfolio turnover rate during the reporting period | 5% |
Graphical Representation of Holdings
The information below represents the composition of the Portfolio's net assets as of the end of the period.
Portfolio Composition
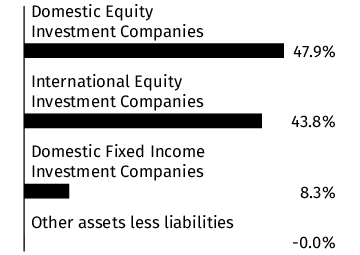
Changes in and Disagreements with Accountants
There were no disagreements with the accountants during the period.
Fund Expenses
What were the Portfolio costs for the last six months ?
(Based on a hypothetical $10,000 investment)
| Portfolio (Class) | Costs of a $10,000 investment | Costs paid as a percentage of a $10,000 investment |
| SA BlackRock Multi-Factor 70/30 Portfolio (Class 3)* | $30 | 0.60%** |
| * |
The expenses shown in the table are meant to highlight your ongoing costs only and do not reflect any fees and expenses that may be charged by the variable annuity contracts and variable life insurance policies that invest in the Portfolio.
|
| ** |
Annualized
|
Key Fund Statistics
The following table outlines key fund statistics.
| Net assets | $115M |
| Total number of portfolio holdings | 14 |
| Total net advisory fee paid | $0.1M |
| Portfolio turnover rate during the reporting period | 57% |
Graphical Representation of Holdings
The information below represents the composition of the Portfolio's net assets as of the end of the period.
Portfolio Composition
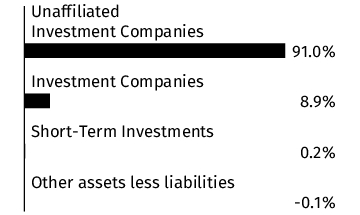
Changes in and Disagreements with Accountants
There were no disagreements with the accountants during the period.
Fund Expenses
What were the Portfolio costs for the last six months ?
(Based on a hypothetical $10,000 investment)
| Portfolio (Class) | Costs of a $10,000 investment | Costs paid as a percentage of a $10,000 investment |
| SA BlackRock Multi-Factor 70/30 Portfolio (Class 1)* | $18 | 0.35%** |
| * |
The expenses shown in the table are meant to highlight your ongoing costs only and do not reflect any fees and expenses that may be charged by the variable annuity contracts and variable life insurance policies that invest in the Portfolio.
|
| ** |
Annualized
|
Key Fund Statistics
The following table outlines key fund statistics.
| Net assets | $115M |
| Total number of portfolio holdings | 14 |
| Total net advisory fee paid | $0.1M |
| Portfolio turnover rate during the reporting period | 57% |
Graphical Representation of Holdings
The information below represents the composition of the Portfolio's net assets as of the end of the period.
Portfolio Composition

Changes in and Disagreements with Accountants
There were no disagreements with the accountants during the period.
Fund Expenses
What were the Portfolio costs for the last six months ?
(Based on a hypothetical $10,000 investment)
| Portfolio (Class) | Costs of a $10,000 investment | Costs paid as a percentage of a $10,000 investment |
| SA MFS Total Return Portfolio (Class 1)* | $36 | 0.71%** |
| * |
The expenses shown in the table are meant to highlight your ongoing costs only and do not reflect any fees and expenses that may be charged by the variable annuity contracts and variable life insurance policies that invest in the Portfolio.
|
| ** |
Annualized
|
Key Fund Statistics
The following table outlines key fund statistics.
| Net assets | $481M |
| Total number of portfolio holdings | 805 |
| Total net advisory fee paid | $1.5M |
| Portfolio turnover rate during the reporting period | 14% |
Graphical Representation of Holdings
The information below represents the composition of the Portfolio's net assets as of the end of the period.
Top Industries*
| U.S. Government & Agency Obligations | 20.4% |
| Banks | 10.4% |
| Pharmaceuticals | 6.2% |
| Insurance | 5.0% |
| Oil & Gas | 4.8% |
| Collateralized Mortgage Obligations | 4.7% |
| Diversified Financial Services | 4.4% |
| Electric | 4.3% |
| Software | 3.5% |
| Building Materials | 2.7% |
| Healthcare-Products | 2.4% |
| Healthcare-Services | 2.4% |
| Agriculture | 2.1% |
| Aerospace/Defense | 2.0% |
| Media | 2.0% |
Portfolio Composition
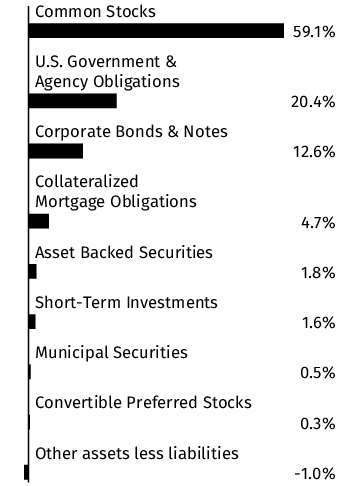
* Percentages exclude derivatives (other than purchased options), if any.
Changes in and Disagreements with Accountants
There were no disagreements with the accountants during the period.
Fund Expenses
What were the Portfolio costs for the last six months ?
(Based on a hypothetical $10,000 investment)
| Portfolio (Class) | Costs of a $10,000 investment | Costs paid as a percentage of a $10,000 investment |
| SA MFS Total Return Portfolio (Class 2)* | $43 | 0.86%** |
| * |
The expenses shown in the table are meant to highlight your ongoing costs only and do not reflect any fees and expenses that may be charged by the variable annuity contracts and variable life insurance policies that invest in the Portfolio.
|
| ** |
Annualized
|
Key Fund Statistics
The following table outlines key fund statistics.
| Net assets | $481M |
| Total number of portfolio holdings | 805 |
| Total net advisory fee paid | $1.5M |
| Portfolio turnover rate during the reporting period | 14% |
Graphical Representation of Holdings
The information below represents the composition of the Portfolio's net assets as of the end of the period.
Top Industries*
| U.S. Government & Agency Obligations | 20.4% |
| Banks | 10.4% |
| Pharmaceuticals | 6.2% |
| Insurance | 5.0% |
| Oil & Gas | 4.8% |
| Collateralized Mortgage Obligations | 4.7% |
| Diversified Financial Services | 4.4% |
| Electric | 4.3% |
| Software | 3.5% |
| Building Materials | 2.7% |
| Healthcare-Products | 2.4% |
| Healthcare-Services | 2.4% |
| Agriculture | 2.1% |
| Aerospace/Defense | 2.0% |
| Media | 2.0% |
Portfolio Composition

* Percentages exclude derivatives (other than purchased options), if any.
Changes in and Disagreements with Accountants
There were no disagreements with the accountants during the period.
Fund Expenses
What were the Portfolio costs for the last six months ?
(Based on a hypothetical $10,000 investment)
| Portfolio (Class) | Costs of a $10,000 investment | Costs paid as a percentage of a $10,000 investment |
| SA MFS Total Return Portfolio (Class 3)* | $48 | 0.96%** |
| * |
The expenses shown in the table are meant to highlight your ongoing costs only and do not reflect any fees and expenses that may be charged by the variable annuity contracts and variable life insurance policies that invest in the Portfolio.
|
| ** |
Annualized
|
Key Fund Statistics
The following table outlines key fund statistics.
| Net assets | $481M |
| Total number of portfolio holdings | 805 |
| Total net advisory fee paid | $1.5M |
| Portfolio turnover rate during the reporting period | 14% |
Graphical Representation of Holdings
The information below represents the composition of the Portfolio's net assets as of the end of the period.
Top Industries*
| U.S. Government & Agency Obligations | 20.4% |
| Banks | 10.4% |
| Pharmaceuticals | 6.2% |
| Insurance | 5.0% |
| Oil & Gas | 4.8% |
| Collateralized Mortgage Obligations | 4.7% |
| Diversified Financial Services | 4.4% |
| Electric | 4.3% |
| Software | 3.5% |
| Building Materials | 2.7% |
| Healthcare-Products | 2.4% |
| Healthcare-Services | 2.4% |
| Agriculture | 2.1% |
| Aerospace/Defense | 2.0% |
| Media | 2.0% |
Portfolio Composition

* Percentages exclude derivatives (other than purchased options), if any.
Changes in and Disagreements with Accountants
There were no disagreements with the accountants during the period.
Fund Expenses
What were the Portfolio costs for the last six months ?
(Based on a hypothetical $10,000 investment)
| Portfolio (Class) | Costs of a $10,000 investment | Costs paid as a percentage of a $10,000 investment |
| SA Schroders VCP Global Allocation Portfolio (Class 1)* | $45 | 0.90%** |
| * |
The expenses shown in the table are meant to highlight your ongoing costs only and do not reflect any fees and expenses that may be charged by the variable annuity contracts and variable life insurance policies that invest in the Portfolio.
|
| ** |
Annualized
|
Key Fund Statistics
The following table outlines key fund statistics.
| Net assets | $418M |
| Total number of portfolio holdings | 964 |
| Total net advisory fee paid | $1.7M |
| Portfolio turnover rate during the reporting period | 23% |
Graphical Representation of Holdings
The information below represents the composition of the Portfolio as of the end of the period.
Top Industries*
(% of net assets)
(% of net assets)
| Banks | 17.1% |
| Internet | 6.5% |
| Semiconductors | 6.5% |
| Insurance | 5.8% |
| Software | 5.7% |
| Pharmaceuticals | 5.0% |
| Diversified Financial Services | 4.0% |
| REITS | 3.5% |
| Electric | 3.2% |
| Short-Term Investments | 2.9% |
| Oil & Gas | 2.8% |
| Telecommunications | 2.6% |
| Retail | 2.4% |
| Computers | 2.4% |
| Auto Manufacturers | 2.2% |
Country
(% of net assets)
(% of net assets)

Credit Quality **
(% of total debt issues)
(% of total debt issues)

* Percentages exclude derivatives (other than purchased options), if any.
** Credit quality ratings shown above reflect the rating assigned by Moody's Investors Service, Inc. Where Moody's ratings are not available, we have used Standard & Poor's ratings. Unrated investments do not necessarily indicate low credit quality. Credit quality ratings are subject to change. Percentages exclude short-term securities.
Changes in and Disagreements with Accountants
There were no disagreements with the accountants during the period.
Fund Expenses
What were the Portfolio costs for the last six months ?
(Based on a hypothetical $10,000 investment)
| Portfolio (Class) | Costs of a $10,000 investment | Costs paid as a percentage of a $10,000 investment |
| SA Schroders VCP Global Allocation Portfolio (Class 3)* | $58 | 1.15%** |
| * |
The expenses shown in the table are meant to highlight your ongoing costs only and do not reflect any fees and expenses that may be charged by the variable annuity contracts and variable life insurance policies that invest in the Portfolio.
|
| ** |
Annualized
|
Key Fund Statistics
The following table outlines key fund statistics.
| Net assets | $418M |
| Total number of portfolio holdings | 964 |
| Total net advisory fee paid | $1.7M |
| Portfolio turnover rate during the reporting period | 23% |
Graphical Representation of Holdings
The information below represents the composition of the Portfolio as of the end of the period.
Top Industries*
(% of net assets)
(% of net assets)
| Banks | 17.1% |
| Internet | 6.5% |
| Semiconductors | 6.5% |
| Insurance | 5.8% |
| Software | 5.7% |
| Pharmaceuticals | 5.0% |
| Diversified Financial Services | 4.0% |
| REITS | 3.5% |
| Electric | 3.2% |
| Short-Term Investments | 2.9% |
| Oil & Gas | 2.8% |
| Telecommunications | 2.6% |
| Retail | 2.4% |
| Computers | 2.4% |
| Auto Manufacturers | 2.2% |
Country
(% of net assets)
(% of net assets)
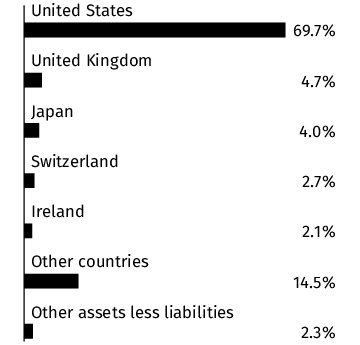
Credit Quality **
(% of total debt issues)
(% of total debt issues)
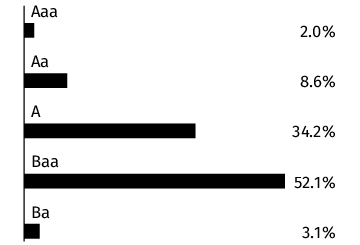
* Percentages exclude derivatives (other than purchased options), if any.
** Credit quality ratings shown above reflect the rating assigned by Moody's Investors Service, Inc. Where Moody's ratings are not available, we have used Standard & Poor's ratings. Unrated investments do not necessarily indicate low credit quality. Credit quality ratings are subject to change. Percentages exclude short-term securities.
Changes in and Disagreements with Accountants
There were no disagreements with the accountants during the period.
This report describes changes to the Portfolio that occurred during the reporting period.
Fund Expenses
What were the Portfolio costs for the last six months ?
(Based on a hypothetical $10,000 investment)
| Portfolio (Class) | Costs of a $10,000 investment | Costs paid as a percentage of a $10,000 investment |
| SA Small Cap Index Portfolio (Class 3)* | $32 | 0.66%** |
| * |
The expenses shown in the table are meant to highlight your ongoing costs only and do not reflect any fees and expenses that may be charged by the variable annuity contracts and variable life insurance policies that invest in the Portfolio.
|
| ** |
Annualized
|
Key Fund Statistics
The following table outlines key fund statistics.
| Net assets | $294M |
| Total number of portfolio holdings | 2,006 |
| Total net advisory fee paid | $0.4M |
| Portfolio turnover rate during the reporting period | 21% |
Graphical Representation of Holdings
The information below represents the composition of the Portfolio's net assets as of the end of the period.
Top Industries*
| Banks | 9.4% |
| Biotechnology | 6.3% |
| REITS | 6.3% |
| Software | 5.5% |
| Commercial Services | 4.5% |
| Retail | 3.9% |
| Healthcare-Products | 3.3% |
| Diversified Financial Services | 3.1% |
| Electronics | 2.9% |
| Pharmaceuticals | 2.6% |
| Engineering & Construction | 2.5% |
| Telecommunications | 2.5% |
| Oil & Gas | 2.3% |
| Insurance | 2.1% |
| Healthcare-Services | 2.1% |
Portfolio Composition

* Percentages exclude derivatives (other than purchased options), if any.
Changes in and Disagreements with Accountants
There were no disagreements with the accountants during the period.
Fund Expenses
What were the Portfolio costs for the last six months ?
(Based on a hypothetical $10,000 investment)
| Portfolio (Class) | Costs of a $10,000 investment | Costs paid as a percentage of a $10,000 investment |
| SA JPMorgan Mid-Cap Growth Portfolio (Class 2)* | $46 | 0.92%** |
| * |
The expenses shown in the table are meant to highlight your ongoing costs only and do not reflect any fees and expenses that may be charged by the variable annuity contracts and variable life insurance policies that invest in the Portfolio.
|
| ** |
Annualized
|
Key Fund Statistics
The following table outlines key fund statistics.
| Net assets | $715M |
| Total number of portfolio holdings | 107 |
| Total net advisory fee paid | $2.4M |
| Portfolio turnover rate during the reporting period | 44% |
Graphical Representation of Holdings
The information below represents the composition of the Portfolio's net assets as of the end of the period.
Top Industries*
| Software | 17.2% |
| Diversified Financial Services | 8.3% |
| Retail | 7.3% |
| Aerospace/Defense | 5.3% |
| Internet | 5.2% |
| Biotechnology | 4.8% |
| Leisure Time | 4.1% |
| Pharmaceuticals | 3.9% |
| Miscellaneous Manufacturing | 3.9% |
| Electric | 3.3% |
| Healthcare-Products | 3.1% |
| Lodging | 2.9% |
| Computers | 2.9% |
| Commercial Services | 2.8% |
| Entertainment | 2.6% |
Portfolio Composition

* Percentages exclude derivatives (other than purchased options), if any.
Changes in and Disagreements with Accountants
There were no disagreements with the accountants during the period.
Fund Expenses
What were the Portfolio costs for the last six months ?
(Based on a hypothetical $10,000 investment)
| Portfolio (Class) | Costs of a $10,000 investment | Costs paid as a percentage of a $10,000 investment |
| SA JPMorgan Mid-Cap Growth Portfolio (Class 3)* | $51 | 1.02%** |
| * |
The expenses shown in the table are meant to highlight your ongoing costs only and do not reflect any fees and expenses that may be charged by the variable annuity contracts and variable life insurance policies that invest in the Portfolio.
|
| ** |
Annualized
|
Key Fund Statistics
The following table outlines key fund statistics.
| Net assets | $715M |
| Total number of portfolio holdings | 107 |
| Total net advisory fee paid | $2.4M |
| Portfolio turnover rate during the reporting period | 44% |
Graphical Representation of Holdings
The information below represents the composition of the Portfolio's net assets as of the end of the period.
Top Industries*
| Software | 17.2% |
| Diversified Financial Services | 8.3% |
| Retail | 7.3% |
| Aerospace/Defense | 5.3% |
| Internet | 5.2% |
| Biotechnology | 4.8% |
| Leisure Time | 4.1% |
| Pharmaceuticals | 3.9% |
| Miscellaneous Manufacturing | 3.9% |
| Electric | 3.3% |
| Healthcare-Products | 3.1% |
| Lodging | 2.9% |
| Computers | 2.9% |
| Commercial Services | 2.8% |
| Entertainment | 2.6% |
Portfolio Composition
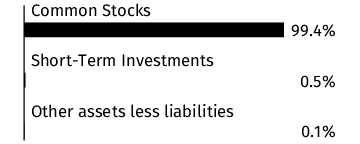
* Percentages exclude derivatives (other than purchased options), if any.
Changes in and Disagreements with Accountants
There were no disagreements with the accountants during the period.
Fund Expenses
What were the Portfolio costs for the last six months ?
(Based on a hypothetical $10,000 investment)
| Portfolio (Class) | Costs of a $10,000 investment | Costs paid as a percentage of a $10,000 investment |
| SA Index Allocation 80/20 Portfolio (Class 3)* | $19 | 0.37%** |
| * |
The expenses shown in the table are meant to highlight your ongoing costs only and do not reflect any fees and expenses that may be charged by the variable annuity contracts and variable life insurance policies that invest in the Portfolio.
|
| ** |
Annualized
|
Key Fund Statistics
The following table outlines key fund statistics.
| Net assets | $529M |
| Total number of portfolio holdings | 6 |
| Total net advisory fee paid | $0.3M |
| Portfolio turnover rate during the reporting period | 2% |
Graphical Representation of Holdings
The information below represents the composition of the Portfolio's net assets as of the end of the period.
Portfolio Composition

Changes in and Disagreements with Accountants
There were no disagreements with the accountants during the period.
Fund Expenses
What were the Portfolio costs for the last six months ?
(Based on a hypothetical $10,000 investment)
| Portfolio (Class) | Costs of a $10,000 investment | Costs paid as a percentage of a $10,000 investment |
| SA Index Allocation 80/20 Portfolio (Class 1)* | $6 | 0.12%** |
| * |
The expenses shown in the table are meant to highlight your ongoing costs only and do not reflect any fees and expenses that may be charged by the variable annuity contracts and variable life insurance policies that invest in the Portfolio.
|
| ** |
Annualized
|
Key Fund Statistics
The following table outlines key fund statistics.
| Net assets | $529M |
| Total number of portfolio holdings | 6 |
| Total net advisory fee paid | $0.3M |
| Portfolio turnover rate during the reporting period | 2% |
Graphical Representation of Holdings
The information below represents the composition of the Portfolio's net assets as of the end of the period.
Portfolio Composition
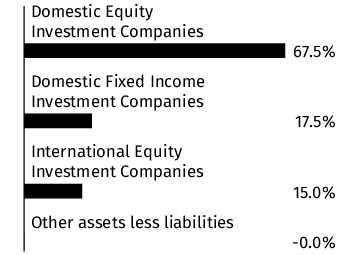
Changes in and Disagreements with Accountants
There were no disagreements with the accountants during the period.
Fund Expenses
What were the Portfolio costs for the last six months ?
(Based on a hypothetical $10,000 investment)
| Portfolio (Class) | Costs of a $10,000 investment | Costs paid as a percentage of a $10,000 investment |
| SA International Index Portfolio (Class 1)* | $25 | 0.47%** |
| * |
The expenses shown in the table are meant to highlight your ongoing costs only and do not reflect any fees and expenses that may be charged by the variable annuity contracts and variable life insurance policies that invest in the Portfolio.
|
| ** |
Annualized
|
Key Fund Statistics
The following table outlines key fund statistics.
| Net assets | $967M |
| Total number of portfolio holdings | 700 |
| Total net advisory fee paid | $1.8M |
| Portfolio turnover rate during the reporting period | 11% |
Graphical Representation of Holdings
The information below represents the composition of the Portfolio's net assets as of the end of the period.
Top Industries*
| Banks | 15.5% |
| Pharmaceuticals | 7.2% |
| Insurance | 6.4% |
| Aerospace/Defense | 3.5% |
| Oil & Gas | 3.3% |
| Telecommunications | 3.2% |
| Semiconductors | 3.2% |
| Food | 3.0% |
| Electric | 2.9% |
| Commercial Services | 2.7% |
| Auto Manufacturers | 2.6% |
| Software | 2.6% |
| Machinery-Construction & Mining | 2.2% |
| Chemicals | 2.2% |
| Mining | 2.1% |
Portfolio Composition

Country
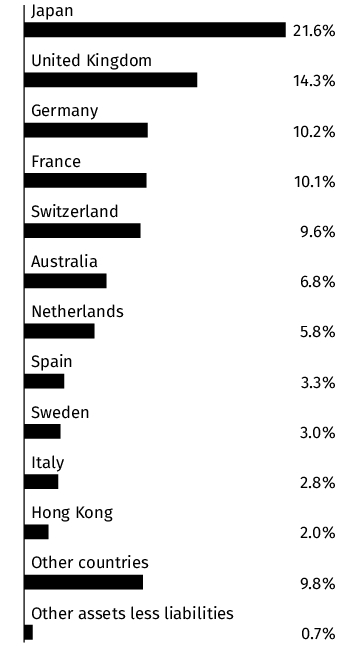
* Percentages exclude derivatives (other than purchased options), if any.
Changes in and Disagreements with Accountants
There were no disagreements with the accountants during the period.
Fund Expenses
What were the Portfolio costs for the last six months ?
(Based on a hypothetical $10,000 investment)
| Portfolio (Class) | Costs of a $10,000 investment | Costs paid as a percentage of a $10,000 investment |
| SA International Index Portfolio (Class 3)* | $38 | 0.72%** |
| * |
The expenses shown in the table are meant to highlight your ongoing costs only and do not reflect any fees and expenses that may be charged by the variable annuity contracts and variable life insurance policies that invest in the Portfolio.
|
| ** |
Annualized
|
Key Fund Statistics
The following table outlines key fund statistics.
| Net assets | $967M |
| Total number of portfolio holdings | 700 |
| Total net advisory fee paid | $1.8M |
| Portfolio turnover rate during the reporting period | 11% |
Graphical Representation of Holdings
The information below represents the composition of the Portfolio's net assets as of the end of the period.
Top Industries*
| Banks | 15.5% |
| Pharmaceuticals | 7.2% |
| Insurance | 6.4% |
| Aerospace/Defense | 3.5% |
| Oil & Gas | 3.3% |
| Telecommunications | 3.2% |
| Semiconductors | 3.2% |
| Food | 3.0% |
| Electric | 2.9% |
| Commercial Services | 2.7% |
| Auto Manufacturers | 2.6% |
| Software | 2.6% |
| Machinery-Construction & Mining | 2.2% |
| Chemicals | 2.2% |
| Mining | 2.1% |
Portfolio Composition

Country

* Percentages exclude derivatives (other than purchased options), if any.
Changes in and Disagreements with Accountants
There were no disagreements with the accountants during the period.
Fund Expenses
What were the Portfolio costs for the last six months ?
(Based on a hypothetical $10,000 investment)
| Portfolio (Class) | Costs of a $10,000 investment | Costs paid as a percentage of a $10,000 investment |
| SA Index Allocation 60/40 Portfolio (Class 3)* | $20 | 0.39%** |
| * |
The expenses shown in the table are meant to highlight your ongoing costs only and do not reflect any fees and expenses that may be charged by the variable annuity contracts and variable life insurance policies that invest in the Portfolio.
|
| ** |
Annualized
|
Key Fund Statistics
The following table outlines key fund statistics.
| Net assets | $273M |
| Total number of portfolio holdings | 6 |
| Total net advisory fee paid | $0.1M |
| Portfolio turnover rate during the reporting period | 4% |
Graphical Representation of Holdings
The information below represents the composition of the Portfolio's net assets as of the end of the period.
Portfolio Composition

Changes in and Disagreements with Accountants
There were no disagreements with the accountants during the period.
Fund Expenses
What were the Portfolio costs for the last six months ?
(Based on a hypothetical $10,000 investment)
| Portfolio (Class) | Costs of a $10,000 investment | Costs paid as a percentage of a $10,000 investment |
| SA Index Allocation 60/40 Portfolio (Class 1)* | $7 | 0.14%** |
| * |
The expenses shown in the table are meant to highlight your ongoing costs only and do not reflect any fees and expenses that may be charged by the variable annuity contracts and variable life insurance policies that invest in the Portfolio.
|
| ** |
Annualized
|
Key Fund Statistics
The following table outlines key fund statistics.
| Net assets | $273M |
| Total number of portfolio holdings | 6 |
| Total net advisory fee paid | $0.1M |
| Portfolio turnover rate during the reporting period | 4% |
Graphical Representation of Holdings
The information below represents the composition of the Portfolio's net assets as of the end of the period.
Portfolio Composition
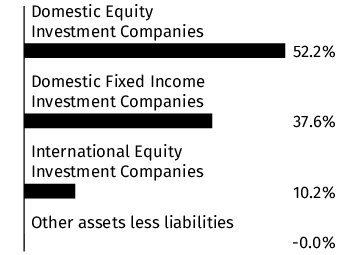
Changes in and Disagreements with Accountants
There were no disagreements with the accountants during the period.
Fund Expenses
What were the Portfolio costs for the last six months ?
(Based on a hypothetical $10,000 investment)
| Portfolio (Class) | Costs of a $10,000 investment | Costs paid as a percentage of a $10,000 investment |
| SA Franklin Tactical Opportunities Portfolio (Class 1)* | $41 | 0.81%** |
| * |
The expenses shown in the table are meant to highlight your ongoing costs only and do not reflect any fees and expenses that may be charged by the variable annuity contracts and variable life insurance policies that invest in the Portfolio.
|
| ** |
Annualized
|
Key Fund Statistics
The following table outlines key fund statistics.
| Net assets | $105M |
| Total number of portfolio holdings | 1,079 |
| Total net advisory fee paid | $0.4M |
| Portfolio turnover rate during the reporting period | 51% |
Graphical Representation of Holdings
The information below represents the composition of the Portfolio's net assets as of the end of the period.
Top Industries*
| U.S. Government & Agency Obligations | 17.8% |
| Internet | 7.6% |
| Semiconductors | 6.5% |
| Banks | 6.3% |
| Software | 5.9% |
| Unaffiliated Investment Companies | 5.3% |
| Pharmaceuticals | 4.0% |
| Collateralized Mortgage Obligations | 3.4% |
| Short-Term Investments | 3.3% |
| Insurance | 3.2% |
| Retail | 3.0% |
| Telecommunications | 2.7% |
| Diversified Financial Services | 2.6% |
| Computers | 2.4% |
| Aerospace/Defense | 1.9% |
Portfolio Composition
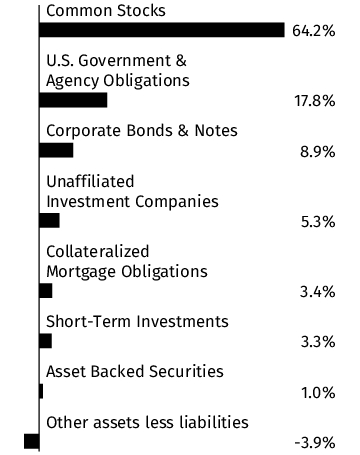
* Percentages exclude derivatives (other than purchased options), if any.
Changes in and Disagreements with Accountants
There were no disagreements with the accountants during the period.
Fund Expenses
What were the Portfolio costs for the last six months ?
(Based on a hypothetical $10,000 investment)
| Portfolio (Class) | Costs of a $10,000 investment | Costs paid as a percentage of a $10,000 investment |
| SA Franklin Tactical Opportunities Portfolio (Class 3)* | $54 | 1.06%** |
| * |
The expenses shown in the table are meant to highlight your ongoing costs only and do not reflect any fees and expenses that may be charged by the variable annuity contracts and variable life insurance policies that invest in the Portfolio.
|
| ** |
Annualized
|
Key Fund Statistics
The following table outlines key fund statistics.
| Net assets | $105M |
| Total number of portfolio holdings | 1,079 |
| Total net advisory fee paid | $0.4M |
| Portfolio turnover rate during the reporting period | 51% |
Graphical Representation of Holdings
The information below represents the composition of the Portfolio's net assets as of the end of the period.
Top Industries*
| U.S. Government & Agency Obligations | 17.8% |
| Internet | 7.6% |
| Semiconductors | 6.5% |
| Banks | 6.3% |
| Software | 5.9% |
| Unaffiliated Investment Companies | 5.3% |
| Pharmaceuticals | 4.0% |
| Collateralized Mortgage Obligations | 3.4% |
| Short-Term Investments | 3.3% |
| Insurance | 3.2% |
| Retail | 3.0% |
| Telecommunications | 2.7% |
| Diversified Financial Services | 2.6% |
| Computers | 2.4% |
| Aerospace/Defense | 1.9% |
Portfolio Composition

* Percentages exclude derivatives (other than purchased options), if any.
Changes in and Disagreements with Accountants
There were no disagreements with the accountants during the period.
Fund Expenses
What were the Portfolio costs for the last six months ?
(Based on a hypothetical $10,000 investment)
| Portfolio (Class) | Costs of a $10,000 investment | Costs paid as a percentage of a $10,000 investment |
| SA VCP Index Allocation Portfolio (Class 3)* | $26 | 0.52%** |
| * |
The expenses shown in the table are meant to highlight your ongoing costs only and do not reflect any fees and expenses that may be charged by the variable annuity contracts and variable life insurance policies that invest in the Portfolio.
|
| ** |
Annualized
|
Key Fund Statistics
The following table outlines key fund statistics.
| Net assets | $553M |
| Total number of portfolio holdings | 19 |
| Total net advisory fee paid | $0.5M |
| Portfolio turnover rate during the reporting period | 6% |
Graphical Representation of Holdings
The information below represents the composition of the Portfolio's net assets as of the end of the period.
Portfolio Composition

Changes in and Disagreements with Accountants
There were no disagreements with the accountants during the period.
Fund Expenses
What were the Portfolio costs for the last six months ?
(Based on a hypothetical $10,000 investment)
| Portfolio (Class) | Costs of a $10,000 investment | Costs paid as a percentage of a $10,000 investment |
| SA VCP Index Allocation Portfolio (Class 1)* | $13 | 0.26%** |
| * |
The expenses shown in the table are meant to highlight your ongoing costs only and do not reflect any fees and expenses that may be charged by the variable annuity contracts and variable life insurance policies that invest in the Portfolio.
|
| ** |
Annualized
|
Key Fund Statistics
The following table outlines key fund statistics.
| Net assets | $553M |
| Total number of portfolio holdings | 19 |
| Total net advisory fee paid | $0.5M |
| Portfolio turnover rate during the reporting period | 6% |
Graphical Representation of Holdings
The information below represents the composition of the Portfolio's net assets as of the end of the period.
Portfolio Composition
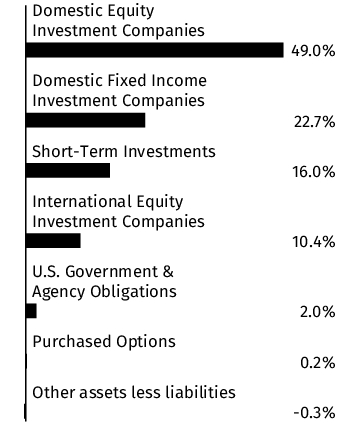
Changes in and Disagreements with Accountants
There were no disagreements with the accountants during the period.
Fund Expenses
What were the Portfolio costs for the last six months ?
(Based on a hypothetical $10,000 investment)
| Portfolio (Class) | Costs of a $10,000 investment | Costs paid as a percentage of a $10,000 investment |
| SA MFS Large Cap Growth Portfolio (Class 3)* | $48 | 0.93%** |
| * |
The expenses shown in the table are meant to highlight your ongoing costs only and do not reflect any fees and expenses that may be charged by the variable annuity contracts and variable life insurance policies that invest in the Portfolio.
|
| ** |
Annualized
|
Key Fund Statistics
The following table outlines key fund statistics.
| Net assets | $858M |
| Total number of portfolio holdings | 88 |
| Total net advisory fee paid | $2.3M |
| Portfolio turnover rate during the reporting period | 36% |
Graphical Representation of Holdings
The information below represents the composition of the Portfolio's net assets as of the end of the period.
Top Industries*
| Software | 22.6% |
| Semiconductors | 20.0% |
| Internet | 19.3% |
| Computers | 10.5% |
| Diversified Financial Services | 3.9% |
| Pharmaceuticals | 3.0% |
| Banks | 2.2% |
| Retail | 2.0% |
| Auto Manufacturers | 1.7% |
| Aerospace/Defense | 1.7% |
| Healthcare-Services | 1.4% |
| Telecommunications | 1.2% |
| Building Materials | 1.2% |
| Insurance | 1.2% |
| Apparel | 1.1% |
Portfolio Composition

* Percentages exclude derivatives (other than purchased options), if any.
Changes in and Disagreements with Accountants
There were no disagreements with the accountants during the period.
Fund Expenses
What were the Portfolio costs for the last six months ?
(Based on a hypothetical $10,000 investment)
| Portfolio (Class) | Costs of a $10,000 investment | Costs paid as a percentage of a $10,000 investment |
| SA MFS Large Cap Growth Portfolio (Class 1)* | $35 | 0.68%** |
| * |
The expenses shown in the table are meant to highlight your ongoing costs only and do not reflect any fees and expenses that may be charged by the variable annuity contracts and variable life insurance policies that invest in the Portfolio.
|
| ** |
Annualized
|
Key Fund Statistics
The following table outlines key fund statistics.
| Net assets | $858M |
| Total number of portfolio holdings | 88 |
| Total net advisory fee paid | $2.3M |
| Portfolio turnover rate during the reporting period | 36% |
Graphical Representation of Holdings
The information below represents the composition of the Portfolio's net assets as of the end of the period.
Top Industries*
| Software | 22.6% |
| Semiconductors | 20.0% |
| Internet | 19.3% |
| Computers | 10.5% |
| Diversified Financial Services | 3.9% |
| Pharmaceuticals | 3.0% |
| Banks | 2.2% |
| Retail | 2.0% |
| Auto Manufacturers | 1.7% |
| Aerospace/Defense | 1.7% |
| Healthcare-Services | 1.4% |
| Telecommunications | 1.2% |
| Building Materials | 1.2% |
| Insurance | 1.2% |
| Apparel | 1.1% |
Portfolio Composition
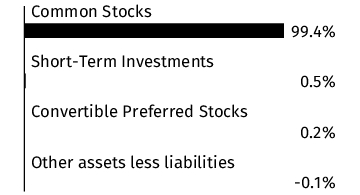
* Percentages exclude derivatives (other than purchased options), if any.
Changes in and Disagreements with Accountants
There were no disagreements with the accountants during the period.
Fund Expenses
What were the Portfolio costs for the last six months ?
(Based on a hypothetical $10,000 investment)
| Portfolio (Class) | Costs of a $10,000 investment | Costs paid as a percentage of a $10,000 investment |
| SA MFS Large Cap Growth Portfolio (Class 2)* | $42 | 0.83%** |
| * |
The expenses shown in the table are meant to highlight your ongoing costs only and do not reflect any fees and expenses that may be charged by the variable annuity contracts and variable life insurance policies that invest in the Portfolio.
|
| ** |
Annualized
|
Key Fund Statistics
The following table outlines key fund statistics.
| Net assets | $858M |
| Total number of portfolio holdings | 88 |
| Total net advisory fee paid | $2.3M |
| Portfolio turnover rate during the reporting period | 36% |
Graphical Representation of Holdings
The information below represents the composition of the Portfolio's net assets as of the end of the period.
Top Industries*
| Software | 22.6% |
| Semiconductors | 20.0% |
| Internet | 19.3% |
| Computers | 10.5% |
| Diversified Financial Services | 3.9% |
| Pharmaceuticals | 3.0% |
| Banks | 2.2% |
| Retail | 2.0% |
| Auto Manufacturers | 1.7% |
| Aerospace/Defense | 1.7% |
| Healthcare-Services | 1.4% |
| Telecommunications | 1.2% |
| Building Materials | 1.2% |
| Insurance | 1.2% |
| Apparel | 1.1% |
Portfolio Composition

* Percentages exclude derivatives (other than purchased options), if any.
Changes in and Disagreements with Accountants
There were no disagreements with the accountants during the period.
Fund Expenses
What were the Portfolio costs for the last six months ?
(Based on a hypothetical $10,000 investment)
| Portfolio (Class) | Costs of a $10,000 investment | Costs paid as a percentage of a $10,000 investment |
| SA Franklin Small Company Value Portfolio (Class 3)* | $59 | 1.20%** |
| * |
The expenses shown in the table are meant to highlight your ongoing costs only and do not reflect any fees and expenses that may be charged by the variable annuity contracts and variable life insurance policies that invest in the Portfolio.
|
| ** |
Annualized
|
Key Fund Statistics
The following table outlines key fund statistics.
| Net assets | $283M |
| Total number of portfolio holdings | 82 |
| Total net advisory fee paid | $1.2M |
| Portfolio turnover rate during the reporting period | 28% |
Graphical Representation of Holdings
The information below represents the composition of the Portfolio's net assets as of the end of the period.
Top Industries*
| Banks | 16.2% |
| Machinery-Diversified | 8.6% |
| Electronics | 8.0% |
| Insurance | 7.5% |
| Chemicals | 4.4% |
| Diversified Financial Services | 4.3% |
| Metal Fabricate/Hardware | 4.0% |
| Aerospace/Defense | 3.8% |
| Lodging | 3.4% |
| Healthcare-Products | 3.4% |
| Commercial Services | 2.9% |
| Software | 2.9% |
| Iron/Steel | 2.7% |
| Retail | 2.5% |
| REITS | 2.5% |
Portfolio Composition
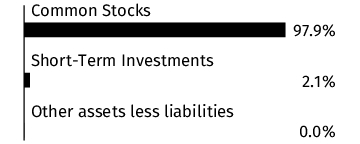
* Percentages exclude derivatives (other than purchased options), if any.
Changes in and Disagreements with Accountants
There were no disagreements with the accountants during the period.
This report describes changes to the Portfolio that occurred during the reporting period.
Fund Expenses
What were the Portfolio costs for the last six months ?
(Based on a hypothetical $10,000 investment)
| Portfolio (Class) | Costs of a $10,000 investment | Costs paid as a percentage of a $10,000 investment |
| SA T. Rowe Price VCP Balanced Portfolio (Class 3)* | $55 | 1.08%** |
| * |
The expenses shown in the table are meant to highlight your ongoing costs only and do not reflect any fees and expenses that may be charged by the variable annuity contracts and variable life insurance policies that invest in the Portfolio.
|
| ** |
Annualized
|
Key Fund Statistics
The following table outlines key fund statistics.
| Net assets | $1,379M |
| Total number of portfolio holdings | 1,599 |
| Total net advisory fee paid | $5.2M |
| Portfolio turnover rate during the reporting period | 20% |
Graphical Representation of Holdings
The information below represents the composition of the Portfolio's net assets as of the end of the period.
Top Industries*
| U.S. Government & Agency Obligations | 15.0% |
| Short-Term Investments | 12.0% |
| Semiconductors | 6.2% |
| Internet | 5.8% |
| Banks | 5.6% |
| Software | 4.8% |
| Insurance | 3.6% |
| Oil & Gas | 3.1% |
| Retail | 2.8% |
| REITS | 2.8% |
| Diversified Financial Services | 2.7% |
| Pharmaceuticals | 2.6% |
| Computers | 2.2% |
| Healthcare-Products | 1.9% |
| Electric | 1.7% |
Portfolio Composition
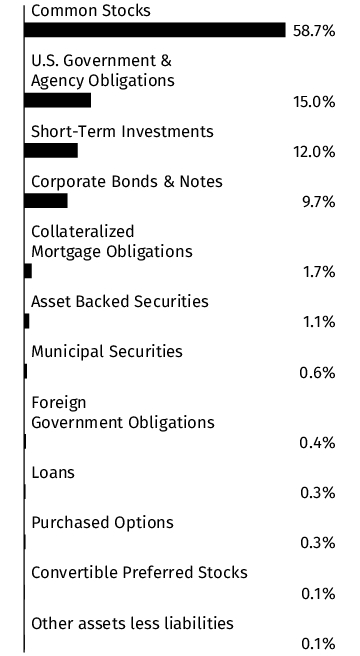
* Percentages exclude derivatives (other than purchased options), if any.
Changes in and Disagreements with Accountants
There were no disagreements with the accountants during the period.
This report describes changes to the Portfolio that occurred during the reporting period.
Fund Expenses
What were the Portfolio costs for the last six months ?
(Based on a hypothetical $10,000 investment)
| Portfolio (Class) | Costs of a $10,000 investment | Costs paid as a percentage of a $10,000 investment |
| SA Small Cap Index Portfolio (Class 1)* | $20 | 0.41%** |
| * |
The expenses shown in the table are meant to highlight your ongoing costs only and do not reflect any fees and expenses that may be charged by the variable annuity contracts and variable life insurance policies that invest in the Portfolio.
|
| ** |
Annualized
|
Key Fund Statistics
The following table outlines key fund statistics.
| Net assets | $294M |
| Total number of portfolio holdings | 2,006 |
| Total net advisory fee paid | $0.4M |
| Portfolio turnover rate during the reporting period | 21% |
Graphical Representation of Holdings
The information below represents the composition of the Portfolio's net assets as of the end of the period.
Top Industries*
| Banks | 9.4% |
| Biotechnology | 6.3% |
| REITS | 6.3% |
| Software | 5.5% |
| Commercial Services | 4.5% |
| Retail | 3.9% |
| Healthcare-Products | 3.3% |
| Diversified Financial Services | 3.1% |
| Electronics | 2.9% |
| Pharmaceuticals | 2.6% |
| Engineering & Construction | 2.5% |
| Telecommunications | 2.5% |
| Oil & Gas | 2.3% |
| Insurance | 2.1% |
| Healthcare-Services | 2.1% |
Portfolio Composition

* Percentages exclude derivatives (other than purchased options), if any.
Changes in and Disagreements with Accountants
There were no disagreements with the accountants during the period.
Fund Expenses
What were the Portfolio costs for the last six months ?
(Based on a hypothetical $10,000 investment)
| Portfolio (Class) | Costs of a $10,000 investment | Costs paid as a percentage of a $10,000 investment |
| SA Fixed Income Index Portfolio (Class 1)* | $17 | 0.34%** |
| * |
The expenses shown in the table are meant to highlight your ongoing costs only and do not reflect any fees and expenses that may be charged by the variable annuity contracts and variable life insurance policies that invest in the Portfolio.
|
| ** |
Annualized
|
Key Fund Statistics
The following table outlines key fund statistics.
| Net assets | $552M |
| Total number of portfolio holdings | 1,252 |
| Total net advisory fee paid | $0.8M |
| Portfolio turnover rate during the reporting period | 66% |
Graphical Representation of Holdings
The information below represents the composition of the Portfolio as of the end of the period.
Top Industries*
(% of net assets)
(% of net assets)
| U.S. Government & Agency Obligations | 53.6% |
| Banks | 7.7% |
| Unaffiliated Investment Companies | 6.9% |
| Electric | 2.7% |
| Foreign Government Obligations | 2.4% |
| Multi-National | 1.8% |
| Pharmaceuticals | 1.5% |
| Telecommunications | 1.5% |
| Diversified Financial Services | 1.4% |
| Healthcare-Services | 1.3% |
| REITS | 1.2% |
| Pipelines | 1.2% |
| Oil & Gas | 1.0% |
| Retail | 0.9% |
| Software | 0.9% |
Portfolio Composition
(% of net assets)
(% of net assets)
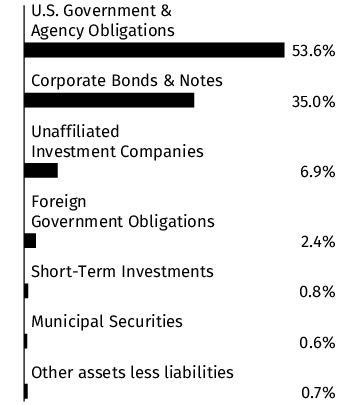
Credit Quality **
(% of total debt issues)
(% of total debt issues)

* Percentages exclude derivatives (other than purchased options), if any.
** Credit quality ratings shown above reflect the rating assigned by Moody's Investors Service, Inc. Where Moody's ratings are not available, we have used Standard & Poor's ratings. Unrated investments do not necessarily indicate low credit quality. Credit quality ratings are subject to change. Percentages exclude short-term securities.
Changes in and Disagreements with Accountants
There were no disagreements with the accountants during the period.
Fund Expenses
What were the Portfolio costs for the last six months ?
(Based on a hypothetical $10,000 investment)
| Portfolio (Class) | Costs of a $10,000 investment | Costs paid as a percentage of a $10,000 investment |
| SA Fixed Income Index Portfolio (Class 3)* | $30 | 0.59%** |
| * |
The expenses shown in the table are meant to highlight your ongoing costs only and do not reflect any fees and expenses that may be charged by the variable annuity contracts and variable life insurance policies that invest in the Portfolio.
|
| ** |
Annualized
|
Key Fund Statistics
The following table outlines key fund statistics.
| Net assets | $552M |
| Total number of portfolio holdings | 1,252 |
| Total net advisory fee paid | $0.8M |
| Portfolio turnover rate during the reporting period | 66% |
Graphical Representation of Holdings
The information below represents the composition of the Portfolio as of the end of the period.
Top Industries*
(% of net assets)
(% of net assets)
| U.S. Government & Agency Obligations | 53.6% |
| Banks | 7.7% |
| Unaffiliated Investment Companies | 6.9% |
| Electric | 2.7% |
| Foreign Government Obligations | 2.4% |
| Multi-National | 1.8% |
| Pharmaceuticals | 1.5% |
| Telecommunications | 1.5% |
| Diversified Financial Services | 1.4% |
| Healthcare-Services | 1.3% |
| REITS | 1.2% |
| Pipelines | 1.2% |
| Oil & Gas | 1.0% |
| Retail | 0.9% |
| Software | 0.9% |
Portfolio Composition
(% of net assets)
(% of net assets)

Credit Quality **
(% of total debt issues)
(% of total debt issues)
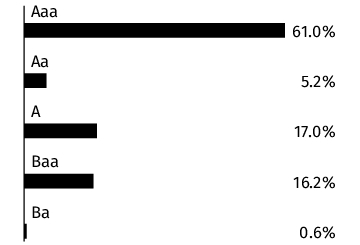
* Percentages exclude derivatives (other than purchased options), if any.
** Credit quality ratings shown above reflect the rating assigned by Moody's Investors Service, Inc. Where Moody's ratings are not available, we have used Standard & Poor's ratings. Unrated investments do not necessarily indicate low credit quality. Credit quality ratings are subject to change. Percentages exclude short-term securities.
Changes in and Disagreements with Accountants
There were no disagreements with the accountants during the period.
Fund Expenses
What were the Portfolio costs for the last six months ?
(Based on a hypothetical $10,000 investment)
| Portfolio (Class) | Costs of a $10,000 investment | Costs paid as a percentage of a $10,000 investment |
| SA Index Allocation 90/10 Portfolio (Class 1)* | $6 | 0.11%** |
| * |
The expenses shown in the table are meant to highlight your ongoing costs only and do not reflect any fees and expenses that may be charged by the variable annuity contracts and variable life insurance policies that invest in the Portfolio.
|
| ** |
Annualized
|
Key Fund Statistics
The following table outlines key fund statistics.
| Net assets | $1,489M |
| Total number of portfolio holdings | 6 |
| Total net advisory fee paid | $0.7M |
| Portfolio turnover rate during the reporting period | 2% |
Graphical Representation of Holdings
The information below represents the composition of the Portfolio's net assets as of the end of the period.
Portfolio Composition
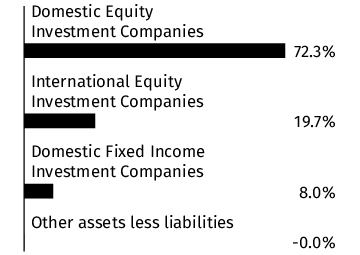
Changes in and Disagreements with Accountants
There were no disagreements with the accountants during the period.
Fund Expenses
What were the Portfolio costs for the last six months ?
(Based on a hypothetical $10,000 investment)
| Portfolio (Class) | Costs of a $10,000 investment | Costs paid as a percentage of a $10,000 investment |
| SA Index Allocation 90/10 Portfolio (Class 3)* | $18 | 0.36%** |
| * |
The expenses shown in the table are meant to highlight your ongoing costs only and do not reflect any fees and expenses that may be charged by the variable annuity contracts and variable life insurance policies that invest in the Portfolio.
|
| ** |
Annualized
|
Key Fund Statistics
The following table outlines key fund statistics.
| Net assets | $1,489M |
| Total number of portfolio holdings | 6 |
| Total net advisory fee paid | $0.7M |
| Portfolio turnover rate during the reporting period | 2% |
Graphical Representation of Holdings
The information below represents the composition of the Portfolio's net assets as of the end of the period.
Portfolio Composition

Changes in and Disagreements with Accountants
There were no disagreements with the accountants during the period.
Fund Expenses
What were the Portfolio costs for the last six months ?
(Based on a hypothetical $10,000 investment)
| Portfolio (Class) | Costs of a $10,000 investment | Costs paid as a percentage of a $10,000 investment |
| SA VCP Dynamic Strategy Portfolio (Class 3)* | $26 | 0.51%** |
| * |
The expenses shown in the table are meant to highlight your ongoing costs only and do not reflect any fees and expenses that may be charged by the variable annuity contracts and variable life insurance policies that invest in the Portfolio.
|
| ** |
Annualized
|
Key Fund Statistics
The following table outlines key fund statistics.
| Net assets | $4,882M |
| Total number of portfolio holdings | 67 |
| Total net advisory fee paid | $5.2M |
| Portfolio turnover rate during the reporting period | 5% |
Graphical Representation of Holdings
The information below represents the composition of the Portfolio's net assets as of the end of the period.
Portfolio Composition
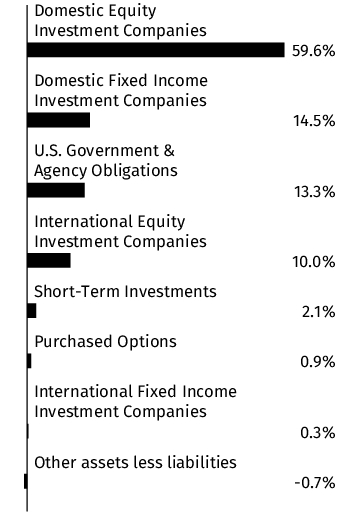
Changes in and Disagreements with Accountants
There were no disagreements with the accountants during the period.
Fund Expenses
What were the Portfolio costs for the last six months ?
(Based on a hypothetical $10,000 investment)
| Portfolio (Class) | Costs of a $10,000 investment | Costs paid as a percentage of a $10,000 investment |
| SA MFS Massachusetts Investors Trust Portfolio (Class 3)* | $48 | 0.95%** |
| * |
The expenses shown in the table are meant to highlight your ongoing costs only and do not reflect any fees and expenses that may be charged by the variable annuity contracts and variable life insurance policies that invest in the Portfolio.
|
| ** |
Annualized
|
Key Fund Statistics
The following table outlines key fund statistics.
| Net assets | $644M |
| Total number of portfolio holdings | 67 |
| Total net advisory fee paid | $2.1M |
| Portfolio turnover rate during the reporting period | 19% |
Graphical Representation of Holdings
The information below represents the composition of the Portfolio's net assets as of the end of the period.
Top Industries*
| Internet | 13.8% |
| Software | 12.6% |
| Semiconductors | 10.5% |
| Diversified Financial Services | 6.4% |
| Banks | 5.5% |
| Computers | 5.3% |
| Healthcare-Products | 5.2% |
| Electronics | 4.5% |
| Electrical Components & Equipment | 4.1% |
| Insurance | 4.0% |
| Electric | 3.2% |
| Cosmetics/Personal Care | 3.1% |
| Aerospace/Defense | 2.7% |
| Oil & Gas | 2.7% |
| Pharmaceuticals | 2.5% |
Portfolio Composition

* Percentages exclude derivatives (other than purchased options), if any.
Changes in and Disagreements with Accountants
There were no disagreements with the accountants during the period.
Fund Expenses
What were the Portfolio costs for the last six months ?
(Based on a hypothetical $10,000 investment)
| Portfolio (Class) | Costs of a $10,000 investment | Costs paid as a percentage of a $10,000 investment |
| SA VCP Dynamic Strategy Portfolio (Class 1)* | $13 | 0.26%** |
| * |
The expenses shown in the table are meant to highlight your ongoing costs only and do not reflect any fees and expenses that may be charged by the variable annuity contracts and variable life insurance policies that invest in the Portfolio.
|
| ** |
Annualized
|
Key Fund Statistics
The following table outlines key fund statistics.
| Net assets | $4,882M |
| Total number of portfolio holdings | 67 |
| Total net advisory fee paid | $5.2M |
| Portfolio turnover rate during the reporting period | 5% |
Graphical Representation of Holdings
The information below represents the composition of the Portfolio's net assets as of the end of the period.
Portfolio Composition

Changes in and Disagreements with Accountants
There were no disagreements with the accountants during the period.
Fund Expenses
What were the Portfolio costs for the last six months ?
(Based on a hypothetical $10,000 investment)
| Portfolio (Class) | Costs of a $10,000 investment | Costs paid as a percentage of a $10,000 investment |
| SA MFS Massachusetts Investors Trust Portfolio (Class 1)* | $35 | 0.70%** |
| * |
The expenses shown in the table are meant to highlight your ongoing costs only and do not reflect any fees and expenses that may be charged by the variable annuity contracts and variable life insurance policies that invest in the Portfolio.
|
| ** |
Annualized
|
Key Fund Statistics
The following table outlines key fund statistics.
| Net assets | $644M |
| Total number of portfolio holdings | 67 |
| Total net advisory fee paid | $2.1M |
| Portfolio turnover rate during the reporting period | 19% |
Graphical Representation of Holdings
The information below represents the composition of the Portfolio's net assets as of the end of the period.
Top Industries*
| Internet | 13.8% |
| Software | 12.6% |
| Semiconductors | 10.5% |
| Diversified Financial Services | 6.4% |
| Banks | 5.5% |
| Computers | 5.3% |
| Healthcare-Products | 5.2% |
| Electronics | 4.5% |
| Electrical Components & Equipment | 4.1% |
| Insurance | 4.0% |
| Electric | 3.2% |
| Cosmetics/Personal Care | 3.1% |
| Aerospace/Defense | 2.7% |
| Oil & Gas | 2.7% |
| Pharmaceuticals | 2.5% |
Portfolio Composition

* Percentages exclude derivatives (other than purchased options), if any.
Changes in and Disagreements with Accountants
There were no disagreements with the accountants during the period.
Fund Expenses
What were the Portfolio costs for the last six months ?
(Based on a hypothetical $10,000 investment)
| Portfolio (Class) | Costs of a $10,000 investment | Costs paid as a percentage of a $10,000 investment |
| SA MFS Massachusetts Investors Trust Portfolio (Class 2)* | $43 | 0.85%** |
| * |
The expenses shown in the table are meant to highlight your ongoing costs only and do not reflect any fees and expenses that may be charged by the variable annuity contracts and variable life insurance policies that invest in the Portfolio.
|
| ** |
Annualized
|
Key Fund Statistics
The following table outlines key fund statistics.
| Net assets | $644M |
| Total number of portfolio holdings | 67 |
| Total net advisory fee paid | $2.1M |
| Portfolio turnover rate during the reporting period | 19% |
Graphical Representation of Holdings
The information below represents the composition of the Portfolio's net assets as of the end of the period.
Top Industries*
| Internet | 13.8% |
| Software | 12.6% |
| Semiconductors | 10.5% |
| Diversified Financial Services | 6.4% |
| Banks | 5.5% |
| Computers | 5.3% |
| Healthcare-Products | 5.2% |
| Electronics | 4.5% |
| Electrical Components & Equipment | 4.1% |
| Insurance | 4.0% |
| Electric | 3.2% |
| Cosmetics/Personal Care | 3.1% |
| Aerospace/Defense | 2.7% |
| Oil & Gas | 2.7% |
| Pharmaceuticals | 2.5% |
Portfolio Composition

* Percentages exclude derivatives (other than purchased options), if any.
Changes in and Disagreements with Accountants
There were no disagreements with the accountants during the period.
Fund Expenses
What were the Portfolio costs for the last six months ?
(Based on a hypothetical $10,000 investment)
| Portfolio (Class) | Costs of a $10,000 investment | Costs paid as a percentage of a $10,000 investment |
| SA Franklin BW U.S. Large Cap Value Portfolio (Class 3)* | $47 | 0.95%** |
| * |
The expenses shown in the table are meant to highlight your ongoing costs only and do not reflect any fees and expenses that may be charged by the variable annuity contracts and variable life insurance policies that invest in the Portfolio.
|
| ** |
Annualized
|
Key Fund Statistics
The following table outlines key fund statistics.
| Net assets | $1,212M |
| Total number of portfolio holdings | 221 |
| Total net advisory fee paid | $3.9M |
| Portfolio turnover rate during the reporting period | 40% |
Graphical Representation of Holdings
The information below represents the composition of the Portfolio's net assets as of the end of the period.
Top Industries*
| Banks | 20.5% |
| Pharmaceuticals | 7.5% |
| Insurance | 7.5% |
| Telecommunications | 6.9% |
| Media | 4.0% |
| Biotechnology | 3.8% |
| Electric | 3.4% |
| Retail | 3.2% |
| Healthcare-Services | 2.9% |
| Food | 2.7% |
| Diversified Financial Services | 2.4% |
| Machinery-Construction & Mining | 2.4% |
| Aerospace/Defense | 2.3% |
| Auto Manufacturers | 2.2% |
| Oil & Gas | 2.2% |
Portfolio Composition

* Percentages exclude derivatives (other than purchased options), if any.
Changes in and Disagreements with Accountants
There were no disagreements with the accountants during the period.
Fund Expenses
What were the Portfolio costs for the last six months ?
(Based on a hypothetical $10,000 investment)
| Portfolio (Class) | Costs of a $10,000 investment | Costs paid as a percentage of a $10,000 investment |
| SA Franklin BW U.S. Large Cap Value Portfolio (Class 2)* | $42 | 0.85%** |
| * |
The expenses shown in the table are meant to highlight your ongoing costs only and do not reflect any fees and expenses that may be charged by the variable annuity contracts and variable life insurance policies that invest in the Portfolio.
|
| ** |
Annualized
|
Key Fund Statistics
The following table outlines key fund statistics.
| Net assets | $1,212M |
| Total number of portfolio holdings | 221 |
| Total net advisory fee paid | $3.9M |
| Portfolio turnover rate during the reporting period | 40% |
Graphical Representation of Holdings
The information below represents the composition of the Portfolio's net assets as of the end of the period.
Top Industries*
| Banks | 20.5% |
| Pharmaceuticals | 7.5% |
| Insurance | 7.5% |
| Telecommunications | 6.9% |
| Media | 4.0% |
| Biotechnology | 3.8% |
| Electric | 3.4% |
| Retail | 3.2% |
| Healthcare-Services | 2.9% |
| Food | 2.7% |
| Diversified Financial Services | 2.4% |
| Machinery-Construction & Mining | 2.4% |
| Aerospace/Defense | 2.3% |
| Auto Manufacturers | 2.2% |
| Oil & Gas | 2.2% |
Portfolio Composition

* Percentages exclude derivatives (other than purchased options), if any.
Changes in and Disagreements with Accountants
There were no disagreements with the accountants during the period.
Fund Expenses
What were the Portfolio costs for the last six months ?
(Based on a hypothetical $10,000 investment)
| Portfolio (Class) | Costs of a $10,000 investment | Costs paid as a percentage of a $10,000 investment |
| SA Franklin BW U.S. Large Cap Value Portfolio (Class 1)* | $35 | 0.70%** |
| * |
The expenses shown in the table are meant to highlight your ongoing costs only and do not reflect any fees and expenses that may be charged by the variable annuity contracts and variable life insurance policies that invest in the Portfolio.
|
| ** |
Annualized
|
Key Fund Statistics
The following table outlines key fund statistics.
| Net assets | $1,212M |
| Total number of portfolio holdings | 221 |
| Total net advisory fee paid | $3.9M |
| Portfolio turnover rate during the reporting period | 40% |
Graphical Representation of Holdings
The information below represents the composition of the Portfolio's net assets as of the end of the period.
Top Industries*
| Banks | 20.5% |
| Pharmaceuticals | 7.5% |
| Insurance | 7.5% |
| Telecommunications | 6.9% |
| Media | 4.0% |
| Biotechnology | 3.8% |
| Electric | 3.4% |
| Retail | 3.2% |
| Healthcare-Services | 2.9% |
| Food | 2.7% |
| Diversified Financial Services | 2.4% |
| Machinery-Construction & Mining | 2.4% |
| Aerospace/Defense | 2.3% |
| Auto Manufacturers | 2.2% |
| Oil & Gas | 2.2% |
Portfolio Composition
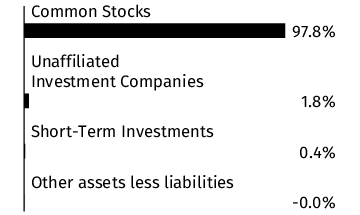
* Percentages exclude derivatives (other than purchased options), if any.
Changes in and Disagreements with Accountants
There were no disagreements with the accountants during the period.
Fund Expenses
What were the Portfolio costs for the last six months ?
(Based on a hypothetical $10,000 investment)
| Portfolio (Class) | Costs of a $10,000 investment | Costs paid as a percentage of a $10,000 investment |
| SA Large Cap Index Portfolio (Class 1)* | $13 | 0.26%** |
| * |
The expenses shown in the table are meant to highlight your ongoing costs only and do not reflect any fees and expenses that may be charged by the variable annuity contracts and variable life insurance policies that invest in the Portfolio.
|
| ** |
Annualized
|
Key Fund Statistics
The following table outlines key fund statistics.
| Net assets | $3,399M |
| Total number of portfolio holdings | 506 |
| Total net advisory fee paid | $3.6M |
| Portfolio turnover rate during the reporting period | 7% |
Graphical Representation of Holdings
The information below represents the composition of the Portfolio's net assets as of the end of the period.
Top Industries*
| Semiconductors | 13.4% |
| Internet | 13.4% |
| Software | 11.9% |
| Computers | 7.4% |
| Banks | 4.5% |
| Retail | 4.4% |
| Diversified Financial Services | 4.2% |
| Pharmaceuticals | 4.0% |
| Insurance | 3.5% |
| Healthcare-Products | 2.7% |
| Oil & Gas | 2.4% |
| Electric | 2.3% |
| Aerospace/Defense | 2.1% |
| Auto Manufacturers | 2.0% |
| Telecommunications | 1.9% |
Portfolio Composition
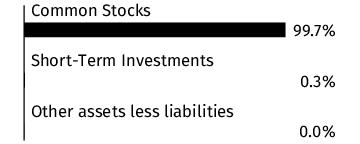
* Percentages exclude derivatives (other than purchased options), if any.
Changes in and Disagreements with Accountants
There were no disagreements with the accountants during the period.
Fund Expenses
What were the Portfolio costs for the last six months ?
(Based on a hypothetical $10,000 investment)
| Portfolio (Class) | Costs of a $10,000 investment | Costs paid as a percentage of a $10,000 investment |
| SA Large Cap Index Portfolio (Class 3)* | $26 | 0.51%** |
| * |
The expenses shown in the table are meant to highlight your ongoing costs only and do not reflect any fees and expenses that may be charged by the variable annuity contracts and variable life insurance policies that invest in the Portfolio.
|
| ** |
Annualized
|
Key Fund Statistics
The following table outlines key fund statistics.
| Net assets | $3,399M |
| Total number of portfolio holdings | 506 |
| Total net advisory fee paid | $3.6M |
| Portfolio turnover rate during the reporting period | 7% |
Graphical Representation of Holdings
The information below represents the composition of the Portfolio's net assets as of the end of the period.
Top Industries*
| Semiconductors | 13.4% |
| Internet | 13.4% |
| Software | 11.9% |
| Computers | 7.4% |
| Banks | 4.5% |
| Retail | 4.4% |
| Diversified Financial Services | 4.2% |
| Pharmaceuticals | 4.0% |
| Insurance | 3.5% |
| Healthcare-Products | 2.7% |
| Oil & Gas | 2.4% |
| Electric | 2.3% |
| Aerospace/Defense | 2.1% |
| Auto Manufacturers | 2.0% |
| Telecommunications | 1.9% |
Portfolio Composition

* Percentages exclude derivatives (other than purchased options), if any.
Changes in and Disagreements with Accountants
There were no disagreements with the accountants during the period.
Fund Expenses
What were the Portfolio costs for the last six months ?
(Based on a hypothetical $10,000 investment)
| Portfolio (Class) | Costs of a $10,000 investment | Costs paid as a percentage of a $10,000 investment |
| SA Invesco Growth Opportunities Portfolio (Class 3)* | $52 | 1.07%** |
| * |
The expenses shown in the table are meant to highlight your ongoing costs only and do not reflect any fees and expenses that may be charged by the variable annuity contracts and variable life insurance policies that invest in the Portfolio.
|
| ** |
Annualized
|
Key Fund Statistics
The following table outlines key fund statistics.
| Net assets | $282M |
| Total number of portfolio holdings | 110 |
| Total net advisory fee paid | $1.0M |
| Portfolio turnover rate during the reporting period | 58% |
Graphical Representation of Holdings
The information below represents the composition of the Portfolio's net assets as of the end of the period.
Top Industries*
| Electronics | 8.8% |
| Diversified Financial Services | 6.9% |
| Software | 6.7% |
| Healthcare-Products | 6.6% |
| Retail | 6.0% |
| Biotechnology | 5.3% |
| Semiconductors | 4.7% |
| Aerospace/Defense | 4.2% |
| Machinery-Diversified | 4.0% |
| Commercial Services | 3.9% |
| Miscellaneous Manufacturing | 3.7% |
| Engineering & Construction | 3.5% |
| Healthcare-Services | 3.1% |
| Computers | 3.0% |
| Internet | 2.6% |
Portfolio Composition
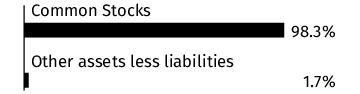
* Percentages exclude derivatives (other than purchased options), if any.
Changes in and Disagreements with Accountants
There were no disagreements with the accountants during the period.
Fund Expenses
What were the Portfolio costs for the last six months ?
(Based on a hypothetical $10,000 investment)
| Portfolio (Class) | Costs of a $10,000 investment | Costs paid as a percentage of a $10,000 investment |
| SA Invesco Growth Opportunities Portfolio (Class 2)* | $47 | 0.97%** |
| * |
The expenses shown in the table are meant to highlight your ongoing costs only and do not reflect any fees and expenses that may be charged by the variable annuity contracts and variable life insurance policies that invest in the Portfolio.
|
| ** |
Annualized
|
Key Fund Statistics
The following table outlines key fund statistics.
| Net assets | $282M |
| Total number of portfolio holdings | 110 |
| Total net advisory fee paid | $1.0M |
| Portfolio turnover rate during the reporting period | 58% |
Graphical Representation of Holdings
The information below represents the composition of the Portfolio's net assets as of the end of the period.
Top Industries*
| Electronics | 8.8% |
| Diversified Financial Services | 6.9% |
| Software | 6.7% |
| Healthcare-Products | 6.6% |
| Retail | 6.0% |
| Biotechnology | 5.3% |
| Semiconductors | 4.7% |
| Aerospace/Defense | 4.2% |
| Machinery-Diversified | 4.0% |
| Commercial Services | 3.9% |
| Miscellaneous Manufacturing | 3.7% |
| Engineering & Construction | 3.5% |
| Healthcare-Services | 3.1% |
| Computers | 3.0% |
| Internet | 2.6% |
Portfolio Composition

* Percentages exclude derivatives (other than purchased options), if any.
Changes in and Disagreements with Accountants
There were no disagreements with the accountants during the period.
Fund Expenses
What were the Portfolio costs for the last six months ?
(Based on a hypothetical $10,000 investment)
| Portfolio (Class) | Costs of a $10,000 investment | Costs paid as a percentage of a $10,000 investment |
| SA Franklin Small Company Value Portfolio (Class 1)* | $46 | 0.95%** |
| * |
The expenses shown in the table are meant to highlight your ongoing costs only and do not reflect any fees and expenses that may be charged by the variable annuity contracts and variable life insurance policies that invest in the Portfolio.
|
| ** |
Annualized
|
Key Fund Statistics
The following table outlines key fund statistics.
| Net assets | $283M |
| Total number of portfolio holdings | 82 |
| Total net advisory fee paid | $1.2M |
| Portfolio turnover rate during the reporting period | 28% |
Graphical Representation of Holdings
The information below represents the composition of the Portfolio's net assets as of the end of the period.
Top Industries*
| Banks | 16.2% |
| Machinery-Diversified | 8.6% |
| Electronics | 8.0% |
| Insurance | 7.5% |
| Chemicals | 4.4% |
| Diversified Financial Services | 4.3% |
| Metal Fabricate/Hardware | 4.0% |
| Aerospace/Defense | 3.8% |
| Lodging | 3.4% |
| Healthcare-Products | 3.4% |
| Commercial Services | 2.9% |
| Software | 2.9% |
| Iron/Steel | 2.7% |
| Retail | 2.5% |
| REITS | 2.5% |
Portfolio Composition

* Percentages exclude derivatives (other than purchased options), if any.
Changes in and Disagreements with Accountants
There were no disagreements with the accountants during the period.
Fund Expenses
What were the Portfolio costs for the last six months ?
(Based on a hypothetical $10,000 investment)
| Portfolio (Class) | Costs of a $10,000 investment | Costs paid as a percentage of a $10,000 investment |
| SA Franklin Systematic U.S. Large Cap Value Portfolio (Class 3)* | $44 | 0.89%** |
| * |
The expenses shown in the table are meant to highlight your ongoing costs only and do not reflect any fees and expenses that may be charged by the variable annuity contracts and variable life insurance policies that invest in the Portfolio.
|
| ** |
Annualized
|
Key Fund Statistics
The following table outlines key fund statistics.
| Net assets | $566M |
| Total number of portfolio holdings | 144 |
| Total net advisory fee paid | $1.6M |
| Portfolio turnover rate during the reporting period | 42% |
Graphical Representation of Holdings
The information below represents the composition of the Portfolio's net assets as of the end of the period.
Top Industries*
| Banks | 13.1% |
| Insurance | 7.1% |
| Healthcare-Products | 5.7% |
| Internet | 5.4% |
| Retail | 5.3% |
| Telecommunications | 4.8% |
| Oil & Gas | 3.4% |
| Software | 3.1% |
| Electric | 3.1% |
| REITS | 3.1% |
| Biotechnology | 2.8% |
| Semiconductors | 2.7% |
| Diversified Financial Services | 2.6% |
| Building Materials | 2.5% |
| Auto Manufacturers | 2.3% |
Portfolio Composition

* Percentages exclude derivatives (other than purchased options), if any.
Changes in and Disagreements with Accountants
There were no disagreements with the accountants during the period.
Fund Expenses
What were the Portfolio costs for the last six months ?
(Based on a hypothetical $10,000 investment)
| Portfolio (Class) | Costs of a $10,000 investment | Costs paid as a percentage of a $10,000 investment |
| SA Franklin Systematic U.S. Large Cap Value Portfolio (Class 2)* | $39 | 0.79%** |
| * |
The expenses shown in the table are meant to highlight your ongoing costs only and do not reflect any fees and expenses that may be charged by the variable annuity contracts and variable life insurance policies that invest in the Portfolio.
|
| ** |
Annualized
|
Key Fund Statistics
The following table outlines key fund statistics.
| Net assets | $566M |
| Total number of portfolio holdings | 144 |
| Total net advisory fee paid | $1.6M |
| Portfolio turnover rate during the reporting period | 42% |
Graphical Representation of Holdings
The information below represents the composition of the Portfolio's net assets as of the end of the period.
Top Industries*
| Banks | 13.1% |
| Insurance | 7.1% |
| Healthcare-Products | 5.7% |
| Internet | 5.4% |
| Retail | 5.3% |
| Telecommunications | 4.8% |
| Oil & Gas | 3.4% |
| Software | 3.1% |
| Electric | 3.1% |
| REITS | 3.1% |
| Biotechnology | 2.8% |
| Semiconductors | 2.7% |
| Diversified Financial Services | 2.6% |
| Building Materials | 2.5% |
| Auto Manufacturers | 2.3% |
Portfolio Composition

* Percentages exclude derivatives (other than purchased options), if any.
Changes in and Disagreements with Accountants
There were no disagreements with the accountants during the period.
Fund Expenses
What were the Portfolio costs for the last six months ?
(Based on a hypothetical $10,000 investment)
| Portfolio (Class) | Costs of a $10,000 investment | Costs paid as a percentage of a $10,000 investment |
| SA Franklin Systematic U.S. Large Cap Value Portfolio (Class 1)* | $32 | 0.64%** |
| * |
The expenses shown in the table are meant to highlight your ongoing costs only and do not reflect any fees and expenses that may be charged by the variable annuity contracts and variable life insurance policies that invest in the Portfolio.
|
| ** |
Annualized
|
Key Fund Statistics
The following table outlines key fund statistics.
| Net assets | $566M |
| Total number of portfolio holdings | 144 |
| Total net advisory fee paid | $1.6M |
| Portfolio turnover rate during the reporting period | 42% |
Graphical Representation of Holdings
The information below represents the composition of the Portfolio's net assets as of the end of the period.
Top Industries*
| Banks | 13.1% |
| Insurance | 7.1% |
| Healthcare-Products | 5.7% |
| Internet | 5.4% |
| Retail | 5.3% |
| Telecommunications | 4.8% |
| Oil & Gas | 3.4% |
| Software | 3.1% |
| Electric | 3.1% |
| REITS | 3.1% |
| Biotechnology | 2.8% |
| Semiconductors | 2.7% |
| Diversified Financial Services | 2.6% |
| Building Materials | 2.5% |
| Auto Manufacturers | 2.3% |
Portfolio Composition

* Percentages exclude derivatives (other than purchased options), if any.
Changes in and Disagreements with Accountants
There were no disagreements with the accountants during the period.
Fund Expenses
What were the Portfolio costs for the last six months ?
(Based on a hypothetical $10,000 investment)
| Portfolio (Class) | Costs of a $10,000 investment | Costs paid as a percentage of a $10,000 investment |
| SA JPMorgan Equity-Income Portfolio (Class 1)* | $29 | 0.59%** |
| * |
The expenses shown in the table are meant to highlight your ongoing costs only and do not reflect any fees and expenses that may be charged by the variable annuity contracts and variable life insurance policies that invest in the Portfolio.
|
| ** |
Annualized
|
Key Fund Statistics
The following table outlines key fund statistics.
| Net assets | $829M |
| Total number of portfolio holdings | 86 |
| Total net advisory fee paid | $2.3M |
| Portfolio turnover rate during the reporting period | 13% |
Graphical Representation of Holdings
The information below represents the composition of the Portfolio's net assets as of the end of the period.
Top Industries*
| Banks | 12.7% |
| Diversified Financial Services | 8.5% |
| Pharmaceuticals | 8.0% |
| Retail | 7.9% |
| Oil & Gas | 5.9% |
| Electric | 4.6% |
| Semiconductors | 4.3% |
| Machinery-Diversified | 3.5% |
| Aerospace/Defense | 3.5% |
| Insurance | 3.4% |
| Transportation | 3.4% |
| Software | 3.2% |
| REITS | 3.0% |
| Computers | 2.8% |
| Healthcare-Services | 2.5% |
Portfolio Composition

* Percentages exclude derivatives (other than purchased options), if any.
Changes in and Disagreements with Accountants
There were no disagreements with the accountants during the period.
Fund Expenses
What were the Portfolio costs for the last six months ?
(Based on a hypothetical $10,000 investment)
| Portfolio (Class) | Costs of a $10,000 investment | Costs paid as a percentage of a $10,000 investment |
| SA JPMorgan Equity-Income Portfolio (Class 2)* | $37 | 0.74%** |
| * |
The expenses shown in the table are meant to highlight your ongoing costs only and do not reflect any fees and expenses that may be charged by the variable annuity contracts and variable life insurance policies that invest in the Portfolio.
|
| ** |
Annualized
|
Key Fund Statistics
The following table outlines key fund statistics.
| Net assets | $829M |
| Total number of portfolio holdings | 86 |
| Total net advisory fee paid | $2.3M |
| Portfolio turnover rate during the reporting period | 13% |
Graphical Representation of Holdings
The information below represents the composition of the Portfolio's net assets as of the end of the period.
Top Industries*
| Banks | 12.7% |
| Diversified Financial Services | 8.5% |
| Pharmaceuticals | 8.0% |
| Retail | 7.9% |
| Oil & Gas | 5.9% |
| Electric | 4.6% |
| Semiconductors | 4.3% |
| Machinery-Diversified | 3.5% |
| Aerospace/Defense | 3.5% |
| Insurance | 3.4% |
| Transportation | 3.4% |
| Software | 3.2% |
| REITS | 3.0% |
| Computers | 2.8% |
| Healthcare-Services | 2.5% |
Portfolio Composition

* Percentages exclude derivatives (other than purchased options), if any.
Changes in and Disagreements with Accountants
There were no disagreements with the accountants during the period.
Fund Expenses
What were the Portfolio costs for the last six months ?
(Based on a hypothetical $10,000 investment)
| Portfolio (Class) | Costs of a $10,000 investment | Costs paid as a percentage of a $10,000 investment |
| SA JPMorgan Equity-Income Portfolio (Class 3)* | $42 | 0.84%** |
| * |
The expenses shown in the table are meant to highlight your ongoing costs only and do not reflect any fees and expenses that may be charged by the variable annuity contracts and variable life insurance policies that invest in the Portfolio.
|
| ** |
Annualized
|
Key Fund Statistics
The following table outlines key fund statistics.
| Net assets | $829M |
| Total number of portfolio holdings | 86 |
| Total net advisory fee paid | $2.3M |
| Portfolio turnover rate during the reporting period | 13% |
Graphical Representation of Holdings
The information below represents the composition of the Portfolio's net assets as of the end of the period.
Top Industries*
| Banks | 12.7% |
| Diversified Financial Services | 8.5% |
| Pharmaceuticals | 8.0% |
| Retail | 7.9% |
| Oil & Gas | 5.9% |
| Electric | 4.6% |
| Semiconductors | 4.3% |
| Machinery-Diversified | 3.5% |
| Aerospace/Defense | 3.5% |
| Insurance | 3.4% |
| Transportation | 3.4% |
| Software | 3.2% |
| REITS | 3.0% |
| Computers | 2.8% |
| Healthcare-Services | 2.5% |
Portfolio Composition

* Percentages exclude derivatives (other than purchased options), if any.
Changes in and Disagreements with Accountants
There were no disagreements with the accountants during the period.
| [1] | The expenses shown in the table are meant to highlight your ongoing costs only and do not reflect any fees and expenses that may be charged by the variable annuity contracts and variable life insurance policies that invest in the Portfolio. |
| [2] | Annualized |
| [3] | The expenses shown in the table are meant to highlight your ongoing costs only and do not reflect any fees and expenses that may be charged by the variable annuity contracts and variable life insurance policies that invest in the Portfolio. |
| [4] | Annualized |
| [5] | The expenses shown in the table are meant to highlight your ongoing costs only and do not reflect any fees and expenses that may be charged by the variable annuity contracts and variable life insurance policies that invest in the Portfolio. |
| [6] | Annualized |
| [7] | The expenses shown in the table are meant to highlight your ongoing costs only and do not reflect any fees and expenses that may be charged by the variable annuity contracts and variable life insurance policies that invest in the Portfolio. |
| [8] | Annualized |
| [9] | The expenses shown in the table are meant to highlight your ongoing costs only and do not reflect any fees and expenses that may be charged by the variable annuity contracts and variable life insurance policies that invest in the Portfolio. |
| [10] | Annualized |
| [11] | The expenses shown in the table are meant to highlight your ongoing costs only and do not reflect any fees and expenses that may be charged by the variable annuity contracts and variable life insurance policies that invest in the Portfolio. |
| [12] | Annualized |
| [13] | The expenses shown in the table are meant to highlight your ongoing costs only and do not reflect any fees and expenses that may be charged by the variable annuity contracts and variable life insurance policies that invest in the Portfolio. |
| [14] | Annualized |
| [15] | The expenses shown in the table are meant to highlight your ongoing costs only and do not reflect any fees and expenses that may be charged by the variable annuity contracts and variable life insurance policies that invest in the Portfolio. |
| [16] | Annualized |
| [17] | The expenses shown in the table are meant to highlight your ongoing costs only and do not reflect any fees and expenses that may be charged by the variable annuity contracts and variable life insurance policies that invest in the Portfolio. |
| [18] | Annualized |
| [19] | The expenses shown in the table are meant to highlight your ongoing costs only and do not reflect any fees and expenses that may be charged by the variable annuity contracts and variable life insurance policies that invest in the Portfolio. |
| [20] | Annualized |
| [21] | The expenses shown in the table are meant to highlight your ongoing costs only and do not reflect any fees and expenses that may be charged by the variable annuity contracts and variable life insurance policies that invest in the Portfolio. |
| [22] | Annualized |
| [23] | The expenses shown in the table are meant to highlight your ongoing costs only and do not reflect any fees and expenses that may be charged by the variable annuity contracts and variable life insurance policies that invest in the Portfolio. |
| [24] | Annualized |
| [25] | The expenses shown in the table are meant to highlight your ongoing costs only and do not reflect any fees and expenses that may be charged by the variable annuity contracts and variable life insurance policies that invest in the Portfolio. |
| [26] | Annualized |
| [27] | The expenses shown in the table are meant to highlight your ongoing costs only and do not reflect any fees and expenses that may be charged by the variable annuity contracts and variable life insurance policies that invest in the Portfolio. |
| [28] | Annualized |
| [29] | The expenses shown in the table are meant to highlight your ongoing costs only and do not reflect any fees and expenses that may be charged by the variable annuity contracts and variable life insurance policies that invest in the Portfolio. |
| [30] | Annualized |
| [31] | The expenses shown in the table are meant to highlight your ongoing costs only and do not reflect any fees and expenses that may be charged by the variable annuity contracts and variable life insurance policies that invest in the Portfolio. |
| [32] | Annualized |
| [33] | The expenses shown in the table are meant to highlight your ongoing costs only and do not reflect any fees and expenses that may be charged by the variable annuity contracts and variable life insurance policies that invest in the Portfolio. |
| [34] | Annualized |
| [35] | The expenses shown in the table are meant to highlight your ongoing costs only and do not reflect any fees and expenses that may be charged by the variable annuity contracts and variable life insurance policies that invest in the Portfolio. |
| [36] | Annualized |
| [37] | The expenses shown in the table are meant to highlight your ongoing costs only and do not reflect any fees and expenses that may be charged by the variable annuity contracts and variable life insurance policies that invest in the Portfolio. |
| [38] | Annualized |
| [39] | The expenses shown in the table are meant to highlight your ongoing costs only and do not reflect any fees and expenses that may be charged by the variable annuity contracts and variable life insurance policies that invest in the Portfolio. |
| [40] | Annualized |
| [41] | The expenses shown in the table are meant to highlight your ongoing costs only and do not reflect any fees and expenses that may be charged by the variable annuity contracts and variable life insurance policies that invest in the Portfolio. |
| [42] | Annualized |
| [43] | The expenses shown in the table are meant to highlight your ongoing costs only and do not reflect any fees and expenses that may be charged by the variable annuity contracts and variable life insurance policies that invest in the Portfolio. |
| [44] | Annualized |
| [45] | The expenses shown in the table are meant to highlight your ongoing costs only and do not reflect any fees and expenses that may be charged by the variable annuity contracts and variable life insurance policies that invest in the Portfolio. |
| [46] | Annualized |
| [47] | The expenses shown in the table are meant to highlight your ongoing costs only and do not reflect any fees and expenses that may be charged by the variable annuity contracts and variable life insurance policies that invest in the Portfolio. |
| [48] | Annualized |
| [49] | The expenses shown in the table are meant to highlight your ongoing costs only and do not reflect any fees and expenses that may be charged by the variable annuity contracts and variable life insurance policies that invest in the Portfolio. |
| [50] | Annualized |
| [51] | The expenses shown in the table are meant to highlight your ongoing costs only and do not reflect any fees and expenses that may be charged by the variable annuity contracts and variable life insurance policies that invest in the Portfolio. |
| [52] | Annualized |
| [53] | The expenses shown in the table are meant to highlight your ongoing costs only and do not reflect any fees and expenses that may be charged by the variable annuity contracts and variable life insurance policies that invest in the Portfolio. |
| [54] | Annualized |
| [55] | The expenses shown in the table are meant to highlight your ongoing costs only and do not reflect any fees and expenses that may be charged by the variable annuity contracts and variable life insurance policies that invest in the Portfolio. |
| [56] | Annualized |
| [57] | The expenses shown in the table are meant to highlight your ongoing costs only and do not reflect any fees and expenses that may be charged by the variable annuity contracts and variable life insurance policies that invest in the Portfolio. |
| [58] | Annualized |
| [59] | The expenses shown in the table are meant to highlight your ongoing costs only and do not reflect any fees and expenses that may be charged by the variable annuity contracts and variable life insurance policies that invest in the Portfolio. |
| [60] | Annualized |
| [61] | The expenses shown in the table are meant to highlight your ongoing costs only and do not reflect any fees and expenses that may be charged by the variable annuity contracts and variable life insurance policies that invest in the Portfolio. |
| [62] | Annualized |
| [63] | The expenses shown in the table are meant to highlight your ongoing costs only and do not reflect any fees and expenses that may be charged by the variable annuity contracts and variable life insurance policies that invest in the Portfolio. |
| [64] | Annualized |
| [65] | The expenses shown in the table are meant to highlight your ongoing costs only and do not reflect any fees and expenses that may be charged by the variable annuity contracts and variable life insurance policies that invest in the Portfolio. |
| [66] | Annualized |
| [67] | The expenses shown in the table are meant to highlight your ongoing costs only and do not reflect any fees and expenses that may be charged by the variable annuity contracts and variable life insurance policies that invest in the Portfolio. |
| [68] | Annualized |
| [69] | The expenses shown in the table are meant to highlight your ongoing costs only and do not reflect any fees and expenses that may be charged by the variable annuity contracts and variable life insurance policies that invest in the Portfolio. |
| [70] | Annualized |
| [71] | The expenses shown in the table are meant to highlight your ongoing costs only and do not reflect any fees and expenses that may be charged by the variable annuity contracts and variable life insurance policies that invest in the Portfolio. |
| [72] | Annualized |
| [73] | The expenses shown in the table are meant to highlight your ongoing costs only and do not reflect any fees and expenses that may be charged by the variable annuity contracts and variable life insurance policies that invest in the Portfolio. |
| [74] | Annualized |
| [75] | The expenses shown in the table are meant to highlight your ongoing costs only and do not reflect any fees and expenses that may be charged by the variable annuity contracts and variable life insurance policies that invest in the Portfolio. |
| [76] | Annualized |
| [77] | The expenses shown in the table are meant to highlight your ongoing costs only and do not reflect any fees and expenses that may be charged by the variable annuity contracts and variable life insurance policies that invest in the Portfolio. |
| [78] | Annualized |
| [79] | The expenses shown in the table are meant to highlight your ongoing costs only and do not reflect any fees and expenses that may be charged by the variable annuity contracts and variable life insurance policies that invest in the Portfolio. |
| [80] | Annualized |
| [81] | The expenses shown in the table are meant to highlight your ongoing costs only and do not reflect any fees and expenses that may be charged by the variable annuity contracts and variable life insurance policies that invest in the Portfolio. |
| [82] | Annualized |
| [83] | The expenses shown in the table are meant to highlight your ongoing costs only and do not reflect any fees and expenses that may be charged by the variable annuity contracts and variable life insurance policies that invest in the Portfolio. |
| [84] | Annualized |
| [85] | The expenses shown in the table are meant to highlight your ongoing costs only and do not reflect any fees and expenses that may be charged by the variable annuity contracts and variable life insurance policies that invest in the Portfolio. |
| [86] | Annualized |
| [87] | The expenses shown in the table are meant to highlight your ongoing costs only and do not reflect any fees and expenses that may be charged by the variable annuity contracts and variable life insurance policies that invest in the Portfolio. |
| [88] | Annualized |
| [89] | The expenses shown in the table are meant to highlight your ongoing costs only and do not reflect any fees and expenses that may be charged by the variable annuity contracts and variable life insurance policies that invest in the Portfolio. |
| [90] | Annualized |
| [91] | The expenses shown in the table are meant to highlight your ongoing costs only and do not reflect any fees and expenses that may be charged by the variable annuity contracts and variable life insurance policies that invest in the Portfolio. |
| [92] | Annualized |
| [93] | The expenses shown in the table are meant to highlight your ongoing costs only and do not reflect any fees and expenses that may be charged by the variable annuity contracts and variable life insurance policies that invest in the Portfolio. |
| [94] | Annualized |
| [95] | The expenses shown in the table are meant to highlight your ongoing costs only and do not reflect any fees and expenses that may be charged by the variable annuity contracts and variable life insurance policies that invest in the Portfolio. |
| [96] | Annualized |
| [97] | The expenses shown in the table are meant to highlight your ongoing costs only and do not reflect any fees and expenses that may be charged by the variable annuity contracts and variable life insurance policies that invest in the Portfolio. |
| [98] | Annualized |
| [99] | The expenses shown in the table are meant to highlight your ongoing costs only and do not reflect any fees and expenses that may be charged by the variable annuity contracts and variable life insurance policies that invest in the Portfolio. |
| [100] | Annualized |
| [101] | The expenses shown in the table are meant to highlight your ongoing costs only and do not reflect any fees and expenses that may be charged by the variable annuity contracts and variable life insurance policies that invest in the Portfolio. |
| [102] | Annualized |
| [103] | The expenses shown in the table are meant to highlight your ongoing costs only and do not reflect any fees and expenses that may be charged by the variable annuity contracts and variable life insurance policies that invest in the Portfolio. |
| [104] | Annualized |
| [105] | The expenses shown in the table are meant to highlight your ongoing costs only and do not reflect any fees and expenses that may be charged by the variable annuity contracts and variable life insurance policies that invest in the Portfolio. |
| [106] | Annualized |
| [107] | The expenses shown in the table are meant to highlight your ongoing costs only and do not reflect any fees and expenses that may be charged by the variable annuity contracts and variable life insurance policies that invest in the Portfolio. |
| [108] | Annualized |
| [109] | The expenses shown in the table are meant to highlight your ongoing costs only and do not reflect any fees and expenses that may be charged by the variable annuity contracts and variable life insurance policies that invest in the Portfolio. |
| [110] | Annualized |
| [111] | The expenses shown in the table are meant to highlight your ongoing costs only and do not reflect any fees and expenses that may be charged by the variable annuity contracts and variable life insurance policies that invest in the Portfolio. |
| [112] | Annualized |
| [113] | The expenses shown in the table are meant to highlight your ongoing costs only and do not reflect any fees and expenses that may be charged by the variable annuity contracts and variable life insurance policies that invest in the Portfolio. |
| [114] | Annualized |
| [115] | The expenses shown in the table are meant to highlight your ongoing costs only and do not reflect any fees and expenses that may be charged by the variable annuity contracts and variable life insurance policies that invest in the Portfolio. |
| [116] | Annualized |
| [117] | The expenses shown in the table are meant to highlight your ongoing costs only and do not reflect any fees and expenses that may be charged by the variable annuity contracts and variable life insurance policies that invest in the Portfolio. |
| [118] | Annualized |
| [119] | The expenses shown in the table are meant to highlight your ongoing costs only and do not reflect any fees and expenses that may be charged by the variable annuity contracts and variable life insurance policies that invest in the Portfolio. |
| [120] | Annualized |
| [121] | The expenses shown in the table are meant to highlight your ongoing costs only and do not reflect any fees and expenses that may be charged by the variable annuity contracts and variable life insurance policies that invest in the Portfolio. |
| [122] | Annualized |
| [123] | The expenses shown in the table are meant to highlight your ongoing costs only and do not reflect any fees and expenses that may be charged by the variable annuity contracts and variable life insurance policies that invest in the Portfolio. |
| [124] | Annualized |
| [125] | The expenses shown in the table are meant to highlight your ongoing costs only and do not reflect any fees and expenses that may be charged by the variable annuity contracts and variable life insurance policies that invest in the Portfolio. |
| [126] | Annualized |
| [127] | The expenses shown in the table are meant to highlight your ongoing costs only and do not reflect any fees and expenses that may be charged by the variable annuity contracts and variable life insurance policies that invest in the Portfolio. |
| [128] | Annualized |
| [129] | The expenses shown in the table are meant to highlight your ongoing costs only and do not reflect any fees and expenses that may be charged by the variable annuity contracts and variable life insurance policies that invest in the Portfolio. |
| [130] | Annualized |
| [131] | The expenses shown in the table are meant to highlight your ongoing costs only and do not reflect any fees and expenses that may be charged by the variable annuity contracts and variable life insurance policies that invest in the Portfolio. |
| [132] | Annualized |
| [133] | The expenses shown in the table are meant to highlight your ongoing costs only and do not reflect any fees and expenses that may be charged by the variable annuity contracts and variable life insurance policies that invest in the Portfolio. |
| [134] | Annualized |
| [135] | The expenses shown in the table are meant to highlight your ongoing costs only and do not reflect any fees and expenses that may be charged by the variable annuity contracts and variable life insurance policies that invest in the Portfolio. |
| [136] | Annualized |
| [137] | The expenses shown in the table are meant to highlight your ongoing costs only and do not reflect any fees and expenses that may be charged by the variable annuity contracts and variable life insurance policies that invest in the Portfolio. |
| [138] | Annualized |
| [139] | The expenses shown in the table are meant to highlight your ongoing costs only and do not reflect any fees and expenses that may be charged by the variable annuity contracts and variable life insurance policies that invest in the Portfolio. |
| [140] | Annualized |
| [141] | The expenses shown in the table are meant to highlight your ongoing costs only and do not reflect any fees and expenses that may be charged by the variable annuity contracts and variable life insurance policies that invest in the Portfolio. |
| [142] | Annualized |
| [143] | The expenses shown in the table are meant to highlight your ongoing costs only and do not reflect any fees and expenses that may be charged by the variable annuity contracts and variable life insurance policies that invest in the Portfolio. |
| [144] | Annualized |
| [145] | The expenses shown in the table are meant to highlight your ongoing costs only and do not reflect any fees and expenses that may be charged by the variable annuity contracts and variable life insurance policies that invest in the Portfolio. |
| [146] | Annualized |
| [147] | The expenses shown in the table are meant to highlight your ongoing costs only and do not reflect any fees and expenses that may be charged by the variable annuity contracts and variable life insurance policies that invest in the Portfolio. |
| [148] | Annualized |
| [149] | The expenses shown in the table are meant to highlight your ongoing costs only and do not reflect any fees and expenses that may be charged by the variable annuity contracts and variable life insurance policies that invest in the Portfolio. |
| [150] | Annualized |
| [151] | The expenses shown in the table are meant to highlight your ongoing costs only and do not reflect any fees and expenses that may be charged by the variable annuity contracts and variable life insurance policies that invest in the Portfolio. |
| [152] | Annualized |
| [153] | The expenses shown in the table are meant to highlight your ongoing costs only and do not reflect any fees and expenses that may be charged by the variable annuity contracts and variable life insurance policies that invest in the Portfolio. |
| [154] | Annualized |
| [155] | The expenses shown in the table are meant to highlight your ongoing costs only and do not reflect any fees and expenses that may be charged by the variable annuity contracts and variable life insurance policies that invest in the Portfolio. |
| [156] | Annualized |
| [157] | The expenses shown in the table are meant to highlight your ongoing costs only and do not reflect any fees and expenses that may be charged by the variable annuity contracts and variable life insurance policies that invest in the Portfolio. |
| [158] | Annualized |
| [159] | The expenses shown in the table are meant to highlight your ongoing costs only and do not reflect any fees and expenses that may be charged by the variable annuity contracts and variable life insurance policies that invest in the Portfolio. |
| [160] | Annualized |
| [161] | The expenses shown in the table are meant to highlight your ongoing costs only and do not reflect any fees and expenses that may be charged by the variable annuity contracts and variable life insurance policies that invest in the Portfolio. |
| [162] | Annualized |
| [163] | The expenses shown in the table are meant to highlight your ongoing costs only and do not reflect any fees and expenses that may be charged by the variable annuity contracts and variable life insurance policies that invest in the Portfolio. |
| [164] | Annualized |
| [165] | The expenses shown in the table are meant to highlight your ongoing costs only and do not reflect any fees and expenses that may be charged by the variable annuity contracts and variable life insurance policies that invest in the Portfolio. |
| [166] | Annualized |
| [167] | The expenses shown in the table are meant to highlight your ongoing costs only and do not reflect any fees and expenses that may be charged by the variable annuity contracts and variable life insurance policies that invest in the Portfolio. |
| [168] | Annualized |
| [169] | The expenses shown in the table are meant to highlight your ongoing costs only and do not reflect any fees and expenses that may be charged by the variable annuity contracts and variable life insurance policies that invest in the Portfolio. |
| [170] | Annualized |
| [171] | The expenses shown in the table are meant to highlight your ongoing costs only and do not reflect any fees and expenses that may be charged by the variable annuity contracts and variable life insurance policies that invest in the Portfolio. |
| [172] | Annualized |
| [173] | The expenses shown in the table are meant to highlight your ongoing costs only and do not reflect any fees and expenses that may be charged by the variable annuity contracts and variable life insurance policies that invest in the Portfolio. |
| [174] | Annualized |
| [175] | The expenses shown in the table are meant to highlight your ongoing costs only and do not reflect any fees and expenses that may be charged by the variable annuity contracts and variable life insurance policies that invest in the Portfolio. |
| [176] | Annualized |
| [177] | The expenses shown in the table are meant to highlight your ongoing costs only and do not reflect any fees and expenses that may be charged by the variable annuity contracts and variable life insurance policies that invest in the Portfolio. |
| [178] | Annualized |
| [179] | The expenses shown in the table are meant to highlight your ongoing costs only and do not reflect any fees and expenses that may be charged by the variable annuity contracts and variable life insurance policies that invest in the Portfolio. |
| [180] | Annualized |
| [181] | The expenses shown in the table are meant to highlight your ongoing costs only and do not reflect any fees and expenses that may be charged by the variable annuity contracts and variable life insurance policies that invest in the Portfolio. |
| [182] | Annualized |
| [183] | The expenses shown in the table are meant to highlight your ongoing costs only and do not reflect any fees and expenses that may be charged by the variable annuity contracts and variable life insurance policies that invest in the Portfolio. |
| [184] | Annualized |
| [185] | The expenses shown in the table are meant to highlight your ongoing costs only and do not reflect any fees and expenses that may be charged by the variable annuity contracts and variable life insurance policies that invest in the Portfolio. |
| [186] | Annualized |
| [187] | The expenses shown in the table are meant to highlight your ongoing costs only and do not reflect any fees and expenses that may be charged by the variable annuity contracts and variable life insurance policies that invest in the Portfolio. |
| [188] | Annualized |
| [189] | The expenses shown in the table are meant to highlight your ongoing costs only and do not reflect any fees and expenses that may be charged by the variable annuity contracts and variable life insurance policies that invest in the Portfolio. |
| [190] | Annualized |
| [191] | The expenses shown in the table are meant to highlight your ongoing costs only and do not reflect any fees and expenses that may be charged by the variable annuity contracts and variable life insurance policies that invest in the Portfolio. |
| [192] | Annualized |
| [193] | The expenses shown in the table are meant to highlight your ongoing costs only and do not reflect any fees and expenses that may be charged by the variable annuity contracts and variable life insurance policies that invest in the Portfolio. |
| [194] | Annualized |
| [195] | The expenses shown in the table are meant to highlight your ongoing costs only and do not reflect any fees and expenses that may be charged by the variable annuity contracts and variable life insurance policies that invest in the Portfolio. |
| [196] | Annualized |
| [197] | The expenses shown in the table are meant to highlight your ongoing costs only and do not reflect any fees and expenses that may be charged by the variable annuity contracts and variable life insurance policies that invest in the Portfolio. |
| [198] | Annualized |
| [199] | The expenses shown in the table are meant to highlight your ongoing costs only and do not reflect any fees and expenses that may be charged by the variable annuity contracts and variable life insurance policies that invest in the Portfolio. |
| [200] | Annualized |
| [201] | The expenses shown in the table are meant to highlight your ongoing costs only and do not reflect any fees and expenses that may be charged by the variable annuity contracts and variable life insurance policies that invest in the Portfolio. |
| [202] | Annualized |
| [203] | The expenses shown in the table are meant to highlight your ongoing costs only and do not reflect any fees and expenses that may be charged by the variable annuity contracts and variable life insurance policies that invest in the Portfolio. |
| [204] | Annualized |
| [205] | The expenses shown in the table are meant to highlight your ongoing costs only and do not reflect any fees and expenses that may be charged by the variable annuity contracts and variable life insurance policies that invest in the Portfolio. |
| [206] | Annualized |
| [207] | The expenses shown in the table are meant to highlight your ongoing costs only and do not reflect any fees and expenses that may be charged by the variable annuity contracts and variable life insurance policies that invest in the Portfolio. |
| [208] | Annualized |
| [209] | The expenses shown in the table are meant to highlight your ongoing costs only and do not reflect any fees and expenses that may be charged by the variable annuity contracts and variable life insurance policies that invest in the Portfolio. |
| [210] | Annualized |
| [211] | The expenses shown in the table are meant to highlight your ongoing costs only and do not reflect any fees and expenses that may be charged by the variable annuity contracts and variable life insurance policies that invest in the Portfolio. |
| [212] | Annualized |
| [213] | The expenses shown in the table are meant to highlight your ongoing costs only and do not reflect any fees and expenses that may be charged by the variable annuity contracts and variable life insurance policies that invest in the Portfolio. |
| [214] | Annualized |
| [215] | The expenses shown in the table are meant to highlight your ongoing costs only and do not reflect any fees and expenses that may be charged by the variable annuity contracts and variable life insurance policies that invest in the Portfolio. |
| [216] | Annualized |
| [217] | The expenses shown in the table are meant to highlight your ongoing costs only and do not reflect any fees and expenses that may be charged by the variable annuity contracts and variable life insurance policies that invest in the Portfolio. |
| [218] | Annualized |
| [219] | The expenses shown in the table are meant to highlight your ongoing costs only and do not reflect any fees and expenses that may be charged by the variable annuity contracts and variable life insurance policies that invest in the Portfolio. |
| [220] | Annualized |
| [221] | The expenses shown in the table are meant to highlight your ongoing costs only and do not reflect any fees and expenses that may be charged by the variable annuity contracts and variable life insurance policies that invest in the Portfolio. |
| [222] | Annualized |
| [223] | The expenses shown in the table are meant to highlight your ongoing costs only and do not reflect any fees and expenses that may be charged by the variable annuity contracts and variable life insurance policies that invest in the Portfolio. |
| [224] | Annualized |
| [225] | The expenses shown in the table are meant to highlight your ongoing costs only and do not reflect any fees and expenses that may be charged by the variable annuity contracts and variable life insurance policies that invest in the Portfolio. |
| [226] | Annualized |
| [227] | The expenses shown in the table are meant to highlight your ongoing costs only and do not reflect any fees and expenses that may be charged by the variable annuity contracts and variable life insurance policies that invest in the Portfolio. |
| [228] | Annualized |
| [229] | The expenses shown in the table are meant to highlight your ongoing costs only and do not reflect any fees and expenses that may be charged by the variable annuity contracts and variable life insurance policies that invest in the Portfolio. |
| [230] | Annualized |
| [231] | The expenses shown in the table are meant to highlight your ongoing costs only and do not reflect any fees and expenses that may be charged by the variable annuity contracts and variable life insurance policies that invest in the Portfolio. |
| [232] | Annualized |
| [233] | The expenses shown in the table are meant to highlight your ongoing costs only and do not reflect any fees and expenses that may be charged by the variable annuity contracts and variable life insurance policies that invest in the Portfolio. |
| [234] | Annualized |
| [235] | The expenses shown in the table are meant to highlight your ongoing costs only and do not reflect any fees and expenses that may be charged by the variable annuity contracts and variable life insurance policies that invest in the Portfolio. |
| [236] | Annualized |
| [237] | The expenses shown in the table are meant to highlight your ongoing costs only and do not reflect any fees and expenses that may be charged by the variable annuity contracts and variable life insurance policies that invest in the Portfolio. |
| [238] | Annualized |
| [239] | The expenses shown in the table are meant to highlight your ongoing costs only and do not reflect any fees and expenses that may be charged by the variable annuity contracts and variable life insurance policies that invest in the Portfolio. |
| [240] | Annualized |
| [241] | The expenses shown in the table are meant to highlight your ongoing costs only and do not reflect any fees and expenses that may be charged by the variable annuity contracts and variable life insurance policies that invest in the Portfolio. |
| [242] | Annualized |
| [243] | The expenses shown in the table are meant to highlight your ongoing costs only and do not reflect any fees and expenses that may be charged by the variable annuity contracts and variable life insurance policies that invest in the Portfolio. |
| [244] | Annualized |
| [245] | The expenses shown in the table are meant to highlight your ongoing costs only and do not reflect any fees and expenses that may be charged by the variable annuity contracts and variable life insurance policies that invest in the Portfolio. |
| [246] | Annualized |
| [247] | The expenses shown in the table are meant to highlight your ongoing costs only and do not reflect any fees and expenses that may be charged by the variable annuity contracts and variable life insurance policies that invest in the Portfolio. |
| [248] | Annualized |
| [249] | The expenses shown in the table are meant to highlight your ongoing costs only and do not reflect any fees and expenses that may be charged by the variable annuity contracts and variable life insurance policies that invest in the Portfolio. |
| [250] | Annualized |
| [251] | The expenses shown in the table are meant to highlight your ongoing costs only and do not reflect any fees and expenses that may be charged by the variable annuity contracts and variable life insurance policies that invest in the Portfolio. |
| [252] | Annualized |