Shareholder Report
Jul. 31, 2025
USD ($)
Holding
For information on the Green Century Funds®, call 1-800-93-GREEN. For information on how to open an account and account services, call 1-800-221-5519 8:00 am to 6:00 pm Eastern Time, Monday through Friday. For daily share price information twenty-four hours a day, visit www.greencentury.com.
What were the Fund costs for the last year?
(Based on a hypothetical $10,000 investment)
The below table explains the costs that you would have paid within the reporting period.
| Fund (Class) | Costs of a $10,000 investment | Costs paid as a percentage of a $10,000 investment |
| Green Century Balanced Fund (Individual Investor Class/GCBLX) |
$149 | 1.46% |
Management’s Discussion of Fund Performance
How did the Fund perform last year? What affected the Fund’s performance?
The Green Century Balanced Fund seeks capital growth and income from a diversified portfolio of stocks and bonds that meet Green Century’s standards for corporate environmental responsibility. We seek to achieve the fund’s investment objective by investing between 55% to 70% of the fund’s net assets in value in multi-capitalization stocks and 30% to 45% in investment-grade quality bonds.
The Fund’s investments focus on companies with strong environmental, social, and governance practices that may enhance corporate profitability and reduce certain types of risks. The Fund specifically avoids risks associated with exposure to fossil fuels, including traditional fossil-fuel based energy and utility companies. The Fund focuses on companies with strong balance sheets, strategic leadership in their products and markets, and strong environmental, social, and governance policies; these companies have greater financial flexibility to navigate choppy and volatile economic conditions.
In line with its environmental mandate, the Fund had exposure to what Green Century considers environmental leaders in a number of industries including Healthy Living, Capital Goods, and Transportation. The Fund has broad exposure to information technology, health care, financial, consumer, and industrial companies.
In addition to its equity exposure to environmental leaders, the Fund invests in designated Green Bonds and designated Social Impact Bonds. The issuers of Green Bonds have indicated that the proceeds from the bonds will be used for environmentally positive goals such as greenhouse gas reduction, climate adaptation, and climate change mitigation. Issuers of designated Social Impact Bonds have indicated that the proceeds from the bonds will be used for projects supporting such issues as poverty alleviation, low-income housing, fair trade, and community development.
The fund’s performance for the year was shaped by its continued cautious positioning, a deliberate approach taken in light of anticipated economic challenges related to tariffs. This cautious allocation resulted in the fund underperforming its benchmark during the reporting period from August 1, 2024 to July 31, 2025.
Within equities, performance was influenced by the continuation of a highly concentrated market environment, with gains largely driven by a small number of very large-capitalization companies. And although the administration initially introduced reduced clean energy incentives, the potential for interest rate cuts continued to support the interest-rate-sensitive clean energy stocks.
Our fixed income exposure outperformed the benchmark for the year, supported by our structural overweight to corporate bonds relative to government bonds. The fund’s high-quality and moderate duration fixed income exposure kept pace with its fixed income benchmark and the designated Green, Sustainable or Social Impact bonds held by the fund continued to trade well.
Fund Performance
The following graph compares the initial and subsequent account values at the end of each of the most recently completed 10 fiscal years of the Fund. It assumes a $10,000 initial investment at the beginning of the first fiscal year in an appropriate broad-based securities market index for the same period.
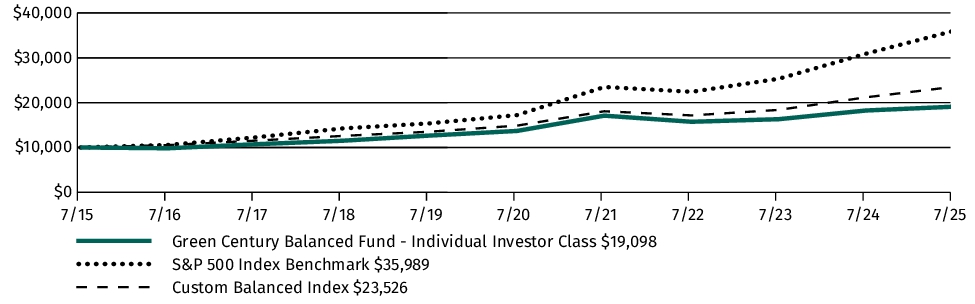
| AVERAGE ANNUAL TOTAL RETURN | 1 Year | 5 Years | 10 Years |
| Green Century Balanced Fund (Individual Investor Class/GCBLX) | 4.64% | 6.88% | 6.68% |
| S&P 500 Index Benchmark1,2 | 16.33% | 15.88% | 13.66% |
| Custom Balanced Index3,4 | 10.99% | 9.61% | 8.93% |
| 1 |
The Regulatory Index is provided as a broad measure of market performance. |
| 2 |
The S&P 500 Index is an unmanaged index of 500 stocks |
| 3 |
The Performance Index is provided because the advisor believes it is more reflective of the fund’s investment strategy. The investment return and principal value of shares of the Fund fluctuate, so your shares, when sold, may be worth more or less than their original cost. |
| 4 |
The Custom Balanced Index is comprised of a 60% weighting in the S&P 1500 Index and a 40% weighting in the BofA Merrill Lynch 1-10 Year US Corporate & Government Index |
Key Fund Statistics
The following table outlines key fund statistic that you should pay attention to
| Fund net assets | $379 mil. |
| Total number of portfolio holdings | 104 |
| Total advisory fees paid (net) | $2.5 mil. |
| Portfolio turnover rate as of the end of the reporting period | 23% |
Graphical Representation of Holdings
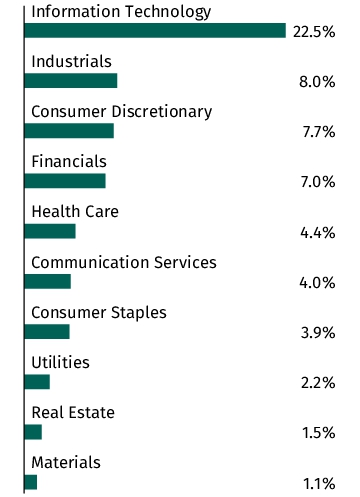
The tables below show the investment make up of the Fund, representing percentage of total net assets of the Fund. The Top Ten Holdings and Sector Allocation exclude short-term holdings, if any. The Sector Allocation chart represents Common Stocks of the Fund.
Top Ten Holdings
| Microsoft Corporation | 5.5% |
| NVIDIA Corporation | 5.4% |
| Apple, Inc. | 3.3% |
| Alphabet, Inc., Class A | 3.2% |
| Mastercard, Inc., Class A | 2.2% |
| Costco Wholesale Corporation | 1.6% |
| Alphabet, Inc. | 1.4% |
| Export Development Canada | 1.4% |
| International Bank for Reconstruction & Development | 1.3% |
| Netflix, Inc. | 1.3% |
Sector Allocation
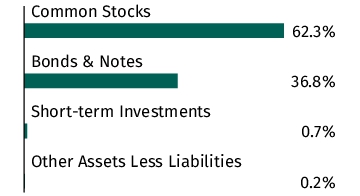
Asset Allocation

Top Ten Holdings
| Microsoft Corporation | 5.5% |
| NVIDIA Corporation | 5.4% |
| Apple, Inc. | 3.3% |
| Alphabet, Inc., Class A | 3.2% |
| Mastercard, Inc., Class A | 2.2% |
| Costco Wholesale Corporation | 1.6% |
| Alphabet, Inc. | 1.4% |
| Export Development Canada | 1.4% |
| International Bank for Reconstruction & Development | 1.3% |
| Netflix, Inc. | 1.3% |
For information on the Green Century Funds®, call 1-800-93-GREEN. For information on how to open an account and account services, call 1-800-221-5519 8:00 am to 6:00 pm Eastern Time, Monday through Friday. For daily share price information twenty-four hours a day, visit www.greencentury.com.
What were the Fund costs for the last year?
(Based on a hypothetical $10,000 investment)
The below table explains the costs that you would have paid within the reporting period.
| Fund (Class) | Costs of a $10,000 investment | Costs paid as a percentage of a $10,000 investment |
| Green Century Balanced Fund (Institutional Class/GCBUX) |
$119 | 1.16% |
Management’s Discussion of Fund Performance
How did the Fund perform last year? What affected the Fund’s performance?
The Green Century Balanced Fund seeks capital growth and income from a diversified portfolio of stocks and bonds that meet Green Century’s standards for corporate environmental responsibility. We seek to achieve the fund’s investment objective by investing between 55% to 70% of the fund’s net assets in value in multi-capitalization stocks and 30% to 45% in investment-grade quality bonds.
The Fund’s investments focus on companies with strong environmental, social, and governance practices that may enhance corporate profitability and reduce certain types of risks. The Fund specifically avoids risks associated with exposure to fossil fuels, including traditional fossil-fuel based energy and utility companies. The Fund focuses on companies with strong balance sheets, strategic leadership in their products and markets, and strong environmental, social, and governance policies; these companies have greater financial flexibility to navigate choppy and volatile economic conditions.
In line with its environmental mandate, the Fund had exposure to what Green Century considers environmental leaders in a number of industries including Healthy Living, Capital Goods, and Transportation. The Fund has broad exposure to information technology, health care, financial, consumer, and industrial companies.
In addition to its equity exposure to environmental leaders, the Fund invests in designated Green Bonds and designated Social Impact Bonds. The issuers of Green Bonds have indicated that the proceeds from the bonds will be used for environmentally positive goals such as greenhouse gas reduction, climate adaptation, and climate change mitigation. Issuers of designated Social Impact Bonds have indicated that the proceeds from the bonds will be used for projects supporting such issues as poverty alleviation, low-income housing, fair trade, and community development.
The fund’s performance for the year was shaped by its continued cautious positioning, a deliberate approach taken in light of anticipated economic challenges related to tariffs. This cautious allocation resulted in the fund underperforming its benchmark during the reporting period from August 1, 2024 to July 31, 2025.
Within equities, performance was influenced by the continuation of a highly concentrated market environment, with gains largely driven by a small number of very large-capitalization companies. And although the administration initially introduced reduced clean energy incentives, the potential for interest rate cuts continued to support the interest-rate-sensitive clean energy stocks.
Our fixed income exposure outperformed the benchmark for the year, supported by our structural overweight to corporate bonds relative to government bonds. The fund’s high-quality and moderate duration fixed income exposure kept pace with its fixed income benchmark and the designated Green, Sustainable or Social Impact bonds held by the fund continued to trade well.
Fund Performance
The following graph compares the initial and subsequent account values at the end of each of the most recently completed 10 fiscal years of the Fund. It assumes a $250,000 initial investment at the beginning of the first fiscal year in an appropriate broad-based securities market index for the same period. Institutional Shares were offered as of November 28, 2020. The Institutional Share Class performance prior to November 28, 2020 reflects the performance of the Fund’s Individual Investor Class.
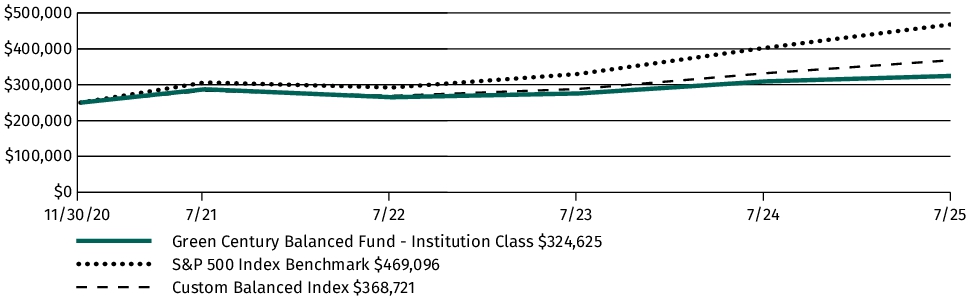
| AVERAGE ANNUAL TOTAL RETURN | 1 Year | 5 Years | 10 Years |
| Green Century Balanced Fund (Institutional Class/GCBUX) | 4.94% | 7.18% | 6.83% |
| S&P 500 Index Benchmark1,2 | 16.33% | 15.88% | 13.66% |
| Custom Balanced Index3,4 | 10.99% | 9.61% | 8.93% |
| 1 |
The Regulatory Index is provided as a broad measure of market performance. |
| 2 |
The S&P 500 Index is an unmanaged index of 500 stocks |
| 3 |
The Performance Index is provided because the advisor believes it is more reflective of the fund’s investment strategy. The investment return and principal value of shares of the Fund fluctuate, so your shares, when sold, may be worth more or less than their original cost. |
| 4 |
The Custom Balanced Index is comprised of a 60% weighting in the S&P 1500 Index and a 40% weighting in the BofA Merrill Lynch 1-10 Year US Corporate & Government Index |
Key Fund Statistics
The following table outlines key fund statistic that you should pay attention to
| Fund net assets | $379 mil. |
| Total number of portfolio holdings | 104 |
| Total advisory fees paid (net) | $2.5 mil. |
| Portfolio turnover rate as of the end of the reporting period | 23% |
Graphical Representation of Holdings
The tables below show the investment make up of the Fund, representing percentage of total net assets of the Fund. The Top Ten Holdings and Sector Allocation exclude short-term holdings, if any. The Sector Allocation chart represents Common Stocks of the Fund.
Top Ten Holdings
| Microsoft Corporation | 5.5% |
| NVIDIA Corporation | 5.4% |
| Apple, Inc. | 3.3% |
| Alphabet, Inc., Class A | 3.2% |
| Mastercard, Inc., Class A | 2.2% |
| Costco Wholesale Corporation | 1.6% |
| Alphabet, Inc. | 1.4% |
| Export Development Canada | 1.4% |
| International Bank for Reconstruction & Development | 1.3% |
| Netflix, Inc. | 1.3% |
Sector Allocation

Asset Allocation
Top Ten Holdings
| Microsoft Corporation | 5.5% |
| NVIDIA Corporation | 5.4% |
| Apple, Inc. | 3.3% |
| Alphabet, Inc., Class A | 3.2% |
| Mastercard, Inc., Class A | 2.2% |
| Costco Wholesale Corporation | 1.6% |
| Alphabet, Inc. | 1.4% |
| Export Development Canada | 1.4% |
| International Bank for Reconstruction & Development | 1.3% |
| Netflix, Inc. | 1.3% |
For information on the Green Century Funds®, call 1-800-93-GREEN. For information on how to open an account and account services, call 1-800-221-5519 8:00 am to 6:00 pm Eastern Time, Monday through Friday. For daily share price information twenty-four hours a day, visit www.greencentury.com.
What were the Fund costs for the last year?
(Based on a hypothetical $10,000 investment)
The below table explains the costs that you would have paid within the reporting period.
| Fund (Class) | Costs of a $10,000 investment | Costs paid as a percentage of a $10,000 investment |
| Green Century Equity Fund (Individual Investor Class/GCEQX) |
$129 | 1.20% |
Management’s Discussion of Fund Performance
How did the Fund perform last year? What affected the Fund’s performance?
The Investor share class of the Green Century Equity Fund returned 14.36%, for the one year period ended July 31, 2025. Over the same time period, the S&P 500 Index returned 16.33%. The strongest performing sectors in the Equity Fund were Information Technology, Financials, and Consumer Discretionary, which returned 27.5%, 20.3%, and 17.2%, respectively. The worst performing sectors were Health Care, Consumer Staples, and Utilities, which returned -10.7%, -7.5%, and 0.5% respectively, for the year. Within the S&P 500 Index, Communication Services, Information Technology, and Financials were the strongest performing sectors, gaining 31.3%, 23.6%, and 21.5%, respectively. The worst performing sectors were Health Care, Energy, and Materials, which returned
-11.3%, -5.4%, and -3.3%, respectively, for the year.
-11.3%, -5.4%, and -3.3%, respectively, for the year.
Energy Transfer
The Energy sector returned -3.25% over the trailing twelve-month period. Only the Health Care sector had worse performance.
U.S. Technology
U.S. technology and technology-like companies such as Netflix and Meta Platforms continued to drive strong returns within the U.S. market. The fund’s overweights to the Information Technology and Communication Services sectors continue to positively benefit the fund’s performance.
Old and New Economies
The fund remains relatively neutral in terms of relative sector weights to Financials, Utilities, Industrials, and Real Estate, which did not have material impacts on the fund’s performance, which was driven by relative sector differences amongst Information Technology, Health Care, Consumer Staples, and Communication Services.
Fund Performance
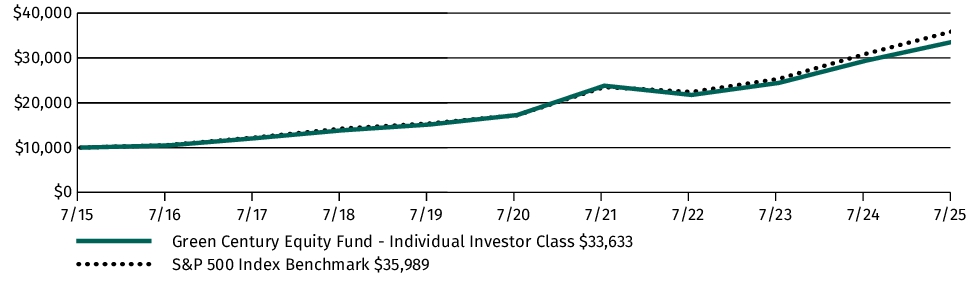
The following graph compares the initial and subsequent account values at the end of each of the most recently completed 10 fiscal years of the Fund. It assumes a $10,000 initial investment at the beginning of the first fiscal year in an appropriate broad-based securities market index for the same period.
| AVERAGE ANNUAL TOTAL RETURN | 1 Year | 5 Years | 10 Years |
| Green Century Equity Fund (Individual Investor Class/GCEQX) | 14.36% | 14.27% | 12.90% |
| S&P 500 Index1 | 16.33% | 15.88% | 13.66% |
| 1 |
The S&P 500 Index is an unmanaged index of 500 stocks |
Key Fund Statistics
The following table outlines key fund statistic that you should pay attention to
| Fund net assets | $715 mil. |
| Total number of portfolio holdings | 338 |
| Total advisory fees paid (net) | $1.4 mil. |
| Portfolio turnover rate as of the end of the reporting period | 8% |
Graphical Representation of Holdings
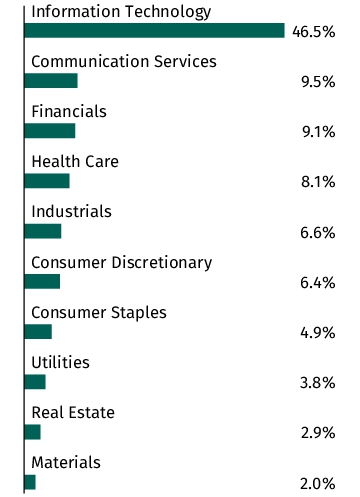
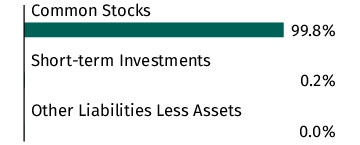
The tables below show the investment make up of the Fund, representing percentage of total net assets of the Fund. The Top Ten Holdings and Sector Allocation exclude short-term holdings, if any. The Sector Allocation chart represents Common Stocks of the Fund.
Top Ten Holdings
| NVIDIA Corporation | 15.9% |
| Microsoft Corporation | 13.7% |
| Alphabet, Inc., Class A | 4.1% |
| Alphabet, Inc., Class C | 3.5% |
| Tesla, Inc. | 3.3% |
| Visa, Inc., Class A | 2.3% |
| Mastercard, Inc., Class A | 1.8% |
| Home Depot, Inc. (The) | 1.4% |
| Procter & Gamble Company (The) | 1.4% |
| AbbVie, Inc. | 1.3% |
Sector Allocation

Asset Allocation

Top Ten Holdings
| NVIDIA Corporation | 15.9% |
| Microsoft Corporation | 13.7% |
| Alphabet, Inc., Class A | 4.1% |
| Alphabet, Inc., Class C | 3.5% |
| Tesla, Inc. | 3.3% |
| Visa, Inc., Class A | 2.3% |
| Mastercard, Inc., Class A | 1.8% |
| Home Depot, Inc. (The) | 1.4% |
| Procter & Gamble Company (The) | 1.4% |
| AbbVie, Inc. | 1.3% |
For information on the Green Century Funds®, call 1-800-93-GREEN. For information on how to open an account and account services, call 1-800-221-5519 8:00 am to 6:00 pm Eastern Time, Monday through Friday. For daily share price information twenty-four hours a day, visit www.greencentury.com.
What were the Fund costs for the last year?
(Based on a hypothetical $10,000 investment)
The below table explains the costs that you would have paid within the reporting period.
| Fund (Class) | Costs of a $10,000 investment | Costs paid as a percentage of a $10,000 investment |
| Green Century Equity Fund (Institutional Class/GCEUX) |
$97 | 0.90% |
Management’s Discussion of Fund Performance
How did the Fund perform last year? What affected the Fund’s performance?
The Institutional share class of the Green Century Equity Fund returned 14.71%, for the one year period ended July 31, 2025. Over the same time period, the S&P 500 Index returned 16.33%. The strongest performing sectors in the Equity Fund were Information Technology, Financials, and Consumer Discretionary, which returned 27.5%, 20.3%, and 17.2%, respectively. The worst performing sectors were Health Care, Consumer Staples, and Utilities, which returned -10.7%, -7.5%, and 0.5% respectively, for the year. Within the S&P 500 Index, Communication Services, Information Technology, and Financials were the strongest performing sectors, gaining 31.3%, 23.6%, and 21.5%, respectively. The worst performing sectors were Health Care, Energy, and Materials, which returned
-11.3%, -5.4%, and -3.3%, respectively, for the year.
-11.3%, -5.4%, and -3.3%, respectively, for the year.
Energy Transfer
The Energy sector returned -3.25% over the trailing twelve-month period. Only the Health Care sector had worse performance.
U.S. Technology
U.S. technology and technology-like companies such as Netflix and Meta Platforms continued to drive strong returns within the U.S. market. The fund’s overweights to the Information Technology and Communication Services sectors continue to positively benefit the fund’s performance.
Old and New Economies
The fund remains relatively neutral in terms of relative sector weights to Financials, Utilities, Industrials, and Real Estate, which did not have material impacts on the fund’s performance, which was driven by relative sector differences amongst Information Technology, Health Care, Consumer Staples, and Communication Services.
Fund Performance
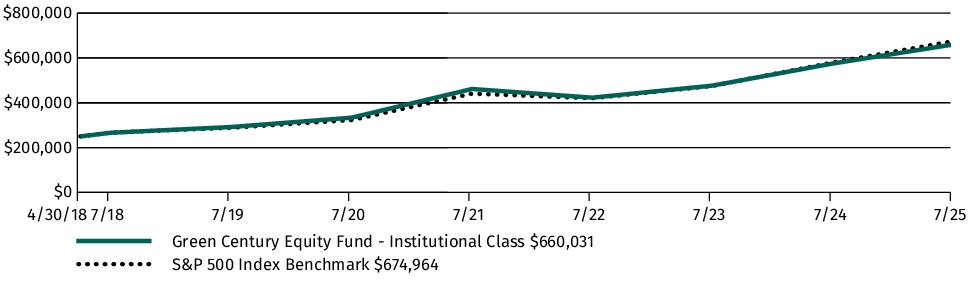
The following graph compares the initial and subsequent account values at the end of each of the most recently completed 10 fiscal years of the Fund. It assumes a $250,000 initial investment at the beginning of the first fiscal year in an appropriate broad-based securities market index for the same period. The Institutional Share Class performance for periods prior to April 30, 2018 reflects the performance of the Fund’s Individual Investor Class.
| AVERAGE ANNUAL TOTAL RETURN | 1 Year | 5 Years | 10 Years |
| Green Century Equity Fund (Institutional Class/GCEUX) | 14.71% | 14.62% | 13.14% |
| S&P 500 Index1 | 16.33% | 15.88% | 13.66% |
| 1 |
The S&P 500 Index is an unmanaged index of 500 stocks |
Key Fund Statistics
The following table outlines key fund statistic that you should pay attention to
| Fund net assets | $715 mil. |
| Total number of portfolio holdings | 338 |
| Total advisory fees paid (net) | $1.4 mil. |
| Portfolio turnover rate as of the end of the reporting period | 8% |
Graphical Representation of Holdings
The tables below show the investment make up of the Fund, representing percentage of total net assets of the Fund. The Top Ten Holdings and Sector Allocation exclude short-term holdings, if any. The Sector Allocation chart represents Common Stocks of the Fund.
Top Ten Holdings
| NVIDIA Corporation | 15.9% |
| Microsoft Corporation | 13.7% |
| Alphabet, Inc., Class A | 4.1% |
| Alphabet, Inc., Class C | 3.5% |
| Tesla, Inc. | 3.3% |
| Visa, Inc., Class A | 2.3% |
| Mastercard, Inc., Class A | 1.8% |
| Home Depot, Inc. (The) | 1.4% |
| Procter & Gamble Company (The) | 1.4% |
| AbbVie, Inc. | 1.3% |
Sector Allocation
Asset Allocation
Top Ten Holdings
| NVIDIA Corporation | 15.9% |
| Microsoft Corporation | 13.7% |
| Alphabet, Inc., Class A | 4.1% |
| Alphabet, Inc., Class C | 3.5% |
| Tesla, Inc. | 3.3% |
| Visa, Inc., Class A | 2.3% |
| Mastercard, Inc., Class A | 1.8% |
| Home Depot, Inc. (The) | 1.4% |
| Procter & Gamble Company (The) | 1.4% |
| AbbVie, Inc. | 1.3% |
For information on the Green Century Funds®, call 1-800-93-GREEN. For information on how to open an account and account services, call 1-800-221-5519 8:00 am to 6:00 pm Eastern Time, Monday through Friday. For daily share price information twenty-four hours a day, visit www.greencentury.com.
What were the Fund costs for the last year?
(Based on a hypothetical $10,000 investment)
The below table explains the costs that you would have paid within the reporting period.
| Fund (Class) | Costs of a $10,000 investment | Costs paid as a percentage of a $10,000 investment |
| Green Century MSCI International Index Fund (Individual Investor Class/GCINX) |
$131 | 1.28% |
Management’s Discussion of Fund Performance
How did the Fund perform last year? What affected the Fund’s performance?
The Investor share class of the Green Century MSCI International Index Fund returned 4.96%, for the one year period ended July 31, 2025. Over the same time period, the MSCI World ex USA Index returned 13.70%. The strongest performing sectors in the International Fund were Financials, Consumer Discretionary, and Industrials, which returned 27.2%, 14.0%, and 12.1%, respectively. The worst performing sectors were Health Care, Utilities, and Real Estate, which returned -35.6%, -9.8%, and +1.78% respectively, for the year. Within the MSCI World ex USA Index, Financials, Communication Services, and Industrials were the strongest performing sectors, gaining 36.2%, 29.0%, and 23.2%, respectively. The worst performing sectors were Health Care, Materials, and Consumer Discretionary, which returned -10.8%, 2.6%, and 3.6%, respectively, for the year.
Energy Transfer
Despite a positive return for the Energy sector during the trailing twelve-month period, the fund’s exclusion of larger companies that underperformed was beneficial to returns. The underweight to Utilities detracted from performance due to strong overall performance within the sector.
International Technology
Non-US IT companies had modest positive performance overall but with wide dispersion of performance within the sector, a departure from concentrated returns within the U.S. information technology sector.
Old and New Economies
The fund benefitted from overweights to Financials (slight overweights to Industrials and Materials) as well as underweights to Health Care. While overweight information technology, relative to the Index the impact was a slight drag on performance due to overweights to a few companies that underperformed.
Fund Performance
The following graph compares the initial and subsequent account values at the end of each of the most recently completed 10 fiscal years of the Fund. It assumes a $10,000 initial investment at the beginning of the first fiscal year in an appropriate broad-based securities market index for the same period.
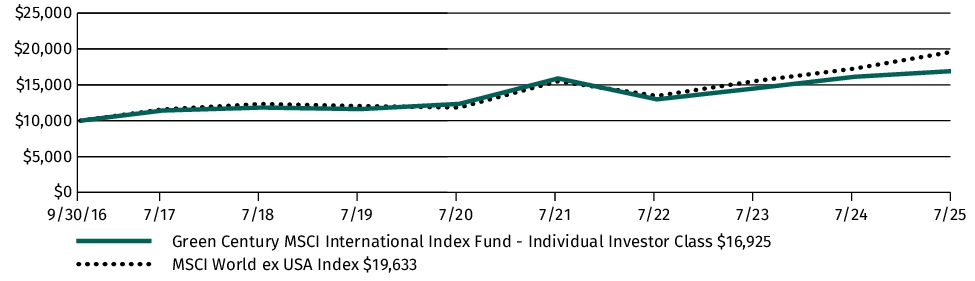
| AVERAGE ANNUAL TOTAL RETURN | 1 Year | 5 Years | Since Inception1 |
| Green Century MSCI International Index Fund (Individual Investor Class/GCINX) | 4.96% | 6.51% | 6.14% |
| MSCI World ex USA Index2 | 13.70% | 10.65% | 7.94% |
| 1 |
Inception Date September 30, 2016 |
| 2 |
The MSCI World EX USA Index is a custom index calculated by MSCI Inc. The index includes large and mid-cap stocks across 22 of 23 Developed Markets countries and excludes the United States |
Key Fund Statistics
The following table outlines key fund statistic that you should pay attention to
| Fund net assets | $165 mil. |
| Total number of portfolio holdings | 184 |
| Total advisory fee paid (net) | $496 k. |
| Portfolio turnover rate as of the end of the reporting period | 20% |
Graphical Representation of Holdings
The tables below show the investment make up of the Fund, representing percentage of total net assets of the Fund. The Top Ten Holdings and Country Allocation exclude short-term holdings, if any. The Country Allocation chart represents Common Stocks of the Fund.
Top Ten Holdings
| ASML Holding NV | 4.4% |
| Unilever PLC | 3.0% |
| Novo Nordisk A/S, Class B | 2.9% |
| Schneider Electric SE | 2.9% |
| Hitachi Ltd. | 2.5% |
| Sony Group Corporation | 2.2% |
| ABB Ltd. | 2.1% |
| Zurich Insurance Group AG | 2.1% |
| AIA Group Ltd. | 2.1% |
| RELX PLC | 2.0% |
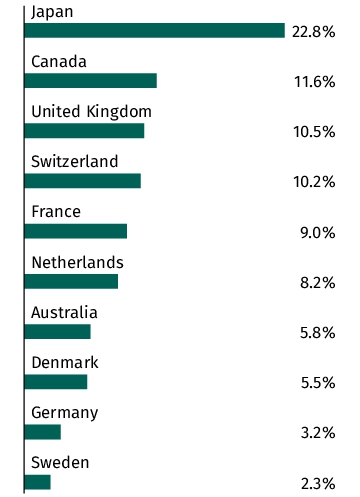
Top Ten Country Allocation

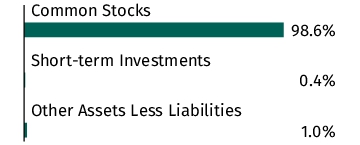
Asset Allocation

Top Ten Holdings
| ASML Holding NV | 4.4% |
| Unilever PLC | 3.0% |
| Novo Nordisk A/S, Class B | 2.9% |
| Schneider Electric SE | 2.9% |
| Hitachi Ltd. | 2.5% |
| Sony Group Corporation | 2.2% |
| ABB Ltd. | 2.1% |
| Zurich Insurance Group AG | 2.1% |
| AIA Group Ltd. | 2.1% |
| RELX PLC | 2.0% |
For information on the Green Century Funds®, call 1-800-93-GREEN. For information on how to open an account and account services, call 1-800-221-5519 8:00 am to 6:00 pm Eastern Time, Monday through Friday. For daily share price information twenty-four hours a day, visit www.greencentury.com.
What were the Fund costs for the last year?
(Based on a hypothetical $10,000 investment)
The below table explains the costs that you would have paid within the reporting period.
| Fund (Class) | Costs of a $10,000 investment | Costs paid as a percentage of a $10,000 investment |
| Green Century MSCI International Index Fund (Institutional Class/GCIFX) |
$101 | 0.98% |
Management’s Discussion of Fund Performance
How did the Fund perform last year? What affected the Fund’s performance?
The Institutional share class of the Green Century MSCI International Index Fund returned 5.24%, for the one year period ended July 31, 2025. Over the same time period, the MSCI World ex USA Index returned 13.70%. The strongest performing sectors in the International Fund were Financials, Consumer Discretionary, and Industrials, which returned 27.2%, 14.0%, and 12.1%, respectively. The worst performing sectors were Health Care, Utilities, and Real Estate, which returned -35.6%, -9.8%, and +1.78% respectively, for the year. Within the MSCI World ex USA Index, Financials, Communication Services, and Industrials were the strongest performing sectors, gaining 36.2%, 29.0%, and 23.2%, respectively. The worst performing sectors were Health Care, Materials, and Consumer Discretionary, which returned -10.8%, 2.6%, and 3.6%, respectively, for the year.
Energy Transfer
Despite a positive return for the Energy sector during the trailing twelve-month period, the fund’s exclusion of larger companies that underperformed was beneficial to returns. The underweight to Utilities detracted from performance due to strong overall performance within the sector.
International Technology
Non-US IT companies had modest positive performance overall but with wide dispersion of performance within the sector, a departure from concentrated returns within the U.S. information technology sector.
Old and New Economies
The fund benefitted from overweights to Financials (slight overweights to Industrials and Materials) as well as underweights to Health Care. While overweight information technology, relative to the Index the impact was a slight drag on performance due to overweights to a few companies that underperformed.
Fund Performance
The following graph compares the initial and subsequent account values at the end of each of the most recently completed 10 fiscal years of the Fund. It assumes a $250,000 initial investment at the beginning of the first fiscal year in an appropriate broad-based securities market index for the same period.
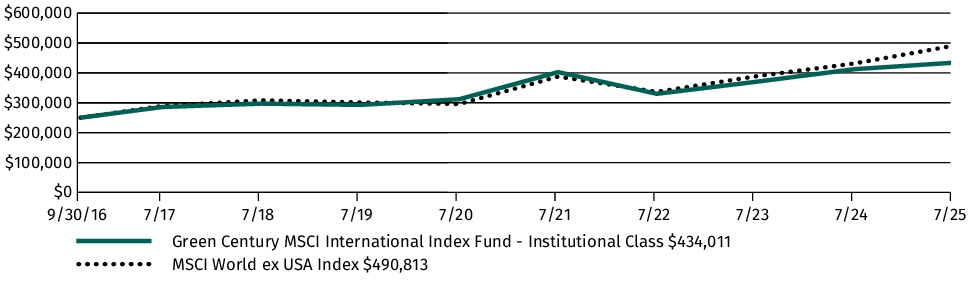
| AVERAGE ANNUAL TOTAL RETURN | 1 Year | 5 Years | Since Inception1 |
| Green Century MSCI International Index Fund (Institutional Class/GCIFX) | 5.24% | 6.83% | 6.44% |
| MSCI World ex USA Index2 | 13.70% | 10.65% | 7.94% |
| 1 |
Inception Date September 30, 2016 |
| 2 |
The MSCI World EX USA Index is a custom index calculated by MSCI Inc. The index includes large and mid-cap stocks across 22 of 23 Developed Markets countries and excludes the United States |
Key Fund Statistics
The following table outlines key fund statistic that you should pay attention to
| Fund net assets | $165 mil. |
| Total number of portfolio holdings | 184 |
| Total advisory fee paid (net) | $496 k. |
| Portfolio turnover rate as of the end of the reporting period | 20% |
Graphical Representation of Holdings
The tables below show the investment make up of the Fund, representing percentage of total net assets of the Fund. The Top Ten Holdings and Country Allocation exclude short-term holdings, if any. The Country Allocation chart represents Common Stocks of the Fund.
Top Ten Holdings
| ASML Holding NV | 4.4% |
| Unilever PLC | 3.0% |
| Novo Nordisk A/S, Class B | 2.9% |
| Schneider Electric SE | 2.9% |
| Hitachi Ltd. | 2.5% |
| Sony Group Corporation | 2.2% |
| ABB Ltd. | 2.1% |
| Zurich Insurance Group AG | 2.1% |
| AIA Group Ltd. | 2.1% |
| RELX PLC | 2.0% |
Top Ten Country Allocation
Asset Allocation
Top Ten Holdings
| ASML Holding NV | 4.4% |
| Unilever PLC | 3.0% |
| Novo Nordisk A/S, Class B | 2.9% |
| Schneider Electric SE | 2.9% |
| Hitachi Ltd. | 2.5% |
| Sony Group Corporation | 2.2% |
| ABB Ltd. | 2.1% |
| Zurich Insurance Group AG | 2.1% |
| AIA Group Ltd. | 2.1% |
| RELX PLC | 2.0% |