What were the Fund costs for the past year
(based on a hypothetical $10,000 investment)
Fund Name | Costs of a $10,000 investment | Costs paid as a percentage of a $10,000 investment |
|---|---|---|
Grizzle Growth ETF | $84 | 0.75% |
How did the Fund perform last year and what affected its performance?
For the fiscal year ended July 31st, 2025, the Fund saw a 25.38% total return compared to the benchmark, the S&P 500® Index, seeing a 16.33% total return. Compared to the benchmark, the portfolio outperformed by 9.05%.
The top contributing sectors for the annual period ending July 31st, 2025, were the industrial and information technology sectors. The top detracting sectors were the financials and materials sectors. Nvidia (NVDA), Vertiv Holdings (VRT) and GE Vernova (GEV) were the top contributing stocks. ASML (ASML), Galaxy Digital (GLXY) and Hot Chili (HCH) were the top detracting stocks.
What Factors Influenced Performance
Based on our key investment objectives, we attempted to position the strategy with strong and consistent characteristic advantages versus the benchmark and relative to the overall market. Portfolio positions generally have higher revenue growth rates and higher margins, though many of them trade at premium valuations to companies in the benchmark. We believe valuations during the reporting period do not fully take future cashflows into account while pricing.
Positioning
During the reporting period, the market environment presented weakening economic growth and potential inflationary pressures, although we believe the Grizzle Growth ETF was well positioned utilizing a barbell portfolio approach of technology leaders and emerging disruptors. Tech leaders currently have funding and competitive advantage and have been buying emerging leaders, cementing their grip on industry market share. We believe owning companies at both ends of the competitive spectrum have contributed to dampened volatility while also offering upside through existing competitive advantages or through disruption of industry leaders.
For the commodity pillar of the fund, we believe the structural demand opportunity for natural gas is significant.
Cumulative Performance
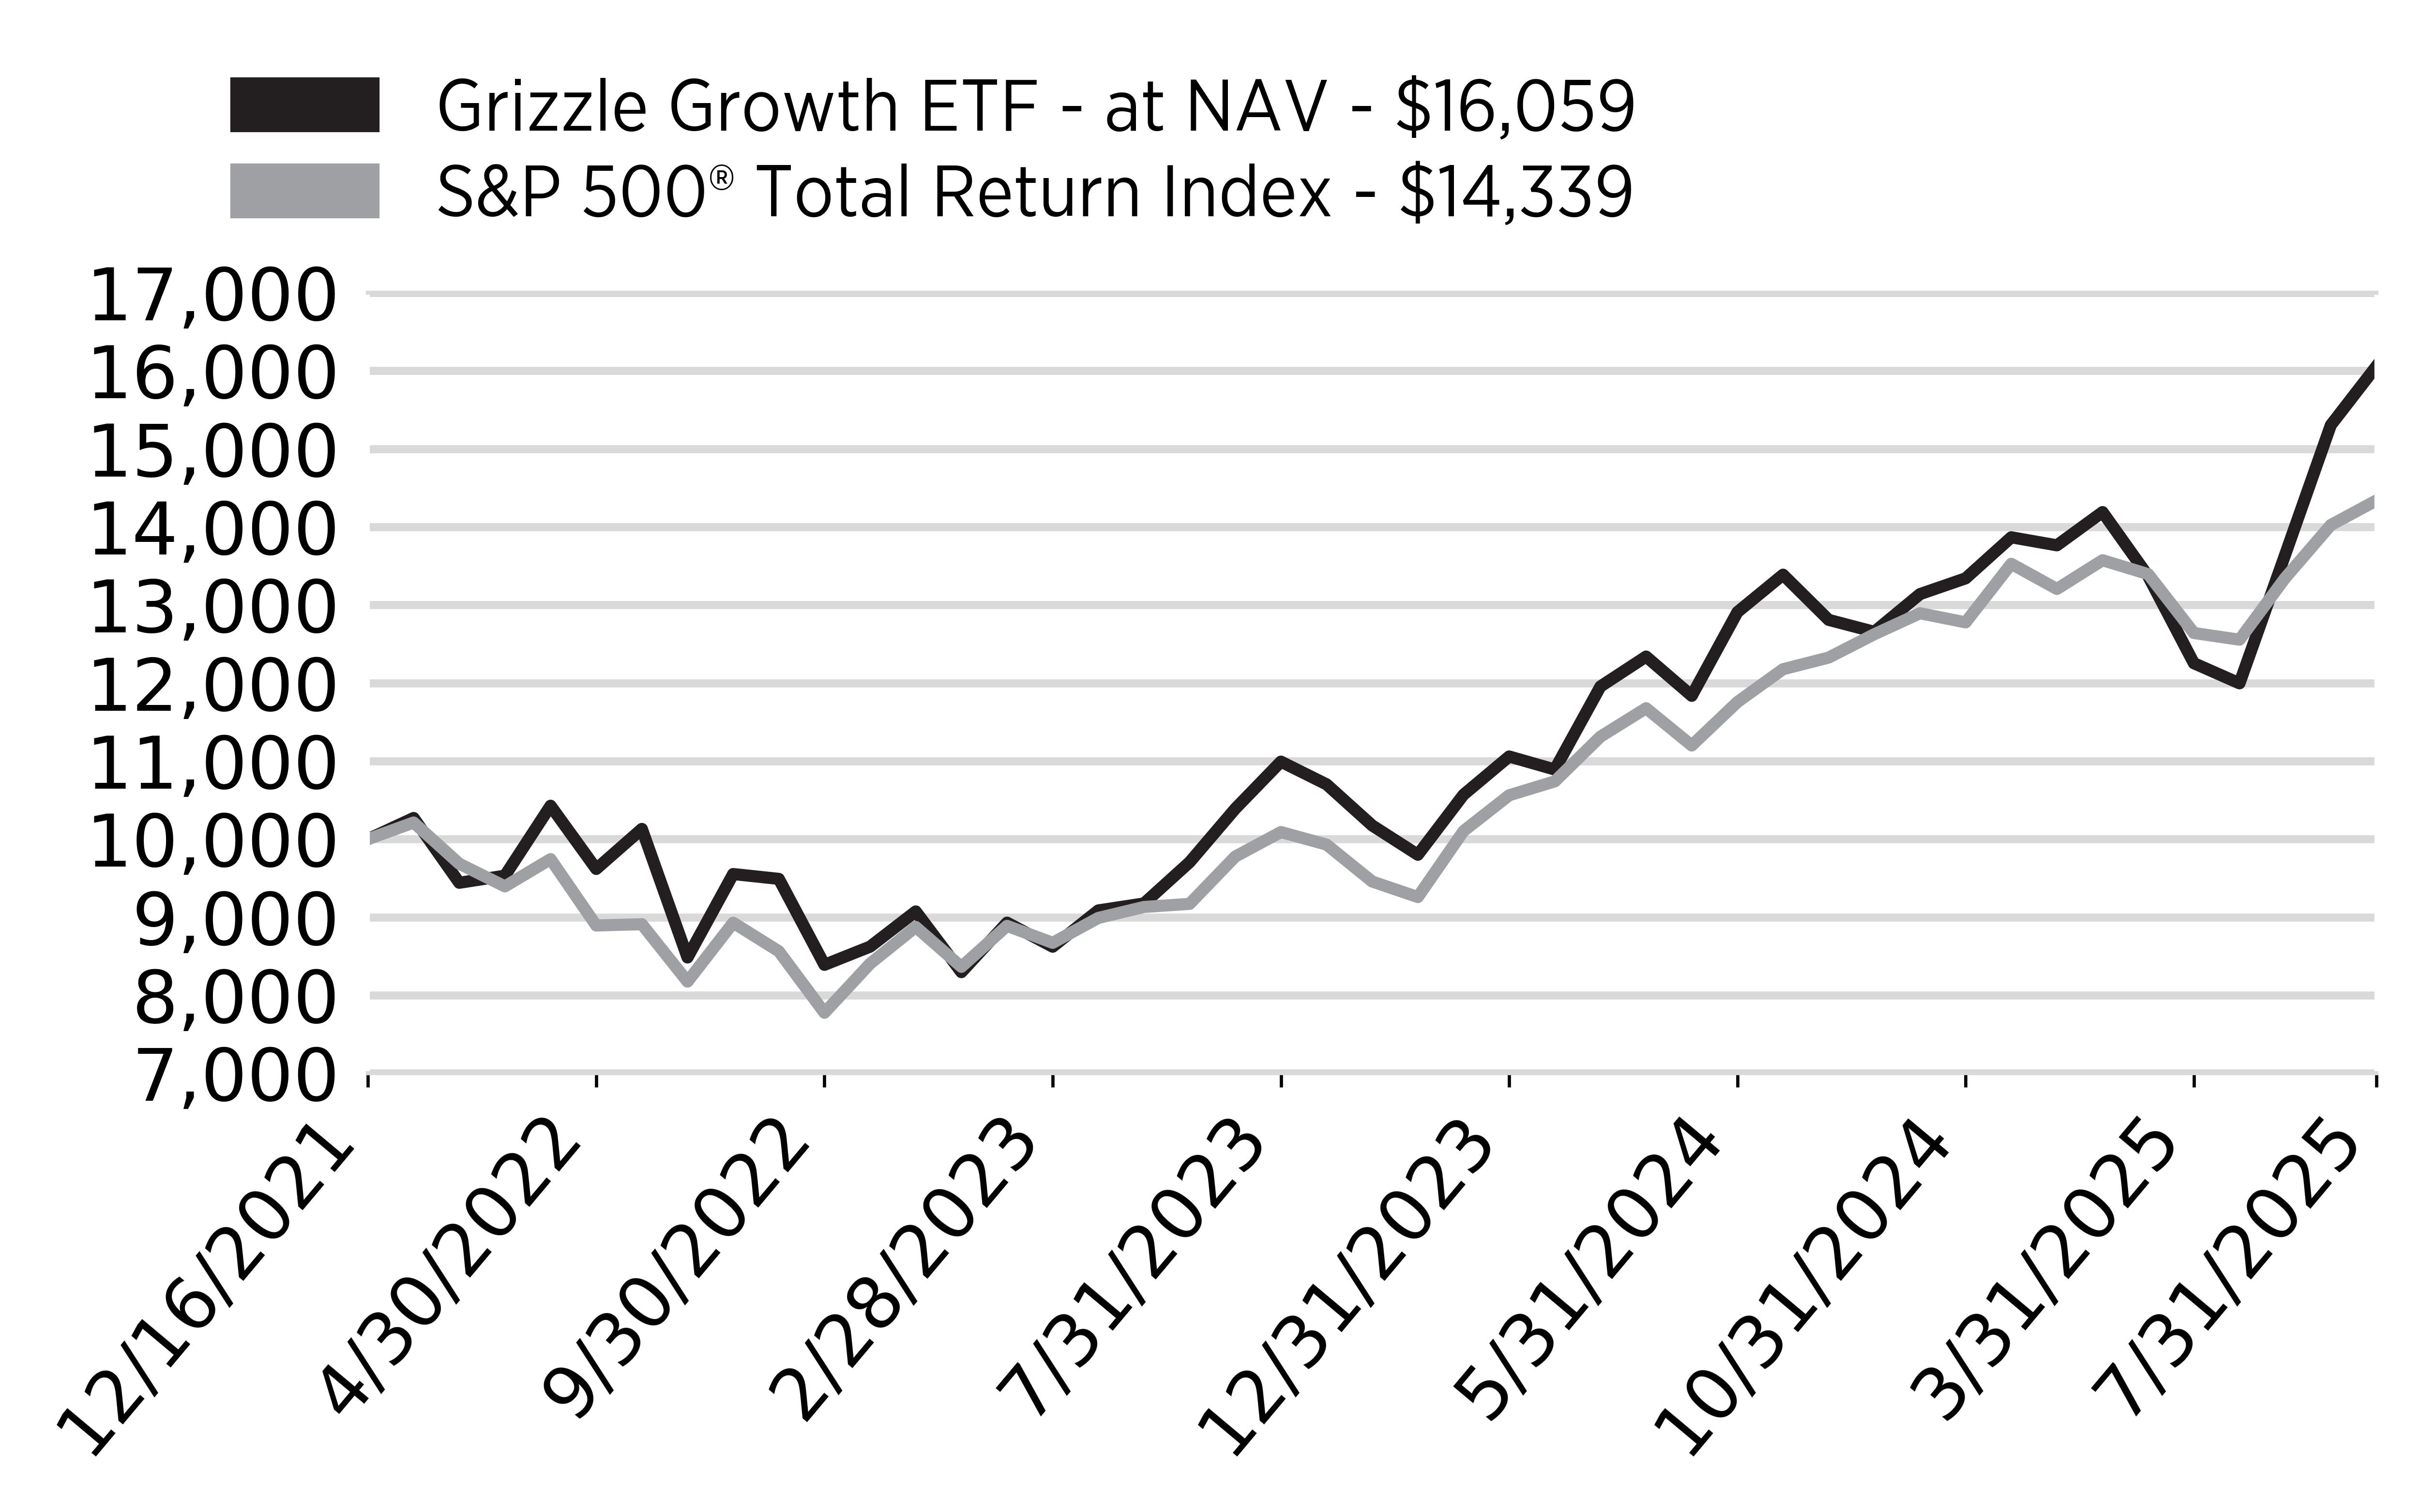
Annual Performance
Average Annual Returns for the Periods Ended July 31, 2025: | 1 year | 3 Year | Since Inception (12/16/21) |
|---|---|---|---|
Grizzle Growth ETF - at NAV | 25.38% | 18.90% | 13.97% |
S&P 500® Total Return Index | 16.33% | 17.10% | 10.46% |
Key Fund Statistics
(as of July 31, 2025)
Fund Size (Thousands) | $4,912 |
Number of Holdings | 36 |
Total Advisory Fee | $80,342 |
Portfolio Turnover Rate | 64% |
What did the Fund invest in?
(as of July 31, 2025)
Sector Breakdown - Investments
(% of net assets)
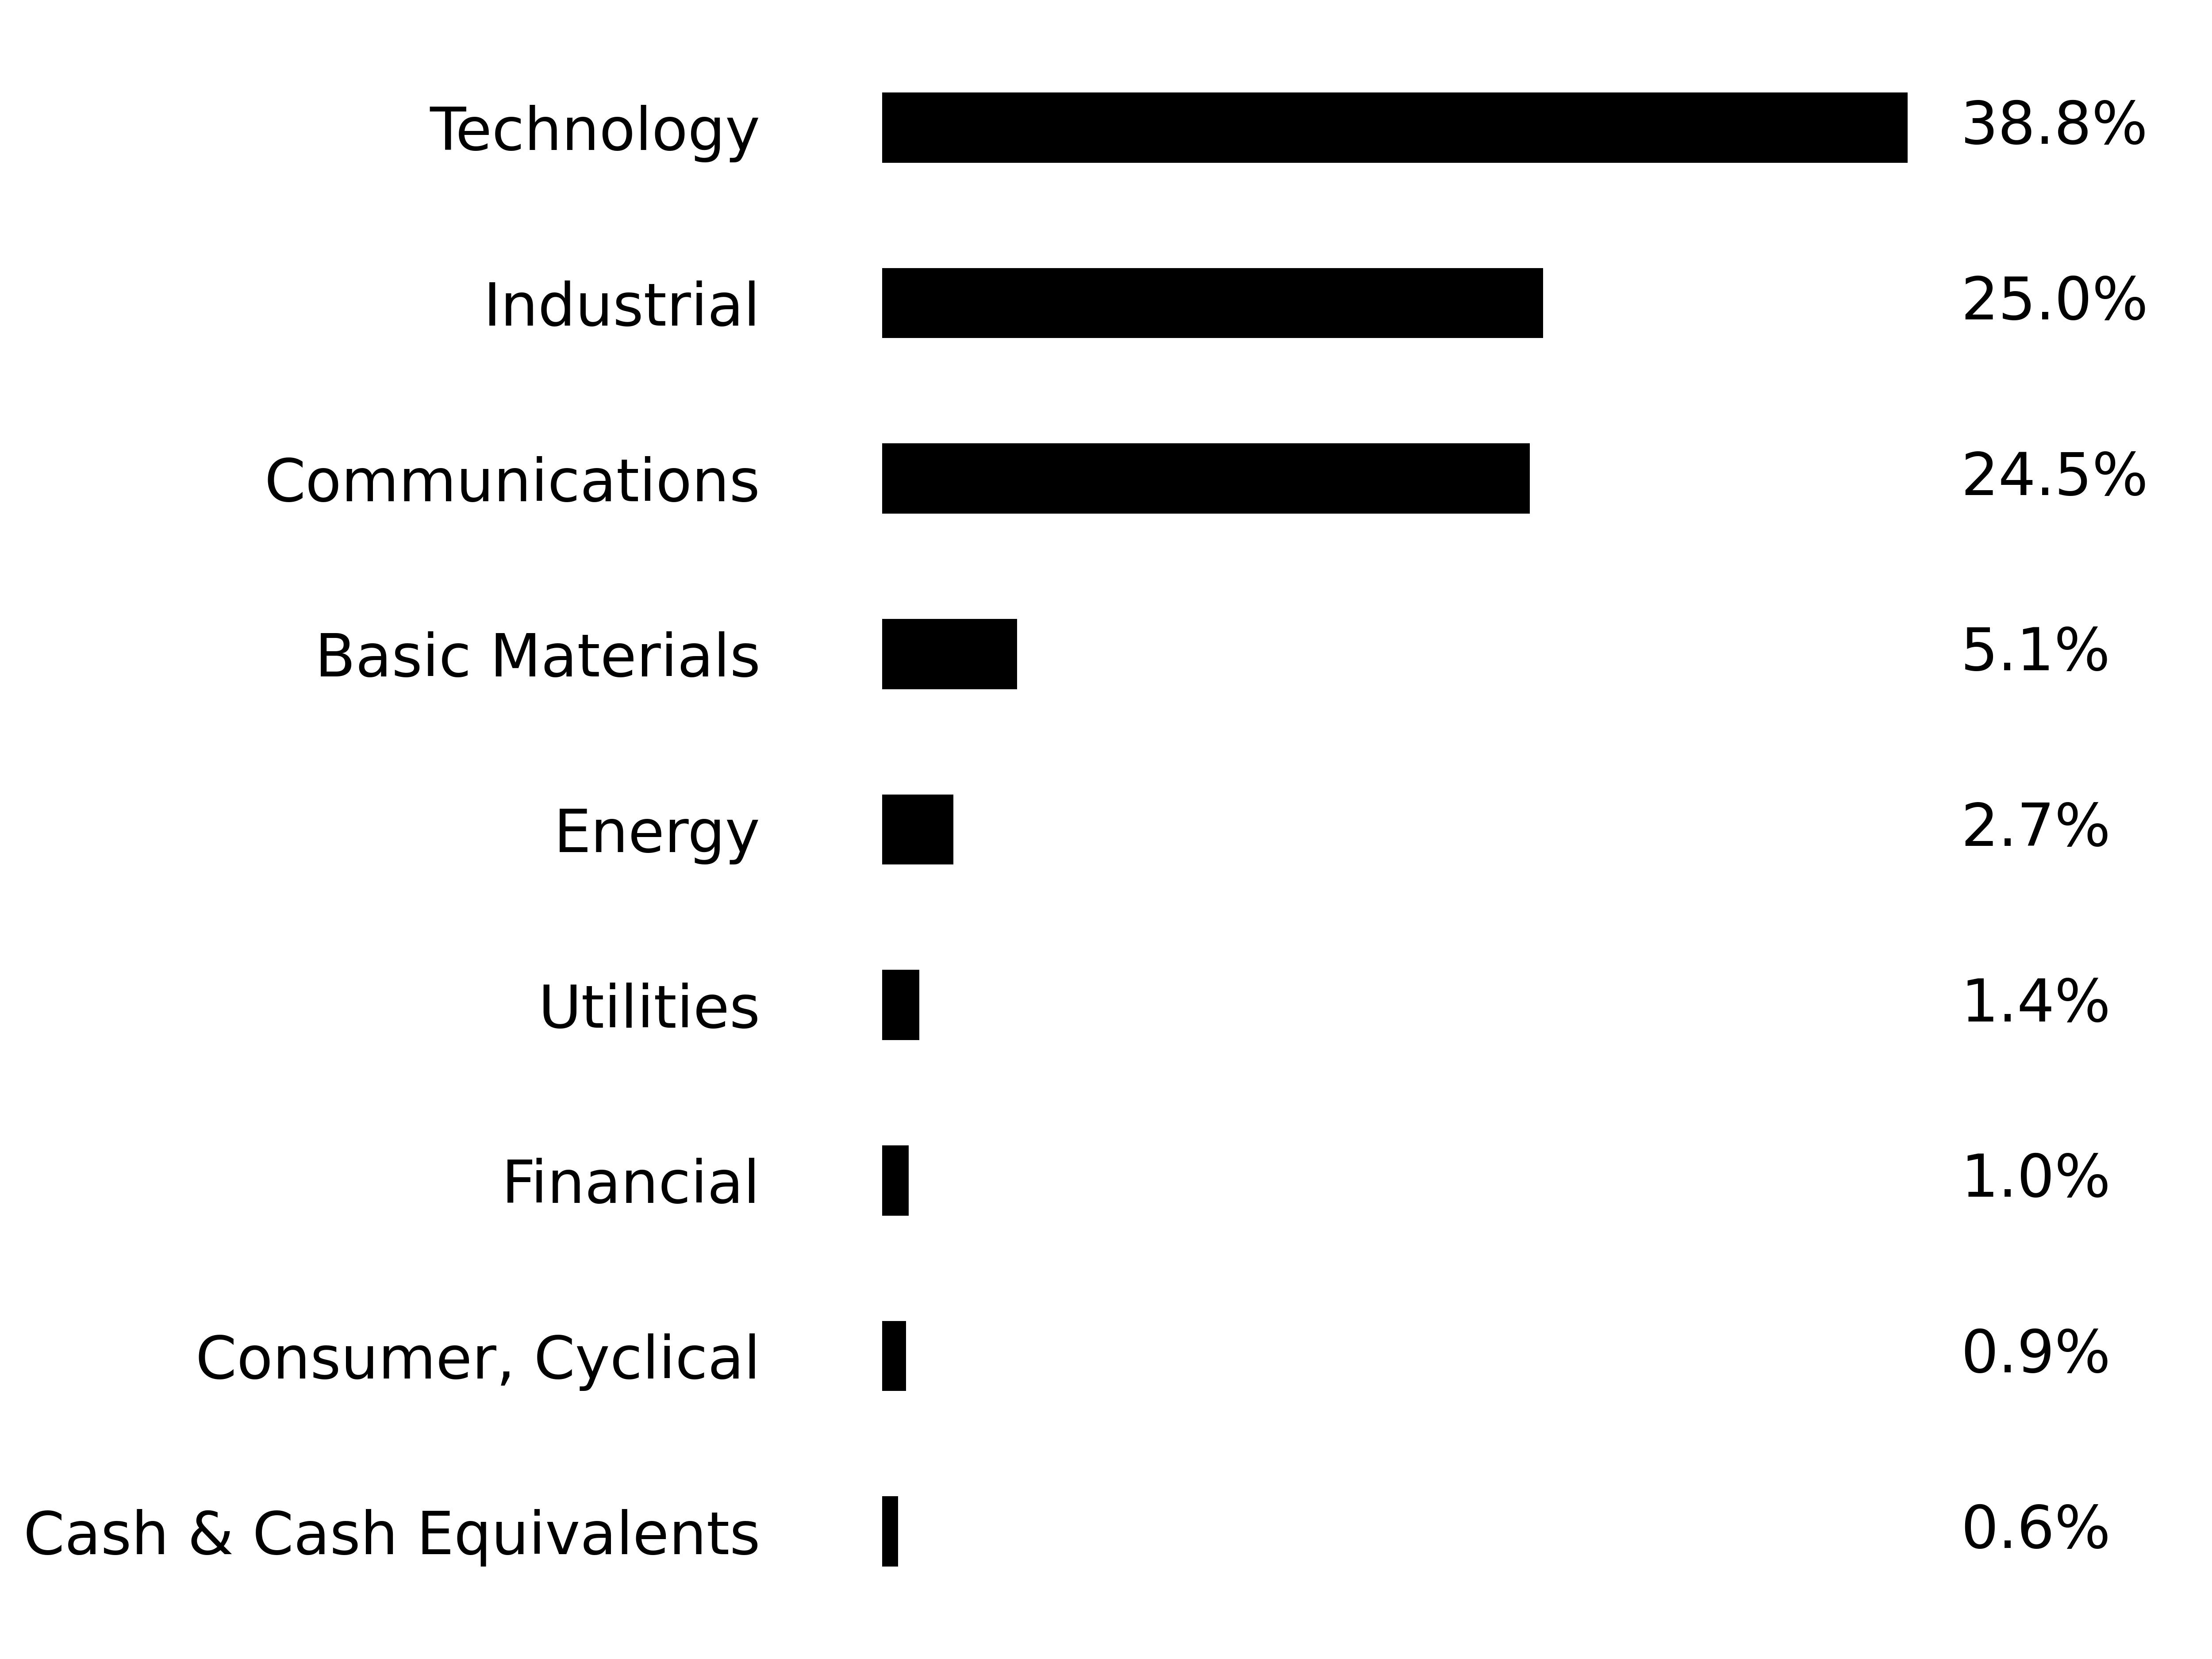
Percentages are based on total net assets. Cash & Cash Equivalents represents short-term investments and liabilities in excess of other assets
Top Ten Holdings | (Percentage of Net Assets) |
|---|---|
NVIDIA Corp. | |
Vertiv Holdings Co. - Class A | |
Alphabet, Inc. - Class A | |
Meta Platforms, Inc. - Class A | |
Trane Technologies PLC | |
GE Vernova, Inc. | |
Amazon.com, Inc. | |
Microsoft Corp. | |
Apple, Inc. | |
Arista Networks, Inc. |