What were the Fund costs since inception?
(based on a hypothetical $10,000 investment)
|
Fund Name
|
Costs of a $10,000 investment
|
Costs paid as a percentage of a $10,000 investment
|
|---|---|---|
|
Rockefeller California Municipal Bond ETF
|
$49
|
0.51%
|
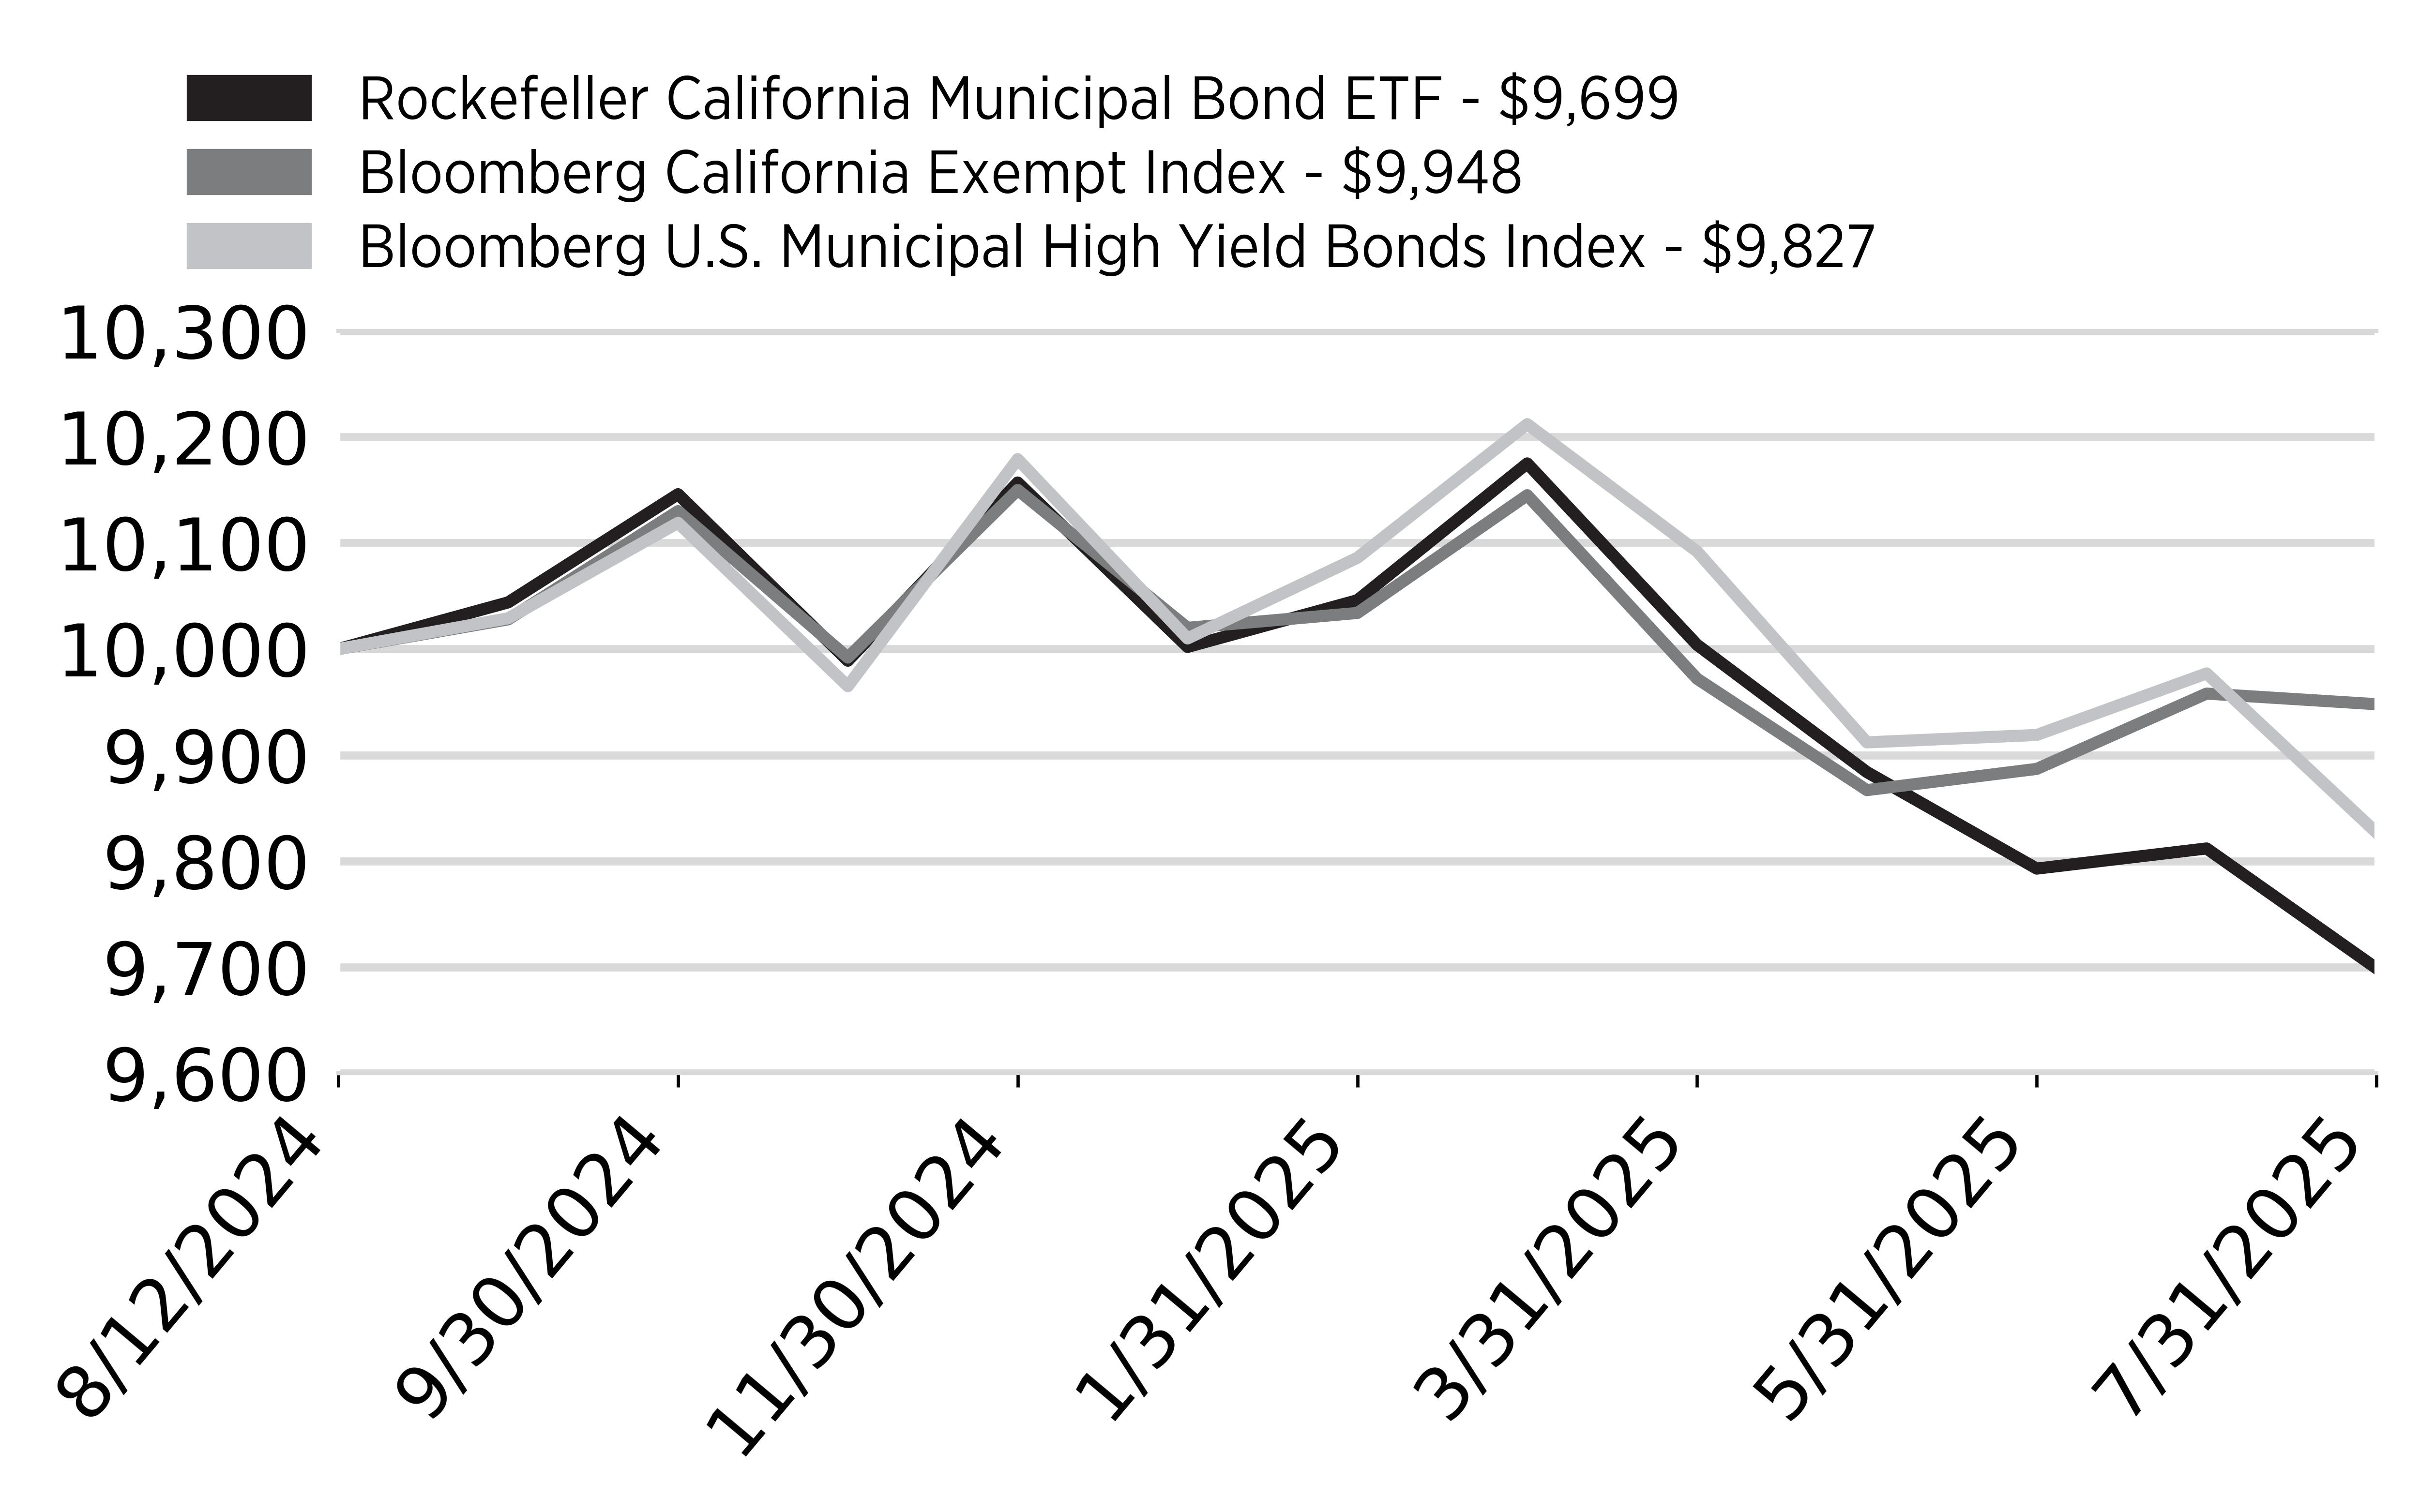
How did the Fund perform last year and what affected its performance?
From inception (8/12/24) through 7/31/25, the Fund returned -3.01%, underperforming its benchmark by 2.49%, primarily due to untimely outflows and longer duration exposure.
The portfolio’s longer duration relative to the benchmark contributed to underperformance amid rising long-end yields, though higher yield exposure helped offset some of the impact.
As of month-end, the Fund’s distribution yield was 4.95%, and credit fundamentals across the municipal market remain strong. The Fund maintains a bottom-up, credit-intensive strategy focused on yield-driven total return, recognizing that short-term volatility may occasionally outweigh income.
Cumulative Performance
Annual Performance
|
|
Since Inception
|
|---|---|
|
Rockefeller California Municipal Bond ETF
|
-3.01%
|
|
Bloomberg California Exempt Index
|
-0.52%
|
|
Bloomberg U.S. Municipal High Yield Bonds Index
|
-1.73%
|
Key Fund Statistics
(as of July 31, 2025)
|
Fund Size (Thousands)
|
$16,350
|
|
Number of Holdings
|
72
|
|
Total Advisory Fee
|
$75,733
|
|
Portfolio Turnover Rate
|
234%
|
|
Top Ten Holdings
|
(% of
net assets)
|
|---|---|
|
California School Facilities Financing Authority, 08/01/49
|
|
|
Silicon Valley Tobacco Securitization Authority,
Call 09/12/25
|
|
|
California State University, Call 11/01/35
|
|
|
California Health Facilities Financing Authority, Call 02/01/35
|
|
|
San Diego County Regional Airport Authority, Call 07/01/35
|
|
|
California Infrastructure & Economic Development Bank, Call 05/15/35
|
|
|
City of Los Angeles Department of Airports, Call 05/15/35
|
|
|
San Francisco City & County Airport Comm-
San Francisco International Airport
|
|
|
Burbank-Glendale-Pasadena Airport Authority Brick Campaign
|
|
|
Los Angeles Department of Water & Power Water System Revenue
|
What were the Fund costs since inception?
(based on a hypothetical $10,000 investment)
|
Fund Name
|
Costs of a $10,000 investment
|
Costs paid as a percentage of a $10,000 investment
|
|---|---|---|
|
Rockefeller Global Equity ETF
|
$45
|
0.55%
|
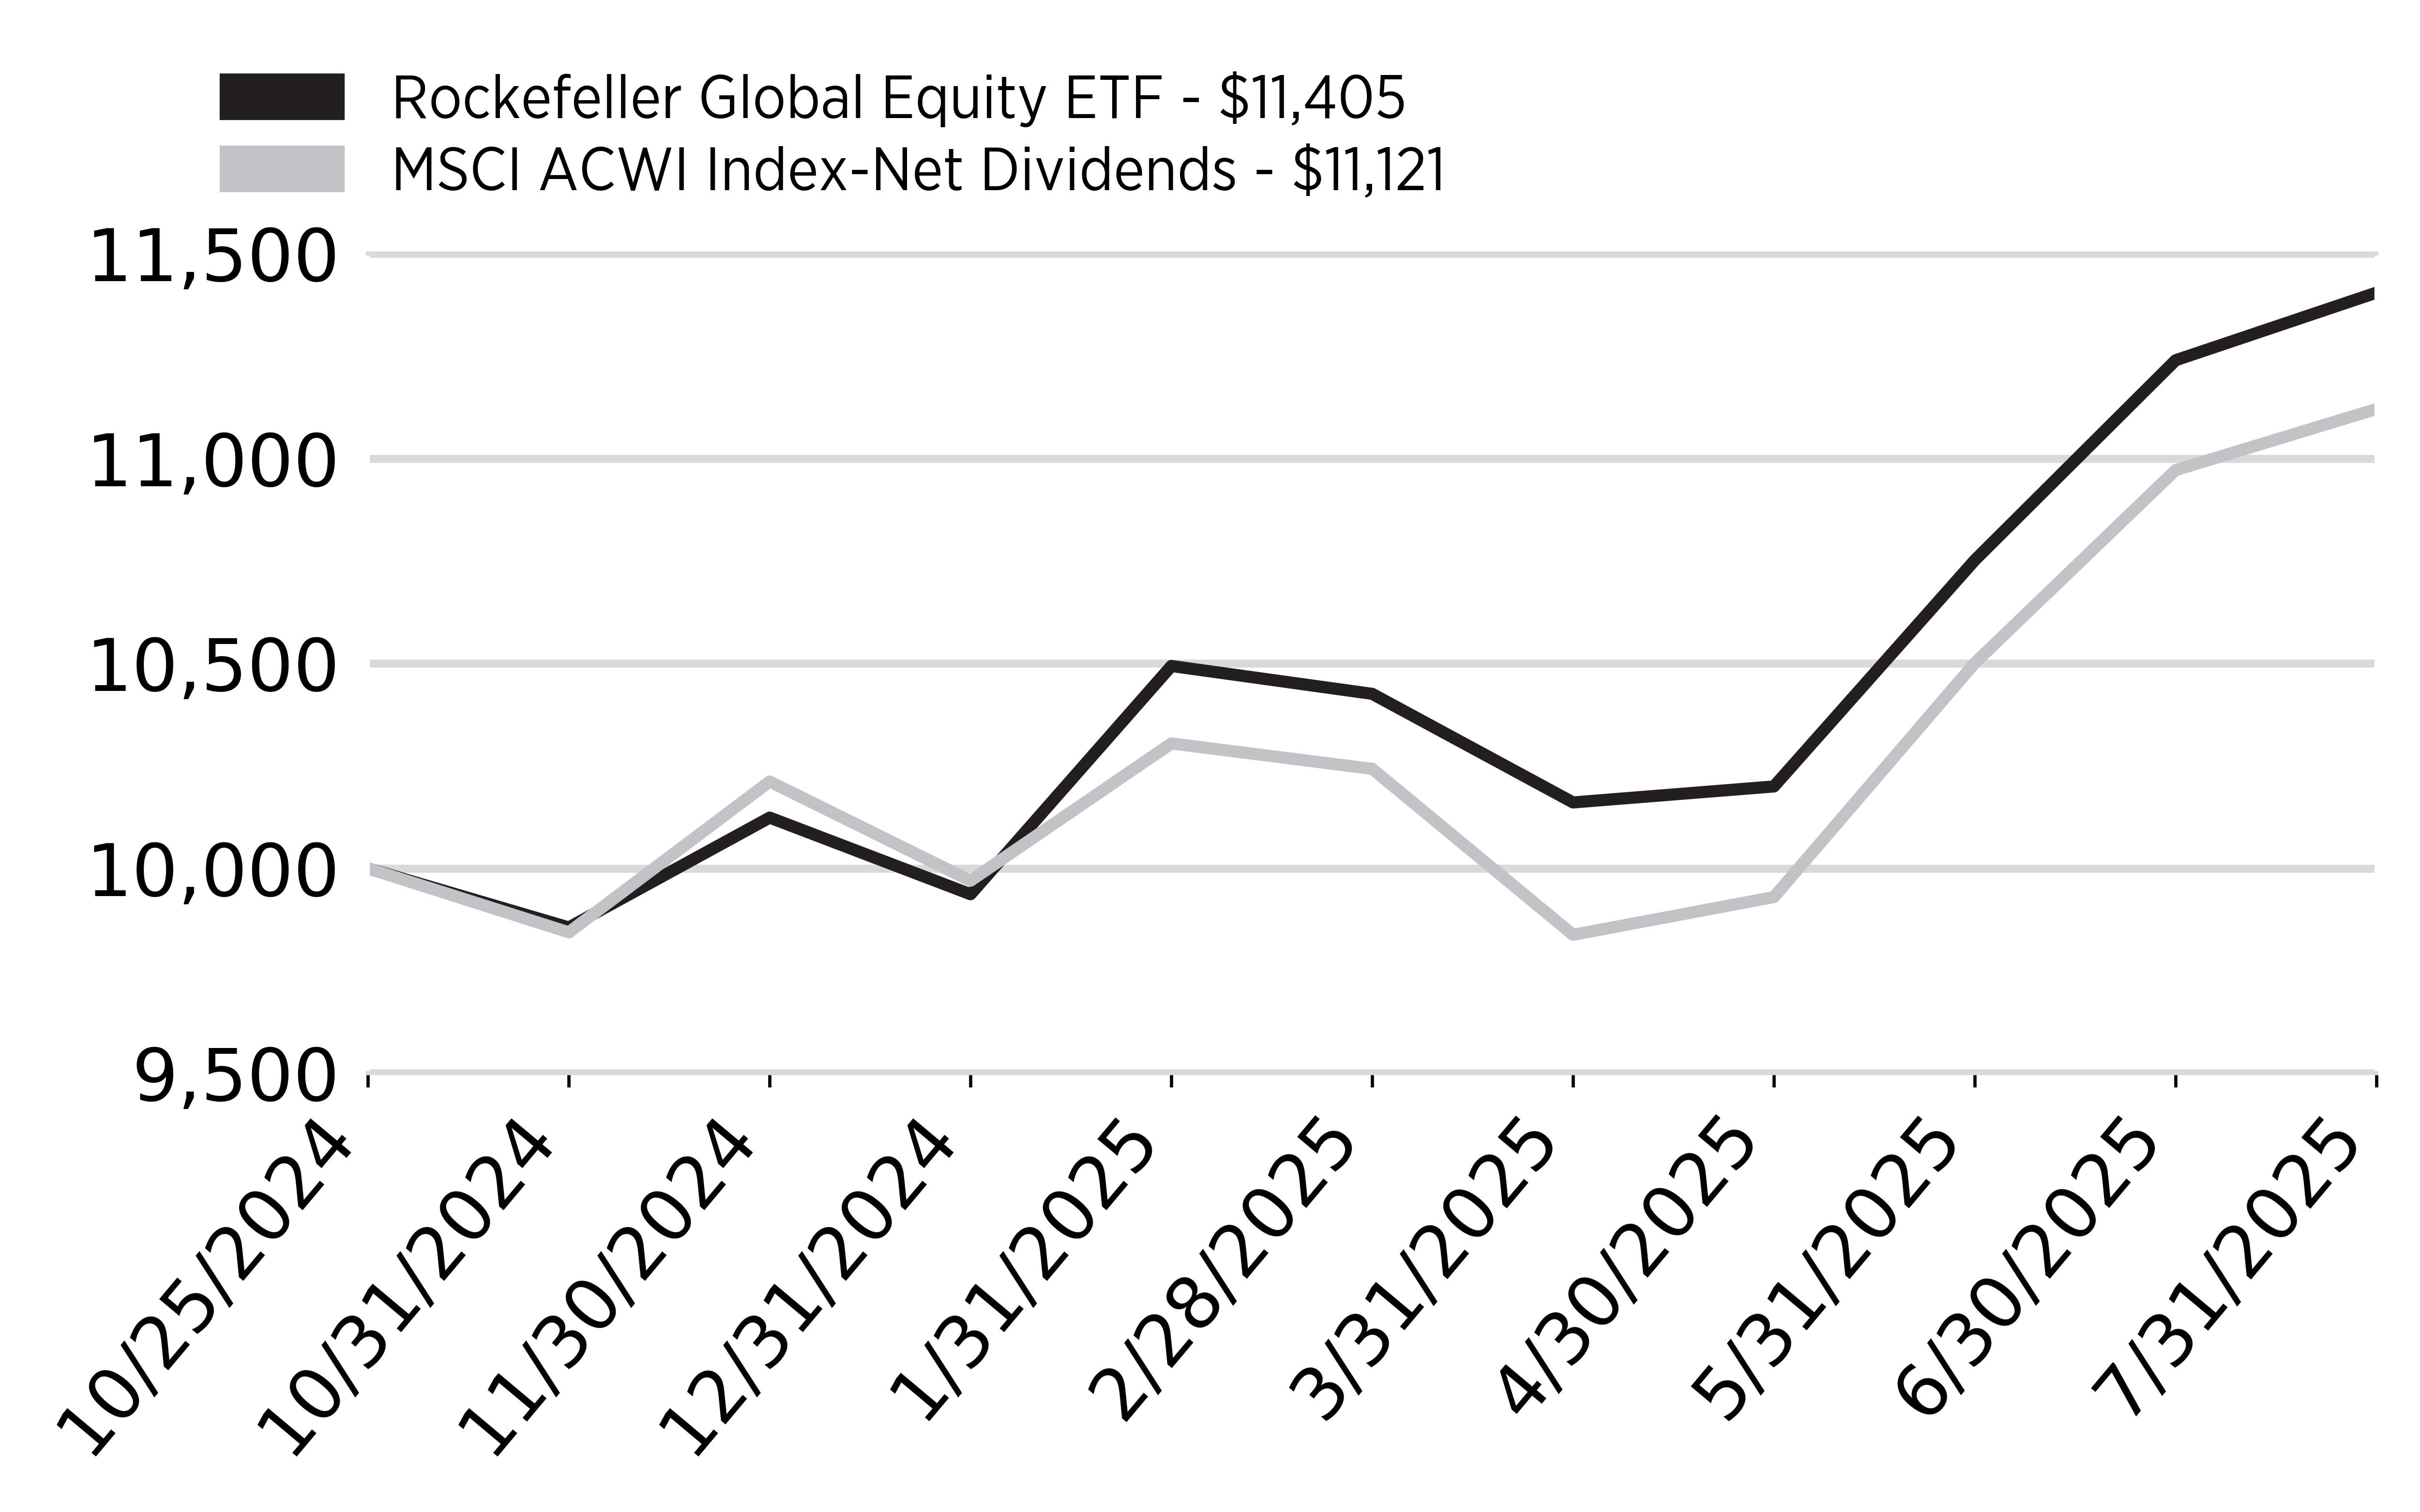
How did the Fund perform last year and what affected its performance?
Since inception (10/25/24) through 7/31/25, the Fund returned 14.05% versus its benchmark which returned 11.21% (Fund outperformed its benchmark by 2.84%).
From a sector perspective, based on performance attribution to the overall portfolio relative to the MSCI ACWI Index, Communication Services and Consumer Discretionary were the leading contributors, while Health Care and Financials were the leading detractors.
Reviewing individual stocks based on performance attribution to the overall portfolio relative to the MSCI ACWI Index, the top three leading contributors included GE Vernova, Nintendo and General Electric. Conversely, the three top leading detractors included UnitedHealth Group, Reinsurance Group of America and Becton Dickinson & Co.
Cumulative Performance
Annual Performance
|
|
Since Inception
|
|---|---|
|
Rockefeller Global Equity ETF
|
14.05%
|
|
MSCI ACWI Index-Net Dividends
|
11.21%
|
Key Fund Statistics
(as of July 31, 2025)
|
Fund Size (Thousands)
|
$710,361
|
|
Number of Holdings
|
69
|
|
Total Advisory Fee
|
$2,854,107
|
|
Portfolio Turnover Rate
|
16%
|
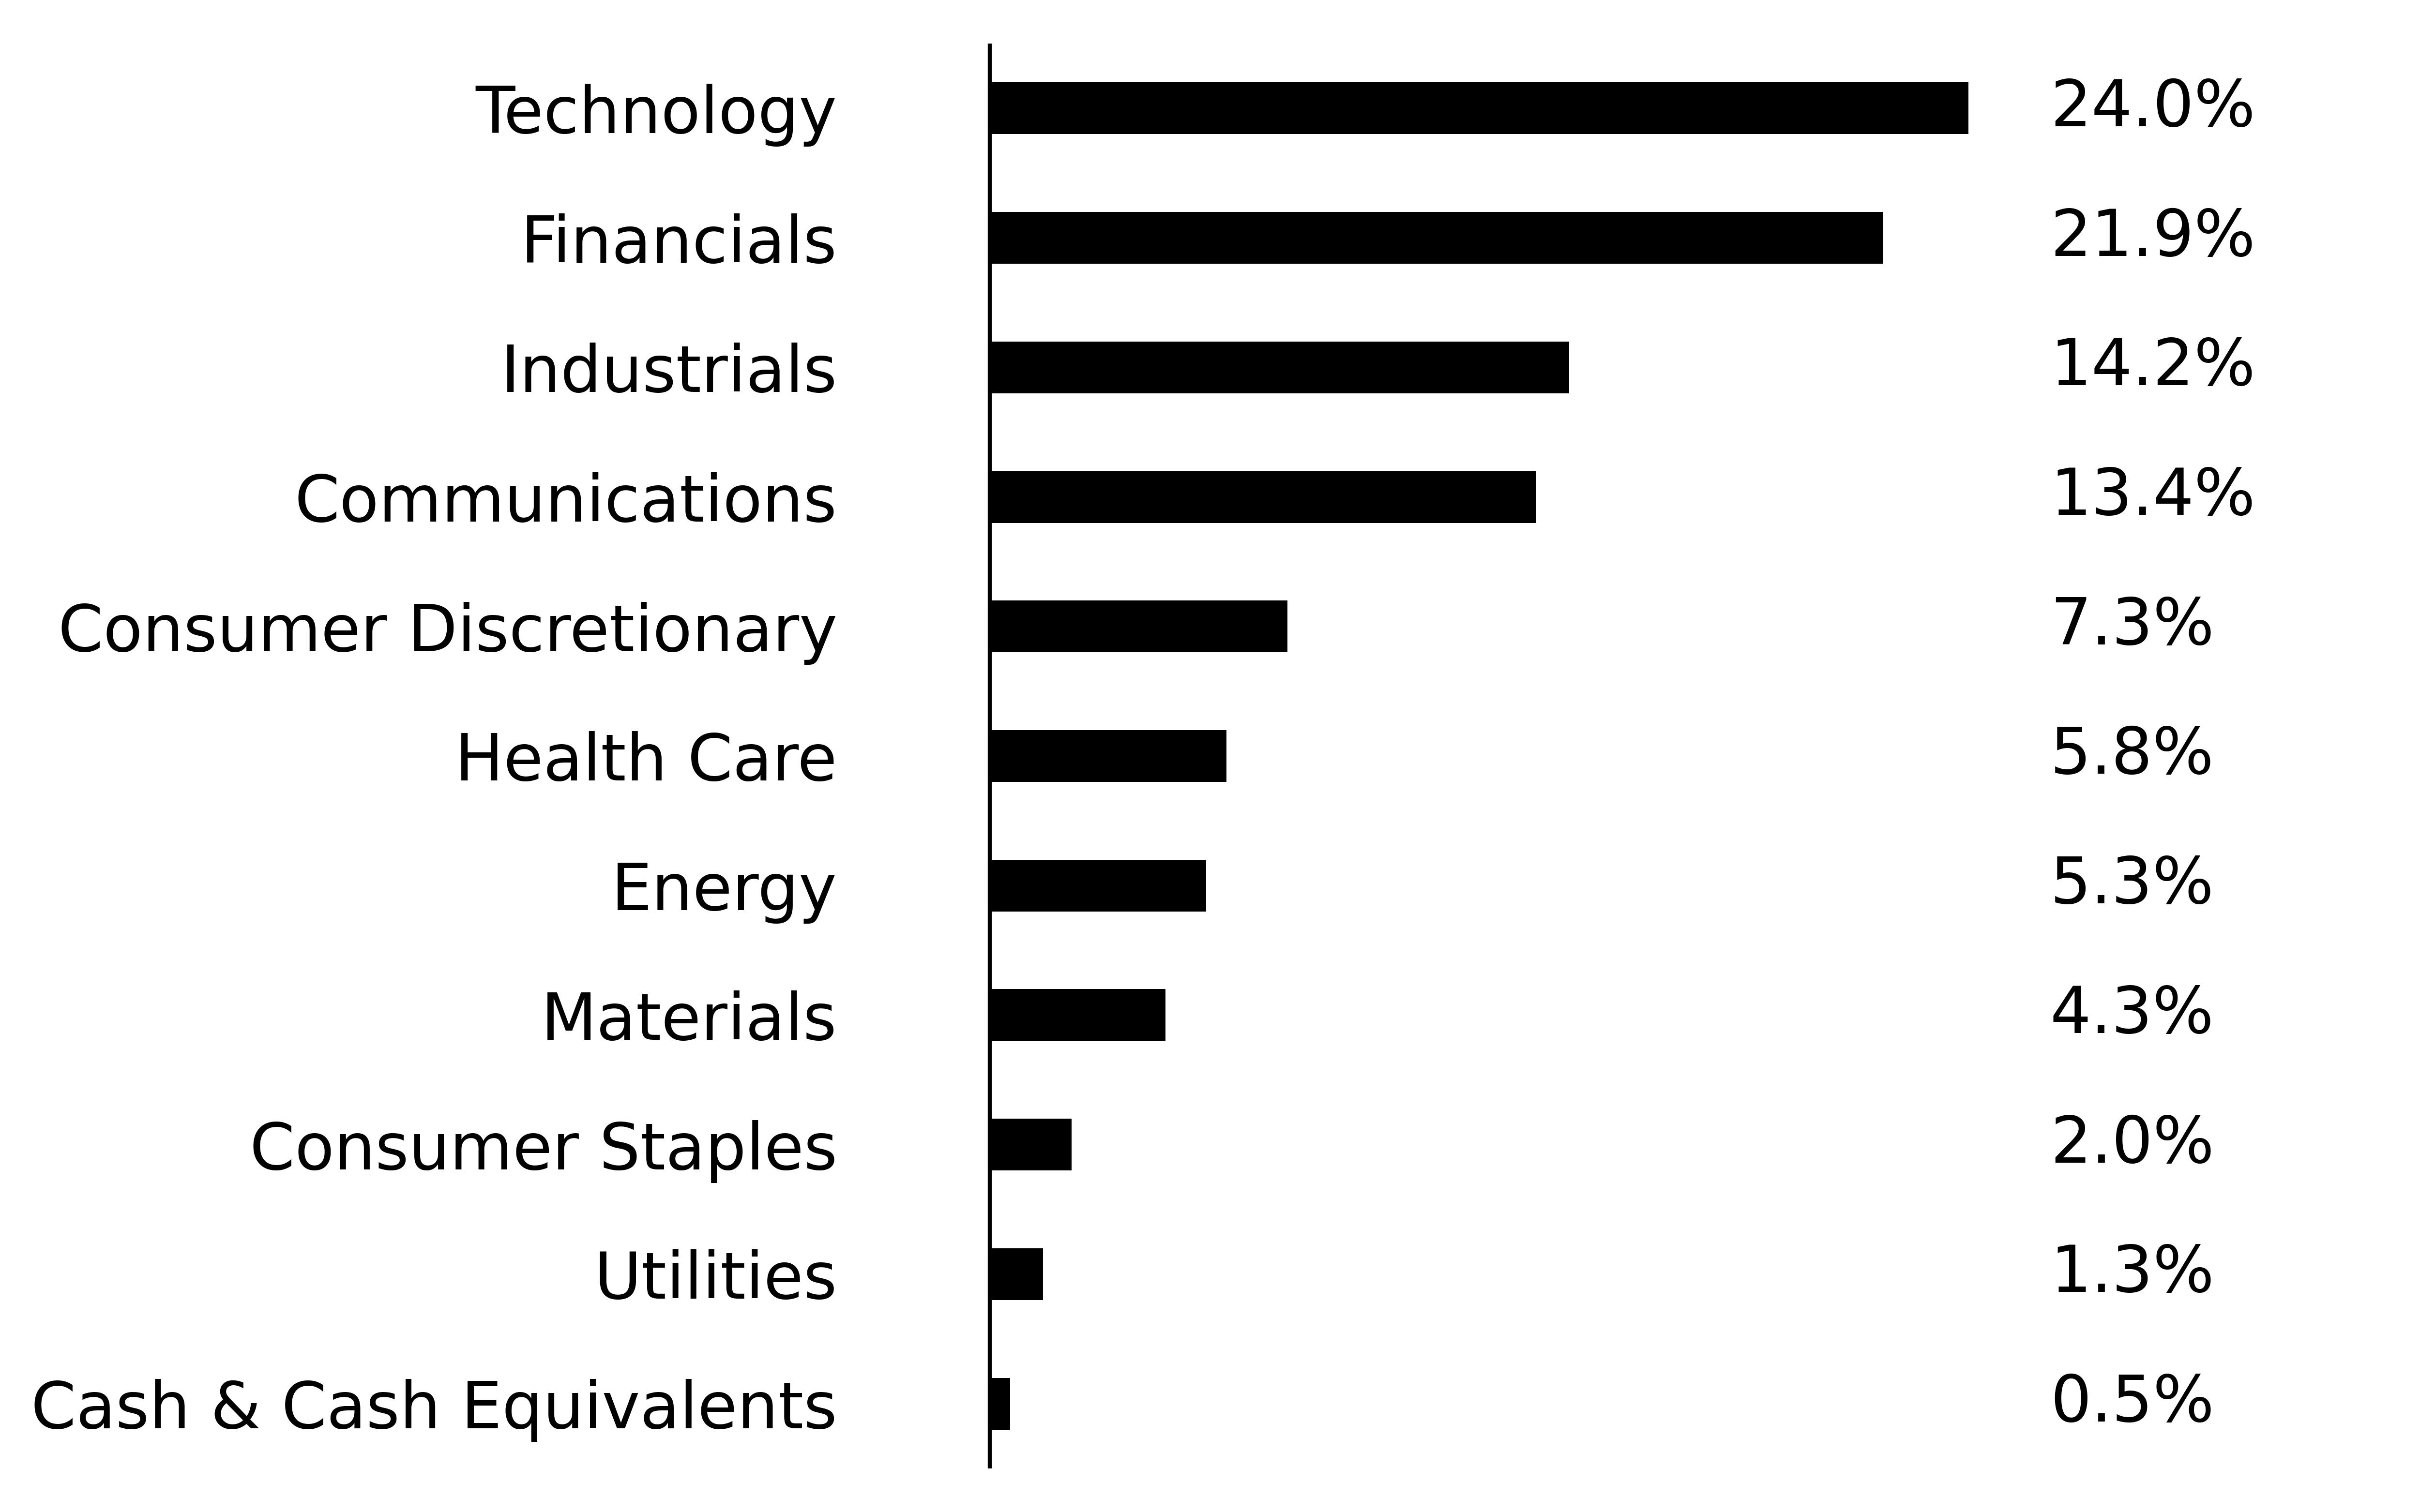
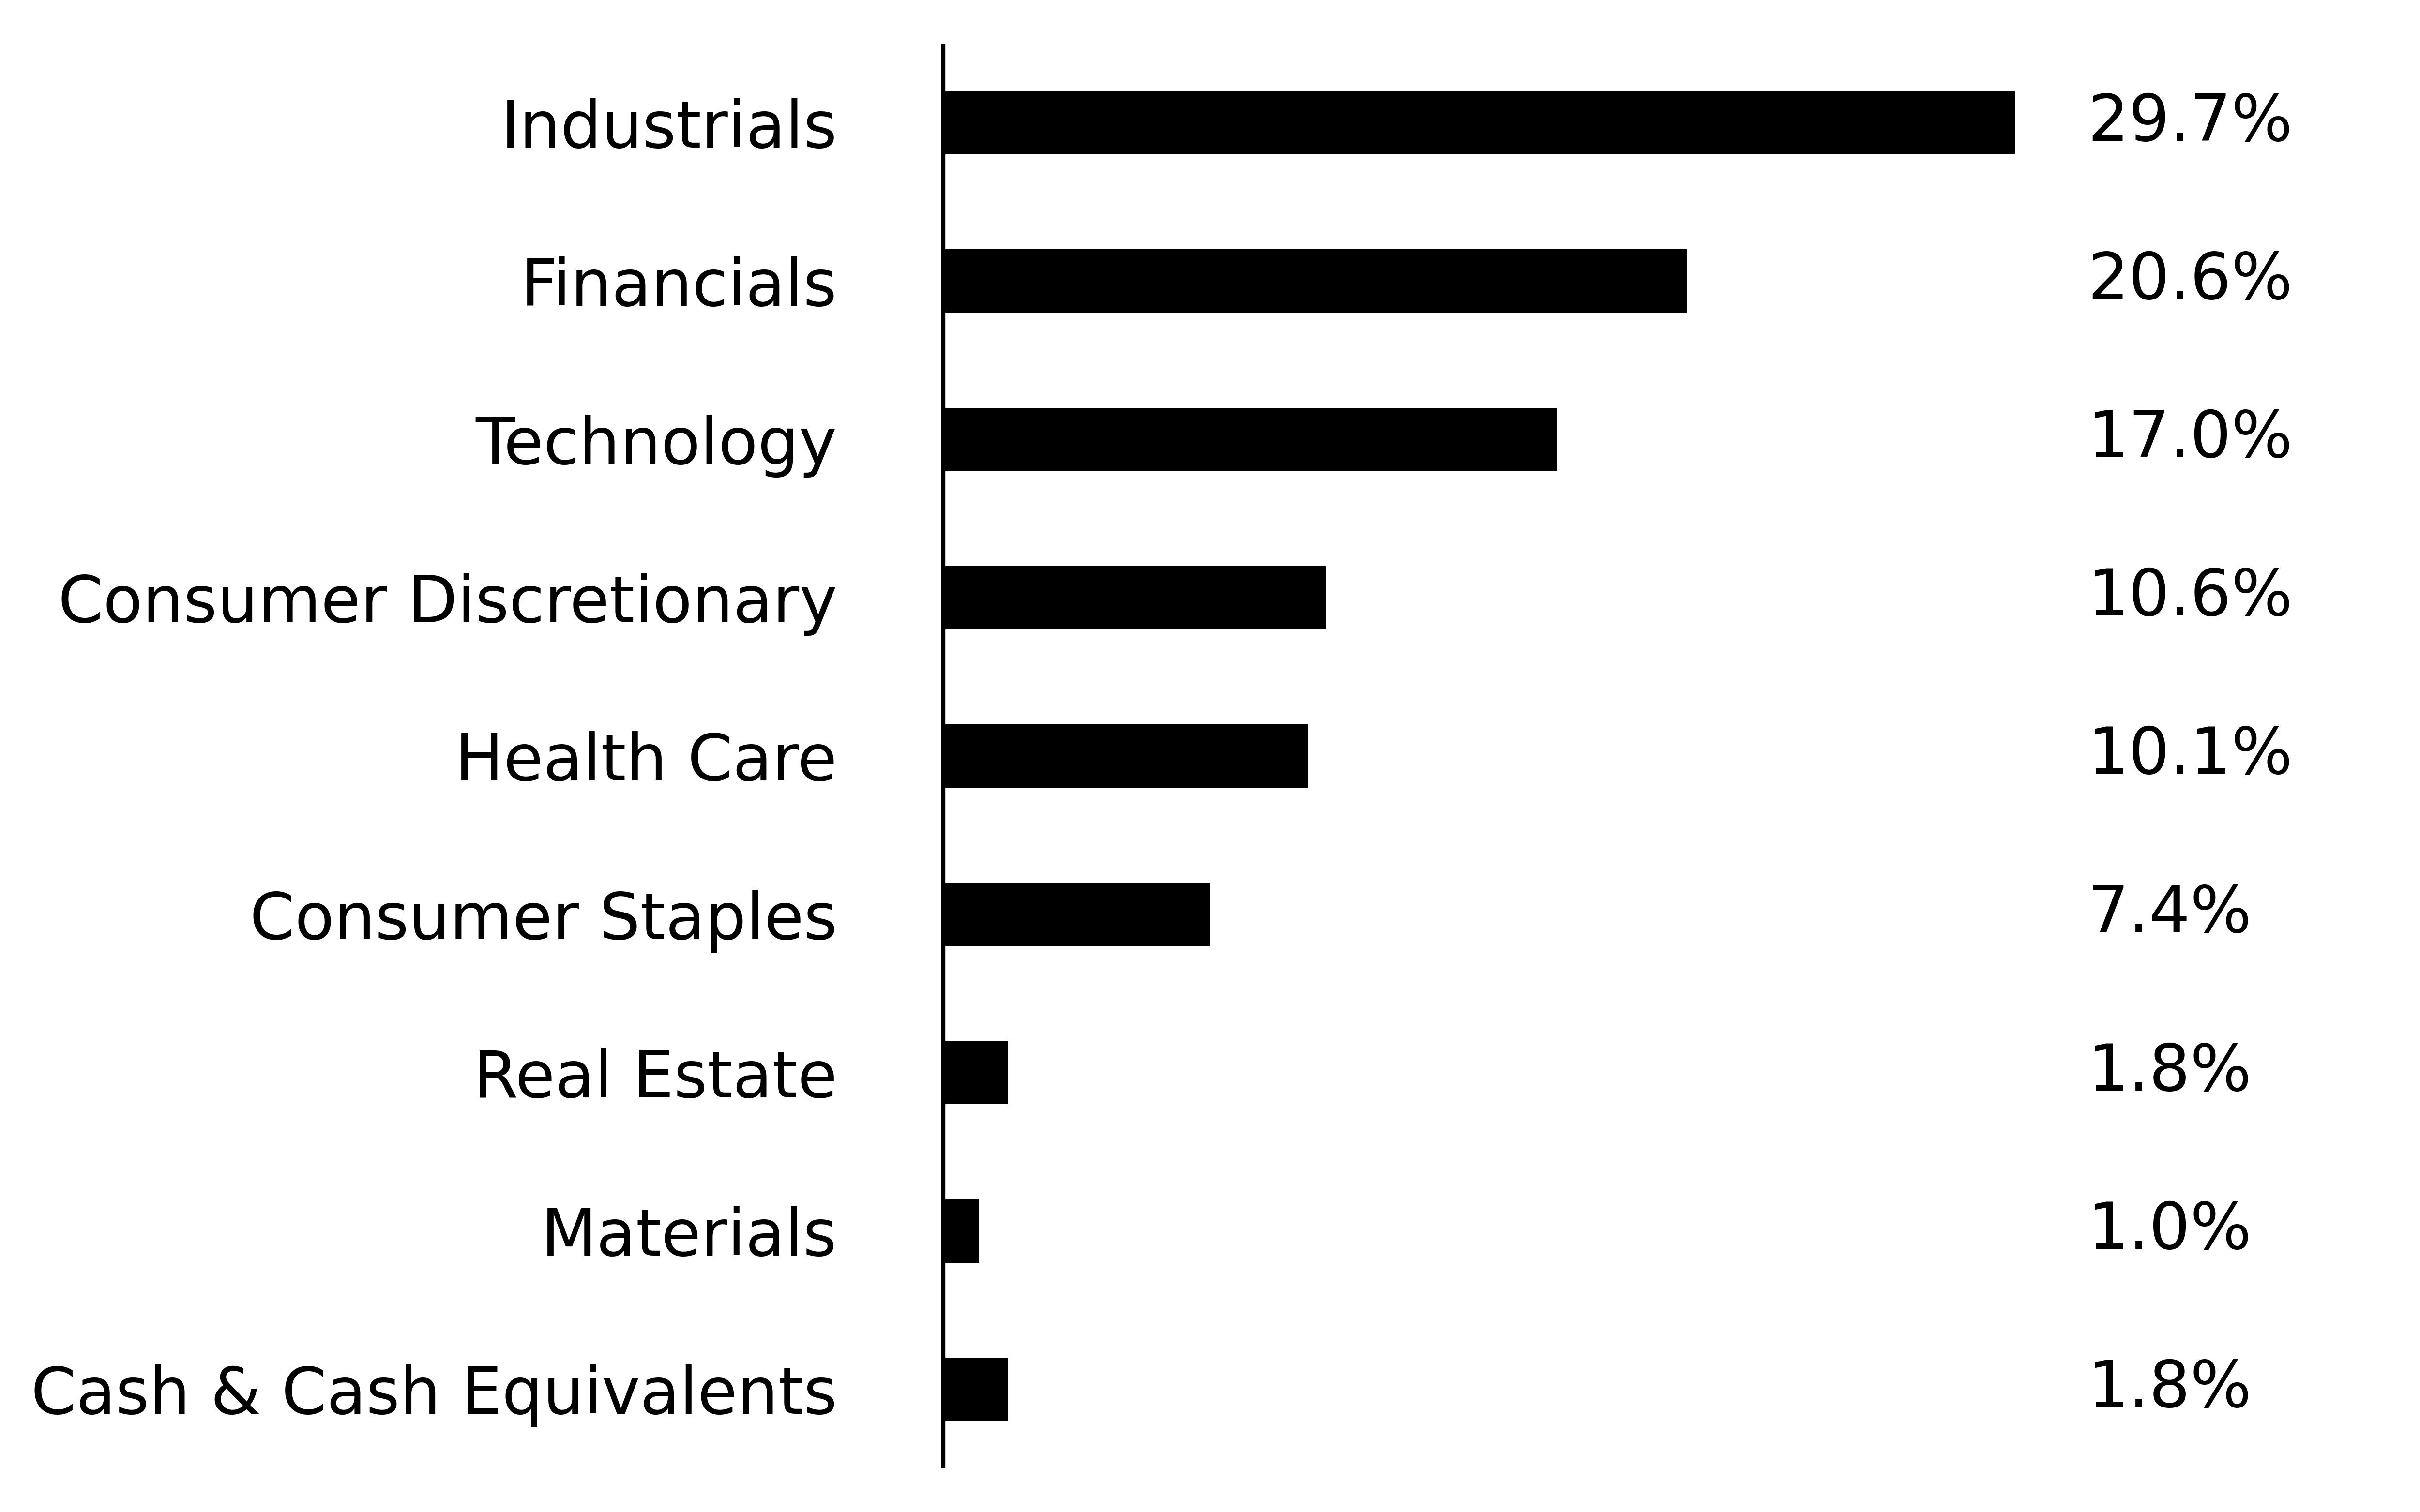
What did the Fund invest in?
(as of July 31, 2025)
Sector Breakdown (% of net assets)
|
Top Ten Holdings
|
(% of
net assets)
|
|---|---|
|
Microsoft Corp.
|
|
|
Meta Platforms, Inc.
|
|
|
Amazon.com, Inc.
|
|
|
Alphabet, Inc.- Class A
|
|
|
Shell PLC
|
|
|
NVIDIA Corp.
|
|
|
GeneralAerospace
|
|
|
Reinsurance Group of America, Inc.
|
|
|
Visa, Inc.
|
|
|
Samsung Electronics Co. Ltd.
|
How has the Fund changed?
Effective October 25, 2024 , the Rockefeller Global Equity Fund I L.P, Rockefeller Global Equity Fund II, L.P., Rockefeller Global Equity Fund II QP Limited Partnership, Rockefeller Global Equity Fund III Limited Partnership, Rockefeller Global Dividend Growth Fund L.P. and Rockefeller Global Dividend Growth Fund QP L.P. (the “Predecessor Funds”) reorganized into the Rockefeller Global Equity ETF. The Reorganization provided for the transfer of all the assets of the Predecessor Funds to the RGEF ETF. For financial reporting purposes, assets received, and shares issued by the RGEF ETF were recorded at fair value; however, the cost basis of the investments received from the Predecessor Fund were carried forward to align ongoing reporting of the Acquiring Fund realized and unrealized gains and losses with amounts distributable to shareholders for tax purposes.
What were the Fund costs since inception?
(based on a hypothetical $10,000 investment)
|
Fund Name
|
Costs of a $10,000 investment
|
Costs paid as a percentage of a $10,000 investment
|
|---|---|---|
|
Rockefeller U.S. Small-Mid Cap ETF
|
$61
|
0.75%
|
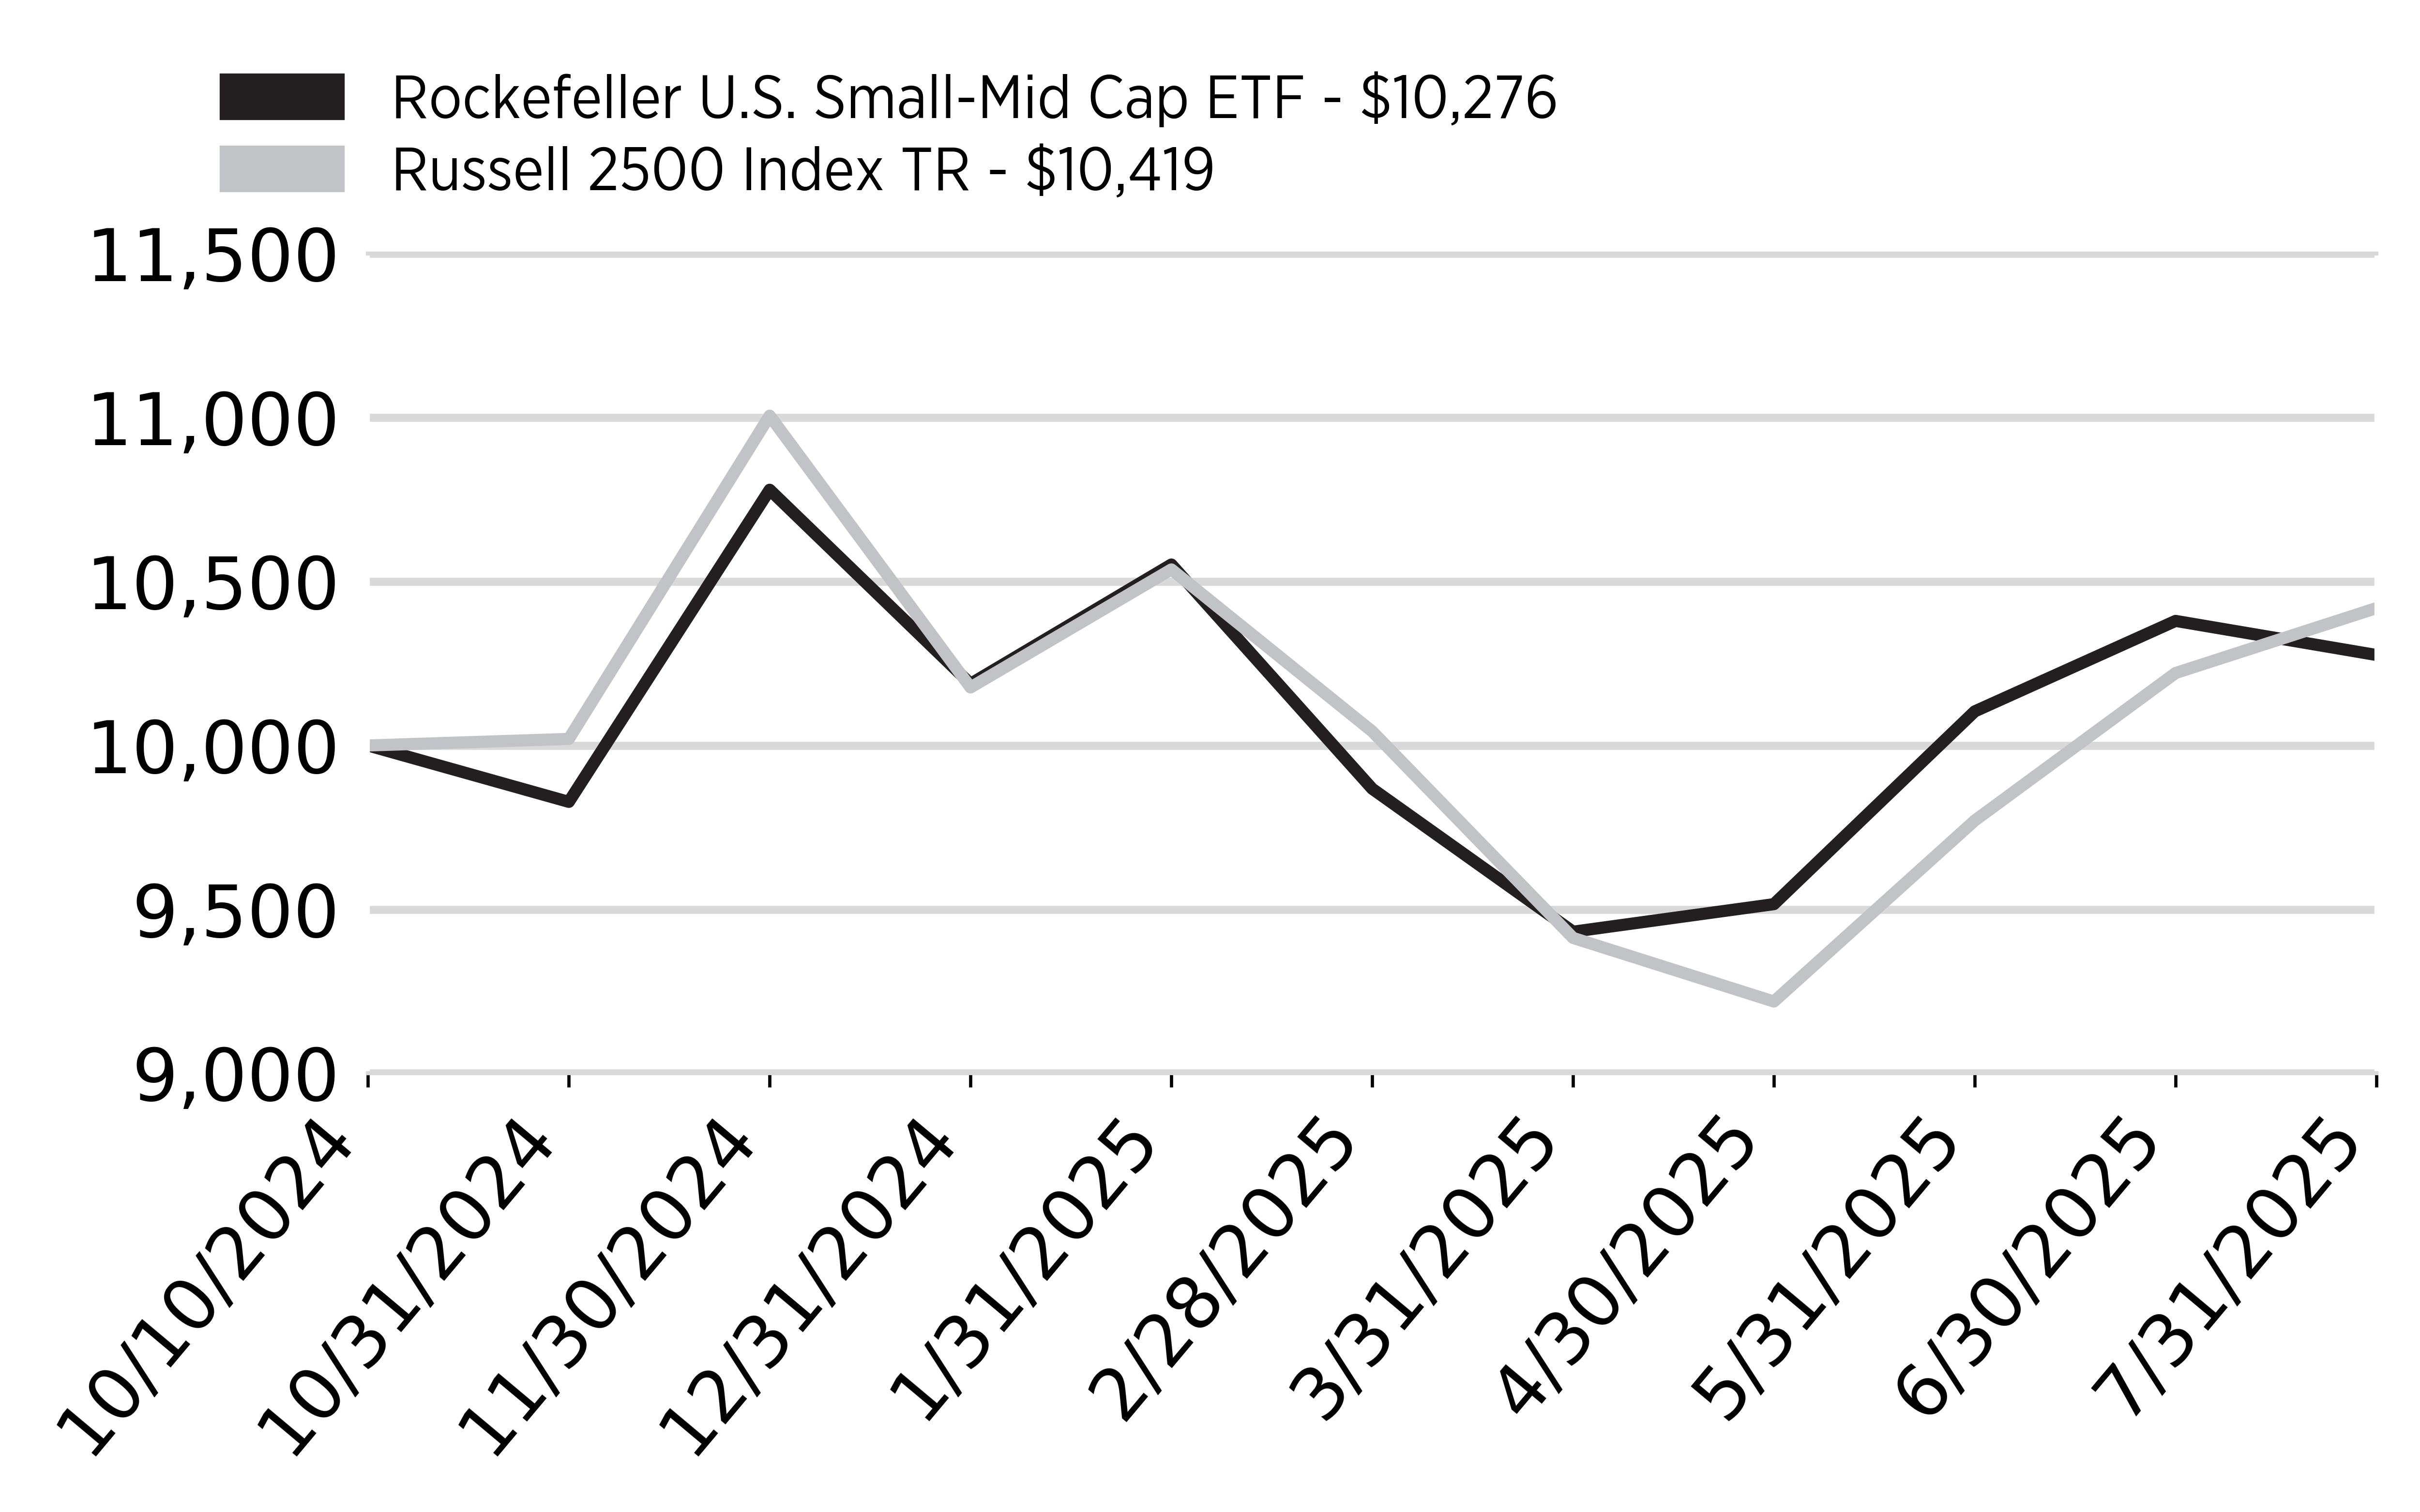
How did the Fund perform last year and what affected its performance?
Since inception (10/10/24) through 7/31/25, the Fund returned 2.76% versus its benchmark which returned 4.19% (Fund underperformed its benchmark by 1.43%).
From a sector perspective, based on performance attribution to the overall portfolio relative to the Russell 2500 Index, Consumer Discretionary and Real Estate were the leading contributors, while Information Technology and Industrials were the leading detractors.
Reviewing individual stocks based on performance attribution to the overall portfolio relative to the Russell 2500 Index, the top three leading contributors included Stride, StoneX Group and Ollie’s Bargain Outlet. Conversely, the three leading detractors included RadNet, Tetra Tech and Vertex.
Cumulative Performance
Annual Performance
|
|
Since Inception
|
|---|---|
|
Rockefeller U.S. Small-Mid Cap ETF
|
2.76%
|
|
Russell 2500 Index TR
|
4.19%
|
Key Fund Statistics
(as of July 31, 2025)
|
Fund Size (Thousands)
|
$735,948
|
|
Number of Holdings
|
45
|
|
Total Advisory Fee
|
$4,528,048
|
|
Portfolio Turnover Rate
|
86%
|
What did the Fund invest in?
(as of July 31, 2025)
Sector Breakdown (% of net assets)
|
Top Ten Holdings
|
(% of
net assets)
|
|---|---|
|
StoneX Group, Inc.
|
|
|
BJ's Wholesale Club Holdings, Inc.
|
|
|
FirstCash Holdings, Inc.
|
|
|
Stride, Inc.
|
|
|
Korn Ferry
|
|
|
RadNet, Inc.
|
|
|
Ollie's Bargain Outlet Holdings, Inc.
|
|
|
PJT Partners, Inc.
|
|
|
Merit Medical Systems, Inc.
|
|
|
SLM Corp.
|
How has the Fund changed?
Effective October 10, 2024 , the Pocantico Fund, Rockefeller & Co. U.S. Small Capitalization Fund, L.P. and Rockefeller U.S. Small Capitalization Fund QP, L.P (the “Predecessor Funds”). reorganized into the Rockefeller U.S. Small-Mid Cap ETF. The Reorganization provided for the transfer of all the assets of the Predecessor Funds to the RSMC ETF. For financial reporting purposes, assets received, and shares issued by the RSMC ETF were recorded at fair value; however, the cost basis of the investments received from the Predecessor Fund were carried forward to align ongoing reporting of the Acquiring Fund realized and unrealized gains and losses with amounts distributable to shareholders for tax purposes.
What were the Fund costs since inception?
(based on a hypothetical $10,000 investment)
|
Fund Name
|
Costs of a $10,000 investment
|
Costs paid as a percentage of a $10,000 investment
|
|---|---|---|
|
Rockefeller New York Municipal Bond ETF
|
$51
|
0.53%
|
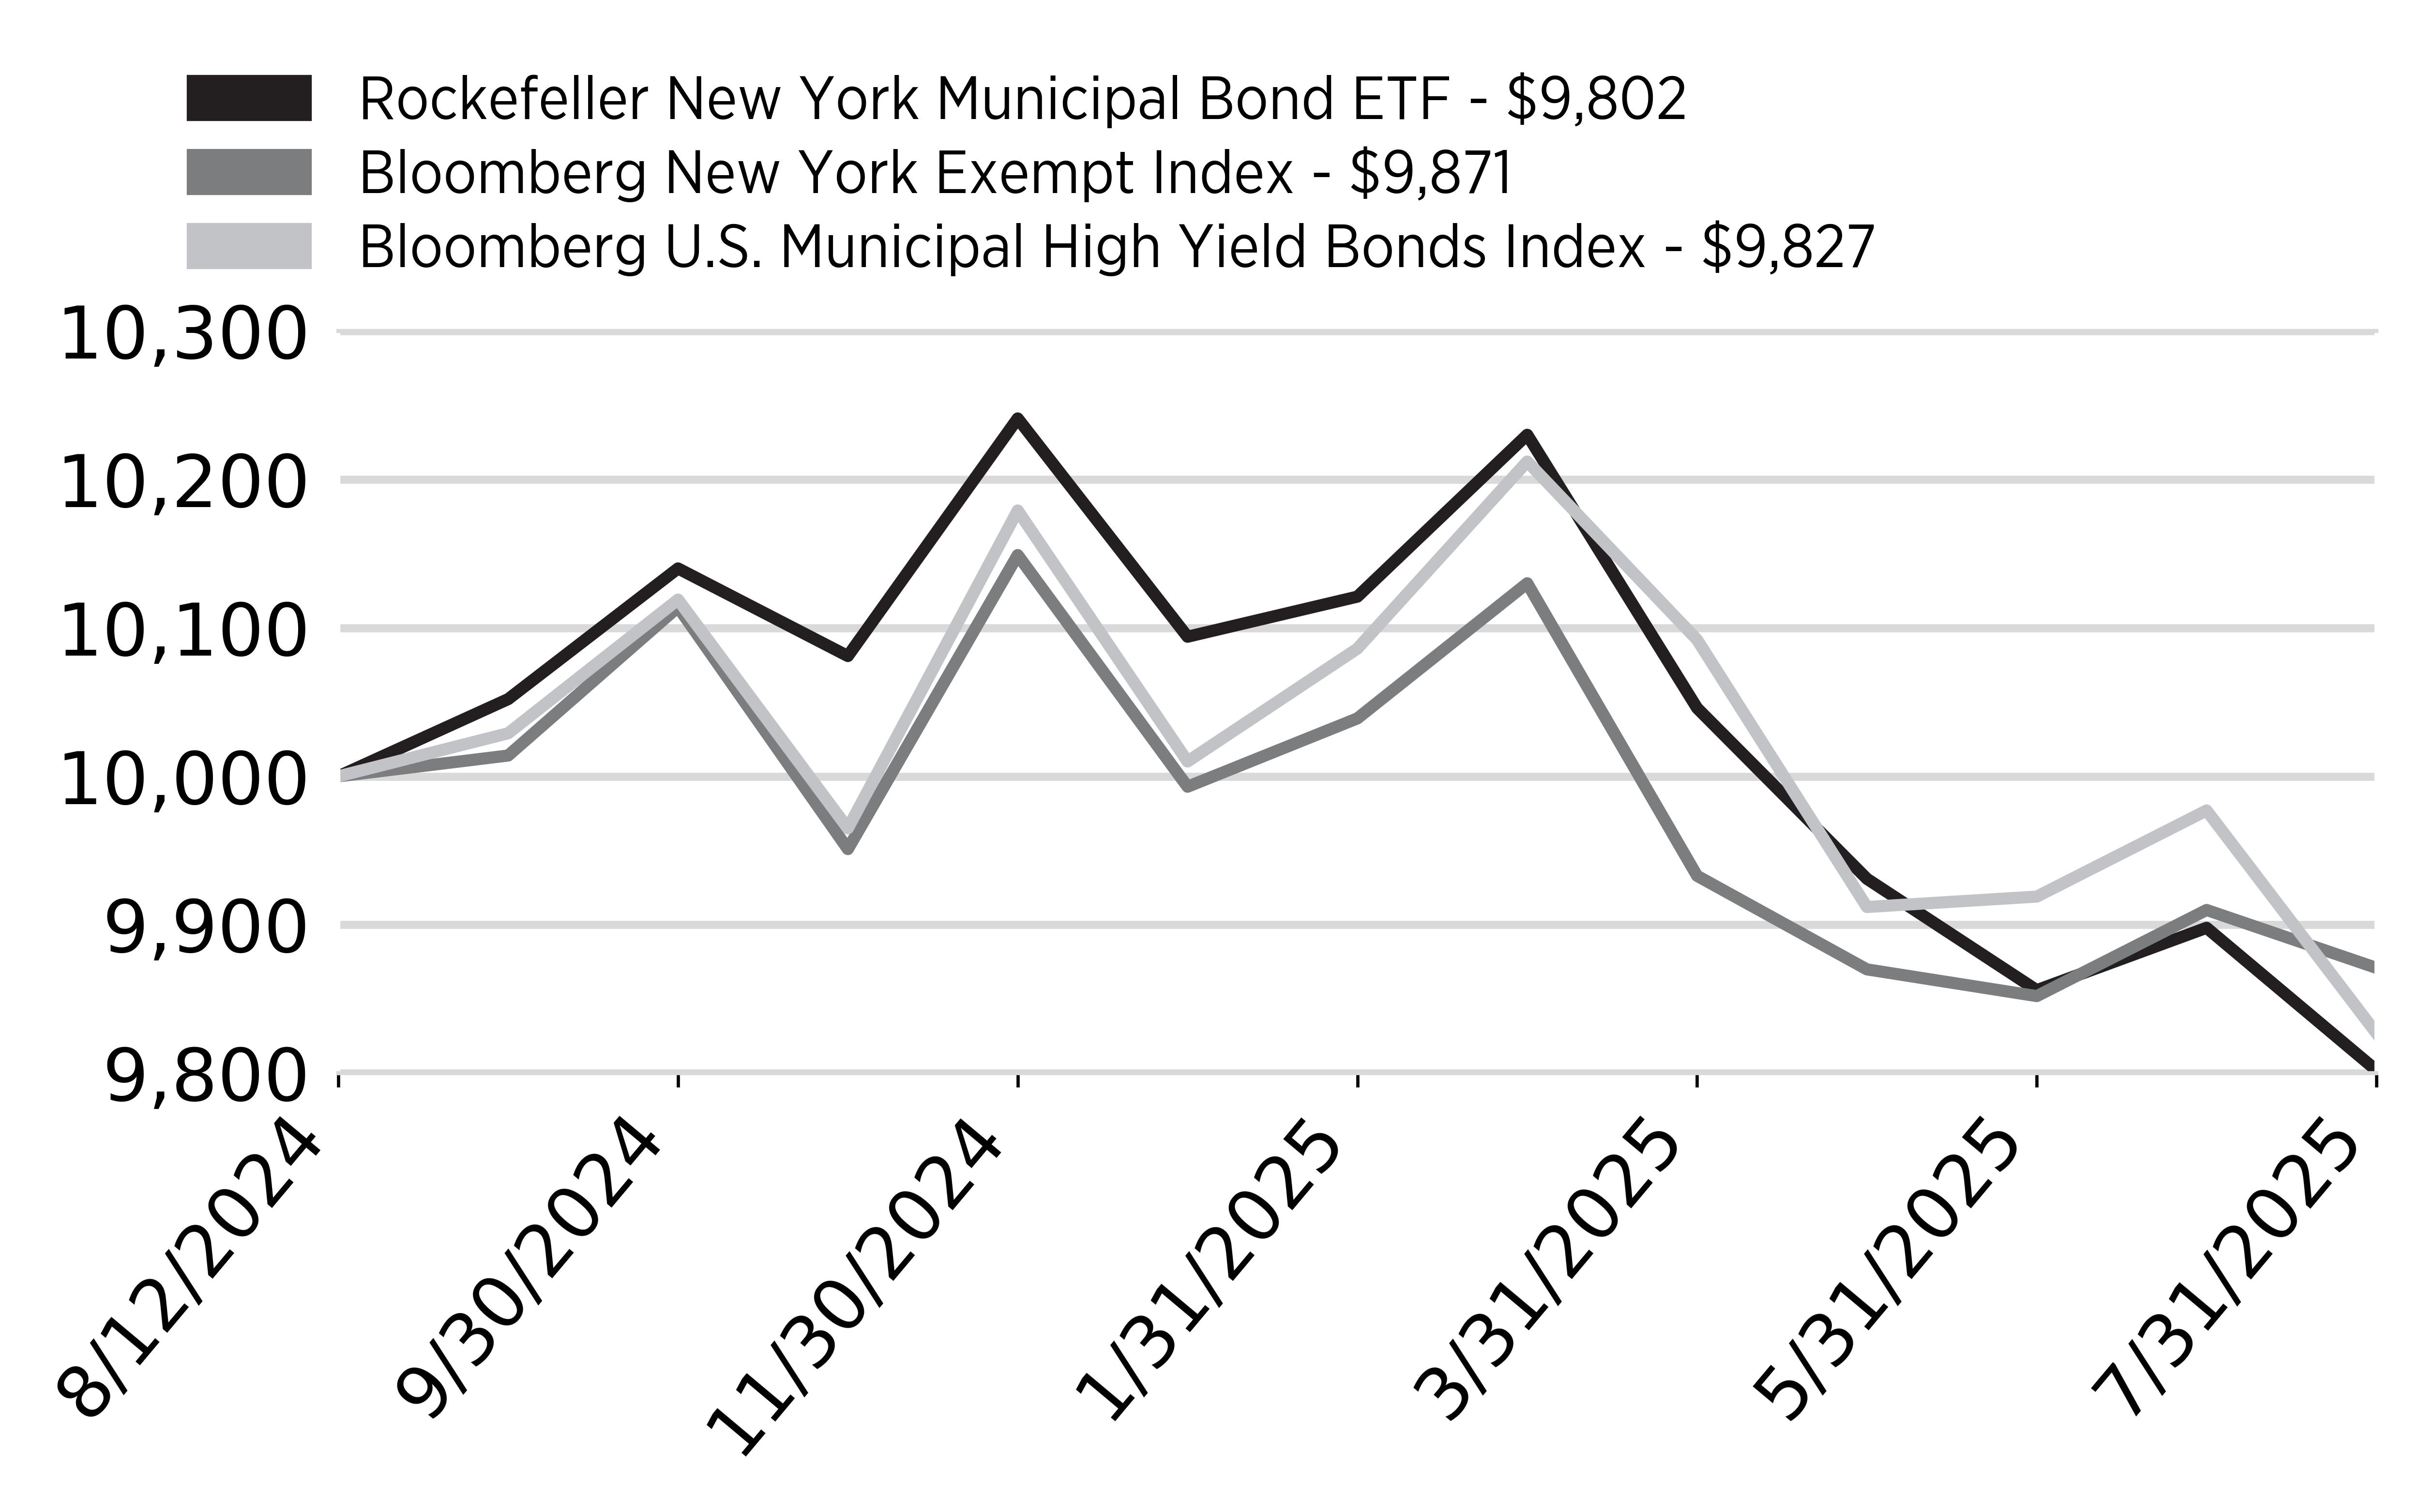
How did the Fund perform last year and what affected its performance?
From inception (8/12/24) through 7/31/25, the Fund returned -1.98%, underperforming its benchmark by 0.69%, primarily due to longer duration exposure.
Rising long-end yields in the high-grade municipal market contributed to underperformance, though higher yield exposure helped offset some of the impact.
As of month-end, the Fund’s distribution yield was 5.03%, and credit fundamentals remain strong across the municipal landscape. The Fund continues to pursue a bottom-up, credit-intensive strategy focused on yield-driven total return, recognizing that short-term volatility may occur but yield is expected to drive long-term performance.
Cumulative Performance
Annual Performance
|
|
Since Inception
|
|---|---|
|
Rockefeller New York Municipal Bond ETF
|
-1.98%
|
|
Bloomberg New York Exempt Index
|
-1.29%
|
|
Bloomberg U.S. Municipal High Yield Bonds Index
|
-1.73%
|
Key Fund Statistics
(as of July 31, 2025)
|
Fund Size (Thousands)
|
$16,548
|
|
Number of Holdings
|
71
|
|
Total Advisory Fee
|
$37,411
|
|
Portfolio Turnover Rate
|
276%
|
What did the Fund invest in?
(as of July 31, 2025)
|
Top Ten Holdings
|
(% of
net assets)
|
|---|---|
|
New York City Transitional Finance Authority,
Call 11/01/35*
|
|
|
New York State Dormitory Authority, Call 03/15/34
|
|
|
Suffolk Regional Off-Track Betting Corp., Call 06/01/29
|
|
|
Metropolitan Transportation Authority Dedicated Tax Fund, Call 11/15/34
|
|
|
Onondaga Civic Development Corp., Call 06/01/35
|
|
|
Puerto Rico Sales Tax Financing Corp., Call 07/01/28
|
|
|
New York State Dormitory Authority, Call 07/01/35
|
|
|
City of New York NY, Call 08/01/35
|
|
|
New York State Dormitory Authority, Call 07/01/35
|
|
|
Westchester County Local Development Corp., Call 07/01/27
|
| * | All or portion of the principal amount transferred to a Tender Option Bond Issuer in exchange for TOB Residuals and cash. |
What were the Fund costs since inception?
(based on a hypothetical $10,000 investment)
|
Fund Name
|
Costs of a $10,000 investment
|
Costs paid as a percentage of a $10,000 investment
|
|---|---|---|
|
Rockefeller Opportunistic Municipal Bond ETF
|
$50
|
0.52%
|
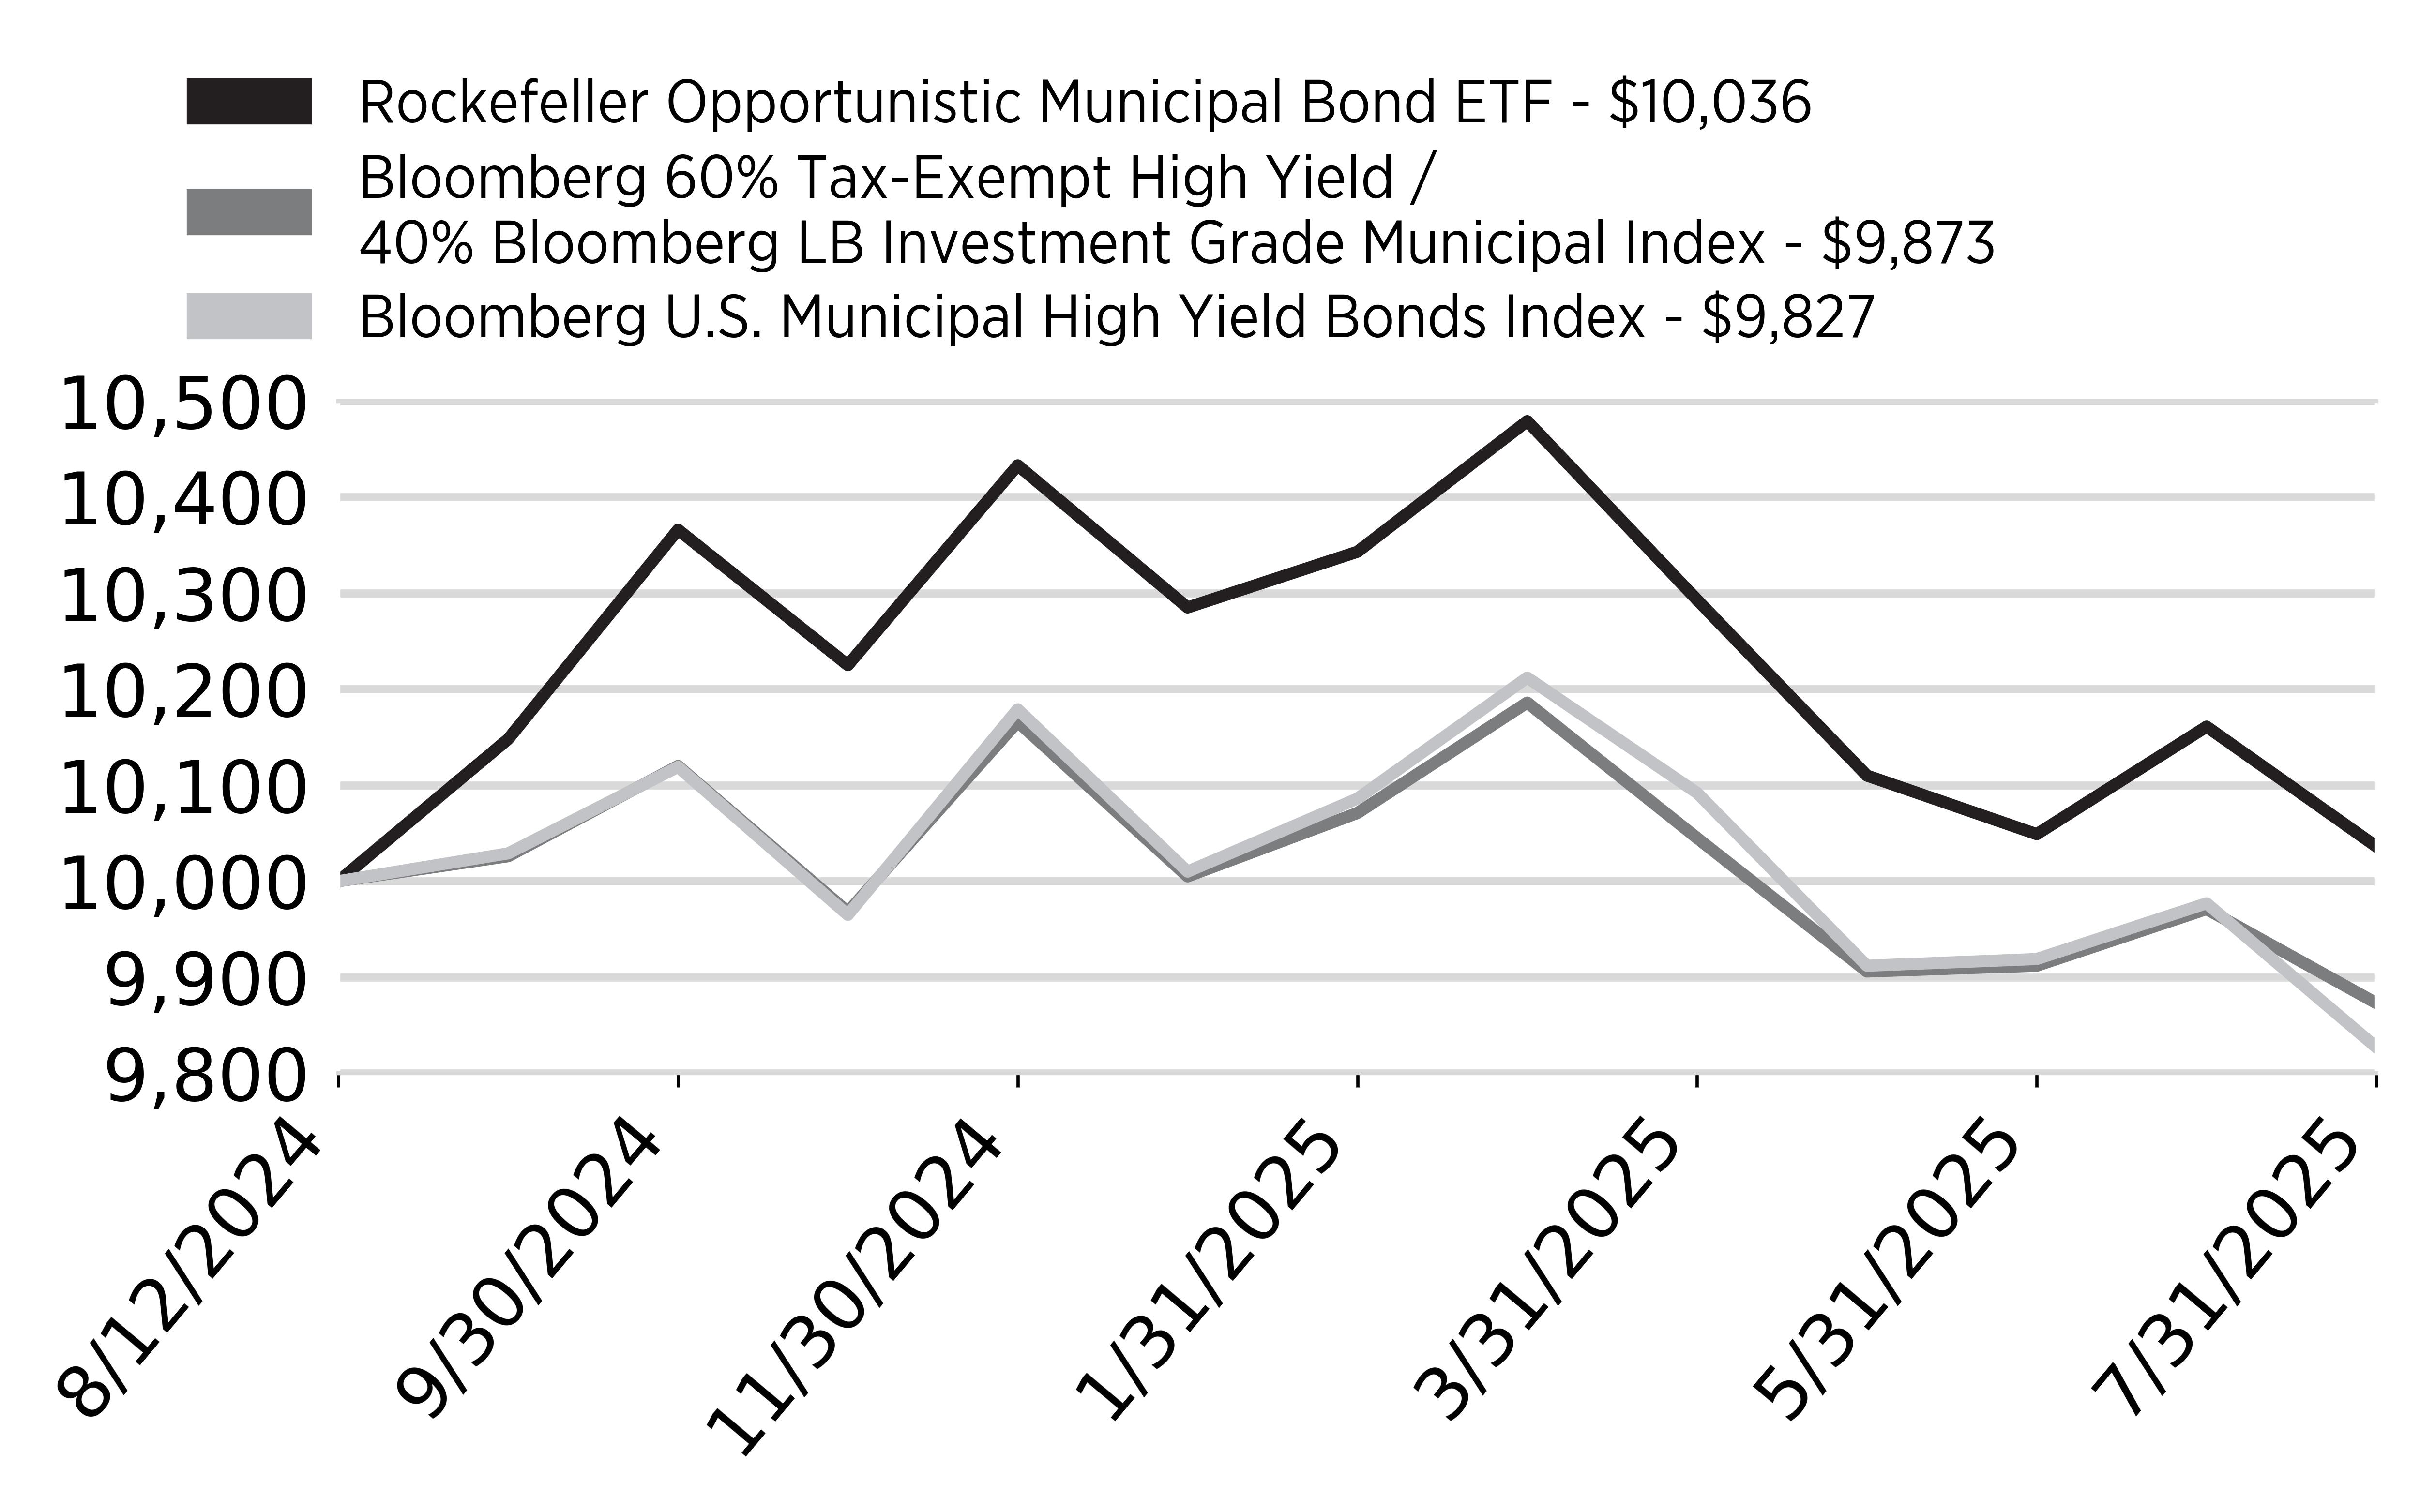
How did the Fund perform last year and what affected its performance?
Since inception (8/12/24) through 7/31/25, the Fund returned 0.36%, outperforming its benchmark by 1.63% due to strong security selection and opportunistic cash flow timing.
During the ramp-up phase, the Fund occasionally held less than 50% in BBB+ or lower-rated securities, but now that it has reached critical mass, most holdings are expected to fall within that cohort.
The market outlook remains constructive for municipals, especially high yield, with the Fund’s month-end distribution yield at 6.48%. The Fund continues to pursue yield-driven total return using a bottom-up, credit-intensive approach, recognizing that short-term volatility may occur but yield is expected to drive long-term performance.
Cumulative Performance
Annual Performance
|
|
Since Inception
|
|---|---|
|
Rockefeller Opportunistic Municipal Bond ETF
|
0.36%
|
|
Bloomberg 60% Tax-Exempt High Yield /
40% Bloomberg LB Investment
Grade Municipal Index
|
-1.27%
|
|
Bloomberg U.S. Municipal High Yield Bonds Index
|
-1.73%
|
Key Fund Statistics
(as of July 31, 2025)
|
Fund Size (Thousands)
|
$175,552
|
|
Number of Holdings
|
238
|
|
Total Advisory Fee
|
$602,242
|
|
Portfolio Turnover Rate
|
314%
|
|
Top Ten Holdings
|
(% of
net assets)
|
|---|---|
|
Washington Metropolitan Transit Authority, Call 07/15/33*
|
|
|
Worthington City School District, Call 12/01/32
|
|
|
Pennsylvania Turnpike Commission, Call 08/06/25*
|
|
|
Pennsylvania State University, Call 09/01/35*
|
|
|
New York City Transitional Finance Authority, Call 11/01/35*
|
|
|
City of Los Angeles Department of Airports, Call 05/15/35*
|
|
|
City of Charlotte NC Airport Revenue, Call 07/01/33*
|
|
|
Public Finance Authority, Call 06/30/35
|
|
|
South Carolina Jobs-Economic Development Authority, Call 10/01/27
|
|
|
Buckeye Tobacco Settlement Financing Authority, Call 06/01/30
|
| * | All or portion of the principal amount transferred to a Tender Option Bond (“TOB”) Issuer in exchange for TOB Residuals and cash. |