Pay vs Performance Disclosure
|
12 Months Ended |
|
Jul. 31, 2025
USD ($)
$ / shares
|
Jul. 31, 2024
USD ($)
$ / shares
|
Jul. 31, 2023
USD ($)
$ / shares
|
Jul. 31, 2022
USD ($)
$ / shares
|
Jul. 31, 2021
USD ($)
$ / shares
|
| Pay vs Performance Disclosure |
|
|
|
|
|
| Pay vs Performance Disclosure, Table |
| | | | | | | | | | | | | | | | | | | | | | | | | | | | | | | | Value of Initial Fixed $100 Investment Based On: | | | | Year | Summary Compensation Table Total for CEO (1) ($) | Compensation Actually Paid to CEO (2) ($) | Average Summary Compensation Table Total for Non-CEO NEOs (3) ($) | Average Compensation Actually Paid to Non-CEO NEOs (4) ($) | Company Total Shareholder Return
($) | Peer Group Total Shareholder Return
($) | Net Income (millions)
($) | Diluted Earnings Per Share-Incentive (5) ($) | | 2025 | 8,297,471 | 6,430,325 | 1,990,816 | 1,431,103 | 161 | 184 | 367 | 3.68 | | 2024 | 7,841,468 | 11,204,799 | 2,059,341 | 2,682,609 | 165 | 178 | 414 | 3.42 | | 2023 | 7,181,607 | 10,273,145 | 1,815,331 | 2,264,810 | 136 | 155 | 359 | 3.07 | | 2022 | 7,043,946 | 5,169,566 | 1,828,256 | 1,465,182 | 116 | 124 | 333 | 2.70 | | 2021 | 6,878,950 | 13,593,477 | 1,774,558 | 3,098,144 | 139 | 144 | 287 | 2.31 |
|
|
|
|
|
| Company Selected Measure Name |
Company Diluted EPS
|
|
|
|
|
| Named Executive Officers, Footnote |
The dollar amounts reported in this column are the amounts of total compensation reported for Mr. Carpenter, our Chairman, President and Chief Executive Officer for each corresponding year in the “Total” column of the Summary Compensation Table (“SCT”). The non-CEO NEOs included in average compensation are named below by fiscal year. | | | | | | | | | | | | | | | | 2025 | 2024 | 2023 | 2022 | 2021 | | Bradley J. Pogalz | Scott J. Robinson | Scott J. Robinson | Scott J. Robinson | Scott J. Robinson | | Richard B. Lewis | Richard B. Lewis | Thomas R. Scalf | Thomas R. Scalf | Thomas R. Scalf | | Thomas R. Scalf | Thomas R. Scalf | Richard B. Lewis | Jeffrey E. Spethmann | Jeffrey E. Spethmann | | Amy C. Becker | Amy C. Becker | Amy C. Becker | Richard B. Lewis | Amy C. Becker | | Scott J. Robinson | | Wim Vermeersch | | |
|
|
|
|
|
| PEO Total Compensation Amount |
$ 8,297,471
|
$ 7,841,468
|
$ 7,181,607
|
$ 7,043,946
|
$ 6,878,950
|
| PEO Actually Paid Compensation Amount |
$ 6,430,325
|
11,204,799
|
10,273,145
|
5,169,566
|
13,593,477
|
| Adjustment To PEO Compensation, Footnote |
The dollar amounts reported in this column represent the amount of “Compensation Actually Paid” to Mr. Carpenter as computed in accordance with Item 402(v) of Regulation S-K. The dollar amounts do not necessarily reflect the actual amount of compensation earned by or paid to Mr. Carpenter during the applicable year, but rather is a value calculated under applicable SEC rules. In accordance with the requirements of Item 402(v) of Regulation S-K, the following adjustments were made to Mr. Carpenter’s total compensation for each year to determine the Compensation Actually Paid. For purposes of awards that provide for continued vesting upon Mr. Carpenter’s retirement, the awards are not treated as vested until the award's scheduled vesting dates. | | | | | | | Adjustments to Determine Compensation Actually Paid for CEO | 2025
($) | | Deduction for Amounts Reported under the "Stock Awards" Column in the SCT | (2,853,630) | | Deduction for Amounts Reported under the "Option Awards" Column in the SCT | (2,849,945) | | Increase for Fair Value at end of Current Fiscal Year of Equity Awards Granted During Current Fiscal Year that Remain Unvested as of Fiscal Year End | 5,349,641 | | Increase/Deduction for Change in Fair Value from Prior Fiscal Year End to Current Fiscal Year End of Equity Awards Granted Prior to Current Fiscal Year that Were Unvested as of Fiscal Year End | (893,045) | | Increase/Deduction for Change in Fair Value from Prior Fiscal Year End to Vesting Date of Equity Awards Granted Prior to Current Fiscal Year that Vested During Current Fiscal Year | (541,725) | | Deduction for Change in the Actuarial Present Values* | (78,442) | | Total | (1,867,146) |
* The Company's pension plans are frozen; therefore, the service cost for each year was $0.
|
|
|
|
|
| Non-PEO NEO Average Total Compensation Amount |
$ 1,990,816
|
2,059,341
|
1,815,331
|
1,828,256
|
1,774,558
|
| Non-PEO NEO Average Compensation Actually Paid Amount |
$ 1,431,103
|
2,682,609
|
2,264,810
|
1,465,182
|
3,098,144
|
| Adjustment to Non-PEO NEO Compensation Footnote |
The dollar amounts reported in this column represent the average amount of “Compensation Actually Paid” to the NEOs as a group (excluding our CEO), as computed in accordance with Item 402(v) of Regulation S-K. The dollar amounts do not reflect the actual average amount of compensation earned by or paid to the NEOs as a group (excluding our CEO) during the applicable year. In accordance with the requirements of Item 402(v) of Regulation S-K, the following adjustments were made to average total compensation for the NEOs as a group (excluding Mr. Carpenter) for each year to determine the average Compensation Actually Paid, using the same methodology described above in footnote 2. For purposes of awards that provide for continued vesting upon a non-CEO NEO’s retirement, the awards are not treated as vested until the award's scheduled vesting date. | | | | | | | Adjustments to Determine Compensation Actually Paid for Non-CEO NEOs | 2025
($) | | Deduction for Amounts Reported under the "Stock Awards" Column in the SCT | (497,731) | | Deduction for Amounts Reported under the "Option Awards" Column in the SCT | (498,178) | | Deduction for Fair Value of Stock Awards Granted in Fiscal Prior Years that Failed to Vest | (132,663) | | Increase for Fair Value at end of Current Fiscal Year of Equity Awards Granted During Current Fiscal Year that Remain Unvested as of Fiscal Year End | 805,120 | | Increase/Deduction for Change in Fair Value from Prior Fiscal Year End to Current Fiscal Year End of Equity Awards Granted Prior to Current Fiscal Year that Were Unvested as of Fiscal Year End | (137,943) | | Increase/Deduction for Change in Fair Value from Prior Fiscal Year End to Vesting Date of Equity Awards Granted Prior to Current Fiscal Year that Vested During Current Fiscal Year | (82,957) | | Deduction for Change in the Actuarial Present Values* | (15,361) | | Total | (559,713) |
* The Company's pension plans are frozen; therefore, the service cost for each year was $0.
|
|
|
|
|
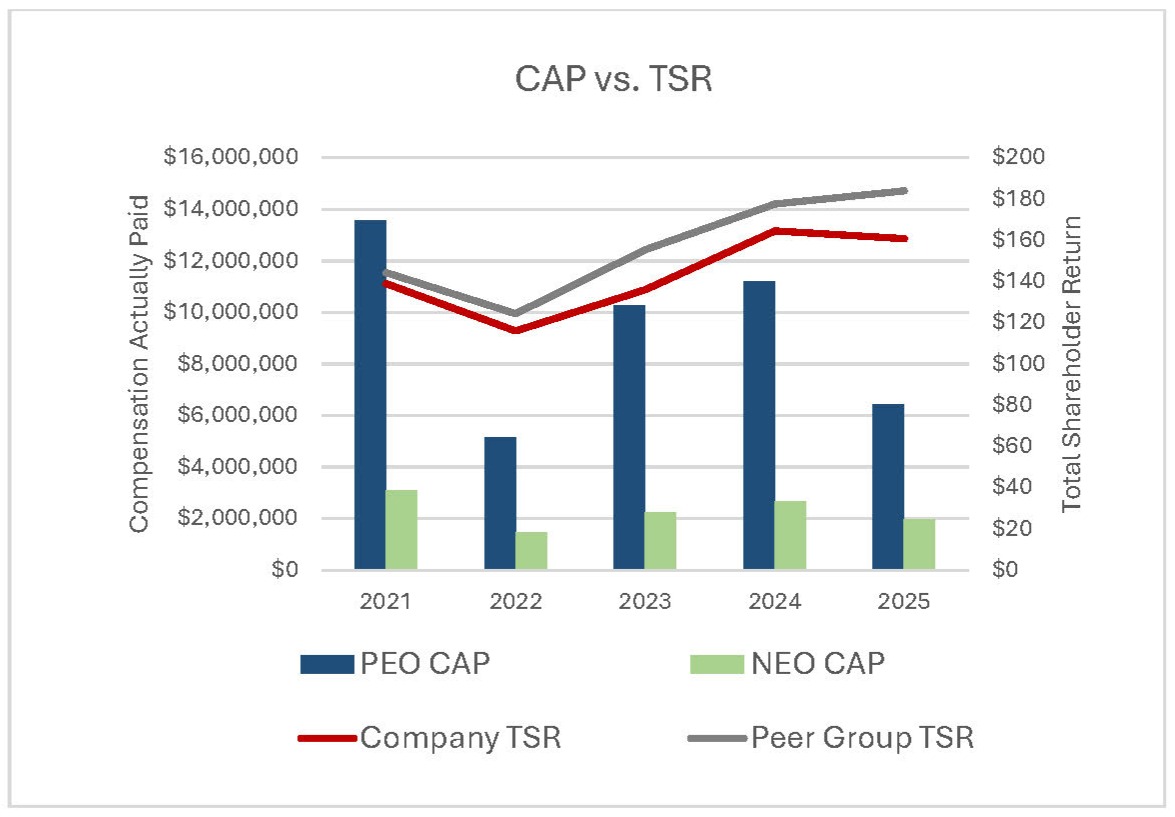
| Compensation Actually Paid vs. Total Shareholder Return |
The following chart provides a graphical representation of the Company's five-year cumulative TSR versus our industry peer group, the S&P Industrial Machinery Index, and of CAP to our CEO and other NEOs versus the Company's five-year cumulative TSR.
|
|
|
|
|
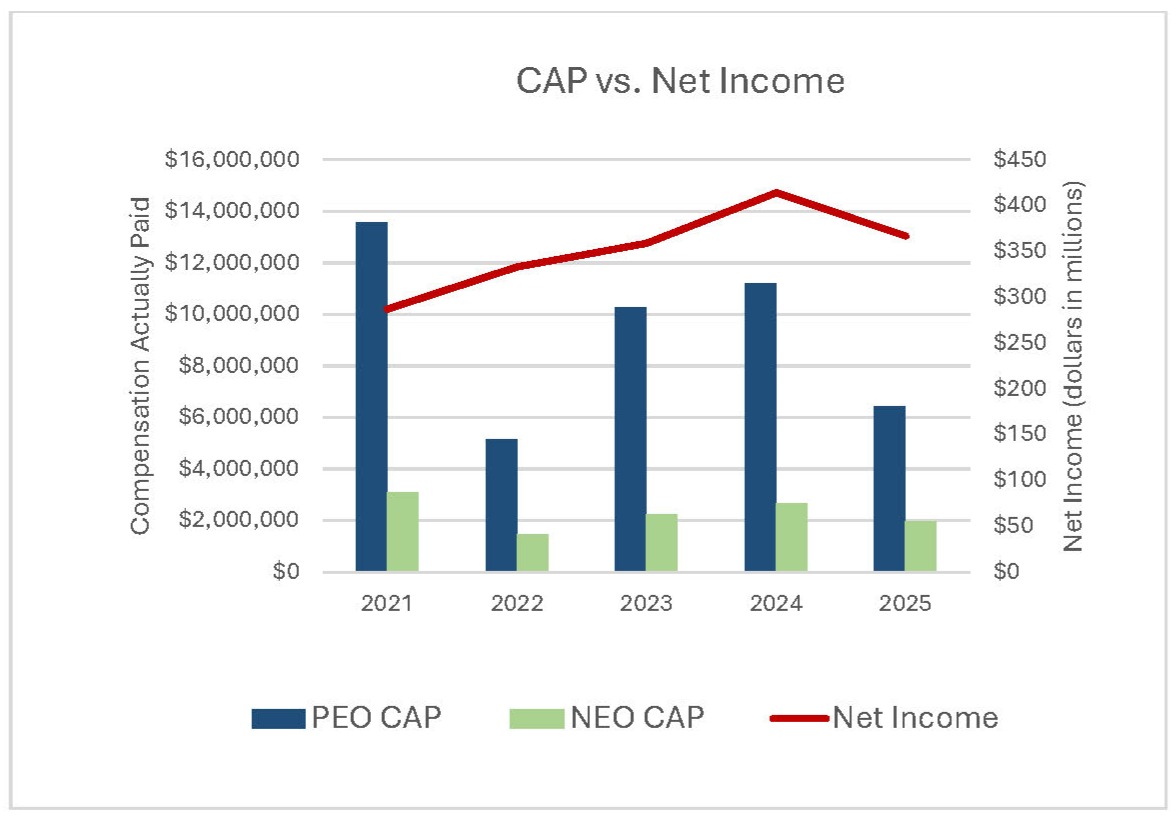
| Compensation Actually Paid vs. Net Income |
|
|
|
|
|
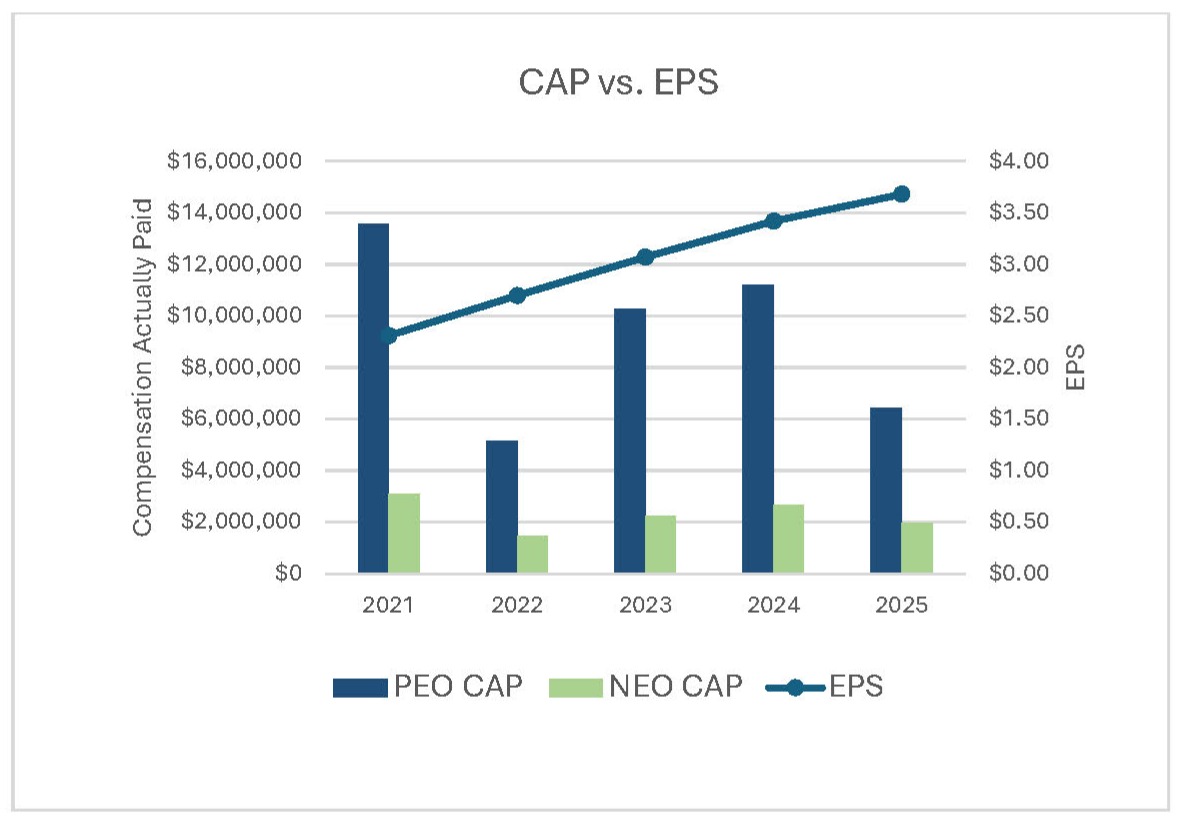
| Compensation Actually Paid vs. Company Selected Measure |
The following charts provide a graphical representation of the relationships between CAP and the Company's selected measure, Company Diluted EPS - Incentive, and between net income and CAP. Net income is not a performance metric we use when setting executive compensation but is included in these disclosures, as required.
|
|
|
|
|
| Total Shareholder Return Vs Peer Group |
The following chart provides a graphical representation of the Company's five-year cumulative TSR versus our industry peer group, the S&P Industrial Machinery Index, and of CAP to our CEO and other NEOs versus the Company's five-year cumulative TSR.
|
|
|
|
|
| Tabular List, Table |
| | | | Diluted Earnings Per Share - Incentive | | Net Sales | | Return on Investment | | Net Operating Profit |
|
|
|
|
|
| Total Shareholder Return Amount |
$ 161
|
165
|
136
|
116
|
139
|
| Peer Group Total Shareholder Return Amount |
184
|
178
|
155
|
124
|
144
|
| Net Income (Loss) |
$ 367,000,000
|
$ 414,000,000
|
$ 359,000,000
|
$ 333,000,000
|
$ 287,000,000
|
| Company Selected Measure Amount | $ / shares |
3.68
|
3.42
|
3.07
|
2.70
|
2.31
|
| PEO Name |
Mr. Carpenter
|
|
|
|
|
| Additional 402(v) Disclosure |
The dollar amounts reported in this column represent the average of the amounts reported for the Company's NEOs as a group (excluding our CEO) in the “Total” column of the SCT in each applicable year.
|
|
|
|
|
| Measure:: 1 |
|
|
|
|
|
| Pay vs Performance Disclosure |
|
|
|
|
|
| Name |
Diluted Earnings Per Share - Incentive
|
|
|
|
|
| Measure:: 2 |
|
|
|
|
|
| Pay vs Performance Disclosure |
|
|
|
|
|
| Name |
Net Sales
|
|
|
|
|
| Measure:: 3 |
|
|
|
|
|
| Pay vs Performance Disclosure |
|
|
|
|
|
| Name |
Return on Investment
|
|
|
|
|
| Measure:: 4 |
|
|
|
|
|
| Pay vs Performance Disclosure |
|
|
|
|
|
| Name |
Net Operating Profit
|
|
|
|
|
| PEO |
|
|
|
|
|
| Pay vs Performance Disclosure |
|
|
|
|
|
| Adjustment to Compensation, Amount |
$ (1,867,146)
|
|
|
|
|
| PEO | Year-end Fair Value of Equity Awards Granted in Covered Year that are Outstanding and Unvested |
|
|
|
|
|
| Pay vs Performance Disclosure |
|
|
|
|
|
| Adjustment to Compensation, Amount |
5,349,641
|
|
|
|
|
| PEO | Year-over-Year Change in Fair Value of Equity Awards Granted in Prior Years That are Outstanding and Unvested |
|
|
|
|
|
| Pay vs Performance Disclosure |
|
|
|
|
|
| Adjustment to Compensation, Amount |
(893,045)
|
|
|
|
|
| PEO | Change in Fair Value as of Vesting Date of Prior Year Equity Awards Vested in Covered Year |
|
|
|
|
|
| Pay vs Performance Disclosure |
|
|
|
|
|
| Adjustment to Compensation, Amount |
(541,725)
|
|
|
|
|
| PEO | Dividends or Other Earnings Paid on Equity Awards not Otherwise Reflected in Total Compensation for Covered Year |
|
|
|
|
|
| Pay vs Performance Disclosure |
|
|
|
|
|
| Adjustment to Compensation, Amount |
(78,442)
|
|
|
|
|
| PEO | Equity Awards Change In Amount Reported As Stock Awards Adjustments [Member] |
|
|
|
|
|
| Pay vs Performance Disclosure |
|
|
|
|
|
| Adjustment to Compensation, Amount |
(2,853,630)
|
|
|
|
|
| PEO | Equity Awards Change In Amount Reported As Option Awards Adjustments [Member] |
|
|
|
|
|
| Pay vs Performance Disclosure |
|
|
|
|
|
| Adjustment to Compensation, Amount |
(2,849,945)
|
|
|
|
|
| Non-PEO NEO |
|
|
|
|
|
| Pay vs Performance Disclosure |
|
|
|
|
|
| Adjustment to Compensation, Amount |
(559,713)
|
|
|
|
|
| Non-PEO NEO | Year-end Fair Value of Equity Awards Granted in Covered Year that are Outstanding and Unvested |
|
|
|
|
|
| Pay vs Performance Disclosure |
|
|
|
|
|
| Adjustment to Compensation, Amount |
805,120
|
|
|
|
|
| Non-PEO NEO | Year-over-Year Change in Fair Value of Equity Awards Granted in Prior Years That are Outstanding and Unvested |
|
|
|
|
|
| Pay vs Performance Disclosure |
|
|
|
|
|
| Adjustment to Compensation, Amount |
(137,943)
|
|
|
|
|
| Non-PEO NEO | Change in Fair Value as of Vesting Date of Prior Year Equity Awards Vested in Covered Year |
|
|
|
|
|
| Pay vs Performance Disclosure |
|
|
|
|
|
| Adjustment to Compensation, Amount |
(82,957)
|
|
|
|
|
| Non-PEO NEO | Prior Year End Fair Value of Equity Awards Granted in Any Prior Year that Fail to Meet Applicable Vesting Conditions During Covered Year |
|
|
|
|
|
| Pay vs Performance Disclosure |
|
|
|
|
|
| Adjustment to Compensation, Amount |
(132,663)
|
|
|
|
|
| Non-PEO NEO | Dividends or Other Earnings Paid on Equity Awards not Otherwise Reflected in Total Compensation for Covered Year |
|
|
|
|
|
| Pay vs Performance Disclosure |
|
|
|
|
|
| Adjustment to Compensation, Amount |
(15,361)
|
|
|
|
|
| Non-PEO NEO | Equity Awards Change In Amount Reported As Stock Awards Adjustments [Member] |
|
|
|
|
|
| Pay vs Performance Disclosure |
|
|
|
|
|
| Adjustment to Compensation, Amount |
(497,731)
|
|
|
|
|
| Non-PEO NEO | Equity Awards Change In Amount Reported As Option Awards Adjustments [Member] |
|
|
|
|
|
| Pay vs Performance Disclosure |
|
|
|
|
|
| Adjustment to Compensation, Amount |
$ (498,178)
|
|
|
|
|