Shareholder Report
Jul. 31, 2025
USD ($)
$ / shares
WHAT WERE THE FUND COSTS FOR THE LAST SIX MONTHS? (based on a hypothetical $10,000 investment)
|
Class Name
|
Costs of a $10,000 investment
|
Costs paid as a percentage of a $10,000 investment*
|
|
Class A
|
$78
|
1.54%
|
HOW DID THE FUND PERFORM DURING THE PERIOD?
The Fund’s Class A shares returned 3.39%, without sales charges, for the six-month period ending July 31, 2025. The Fund outperformed the Bloomberg U.S. Aggregate Bond Index, the Fund’s benchmark, by 19 basis points, as the benchmark returned 3.20% over the same period.
WHAT FACTORS INFLUENCED PERFORMANCE?
The Fund benefited from higher current income and spread outperformance within credit allocations, most notably in non-agency residential mortgage-backed securities (RMBS) and asset-backed securities (ABS). A shorter interest rate duration was the primary detractor from relative performance.
HOW WAS THE FUND POSITIONED DURING THE PERIOD?
The Fund reduced its allocation to non-agency RMBS to realize gains following spread compression while increasing exposure to agency RMBS to strengthen credit quality and position for potential spread tightening. Allocations to ABS and high-yield corporates were also increased in anticipation of further spread improvement.
|
Top Contributors
|
|
|
↑
|
Non-agency RMBS; ABS
|
|
Top Detractors
|
|
|
↓
|
Interest rate duration positioning
|
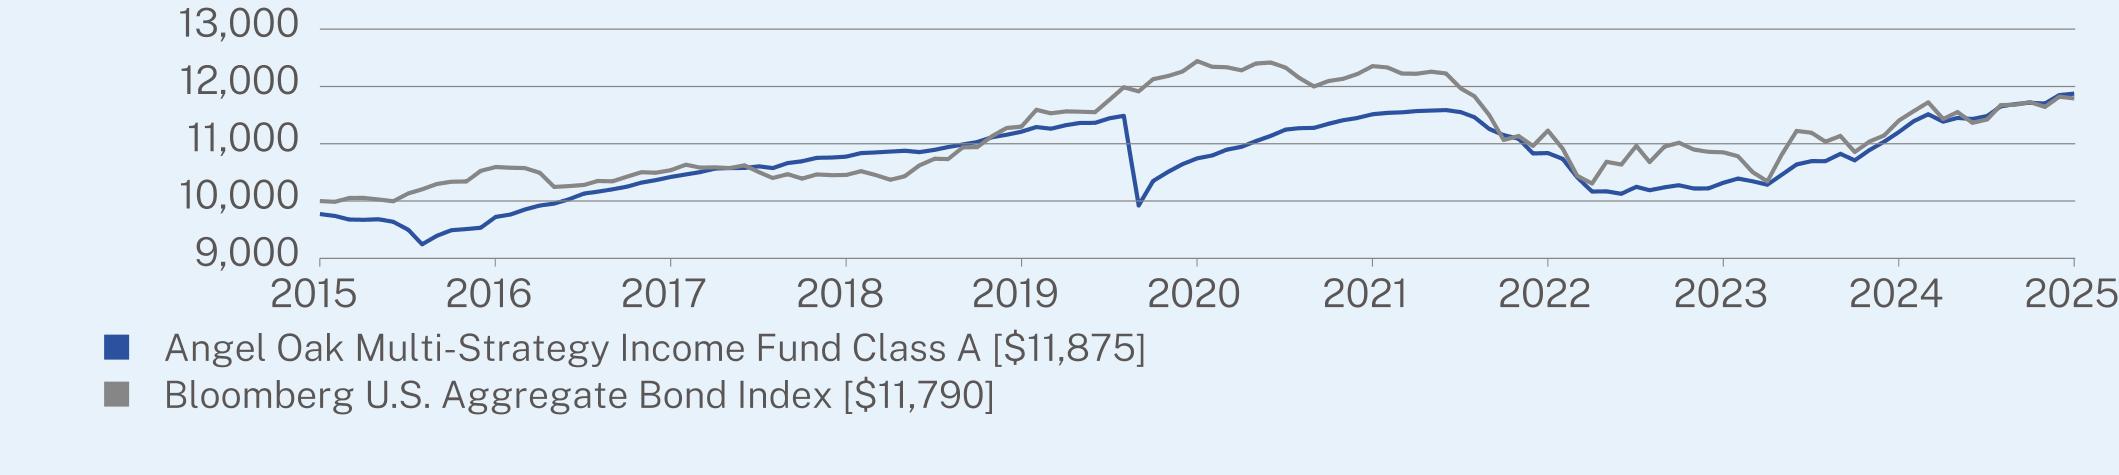
ANNUAL AVERAGE TOTAL RETURN (%)
|
|
1 Year
|
5 Year
|
10 Year
|
|
Class A (without sales charge)
|
5.97
|
2.02
|
1.97
|
|
Class A (with maximum 2.25% sales charge)
|
3.57
|
1.56
|
1.73
|
|
Bloomberg U.S. Aggregate Bond Index
|
3.38
|
-1.07
|
1.66
|
KEY FUND STATISTICS (as of July 31, 2025)
|
Net Assets
|
$2,701,609,209
|
Effective Duration
|
4.25 years
|
|
|
Number of Holdings
|
1,098
|
30-Day SEC Yield (Class A)
|
6.14%
|
|
|
Net Advisory Fee
|
$12,222,617
|
30-Day SEC Yield Unsubsidized (Class A)
|
6.14%
|
|
|
Portfolio Turnover
|
41%
|
Weighted Average Life
|
6.34 years
|
|
|
Average Credit Quality
|
BBB
|
Distribution Yield (Class A)
|
5.34%
|
WHAT DID THE FUND INVEST IN? (as of July 31, 2025)
Top Security Types (% of net assets)
|
Residential Mortgage-Backed Securities
|
47.3%
|
|
Asset-Backed Securities
|
18.4%
|
|
Residential Mortgage-Backed Securities - U.S. Government Agency
|
10.8%
|
|
Collateralized Loan Obligations
|
7.8%
|
|
Corporate Obligations
|
6.6%
|
|
Commercial Mortgage-Backed Securities
|
4.6%
|
|
Residential Mortgage-Backed Securities - U.S. Government Agency Credit Risk Transfer
|
4.1%
|
|
Commercial Mortgage-Backed Securities - U.S. Government Agency
|
3.2%
|
|
Money Market Funds
|
2.9%
|
|
Cash & Other
|
-5.7%
|
Top 10 Issuers (% of net assets)
|
Federal National Mortgage Association
|
9.7%
|
|
Federal Home Loan Mortgage Corp.
|
7.8%
|
|
Saluda Grade Mortgage Funding LLC
|
4.0%
|
|
JP Morgan Mortgage Trust
|
4.0%
|
|
GS Mortgage-Backed Securities Trust
|
4.0%
|
|
First American Government Obligations Fund
|
2.9%
|
|
Exeter Automobile Receivables Trust
|
2.5%
|
|
Credit Suisse Mortgage Capital Certificates
|
2.4%
|
|
Helios Loan Funding Trust
|
2.3%
|
|
Verus Securitization Trust
|
2.1%
|
Credit Ratings Breakdown (% of net assets)*
|
AAA
|
8.9%
|
|
AA
|
19.5%
|
|
A
|
5.8%
|
|
BBB
|
11.7%
|
|
BB
|
23.9%
|
|
B
|
5.4%
|
|
CCC
|
3.2%
|
|
CC
|
0.3%
|
|
C
|
0.1%
|
|
NR
|
21.2%
|
Material Fund Changes:
Effective April 1, 2025, the ultimate parent of the Fund’s investment adviser announced a strategic partnership with Brookfield Asset Management Ltd. (“Brookfield”) in which Brookfield has agreed to acquire a majority of the ultimate parent of the Fund’s investment adviser (the “Transaction”). The Transaction is not expected to result in any material change in the day-to-day management of the Fund.
This is a summary of certain changes to the Fund since February 1, 2025. For more complete information, you may review the Fund’s current prospectus, dated May 31, 2025, as supplemented to date, which is available at https://angeloakcapital.com/resources/ or upon request at 1-855-751-4324.
WHAT WERE THE FUND COSTS FOR THE LAST SIX MONTHS? (based on a hypothetical $10,000 investment)
|
Class Name
|
Costs of a $10,000 investment
|
Costs paid as a percentage of a $10,000 investment*
|
|
Class C
|
$115
|
2.29%
|
HOW DID THE FUND PERFORM DURING THE PERIOD?
The Fund’s Class C shares returned 2.93%, without sales charges, for the six-month period ending July 31, 2025. The Fund underperformed the Bloomberg U.S. Aggregate Bond Index, the Fund’s benchmark, by 27 basis points, as the benchmark returned 3.20% over the same period.
WHAT FACTORS INFLUENCED PERFORMANCE?
The Fund benefited from higher current income and spread outperformance within credit allocations, most notably in non-agency residential mortgage-backed securities (RMBS) and asset-backed securities (ABS). A shorter interest rate duration was the primary detractor from relative performance.
HOW WAS THE FUND POSITIONED DURING THE PERIOD?
The Fund reduced its allocation to non-agency RMBS to realize gains following spread compression while increasing exposure to agency RMBS to strengthen credit quality and position for potential spread tightening. Allocations to ABS and high-yield corporates were also increased in anticipation of further spread improvement.
|
Top Contributors
|
|
|
↑
|
Non-agency RMBS; ABS
|
|
Top Detractors
|
|
|
↓
|
Interest rate duration positioning
|
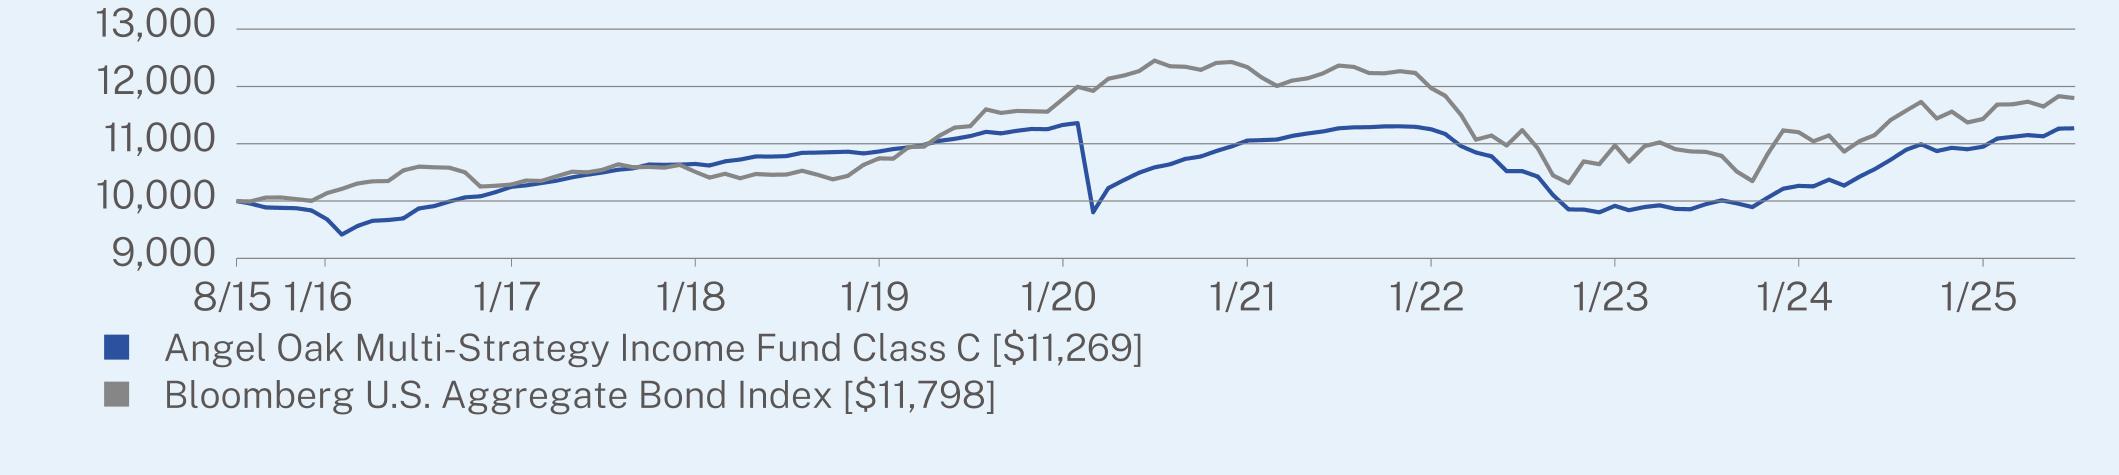
ANNUAL AVERAGE TOTAL RETURN (%)
|
|
1 Year
|
5 Year
|
Since Inception
(08/04/2015) |
|
Class C (without sales charge)
|
5.14
|
1.25
|
1.20
|
|
Class C (with maximum 1.00% deferred sales charge)
|
4.14
|
1.25
|
1.20
|
|
Bloomberg U.S. Aggregate Bond Index
|
3.38
|
-1.07
|
1.67
|
KEY FUND STATISTICS (as of July 31, 2025)
|
Net Assets
|
$2,701,609,209
|
Effective Duration
|
4.25 years
|
|
|
Number of Holdings
|
1,098
|
30-Day SEC Yield (Class C)
|
5.53%
|
|
|
Net Advisory Fee
|
$12,222,617
|
30-Day SEC Yield Unsubsidized (Class C)
|
5.53%
|
|
|
Portfolio Turnover
|
41%
|
Weighted Average Life
|
6.34 years
|
|
|
Average Credit Quality
|
BBB
|
Distribution Yield (Class C)
|
4.64%
|
WHAT DID THE FUND INVEST IN? (as of July 31, 2025)
Top Security Types (% of net assets)
|
Residential Mortgage-Backed Securities
|
47.3%
|
|
Asset-Backed Securities
|
18.4%
|
|
Residential Mortgage-Backed Securities - U.S. Government Agency
|
10.8%
|
|
Collateralized Loan Obligations
|
7.8%
|
|
Corporate Obligations
|
6.6%
|
|
Commercial Mortgage-Backed Securities
|
4.6%
|
|
Residential Mortgage-Backed Securities - U.S. Government Agency Credit Risk Transfer
|
4.1%
|
|
Commercial Mortgage-Backed Securities - U.S. Government Agency
|
3.2%
|
|
Money Market Funds
|
2.9%
|
|
Cash & Other
|
-5.7%
|
Top 10 Issuers (% of net assets)
|
Federal National Mortgage Association
|
9.7%
|
|
Federal Home Loan Mortgage Corp.
|
7.8%
|
|
Saluda Grade Mortgage Funding LLC
|
4.0%
|
|
JP Morgan Mortgage Trust
|
4.0%
|
|
GS Mortgage-Backed Securities Trust
|
4.0%
|
|
First American Government Obligations Fund
|
2.9%
|
|
Exeter Automobile Receivables Trust
|
2.5%
|
|
Credit Suisse Mortgage Capital Certificates
|
2.4%
|
|
Helios Loan Funding Trust
|
2.3%
|
|
Verus Securitization Trust
|
2.1%
|
Credit Ratings Breakdown (% of net assets)*
|
AAA
|
8.9%
|
|
AA
|
19.5%
|
|
A
|
5.8%
|
|
BBB
|
11.7%
|
|
BB
|
23.9%
|
|
B
|
5.4%
|
|
CCC
|
3.2%
|
|
CC
|
0.3%
|
|
C
|
0.1%
|
|
NR
|
21.2%
|
Material Fund Changes:
Effective April 1, 2025, the ultimate parent of the Fund’s investment adviser announced a strategic partnership with Brookfield Asset Management Ltd. (“Brookfield”) in which Brookfield has agreed to acquire a majority of the ultimate parent of the Fund’s investment adviser (the “Transaction”). The Transaction is not expected to result in any material change in the day-to-day management of the Fund.
This is a summary of certain changes to the Fund since February 1, 2025. For more complete information, you may review the Fund’s current prospectus, dated May 31, 2025, as supplemented to date, which is available at https://angeloakcapital.com/resources/ or upon request at 1-855-751-4324.
WHAT WERE THE FUND COSTS FOR THE LAST SIX MONTHS? (based on a hypothetical $10,000 investment)
|
Class Name
|
Costs of a $10,000 investment
|
Costs paid as a percentage of a $10,000 investment*
|
|
Institutional Class
|
$65
|
1.29%
|
HOW DID THE FUND PERFORM DURING THE PERIOD?
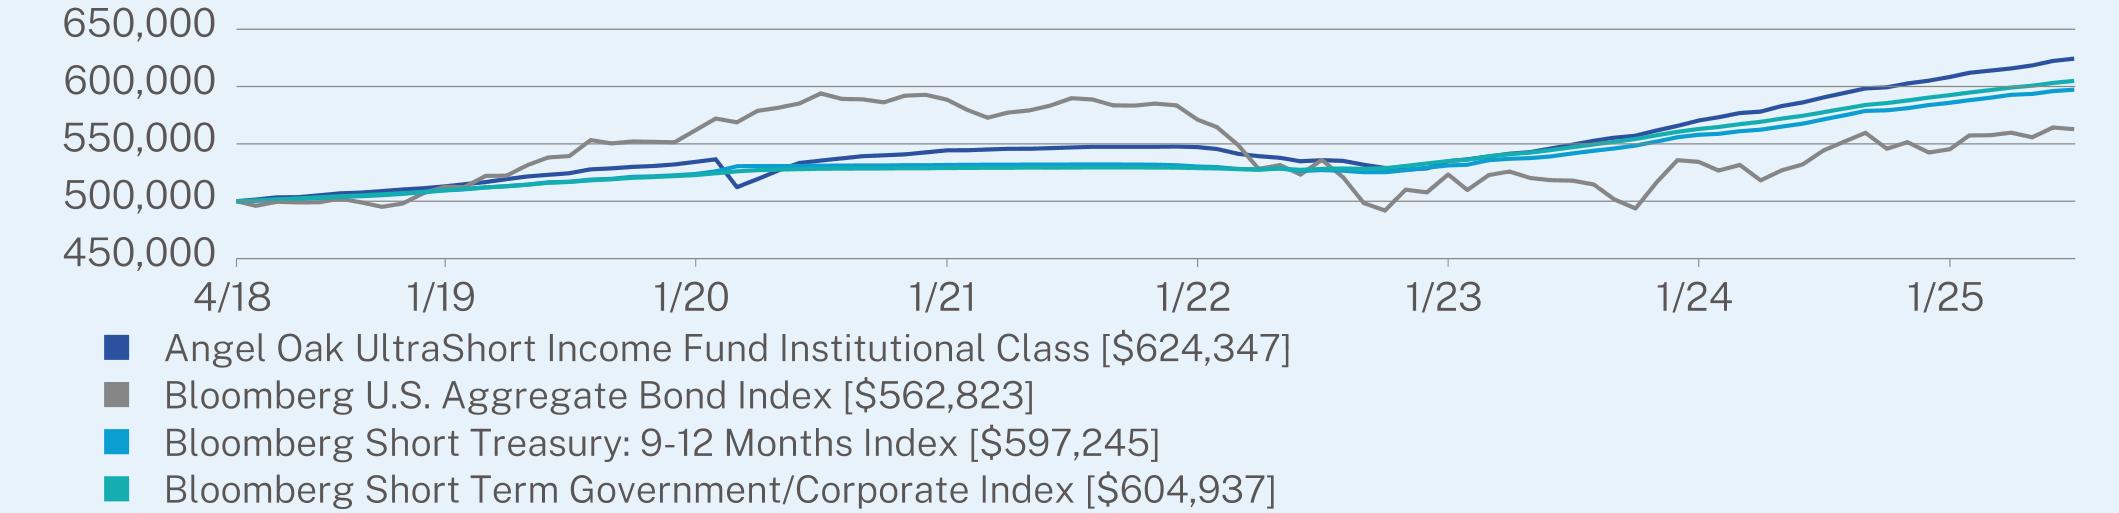
The Fund’s Institutional Class shares returned 3.53% for the six-month period ending July 31, 2025. The Fund outperformed the Bloomberg U.S. Aggregate Bond Index, the Fund’s benchmark, by 33 basis points, as the benchmark returned 3.20% over the same period.
WHAT FACTORS INFLUENCED PERFORMANCE?
The Fund benefited from higher current income and spread outperformance within credit allocations, most notably in non-agency residential mortgage-backed securities (RMBS) and asset-backed securities (ABS). A shorter interest rate duration was the primary detractor from relative performance.
HOW WAS THE FUND POSITIONED DURING THE PERIOD?
The Fund reduced its allocation to non-agency RMBS to realize gains following spread compression while increasing exposure to agency RMBS to strengthen credit quality and position for potential spread tightening. Allocations to ABS and high-yield corporates were also increased in anticipation of further spread improvement.
|
Top Contributors
|
|
|
↑
|
Non-agency RMBS; ABS
|
|
Top Detractors
|
|
|
↓
|
Interest rate duration positioning
|
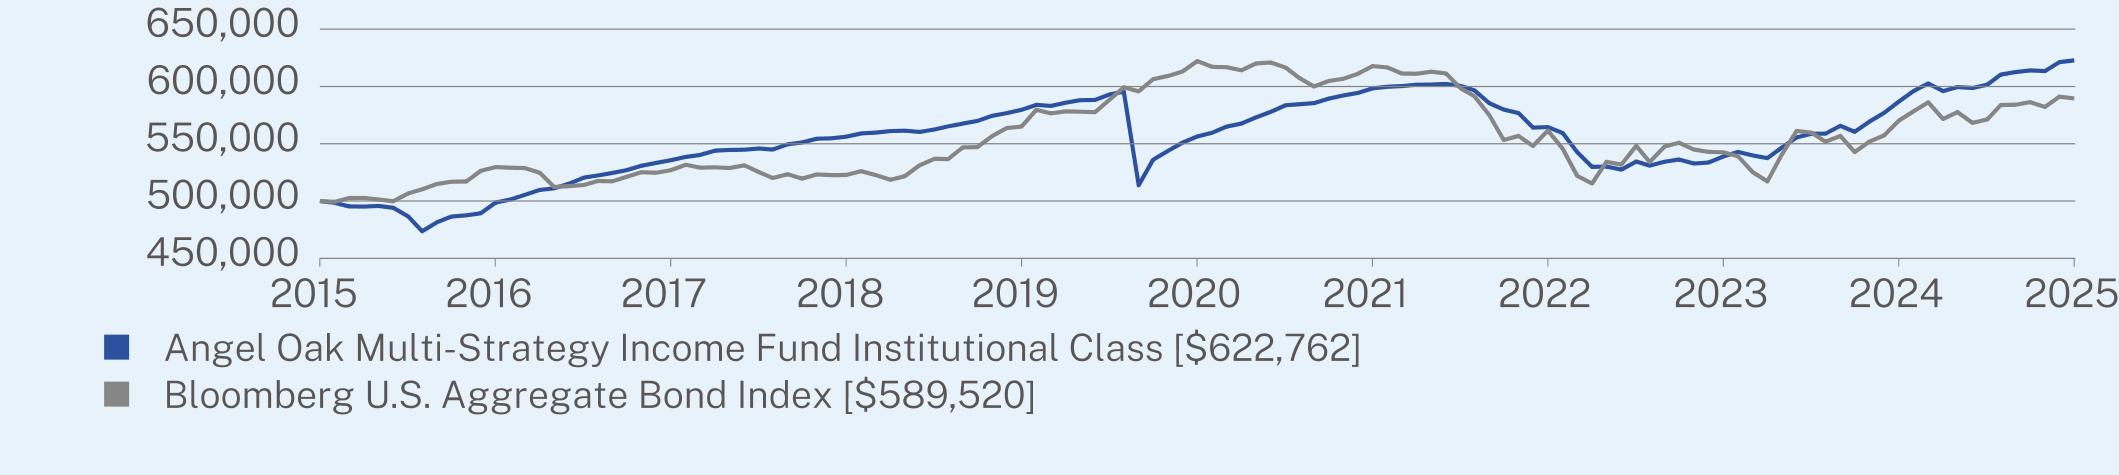
ANNUAL AVERAGE TOTAL RETURN (%)
|
|
1 Year
|
5 Year
|
10 Year
|
|
Institutional Class
|
6.13
|
2.28
|
2.22
|
|
Bloomberg U.S. Aggregate Bond Index
|
3.38
|
-1.07
|
1.66
|
KEY FUND STATISTICS (as of July 31, 2025)
|
Net Assets
|
$2,701,609,209
|
Effective Duration
|
4.25 years
|
|
|
Number of Holdings
|
1,098
|
30-Day SEC Yield (Institutional Class)
|
6.54%
|
|
|
Net Advisory Fee
|
$12,222,617
|
30-Day SEC Yield Unsubsidized (Institutional Class)
|
6.54%
|
|
|
Portfolio Turnover
|
41%
|
Weighted Average Life
|
6.34 years
|
|
|
Average Credit Quality
|
BBB
|
Distribution Yield (Institutional Class)
|
5.62%
|
WHAT DID THE FUND INVEST IN? (as of July 31, 2025)
Top Security Types (% of net assets)
|
Residential Mortgage-Backed Securities
|
47.3%
|
|
Asset-Backed Securities
|
18.4%
|
|
Residential Mortgage-Backed Securities - U.S. Government Agency
|
10.8%
|
|
Collateralized Loan Obligations
|
7.8%
|
|
Corporate Obligations
|
6.6%
|
|
Commercial Mortgage-Backed Securities
|
4.6%
|
|
Residential Mortgage-Backed Securities - U.S. Government Agency Credit Risk Transfer
|
4.1%
|
|
Commercial Mortgage-Backed Securities - U.S. Government Agency
|
3.2%
|
|
Money Market Funds
|
2.9%
|
|
Cash & Other
|
-5.7%
|
Top 10 Issuers (% of net assets)
|
Federal National Mortgage Association
|
9.7%
|
|
Federal Home Loan Mortgage Corp.
|
7.8%
|
|
Saluda Grade Mortgage Funding LLC
|
4.0%
|
|
JP Morgan Mortgage Trust
|
4.0%
|
|
GS Mortgage-Backed Securities Trust
|
4.0%
|
|
First American Government Obligations Fund
|
2.9%
|
|
Exeter Automobile Receivables Trust
|
2.5%
|
|
Credit Suisse Mortgage Capital Certificates
|
2.4%
|
|
Helios Loan Funding Trust
|
2.3%
|
|
Verus Securitization Trust
|
2.1%
|
Credit Ratings Breakdown (% of net assets)*
|
AAA
|
8.9%
|
|
AA
|
19.5%
|
|
A
|
5.8%
|
|
BBB
|
11.7%
|
|
BB
|
23.9%
|
|
B
|
5.4%
|
|
CCC
|
3.2%
|
|
CC
|
0.3%
|
|
C
|
0.1%
|
|
NR
|
21.2%
|
Material Fund Changes:
Effective April 1, 2025, the ultimate parent of the Fund’s investment adviser announced a strategic partnership with Brookfield Asset Management Ltd. (“Brookfield”) in which Brookfield has agreed to acquire a majority of the ultimate parent of the Fund’s investment adviser (the “Transaction”). The Transaction is not expected to result in any material change in the day-to-day management of the Fund.
This is a summary of certain changes to the Fund since February 1, 2025. For more complete information, you may review the Fund’s current prospectus, dated May 31, 2025, as supplemented to date, which is available at https://angeloakcapital.com/resources/ or upon request at 1-855-751-4324.
WHAT WERE THE FUND COSTS FOR THE LAST SIX MONTHS? (based on a hypothetical $10,000 investment)
|
Class Name
|
Costs of a $10,000 investment
|
Costs paid as a percentage of a $10,000 investment*
|
|
Class A
|
$30
|
0.60%
|
HOW DID THE FUND PERFORM DURING THE PERIOD?
The Fund’s Class A shares returned 2.50% for the six-month period ending July 31, 2025. The Fund outperformed the Bloomberg Short Treasury: 9-12 Months Index and the Bloomberg Short-Term Government/Corporate Index, the Fund’s performance benchmarks, by 56 basis points (bps) and 42 bps, respectively, as the performance benchmarks returned 1.94% and 2.08%, respectively.
WHAT FACTORS INFLUENCED PERFORMANCE?
The Fund outperformed its performance benchmarks during the period, supported by overweight allocations to investment-grade (IG) asset-backed securities (ABS), non-agency residential mortgage-backed securities (RMBS), collateralized loan obligations (CLOs), and IG corporates. Higher income, stronger yields, and tighter spreads across these sectors further enhanced relative performance.
HOW WAS THE FUND POSITIONED DURING THE PERIOD?
The Fund maintained an overweight to securitized credit, with increased allocations to IG ABS, non-agency RMBS, and CLOs, all of which contributed positively.
|
Top Contributors
|
|
|
↑
|
High income relative to performance benchmarks; investment-grade securitized credit
|
|
Top Detractors
|
|
|
↓
|
Cash and government allocations with lower yield versus credit sectors
|
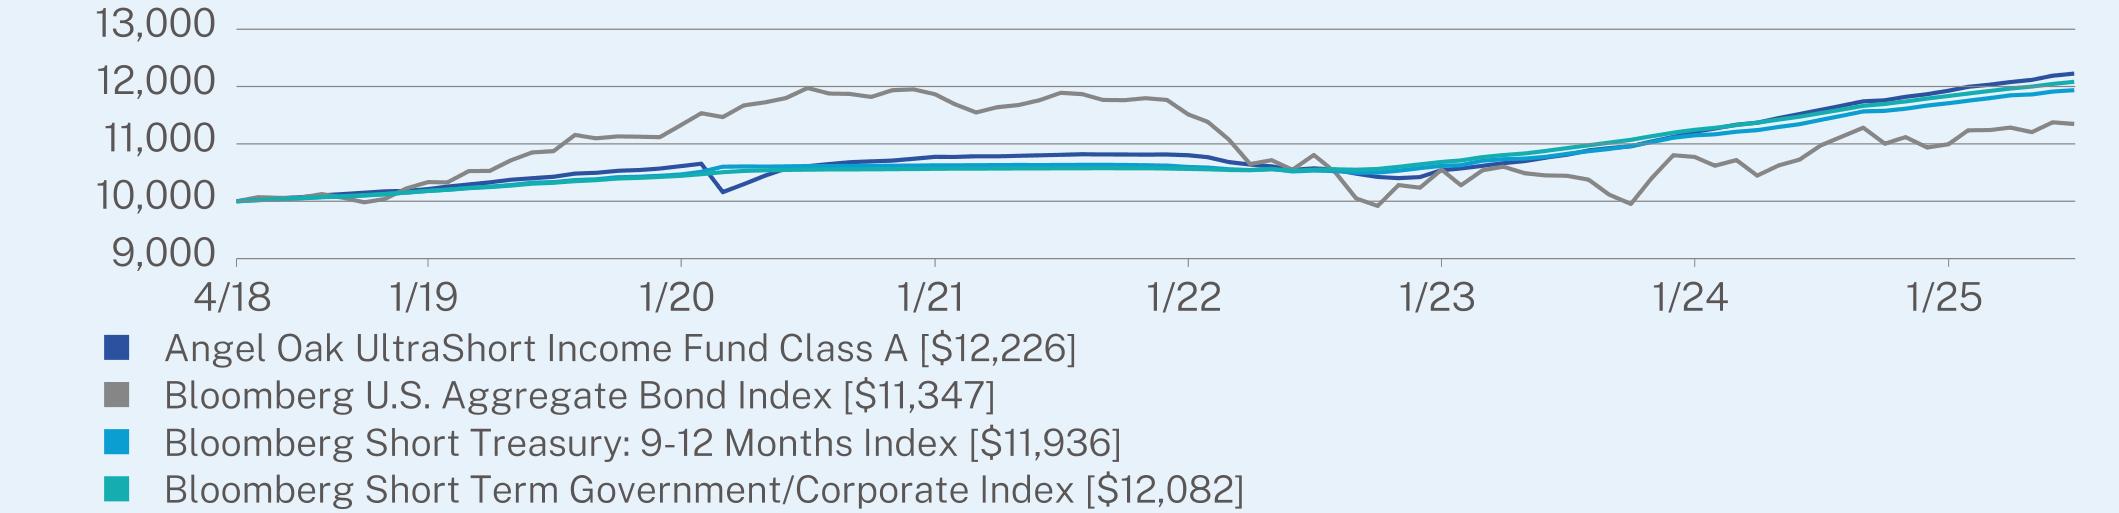
ANNUAL AVERAGE TOTAL RETURN (%)
|
|
1 Year
|
5 Year
|
Since Inception
(04/30/2018) |
|
Class A
|
5.46
|
2.88
|
2.81
|
|
Bloomberg U.S. Aggregate Bond Index
|
3.38
|
-1.07
|
1.76
|
|
Bloomberg Short Treasury: 9-12 Months Index
|
4.52
|
2.38
|
2.47
|
|
Bloomberg Short Term Government/Corporate Index
|
4.72
|
2.75
|
2.64
|
KEY FUND STATISTICS (as of July 31, 2025)
|
Net Assets
|
$660,246,034
|
Effective Duration
|
0.79 years
|
|
|
Number of Holdings
|
437
|
30-Day SEC Yield (Class A)
|
4.70%
|
|
|
Net Advisory Fee
|
$705,667
|
30-Day SEC Yield Unsubsidized (Class A)
|
4.50%
|
|
|
Portfolio Turnover
|
38%
|
Weighted Average Life
|
1.58 years
|
|
|
Average Credit Quality
|
A
|
Distribution Yield (Class A)
|
4.82%
|
WHAT DID THE FUND INVEST IN? (as of July 31, 2025)
Top Security Types (% of net assets)
|
Asset-Backed Securities
|
31.3%
|
|
Commercial Mortgage-Backed Securities - U.S. Government Agency
|
18.3%
|
|
Corporate Obligations
|
16.1%
|
|
Collateralized Loan Obligations
|
14.7%
|
|
Residential Mortgage-Backed Securities
|
13.8%
|
|
Money Market Funds
|
3.0%
|
|
Commercial Mortgage-Backed Securities
|
2.9%
|
|
Residential Mortgage-Backed Securities - U.S. Government Agency Credit Risk Transfer
|
0.8%
|
|
Futures Contracts
|
0.2%
|
|
Cash & Other
|
-1.1%
|
Top 10 Issuers (% of net assets)
|
Federal Home Loan Mortgage Corp.
|
18.0%
|
|
Pagaya AI Debt Selection Trust
|
9.4%
|
|
First American Government Obligations Fund
|
3.0%
|
|
Avis Budget Car Rental LLC
|
1.6%
|
|
Vista Point Securitization Trust
|
1.6%
|
|
GS Mortgage-Backed Securities Trust
|
1.5%
|
|
ACHV ABS Trust
|
1.4%
|
|
American Credit Acceptance Receivables Trust
|
1.4%
|
|
Onslow Bay Mortgage Loan Trust
|
1.3%
|
|
Federal National Mortgage Association
|
1.3%
|
Credit Ratings Breakdown (% of net assets)*
|
AAA
|
31.5%
|
|
AA
|
25.3%
|
|
A
|
20.1%
|
|
BBB
|
18.2%
|
|
BB
|
2.4%
|
|
B
|
0.7%
|
|
CCC
|
0.0%
|
|
CC
|
0.0%
|
|
C
|
0.1%
|
|
NR
|
1.7%
|
Material Fund Changes:
Effective April 1, 2025, the ultimate parent of the Fund’s investment adviser announced a strategic partnership with Brookfield Asset Management Ltd. (“Brookfield”) in which Brookfield has agreed to acquire a majority of the ultimate parent of the Fund’s investment adviser (the “Transaction”). The Transaction is not expected to result in any material change in the day-to-day management of the Fund.
This is a summary of certain changes to the Fund since February 1, 2025. For more complete information, you may review the Fund’s current prospectus, dated May 31, 2025, as supplemented to date, which is available at https://angeloakcapital.com/resources/ or upon request at 1-855-751-4324.
WHAT WERE THE FUND COSTS FOR THE LAST SIX MONTHS? (based on a hypothetical $10,000 investment)
|
Class Name
|
Costs of a $10,000 investment
|
Costs paid as a percentage of a $10,000 investment*
|
|
Class A1
|
$30
|
0.60%
|
HOW DID THE FUND PERFORM DURING THE PERIOD?
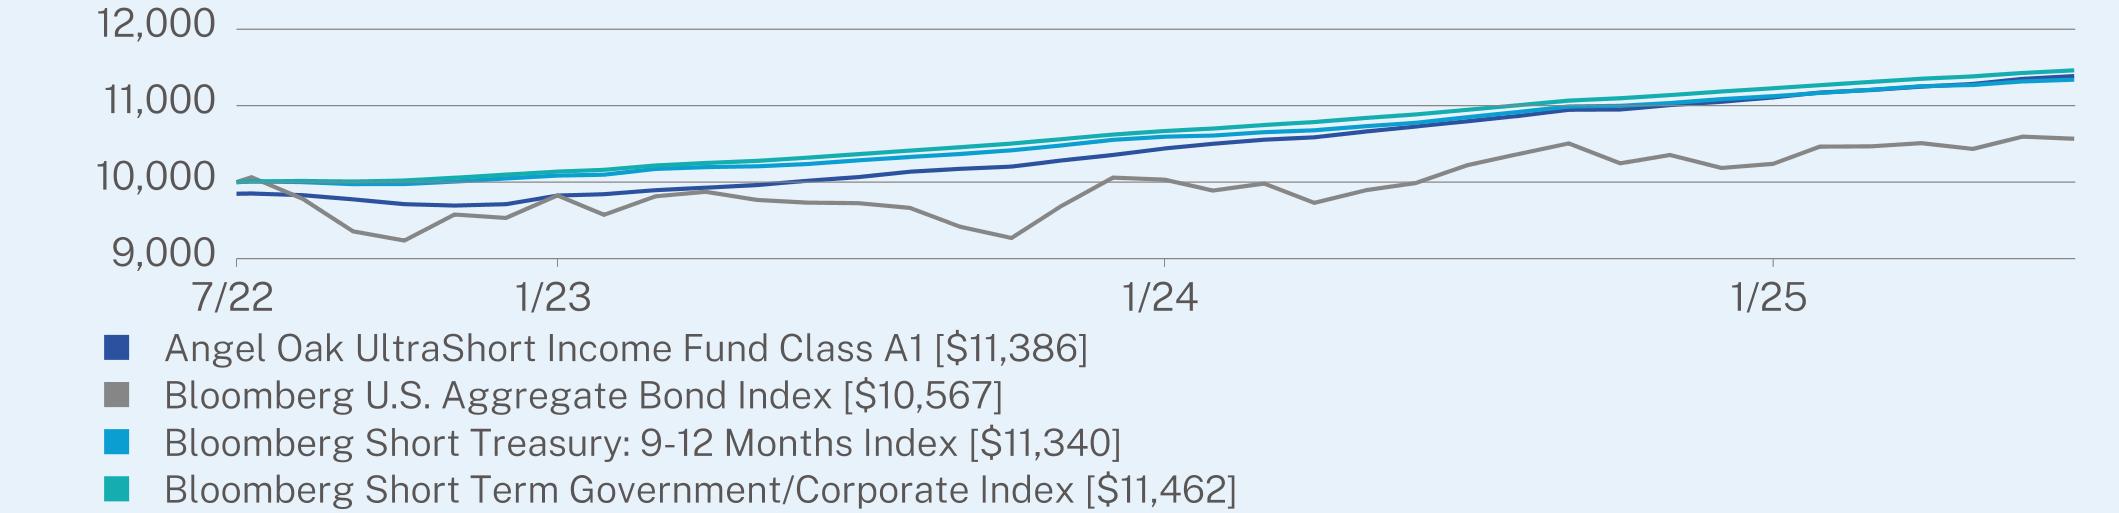
The Fund’s Class A1 shares returned 2.50%, without sales charges, for the six-month period ending July 31, 2025. The Fund outperformed the Bloomberg Short Treasury: 9-12 Months Index and the Bloomberg Short-Term Government/Corporate Index, the Fund’s performance benchmarks, by 56 basis points (bps) and 42 bps, respectively, as the performance benchmarks returned 1.94% and 2.08%, respectively.
WHAT FACTORS INFLUENCED PERFORMANCE?
The Fund outperformed its performance benchmarks during the period, supported by overweight allocations to investment-grade (IG) asset-backed securities (ABS), non-agency residential mortgage-backed securities (RMBS), collateralized loan obligations (CLOs), and IG corporates. Higher income, stronger yields, and tighter spreads across these sectors further enhanced relative performance.
HOW WAS THE FUND POSITIONED DURING THE PERIOD?
The Fund maintained an overweight to securitized credit, with increased allocations to IG ABS, non-agency RMBS, and CLOs, all of which contributed positively.
|
Top Contributors
|
|
|
↑
|
High income relative to performance benchmarks; investment-grade securitized credit
|
|
Top Detractors
|
|
|
↓
|
Cash and government allocations with lower yield versus credit sectors
|
ANNUAL AVERAGE TOTAL RETURN (%)
|
|
1 Year
|
Since Inception
(07/22/2022) |
|
Class A1 (without sales charge)
|
5.47
|
4.92
|
|
Class A1 (with maximum 1.50% sales charge)
|
3.39
|
4.39
|
|
Bloomberg U.S. Aggregate Bond Index
|
3.38
|
1.84
|
|
Bloomberg Short Treasury: 9-12 Months Index
|
4.52
|
4.24
|
|
Bloomberg Short Term Government/Corporate Index
|
4.72
|
4.62
|
KEY FUND STATISTICS (as of July 31, 2025)
|
Net Assets
|
$660,246,034
|
Effective Duration
|
0.79 years
|
|
|
Number of Holdings
|
437
|
30-Day SEC Yield (Class A1)
|
4.74%
|
|
|
Net Advisory Fee
|
$705,667
|
30-Day SEC Yield Unsubsidized (Class A1)
|
4.53%
|
|
|
Portfolio Turnover
|
38%
|
Weighted Average Life
|
1.58 years
|
|
|
Average Credit Quality
|
A
|
Distribution Yield (Class A1)
|
4.83%
|
WHAT DID THE FUND INVEST IN? (as of July 31, 2025)
Top Security Types (% of net assets)
|
Asset-Backed Securities
|
31.3%
|
|
Commercial Mortgage-Backed Securities - U.S. Government Agency
|
18.3%
|
|
Corporate Obligations
|
16.1%
|
|
Collateralized Loan Obligations
|
14.7%
|
|
Residential Mortgage-Backed Securities
|
13.8%
|
|
Money Market Funds
|
3.0%
|
|
Commercial Mortgage-Backed Securities
|
2.9%
|
|
Residential Mortgage-Backed Securities - U.S. Government Agency Credit Risk Transfer
|
0.8%
|
|
Futures Contracts
|
0.2%
|
|
Cash & Other
|
-1.1%
|
Top 10 Issuers (% of net assets)
|
Federal Home Loan Mortgage Corp.
|
18.0%
|
|
Pagaya AI Debt Selection Trust
|
9.4%
|
|
First American Government Obligations Fund
|
3.0%
|
|
Avis Budget Car Rental LLC
|
1.6%
|
|
Vista Point Securitization Trust
|
1.6%
|
|
GS Mortgage-Backed Securities Trust
|
1.5%
|
|
ACHV ABS Trust
|
1.4%
|
|
American Credit Acceptance Receivables Trust
|
1.4%
|
|
Onslow Bay Mortgage Loan Trust
|
1.3%
|
|
Federal National Mortgage Association
|
1.3%
|
Credit Ratings Breakdown (% of net assets)*
|
AAA
|
31.5%
|
|
AA
|
25.3%
|
|
A
|
20.1%
|
|
BBB
|
18.2%
|
|
BB
|
2.4%
|
|
B
|
0.7%
|
|
CCC
|
0.0%
|
|
CC
|
0.0%
|
|
C
|
0.1%
|
|
NR
|
1.7%
|
Material Fund Changes:
Effective April 1, 2025, the ultimate parent of the Fund’s investment adviser announced a strategic partnership with Brookfield Asset Management Ltd. (“Brookfield”) in which Brookfield has agreed to acquire a majority of the ultimate parent of the Fund’s investment adviser (the “Transaction”). The Transaction is not expected to result in any material change in the day-to-day management of the Fund.
This is a summary of certain changes to the Fund since February 1, 2025. For more complete information, you may review the Fund’s current prospectus, dated May 31, 2025, as supplemented to date, which is available at https://angeloakcapital.com/resources/ or upon request at 1-855-751-4324.
WHAT WERE THE FUND COSTS FOR THE LAST SIX MONTHS? (based on a hypothetical $10,000 investment)
|
Class Name
|
Costs of a $10,000 investment
|
Costs paid as a percentage of a $10,000 investment*
|
|
Institutional Class
|
$18
|
0.35%
|
HOW DID THE FUND PERFORM DURING THE PERIOD?
The Fund’s Institutional Class shares returned 2.62% for the six-month period ending July 31, 2025. The Fund outperformed the Bloomberg Short Treasury: 9-12 Months Index and the Bloomberg Short-Term Government/Corporate Index, the Fund’s performance benchmarks, by 68 basis points (bps) and 54 bps, respectively, as the performance benchmarks returned 1.94% and 2.08%, respectively.
WHAT FACTORS INFLUENCED PERFORMANCE?
The Fund outperformed its performance benchmarks during the period, supported by overweight allocations to investment-grade (IG) asset-backed securities (ABS), non-agency residential mortgage-backed securities (RMBS), collateralized loan obligations (CLOs), and IG corporates. Higher income, stronger yields, and tighter spreads across these sectors further enhanced relative performance.
HOW WAS THE FUND POSITIONED DURING THE PERIOD?
The Fund maintained an overweight to securitized credit, with increased allocations to IG ABS, non-agency RMBS, and CLOs, all of which contributed positively.
|
Top Contributors
|
|
|
↑
|
High income relative to performance benchmarks; investment-grade securitized credit
|
|
Top Detractors
|
|
|
↓
|
Cash and government allocations with lower yield versus credit sectors
|
ANNUAL AVERAGE TOTAL RETURN (%)
|
|
1 Year
|
5 Year
|
Since Inception
(04/02/2018) |
|
Institutional Class
|
5.72
|
3.12
|
3.08
|
|
Bloomberg U.S. Aggregate Bond Index
|
3.38
|
-1.07
|
1.63
|
|
Bloomberg Short Treasury: 9-12 Months Index
|
4.52
|
2.38
|
2.45
|
|
Bloomberg Short Term Government/Corporate Index
|
4.72
|
2.75
|
2.63
|
KEY FUND STATISTICS (as of July 31, 2025)
|
Net Assets
|
$660,246,034
|
Effective Duration
|
0.79 years
|
|
|
Number of Holdings
|
437
|
30-Day SEC Yield (Institutional Class)
|
5.06%
|
|
|
Net Advisory Fee
|
$705,667
|
30-Day SEC Yield Unsubsidized (Institutional Class)
|
4.86%
|
|
|
Portfolio Turnover
|
38%
|
Weighted Average Life
|
1.58 years
|
|
|
Average Credit Quality
|
A
|
Distribution Yield (Institutional Class)
|
5.08%
|
WHAT DID THE FUND INVEST IN? (as of July 31, 2025)
Top Security Types (% of net assets)
|
Asset-Backed Securities
|
31.3%
|
|
Commercial Mortgage-Backed Securities - U.S. Government Agency
|
18.3%
|
|
Corporate Obligations
|
16.1%
|
|
Collateralized Loan Obligations
|
14.7%
|
|
Residential Mortgage-Backed Securities
|
13.8%
|
|
Money Market Funds
|
3.0%
|
|
Commercial Mortgage-Backed Securities
|
2.9%
|
|
Residential Mortgage-Backed Securities - U.S. Government Agency Credit Risk Transfer
|
0.8%
|
|
Futures Contracts
|
0.2%
|
|
Cash & Other
|
-1.1%
|
Top 10 Issuers (% of net assets)
|
Federal Home Loan Mortgage Corp.
|
18.0%
|
|
Pagaya AI Debt Selection Trust
|
9.4%
|
|
First American Government Obligations Fund
|
3.0%
|
|
Avis Budget Car Rental LLC
|
1.6%
|
|
Vista Point Securitization Trust
|
1.6%
|
|
GS Mortgage-Backed Securities Trust
|
1.5%
|
|
ACHV ABS Trust
|
1.4%
|
|
American Credit Acceptance Receivables Trust
|
1.4%
|
|
Onslow Bay Mortgage Loan Trust
|
1.3%
|
|
Federal National Mortgage Association
|
1.3%
|
Credit Ratings Breakdown (% of net assets)*
|
AAA
|
31.5%
|
|
AA
|
25.3%
|
|
A
|
20.1%
|
|
BBB
|
18.2%
|
|
BB
|
2.4%
|
|
B
|
0.7%
|
|
CCC
|
0.0%
|
|
CC
|
0.0%
|
|
C
|
0.1%
|
|
NR
|
1.7%
|
Material Fund Changes:
Effective April 1, 2025, the ultimate parent of the Fund’s investment adviser announced a strategic partnership with Brookfield Asset Management Ltd. (“Brookfield”) in which Brookfield has agreed to acquire a majority of the ultimate parent of the Fund’s investment adviser (the “Transaction”). The Transaction is not expected to result in any material change in the day-to-day management of the Fund.
This is a summary of certain changes to the Fund since February 1, 2025. For more complete information, you may review the Fund’s current prospectus, dated May 31, 2025, as supplemented to date, which is available at https://angeloakcapital.com/resources/ or upon request at 1-855-751-4324.
WHAT WERE THE FUND COSTS FOR THE LAST SIX MONTHS? (based on a hypothetical $10,000 investment)
|
Fund Name
|
Costs of a $10,000 investment
|
Costs paid as a percentage of a $10,000 investment*
|
|
Angel Oak High Yield Opportunities ETF
|
$28
|
0.55%
|
HOW DID THE FUND PERFORM DURING THE PERIOD?
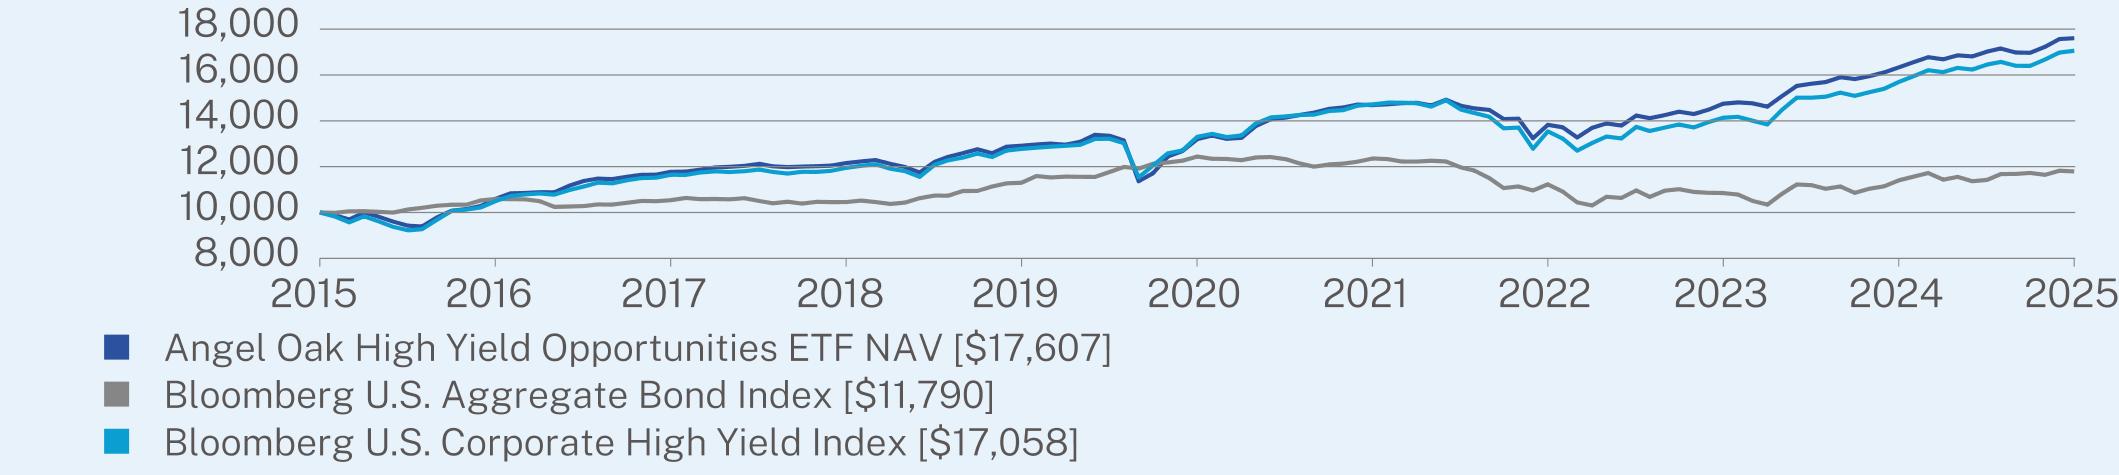
The Fund returned 3.41% based on net asset value (NAV) for the six-month period ending July 31, 2025. The Fund underperformed the Bloomberg U.S. Corporate High Yield Index, the Fund’s performance benchmark, by 21 basis points (bps) based on NAV, as the performance benchmark returned 3.62% over the same period.
WHAT FACTORS INFLUENCED PERFORMANCE?
The Fund’s underperformance relative to its performance benchmark was primarily due to the drag from its cash allocation during a period when the performance benchmark’s average yield was 7.48%. The high-yield (HY) corporate bond allocation returned 3.51%, marginally trailing the performance benchmark, reflecting the Fund’s conservative positioning and overweight to B- and BB-rated issuers given tight valuations and a cautious long-term risk-reward outlook. Conversely, the HY securitized credit allocation—an out-of-index holding—outperformed, with asset-backed securities (ABS) and non-agency residential mortgage-backed securities (RMBS) exceeding benchmark returns by more than 220 bps and 40 bps, respectively.
HOW WAS THE FUND POSITIONED DURING THE PERIOD?
The Fund’s out-of-index exposure to securitized credit—specifically HY non-agency RMBS and ABS—proved beneficial, as we viewed these sectors as undervalued relative to HY corporate credit.
|
Top Contributors
|
|
|
↑
|
Overweight to HY securitized credit
|
|
Top Detractors
|
|
|
↓
|
Underweight to longer-duration BB-rated issuers during a period when the 5-year Treasury rallied 35 bps and returned 3.68%
|
|
↓
|
Underweight to higher-risk, higher-potential-return CCC-and-below-rated issuers during a period of outperformance
|
|
↓
|
Negative attribution from consumer cyclical holdings, driven primarily by security selection
|
ANNUAL AVERAGE TOTAL RETURN (%)
|
|
1 Year
|
5 Year
|
10 Year
|
|
Angel Oak High Yield Opportunities ETF NAV
|
7.79
|
5.92
|
5.82
|
|
Bloomberg U.S. Aggregate Bond Index
|
3.38
|
-1.07
|
1.66
|
|
Bloomberg U.S. Corporate High Yield Index
|
8.67
|
5.09
|
5.49
|
KEY FUND STATISTICS (as of July 31, 2025)
|
Net Assets
|
$120,622,766
|
Effective Duration
|
2.87 years
|
|
|
Number of Holdings
|
246
|
30-Day SEC Yield
|
6.89%
|
|
|
Net Advisory Fee
|
$320,299
|
30-Day SEC Yield Unsubsidized
|
6.89%
|
|
|
Portfolio Turnover
|
16%
|
Weighted Average Life
|
3.60 years
|
|
|
Average Credit Quality
|
BB
|
Distribution Yield
|
7.00%
|
WHAT DID THE FUND INVEST IN? (as of July 31, 2025)
Top Sectors (% of net assets)
|
Financial
|
19.6%
|
|
Energy
|
15.8%
|
|
Consumer, Non-cyclical
|
12.8%
|
|
Industrial
|
12.0%
|
|
Consumer, Cyclical
|
10.1%
|
|
Basic Materials
|
7.6%
|
|
Communications
|
5.4%
|
|
Mortgage Securities
|
4.6%
|
|
Asset-Backed Securities
|
4.0%
|
|
Cash & Other
|
8.1%
|
Top 10 Issuers (% of net assets)
|
First American Government Obligations Fund
|
3.8%
|
|
Venture Global LNG, Inc.
|
1.8%
|
|
Freedom Mortgage Holdings LLC
|
1.8%
|
|
goeasy Ltd.
|
1.4%
|
|
Directv Financing LLC / Directv Financing Co.-Obligor, Inc.
|
1.3%
|
|
Nationstar Mortgage Holdings, Inc.
|
1.2%
|
|
USA Compression Partners LP / USA Compression Finance Corp.
|
1.2%
|
|
Antero Midstream Partners LP / Antero Midstream Finance Corp.
|
1.1%
|
|
Consolidated Energy Finance SA
|
1.1%
|
|
Goodyear Tire & Rubber Co.
|
1.1%
|
Credit Ratings Breakdown (% of net assets)*
|
AAA
|
3.6%
|
|
AA
|
0.5%
|
|
BBB
|
5.4%
|
|
BB
|
53.3%
|
|
B
|
30.4%
|
|
CCC
|
5.1%
|
|
CC
|
0.1%
|
|
NR
|
1.6%
|
Material Fund Changes:
Effective April 1, 2025, the ultimate parent of the Fund’s investment adviser announced a strategic partnership with Brookfield Asset Management Ltd. (“Brookfield”) in which Brookfield has agreed to acquire a majority of the ultimate parent of the Fund’s investment adviser (the “Transaction”). The Transaction is not expected to result in any material change in the day-to-day management of the Fund.
This is a summary of certain changes to the Fund since February 1, 2025. For more complete information, you may review the Fund’s current prospectus, dated May 31, 2025, as supplemented to date, which is available at https://angeloakcapital.com/resources/ or upon request at 1-855-751-4324.
WHAT WERE THE FUND COSTS FOR THE LAST SIX MONTHS? (based on a hypothetical $10,000 investment)
|
Fund Name
|
Costs of a $10,000 investment
|
Costs paid as a percentage of a $10,000 investment*
|
|
Angel Oak Mortgage-Backed Securities ETF
|
$25
|
0.49%
|
HOW DID THE FUND PERFORM DURING THE PERIOD?
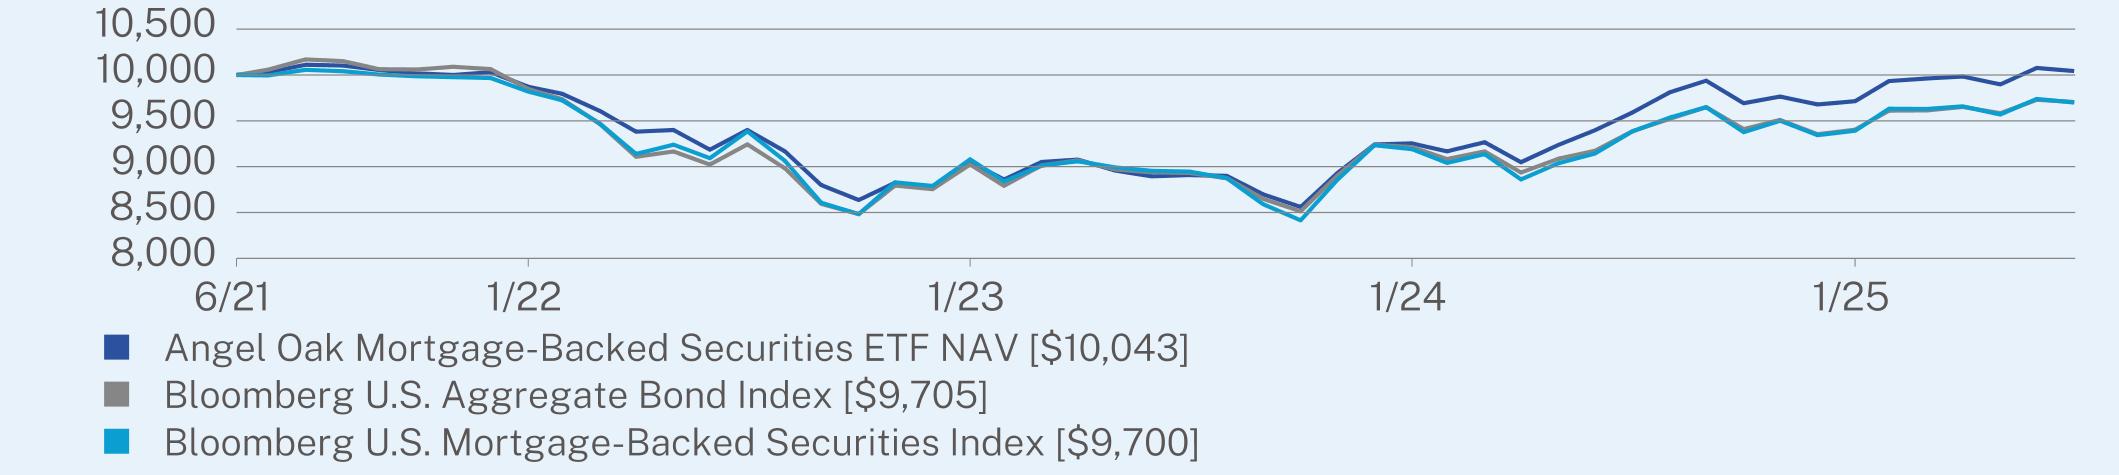
The Fund returned 3.38% based on net asset value (NAV) for the six-month period ending July 31, 2025. The Fund outperformed the Bloomberg U.S. Mortgage-Backed Securities Index, the Fund’s performance benchmark, by 10 basis points based on NAV, as the performance benchmark returned 3.28% over the same period.
WHAT FACTORS INFLUENCED PERFORMANCE?
The Fund outperformed its performance benchmark during the period, primarily due to a larger allocation to non-agency residential mortgage-backed securities (RMBS). Although the overweight to higher coupons in the agency RMBS allocation underperformed relative to the benchmark, it helped the Fund better withstand volatility during the period. Stronger yields and tighter spreads in non-agency RMBS further supported relative returns.
HOW WAS THE FUND POSITIONED DURING THE PERIOD?
The Fund maintained a higher allocation to non-agency RMBS than its performance benchmark, with overweight positions in the non-qualified mortgage (non-QM) and prime jumbo subsectors, both of which generated strong results.
|
Top Contributors
|
|
|
↑
|
Investment-grade non-agency RMBS; non-QM subsector; underweight to agency RMBS
|
|
Top Detractors
|
|
|
↓
|
Overweight to higher-coupon agency RMBS
|
ANNUAL AVERAGE TOTAL RETURN (%)
|
|
1 Year
|
Since Inception
(06/04/2021) |
|
Angel Oak Mortgage-Backed Securities ETF NAV
|
4.71
|
0.10
|
|
Bloomberg U.S. Aggregate Bond Index
|
3.38
|
-0.72
|
|
Bloomberg U.S. Mortgage-Backed Securities Index
|
3.36
|
-0.73
|
KEY FUND STATISTICS (as of July 31, 2025)
|
Net Assets
|
$128,726,825
|
Effective Duration
|
6.29 years
|
|
|
Number of Holdings
|
125
|
30-Day SEC Yield
|
4.69%
|
|
|
Net Advisory Fee
|
$425,487
|
30-Day SEC Yield Unsubsidized
|
4.39%
|
|
|
Portfolio Turnover
|
45%
|
Weighted Average Life
|
8.76 years
|
|
|
Average Credit Quality
|
AA
|
Distribution Yield
|
7.29%
|
WHAT DID THE FUND INVEST IN? (as of July 31, 2025)
Top Security Types (% of net assets)
|
Residential Mortgage-Backed Securities
|
60.5%
|
|
Residential Mortgage-Backed Securities - U.S. Government Agency
|
44.1%
|
|
Residential Mortgage-Backed Securities - U.S. Government Agency Credit Risk Transfer
|
15.5%
|
|
Money Market Funds
|
2.7%
|
|
Commercial Mortgage-Backed Securities - U.S. Government Agency
|
0.2%
|
|
Asset-Backed Securities
|
0.0%
|
|
Futures Contracts
|
-0.1%
|
|
Cash & Other
|
-22.9%
|
Top 10 Issuers (% of net assets)
|
Federal National Mortgage Association
|
34.7%
|
|
Federal Home Loan Mortgage Corp.
|
25.0%
|
|
JP Morgan Mortgage Trust
|
7.6%
|
|
COLT Funding LLC
|
7.6%
|
|
Verus Securitization Trust
|
6.8%
|
|
Pretium Mortgage Credit Partners LLC
|
4.4%
|
|
PRPM LLC
|
3.6%
|
|
SGR Residential Mortgage Trust
|
3.0%
|
|
Credit Suisse Mortgage Capital Certificates
|
2.9%
|
|
First American Government Obligations Fund
|
2.7%
|
Credit Ratings Breakdown (% of net assets)*
|
AAA
|
25.2%
|
|
AA
|
56.9%
|
|
A
|
4.4%
|
|
BBB
|
5.9%
|
|
BB
|
5.4%
|
|
B
|
0.9%
|
|
NR
|
1.3%
|
Material Fund Changes:
Effective April 1, 2025, the ultimate parent of the Fund’s investment adviser announced a strategic partnership with Brookfield Asset Management Ltd. (“Brookfield”) in which Brookfield has agreed to acquire a majority of the ultimate parent of the Fund’s investment adviser (the “Transaction”). The Transaction is not expected to result in any material change in the day-to-day management of the Fund.
This is a summary of certain changes to the Fund since February 1, 2025. For more complete information, you may review the Fund’s current prospectus, dated May 31, 2025, as supplemented to date, which is available at https://angeloakcapital.com/resources/ or upon request at 1-855-751-4324.
WHAT WERE THE FUND COSTS FOR THE LAST SIX MONTHS? (based on a hypothetical $10,000 investment)
|
Fund Name
|
Costs of a $10,000 investment
|
Costs paid as a percentage of a $10,000 investment*
|
|
Angel Oak UltraShort Income ETF
|
$17
|
0.34%
|
HOW DID THE FUND PERFORM DURING THE PERIOD?
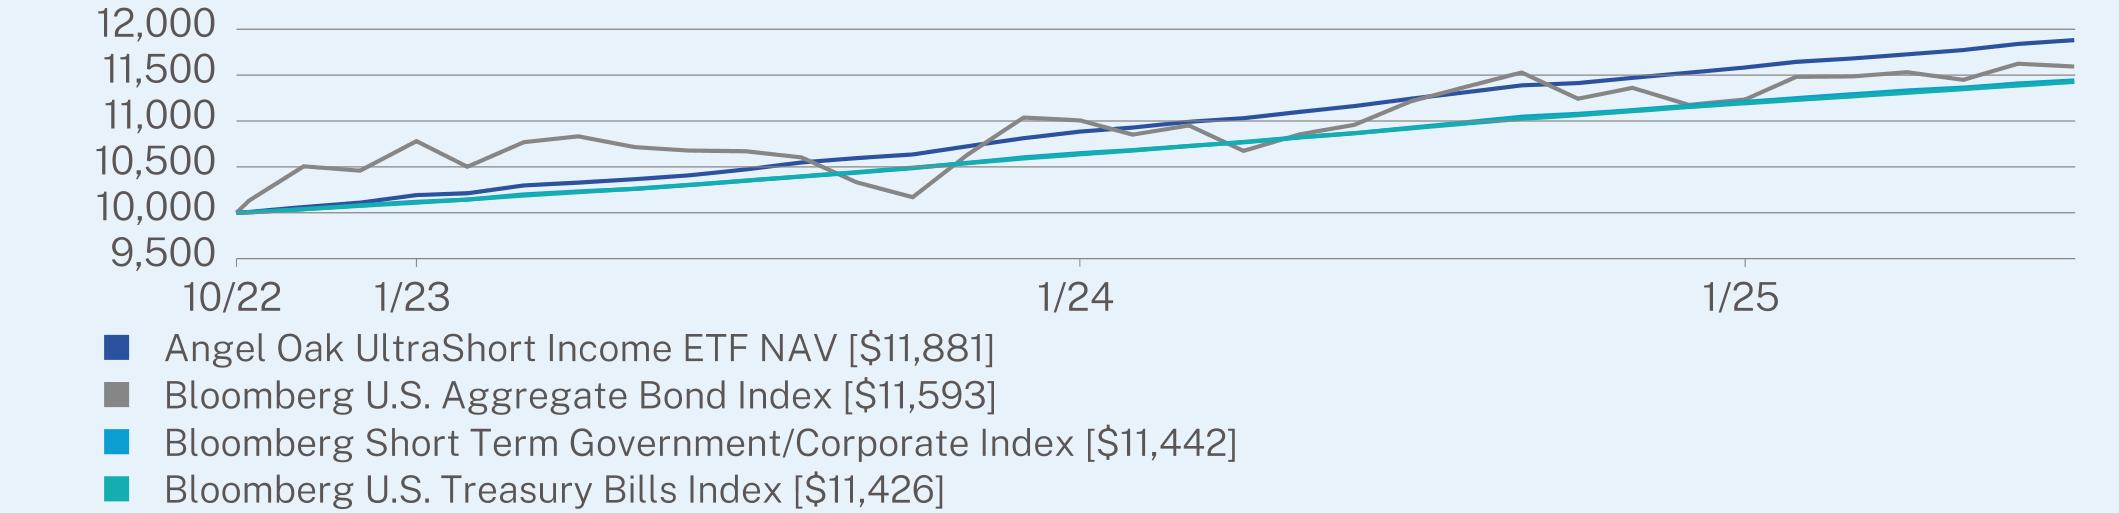
The Fund returned 2.57% based on net asset value (NAV) for the six-month period ending July 31, 2025. The Fund outperformed both the Bloomberg U.S. Treasury Bills Index and the Bloomberg Short-Term Government/Corporate Index, the Fund’s performance benchmarks, by 49 basis points, as the performance benchmarks each returned 2.08% over the same period.
WHAT FACTORS INFLUENCED PERFORMANCE?
The Fund outperformed its performance benchmarks during the period, supported by overweight allocations to investment-grade (IG) asset-backed securities (ABS), non-agency residential mortgage-backed securities (RMBS), collateralized loan obligations (CLOs), and IG corporates. Higher income, stronger yields, and tighter spreads across these sectors further enhanced relative performance.
HOW WAS THE FUND POSITIONED DURING THE PERIOD?
The Fund maintained an overweight to securitized credit, with increased allocations to IG ABS, non-agency RMBS, and CLOs, all of which contributed positively.
|
Top Contributors
|
|
|
↑
|
High income relative to performance benchmarks; investment-grade securitized credit
|
|
Top Detractors
|
|
|
↓
|
Cash and government allocations with lower yield versus credit sectors
|
ANNUAL AVERAGE TOTAL RETURN (%)
|
|
1 Year
|
Since Inception
(10/24/2022) |
|
Angel Oak UltraShort Income ETF NAV
|
5.69
|
6.43
|
|
Bloomberg U.S. Aggregate Bond Index
|
3.38
|
5.49
|
|
Bloomberg Short Term Government/Corporate Index
|
4.72
|
4.99
|
|
Bloomberg U.S. Treasury Bills Index
|
4.65
|
4.94
|
KEY FUND STATISTICS (as of July 31, 2025)
|
Net Assets
|
$1,050,024,683
|
Effective Duration
|
0.80 years
|
|
|
Number of Holdings
|
474
|
30-Day SEC Yield
|
5.04%
|
|
|
Net Advisory Fee
|
$1,454,778
|
30-Day SEC Yield Unsubsidized
|
4.83%
|
|
|
Portfolio Turnover
|
43%
|
Weighted Average Life
|
1.29 years
|
|
|
Average Credit Quality
|
A
|
Distribution Yield
|
5.37%
|
WHAT DID THE FUND INVEST IN? (as of July 31, 2025)
Top Security Types (% of net assets)
|
Asset-Backed Securities
|
28.8%
|
|
Corporate Obligations
|
17.5%
|
|
Collateralized Loan Obligations
|
16.1%
|
|
Commercial Mortgage-Backed Securities - U.S. Government Agency
|
14.8%
|
|
Residential Mortgage-Backed Securities
|
10.5%
|
|
Money Market Funds
|
10.4%
|
|
Residential Mortgage-Backed Securities - U.S. Government Agency Credit Risk Transfer
|
1.8%
|
|
Commercial Mortgage-Backed Securities
|
1.3%
|
|
Common Stocks
|
0.3%
|
|
Cash & Other
|
-1.5%
|
Top 10 Issuers (% of net assets)
|
Federal Home Loan Mortgage Corp.
|
14.3%
|
|
First American Government Obligations Fund
|
10.4%
|
|
Pagaya AI Debt Selection Trust
|
8.4%
|
|
Federal National Mortgage Association
|
1.9%
|
|
ACHV ABS TRUST
|
1.9%
|
|
Avis Budget Car Rental LLC
|
1.8%
|
|
Vista Point Securitization Trust
|
1.6%
|
|
Apidos CLO Ltd.
|
1.6%
|
|
American Credit Acceptance Receivables Trust
|
1.5%
|
|
Marlette Funding Trust
|
1.4%
|
Credit Ratings Breakdown (% of net assets)*
|
AAA
|
35.0%
|
|
AA
|
22.9%
|
|
A
|
18.7%
|
|
BBB
|
20.6%
|
|
BB
|
1.5%
|
|
B
|
0.6%
|
|
NR
|
0.7%
|
Material Fund Changes:
Effective April 1, 2025, the ultimate parent of the Fund’s investment adviser announced a strategic partnership with Brookfield Asset Management Ltd. (“Brookfield”) in which Brookfield has agreed to acquire a majority of the ultimate parent of the Fund’s investment adviser (the “Transaction”). The Transaction is not expected to result in any material change in the day-to-day management of the Fund.
Effective February 1, 2025, the Fund’s expense limit was increased from 0.29% to 0.34% of the Fund’s average daily net assets.
This is a summary of certain changes to the Fund since February 1, 2025. For more complete information, you may review the Fund’s current prospectus, dated May 31, 2025, as supplemented to date, which is available at https://angeloakcapital.com/resources/ or upon request at 1-855-751-4324.
WHAT WERE THE FUND COSTS FOR THE LAST SIX MONTHS? (based on a hypothetical $10,000 investment)
|
Fund Name
|
Costs of a $10,000 investment
|
Costs paid as a percentage of a $10,000 investment*
|
|
Angel Oak Income ETF
|
$40
|
0.79%
|
HOW DID THE FUND PERFORM DURING THE PERIOD?
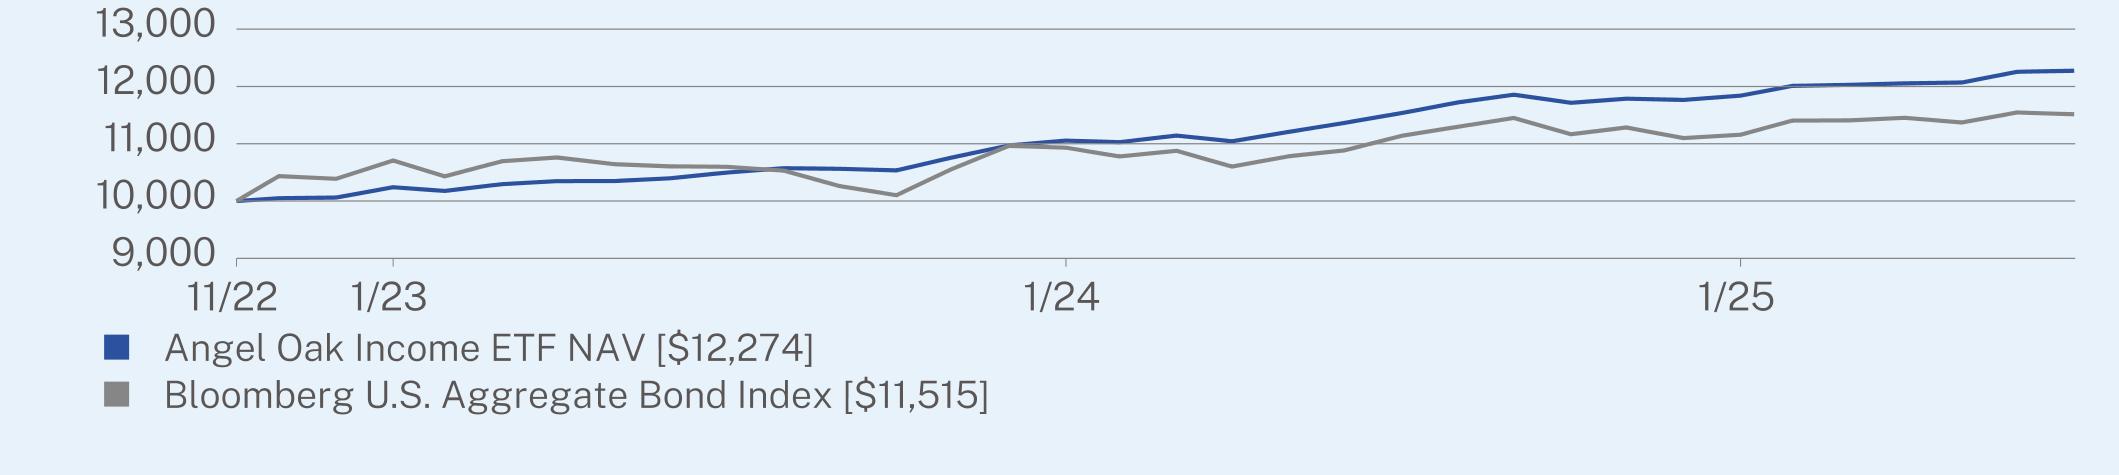
The Fund returned 3.67% based on net asset value (NAV) for the six-month period ending July 31, 2025. The Fund outperformed the Bloomberg U.S. Aggregate Bond Index, the Fund’s benchmark, by 47 basis points based on NAV, as the benchmark returned 3.20% over the same period.
WHAT FACTORS INFLUENCED PERFORMANCE?
The Fund outperformed its benchmark, driven by higher current income and spread outperformance within credit allocations, most notably in non-agency residential mortgage-backed securities (RMBS) and asset-backed securities (ABS). A shorter interest rate duration was the primary detractor from relative performance.
HOW WAS THE FUND POSITIONED DURING THE PERIOD?
The Fund trimmed its allocation to non-agency RMBS to lock in gains following spread compression while increasing allocations to ABS and high-yield corporates in anticipation of further spread tightening.
|
Top Contributors
|
|
|
↑
|
Non-agency RMBS; ABS
|
|
Top Detractors
|
|
|
↓
|
Interest rate duration positioning
|
ANNUAL AVERAGE TOTAL RETURN (%)
|
|
1 Year
|
Since Inception
(11/07/2022) |
|
Angel Oak Income ETF NAV
|
6.41
|
7.80
|
|
Bloomberg U.S. Aggregate Bond Index
|
3.38
|
5.31
|
KEY FUND STATISTICS (as of July 31, 2025)
|
Net Assets
|
$551,639,271
|
Effective Duration
|
4.21 years
|
|
|
Number of Holdings
|
635
|
30-Day SEC Yield
|
5.82%
|
|
|
Net Advisory Fee
|
$1,772,845
|
30-Day SEC Yield Unsubsidized
|
5.62%
|
|
|
Portfolio Turnover
|
37%
|
Weighted Average Life
|
6.51 years
|
|
|
Average Credit Quality
|
BBB
|
Distribution Yield
|
6.25%
|
WHAT DID THE FUND INVEST IN? (as of July 31, 2025)
Top Security Types (% of net assets)
|
Residential Mortgage-Backed Securities
|
31.4%
|
|
Asset-Backed Securities
|
21.8%
|
|
Residential Mortgage-Backed Securities - U.S. Government Agency
|
20.1%
|
|
Collateralized Loan Obligations
|
10.9%
|
|
Corporate Obligations
|
6.6%
|
|
Commercial Mortgage-Backed Securities
|
3.8%
|
|
Exchange Traded Funds
|
3.7%
|
|
Money Market Funds
|
3.4%
|
|
Residential Mortgage-Backed Securities - U.S. Government Agency Credit Risk Transfer
|
0.3%
|
|
Cash & Other
|
-2.0%
|
Top 10 Issuers (% of net assets)
|
Federal Home Loan Mortgage Corp.
|
10.0%
|
|
Federal National Mortgage Association
|
8.9%
|
|
Verus Securitization Trust
|
4.6%
|
|
First American Government Obligations Fund
|
3.4%
|
|
PRPM LLC
|
3.1%
|
|
JP Morgan Mortgage Trust
|
3.1%
|
|
Exeter Automobile Receivables Trust
|
3.1%
|
|
COLT Funding LLC
|
2.3%
|
|
CPS Auto Trust
|
2.3%
|
|
Ellington Financial Mortgage Trust
|
2.3%
|
Credit Ratings Breakdown (% of net assets)*
|
AAA
|
6.8%
|
|
AA
|
22.7%
|
|
A
|
8.4%
|
|
BBB
|
16.3%
|
|
BB
|
30.2%
|
|
B
|
5.8%
|
|
CCC
|
0.1%
|
|
NR
|
9.7%
|
Material Fund Changes:
Effective April 1, 2025, the ultimate parent of the Fund’s investment adviser announced a strategic partnership with Brookfield Asset Management Ltd. (“Brookfield”) in which Brookfield has agreed to acquire a majority of the ultimate parent of the Fund’s investment adviser (the “Transaction”). The Transaction is not expected to result in any material change in the day-to-day management of the Fund.
This is a summary of certain changes to the Fund since February 1, 2025. For more complete information, you may review the Fund’s current prospectus, dated May 31, 2025, as supplemented to date, which is available at https://angeloakcapital.com/resources/ or upon request at 1-855-751-4324.
| [1] |
|
||
| [2] |
|
||
| [3] |
|
||
| [4] |
|
||
| [5] |
|
||
| [6] |
|
||
| [7] |
|
||
| [8] |
|
||
| [9] |
|
||
| [10] |
|
||
| [11] |
|
||
| [12] |
|
||
| [13] |
|
||
| [14] |
|
||
| [15] |
|
||
| [16] |
|
||
| [17] |
|
||
| [18] |
|
||
| [19] |
|
||
| [20] |
|