Shareholder Report
|
12 Months Ended |
|
Jul. 31, 2025
USD ($)
Holding
|
|---|
| Shareholder Report [Line Items] |
|
|
| Document Type |
N-CSR
|
|
| Amendment Flag |
false
|
|
| Registrant Name |
LORD ABBETT TRUST I
|
|
| Entity Central Index Key |
0001139819
|
|
| Entity Investment Company Type |
N-1A
|
|
| Document Period End Date |
Jul. 31, 2025
|
|
| C000231078 |
|
|
| Shareholder Report [Line Items] |
|
|
| Fund Name |
Lord Abbett Emerging Markets Equity Fund
|
|
| Class Name |
Class A
|
|
| Trading Symbol |
EAMAX
|
|
| Annual or Semi-Annual Statement [Text Block] |
This annual shareholder report contains important information about the Lord Abbett Emerging Markets Equity Fund for the period of August 1, 2024 to July 31, 2025.
|
|
| Shareholder Report Annual or Semi-Annual |
Annual Shareholder Report
|
|
| Additional Information [Text Block] |
You can find additional information about the Fund at lordabbett.com/FundDocuments. You can also request this information by contacting us at 888-522-2388.
|
|
| Additional Information Phone Number |
888-522-2388
|
|
| Additional Information Website |
<span style="box-sizing: border-box; color: rgb(0, 0, 0); display: inline; flex-wrap: nowrap; font-size: 13.3333px; font-weight: 400; grid-area: auto; line-height: 20px; margin: 0px; overflow: visible; text-align: left; text-align-last: auto; white-space-collapse: preserve-breaks;">lordabbett.com/FundDocuments</span>
|
|
| Expenses [Text Block] |
What were the Fund costs for the last year?(based on a hypothetical $10,000 investment) Class Name | Costs of a $10,000 investment | Costs paid as a percentage of a $10,000 investment |
|---|
Class A | $124 | 1.15% |
|---|
|
|
| Expenses Paid, Amount |
$ 124
|
|
| Expense Ratio, Percent |
1.15%
|
|
| Factors Affecting Performance [Text Block] |
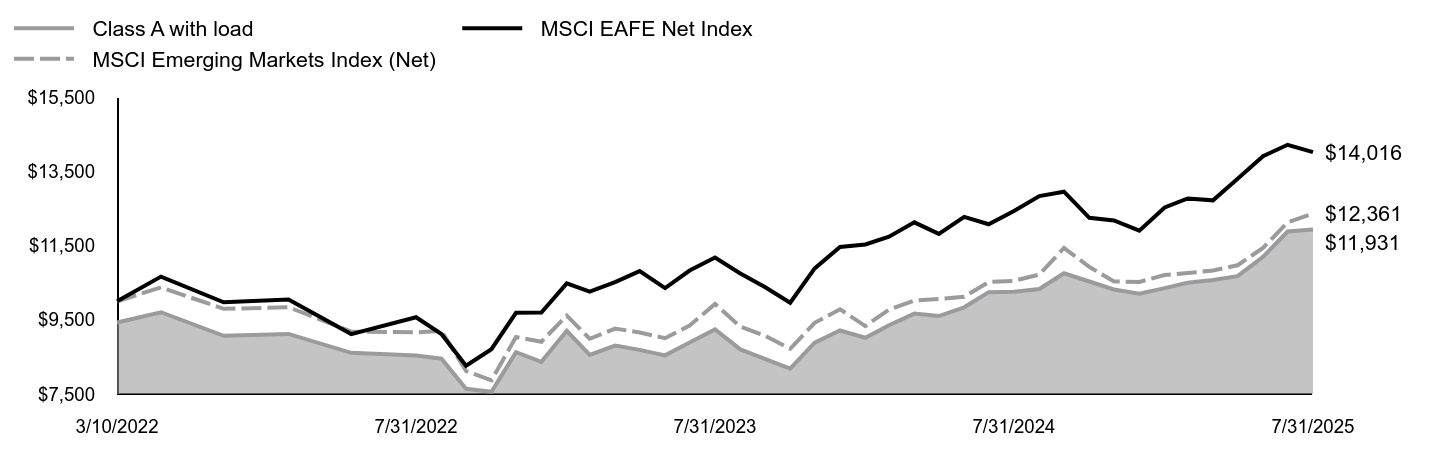
How did the Fund perform last year and what affected its performance?For the fiscal year ended July 31, 2025, the Fund returned 16.31%, reflecting performance at the net asset value (NAV) of Class A shares, with all distributions reinvested, compared to the 17.18% return of a securities market index with investment characteristics similar to those of the Fund, the MSCI Emerging Markets Index (Net). The Fund's broad-based securities market index, the MSCI EAFE Net Index, returned 12.77% over the same period. Positive factors for the markets included resilient economic data and corporate earnings, continued disinflation, and other factors, such as productivity gains from generative artificial intelligence. Negative factors included increased policy uncertainty during the period, including U.S. President Trump's “Liberation Day” announcement, which led to market volatility. Against this backdrop, U.S. equity markets delivered generally strong returns. Top contributors to performance: Security selection within the Industrials sector contributed to relative performance, led by an overweight allocation to LS Electric Co., Ltd. Security selection within the Financials sector also contributed to relative performance, led by an overweight allocation to Alpha Bank S.A. Top detractors from performance: Security selection within the Information Technology sector detracted from relative performance, led by an overweight allocation to Samsung Electronics Co., Ltd. Security selection within the Consumer Staples sector also detracted from relative performance, led by an overweight allocation to Varun Beverages Ltd. |
|
| Performance Past Does Not Indicate Future [Text] |
The Fund's past performance is no guarantee of future results.
|
|
| Line Graph [Table Text Block] |
 | Class A with load | MSCI EAFE Net Index | MSCI Emerging Markets Index (Net) |
|---|
3/10/2022 | $9,427 | $10,000 | $10,000 |
|---|
3/31/2022 | $9,704 | $10,663 | $10,372 |
|---|
4/30/2022 | $9,069 | $9,973 | $9,795 |
|---|
5/31/2022 | $9,119 | $10,047 | $9,838 |
|---|
6/30/2022 | $8,609 | $9,115 | $9,184 |
|---|
7/31/2022 | $8,540 | $9,569 | $9,162 |
|---|
8/31/2022 | $8,452 | $9,115 | $9,200 |
|---|
9/30/2022 | $7,640 | $8,262 | $8,121 |
|---|
10/31/2022 | $7,558 | $8,707 | $7,869 |
|---|
11/30/2022 | $8,628 | $9,687 | $9,036 |
|---|
12/31/2022 | $8,369 | $9,695 | $8,909 |
|---|
1/31/2023 | $9,202 | $10,480 | $9,613 |
|---|
2/28/2023 | $8,555 | $10,261 | $8,989 |
|---|
3/31/2023 | $8,805 | $10,516 | $9,262 |
|---|
4/30/2023 | $8,689 | $10,813 | $9,157 |
|---|
5/31/2023 | $8,542 | $10,355 | $9,003 |
|---|
6/30/2023 | $8,888 | $10,826 | $9,345 |
|---|
7/31/2023 | $9,241 | $11,177 | $9,926 |
|---|
8/31/2023 | $8,702 | $10,748 | $9,315 |
|---|
9/30/2023 | $8,446 | $10,381 | $9,071 |
|---|
10/31/2023 | $8,183 | $9,960 | $8,719 |
|---|
11/30/2023 | $8,882 | $10,885 | $9,417 |
|---|
12/31/2023 | $9,211 | $11,463 | $9,785 |
|---|
1/31/2024 | $9,016 | $11,529 | $9,331 |
|---|
2/29/2024 | $9,354 | $11,740 | $9,775 |
|---|
3/31/2024 | $9,666 | $12,126 | $10,017 |
|---|
4/30/2024 | $9,601 | $11,816 | $10,062 |
|---|
5/31/2024 | $9,836 | $12,273 | $10,118 |
|---|
6/30/2024 | $10,245 | $12,075 | $10,517 |
|---|
7/31/2024 | $10,258 | $12,430 | $10,549 |
|---|
8/31/2024 | $10,330 | $12,834 | $10,719 |
|---|
9/30/2024 | $10,753 | $12,952 | $11,435 |
|---|
10/31/2024 | $10,532 | $12,248 | $10,926 |
|---|
11/30/2024 | $10,317 | $12,178 | $10,534 |
|---|
12/31/2024 | $10,202 | $11,901 | $10,519 |
|---|
1/31/2025 | $10,354 | $12,527 | $10,707 |
|---|
2/28/2025 | $10,498 | $12,770 | $10,759 |
|---|
3/31/2025 | $10,571 | $12,718 | $10,827 |
|---|
4/30/2025 | $10,676 | $13,301 | $10,969 |
|---|
5/31/2025 | $11,195 | $13,909 | $11,437 |
|---|
6/30/2025 | $11,879 | $14,216 | $12,125 |
|---|
7/31/2025 | $11,931 | $14,016 | $12,361 |
|---|
|
|
| Average Annual Return [Table Text Block] |
AATR | 1 Year | Since Inception
3/10/22 |
|---|
Class A at NAV | 16.31% | 7.19% |
|---|
Class A with sales charge | 9.63% | 5.34% |
|---|
MSCI Emerging Markets Index (Net) | 17.18% | 6.45% |
|---|
MSCI EAFE Net Index | 12.77% | 10.47% |
|---|
|
|
| Performance Inception Date |
Mar. 10, 2022
|
|
| No Deduction of Taxes [Text Block] |
The returns do not reflect the deduction of taxes that a shareholder would pay on Fund distributions or redemption of Fund shares.
|
|
| AssetsNet |
$ 6,374,014
|
|
| Holdings Count | Holding |
98
|
|
| Advisory Fees Paid, Amount |
$ 0
|
|
| InvestmentCompanyPortfolioTurnover |
80.00%
|
|
| Additional Fund Statistics [Text Block] |
Total Net Assets | $6,374,014 |
|---|
# of Portfolio Holdings | 98 |
|---|
Portfolio Turnover Rate | 80% |
|---|
Total Advisory Fees Paid | $0 |
|---|
|
|
| Holdings [Text Block] |
Portfolio Holdings Presented by SectorFootnote Reference* | % Footnote Reference** |
|---|
Communication Services | 12.82% | Consumer Discretionary | 11.91% | Consumer Staples | 4.50% | Energy | 3.54% | Financials | 25.66% | Health Care | 2.86% | Industrials | 8.23% | Information Technology | 24.02% | Materials | 2.01% | Real Estate | 0.75% | Utilities | 1.92% | Repurchase Agreements | 1.78% | Total | 100.00% |
| Footnote | Description | Footnote* | A sector may comprise several industries. | Footnote** | Represents percent of total investments, which excludes derivatives. |
|
|
| Material Fund Change [Text Block] |
There were no material fund changes during the period. |
|
| Summary of Change Legend [Text Block] |
There were no material fund changes during the period.
|
|
| C000231082 |
|
|
| Shareholder Report [Line Items] |
|
|
| Fund Name |
Lord Abbett Emerging Markets Equity Fund
|
|
| Class Name |
Class C
|
|
| Trading Symbol |
ELMCX
|
|
| Annual or Semi-Annual Statement [Text Block] |
This annual shareholder report contains important information about the Lord Abbett Emerging Markets Equity Fund for the period of August 1, 2024 to July 31, 2025.
|
|
| Shareholder Report Annual or Semi-Annual |
Annual Shareholder Report
|
|
| Additional Information [Text Block] |
You can find additional information about the Fund at lordabbett.com/FundDocuments. You can also request this information by contacting us at 888-522-2388.
|
|
| Additional Information Phone Number |
888-522-2388
|
|
| Additional Information Website |
<span style="box-sizing: border-box; color: rgb(0, 0, 0); display: inline; flex-wrap: nowrap; font-size: 13.3333px; font-weight: 400; grid-area: auto; line-height: 20px; margin: 0px; overflow: visible; text-align: left; text-align-last: auto; white-space-collapse: preserve-breaks;">lordabbett.com/FundDocuments</span>
|
|
| Expenses [Text Block] |
What were the Fund costs for the last year?(based on a hypothetical $10,000 investment) Class Name | Costs of a $10,000 investment | Costs paid as a percentage of a $10,000 investment |
|---|
Class C | $205 | 1.90% |
|---|
|
|
| Expenses Paid, Amount |
$ 205
|
|
| Expense Ratio, Percent |
1.90%
|
|
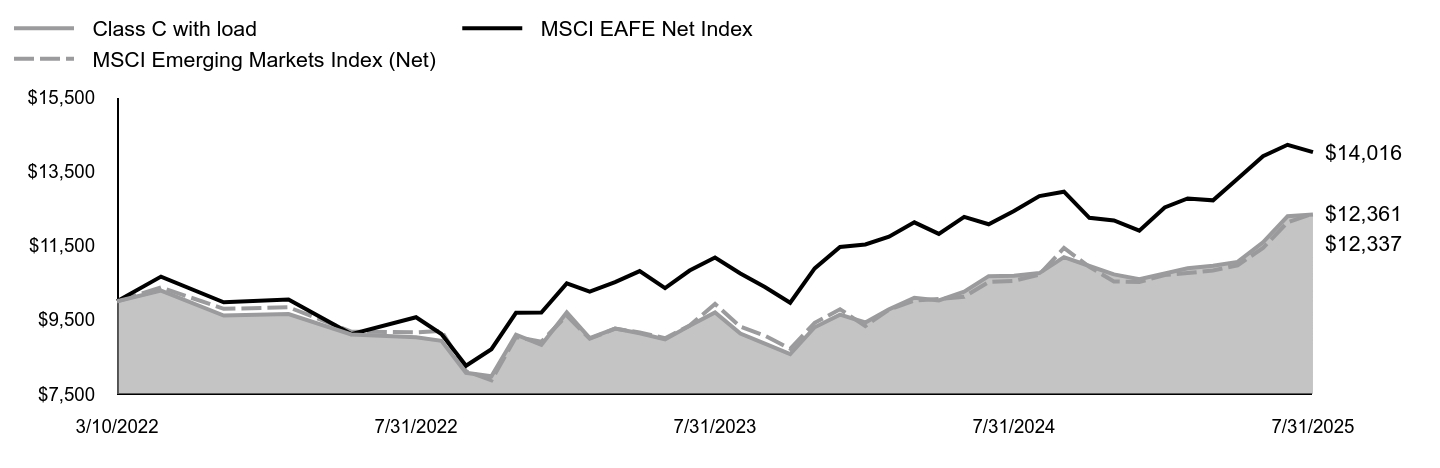
| Factors Affecting Performance [Text Block] |
How did the Fund perform last year and what affected its performance?For the fiscal year ended July 31, 2025, the Fund returned 15.41%, reflecting performance at the net asset value (NAV) of Class C shares, with all distributions reinvested, compared to the 17.18% return of a securities market index with investment characteristics similar to those of the Fund, the MSCI Emerging Markets Index (Net). The Fund's broad-based securities market index, the MSCI EAFE Net Index, returned 12.77% over the same period. Positive factors for the markets included resilient economic data and corporate earnings, continued disinflation, and other factors, such as productivity gains from generative artificial intelligence. Negative factors included increased policy uncertainty during the period, including U.S. President Trump's “Liberation Day” announcement, which led to market volatility. Against this backdrop, U.S. equity markets delivered generally strong returns. Top contributors to performance: Security selection within the Industrials sector contributed to relative performance, led by an overweight allocation to LS Electric Co., Ltd. Security selection within the Financials sector also contributed to relative performance, led by an overweight allocation to Alpha Bank S.A. Top detractors from performance: Security selection within the Information Technology sector detracted from relative performance, led by an overweight allocation to Samsung Electronics Co., Ltd. Security selection within the Consumer Staples sector also detracted from relative performance, led by an overweight allocation to Varun Beverages Ltd. |
|
| Performance Past Does Not Indicate Future [Text] |
The Fund's past performance is no guarantee of future results.
|
|
| Line Graph [Table Text Block] |
 | Class C with load | MSCI EAFE Net Index | MSCI Emerging Markets Index (Net) |
|---|
3/10/2022 | $10,000 | $10,000 | $10,000 |
|---|
3/31/2022 | $10,287 | $10,663 | $10,372 |
|---|
4/30/2022 | $9,613 | $9,973 | $9,795 |
|---|
5/31/2022 | $9,653 | $10,047 | $9,838 |
|---|
6/30/2022 | $9,105 | $9,115 | $9,184 |
|---|
7/31/2022 | $9,032 | $9,569 | $9,162 |
|---|
8/31/2022 | $8,932 | $9,115 | $9,200 |
|---|
9/30/2022 | $8,071 | $8,262 | $8,121 |
|---|
10/31/2022 | $7,977 | $8,707 | $7,869 |
|---|
11/30/2022 | $9,099 | $9,687 | $9,036 |
|---|
12/31/2022 | $8,823 | $9,695 | $8,909 |
|---|
1/31/2023 | $9,698 | $10,480 | $9,613 |
|---|
2/28/2023 | $9,006 | $10,261 | $8,989 |
|---|
3/31/2023 | $9,264 | $10,516 | $9,262 |
|---|
4/30/2023 | $9,135 | $10,813 | $9,157 |
|---|
5/31/2023 | $8,972 | $10,355 | $9,003 |
|---|
6/30/2023 | $9,339 | $10,826 | $9,345 |
|---|
7/31/2023 | $9,698 | $11,177 | $9,926 |
|---|
8/31/2023 | $9,128 | $10,748 | $9,315 |
|---|
9/30/2023 | $8,857 | $10,381 | $9,071 |
|---|
10/31/2023 | $8,572 | $9,960 | $8,719 |
|---|
11/30/2023 | $9,298 | $10,885 | $9,417 |
|---|
12/31/2023 | $9,637 | $11,463 | $9,785 |
|---|
1/31/2024 | $9,426 | $11,529 | $9,331 |
|---|
2/29/2024 | $9,781 | $11,740 | $9,775 |
|---|
3/31/2024 | $10,095 | $12,126 | $10,017 |
|---|
4/30/2024 | $10,020 | $11,816 | $10,062 |
|---|
5/31/2024 | $10,259 | $12,273 | $10,118 |
|---|
6/30/2024 | $10,676 | $12,075 | $10,517 |
|---|
7/31/2024 | $10,689 | $12,430 | $10,549 |
|---|
8/31/2024 | $10,758 | $12,834 | $10,719 |
|---|
9/30/2024 | $11,188 | $12,952 | $11,435 |
|---|
10/31/2024 | $10,949 | $12,248 | $10,926 |
|---|
11/30/2024 | $10,723 | $12,178 | $10,534 |
|---|
12/31/2024 | $10,595 | $11,901 | $10,519 |
|---|
1/31/2025 | $10,746 | $12,527 | $10,707 |
|---|
2/28/2025 | $10,890 | $12,770 | $10,759 |
|---|
3/31/2025 | $10,959 | $12,718 | $10,827 |
|---|
4/30/2025 | $11,061 | $13,301 | $10,969 |
|---|
5/31/2025 | $11,589 | $13,909 | $11,437 |
|---|
6/30/2025 | $12,289 | $14,216 | $12,125 |
|---|
7/31/2025 | $12,337 | $14,016 | $12,361 |
|---|
|
|
| Average Annual Return [Table Text Block] |
AATR | 1 Year | Since Inception
3/10/22 |
|---|
Class C at NAV | 15.41% | 6.39% |
|---|
Class C with sales charge | 14.41% | 6.39% |
|---|
MSCI Emerging Markets Index (Net) | 17.18% | 6.45% |
|---|
MSCI EAFE Net Index | 12.77% | 10.47% |
|---|
|
|
| Performance Inception Date |
Mar. 10, 2022
|
|
| No Deduction of Taxes [Text Block] |
The returns do not reflect the deduction of taxes that a shareholder would pay on Fund distributions or redemption of Fund shares.
|
|
| AssetsNet |
$ 6,374,014
|
|
| Holdings Count | Holding |
98
|
|
| Advisory Fees Paid, Amount |
$ 0
|
|
| InvestmentCompanyPortfolioTurnover |
80.00%
|
|
| Additional Fund Statistics [Text Block] |
Total Net Assets | $6,374,014 |
|---|
# of Portfolio Holdings | 98 |
|---|
Portfolio Turnover Rate | 80% |
|---|
Total Advisory Fees Paid | $0 |
|---|
|
|
| Holdings [Text Block] |
Portfolio Holdings Presented by SectorFootnote Reference* | % Footnote Reference** |
|---|
Communication Services | 12.82% | Consumer Discretionary | 11.91% | Consumer Staples | 4.50% | Energy | 3.54% | Financials | 25.66% | Health Care | 2.86% | Industrials | 8.23% | Information Technology | 24.02% | Materials | 2.01% | Real Estate | 0.75% | Utilities | 1.92% | Repurchase Agreements | 1.78% | Total | 100.00% |
| Footnote | Description | Footnote* | A sector may comprise several industries. | Footnote** | Represents percent of total investments, which excludes derivatives. |
|
|
| Material Fund Change [Text Block] |
There were no material fund changes during the period. |
|
| Summary of Change Legend [Text Block] |
There were no material fund changes during the period.
|
|
| C000231081 |
|
|
| Shareholder Report [Line Items] |
|
|
| Fund Name |
Lord Abbett Emerging Markets Equity Fund
|
|
| Class Name |
Class F
|
|
| Trading Symbol |
ELMFX
|
|
| Annual or Semi-Annual Statement [Text Block] |
This annual shareholder report contains important information about the Lord Abbett Emerging Markets Equity Fund for the period of August 1, 2024 to July 31, 2025.
|
|
| Shareholder Report Annual or Semi-Annual |
Annual Shareholder Report
|
|
| Additional Information [Text Block] |
You can find additional information about the Fund at lordabbett.com/FundDocuments. You can also request this information by contacting us at 888-522-2388.
|
|
| Additional Information Phone Number |
888-522-2388
|
|
| Additional Information Website |
<span style="box-sizing: border-box; color: rgb(0, 0, 0); display: inline; flex-wrap: nowrap; font-size: 13.3333px; font-weight: 400; grid-area: auto; line-height: 20px; margin: 0px; overflow: visible; text-align: left; text-align-last: auto; white-space-collapse: preserve-breaks;">lordabbett.com/FundDocuments</span>
|
|
| Expenses [Text Block] |
What were the Fund costs for the last year?(based on a hypothetical $10,000 investment) Class Name | Costs of a $10,000 investment | Costs paid as a percentage of a $10,000 investment |
|---|
Class F | $97 | 0.90% |
|---|
|
|
| Expenses Paid, Amount |
$ 97
|
|
| Expense Ratio, Percent |
0.90%
|
|
| Factors Affecting Performance [Text Block] |
How did the Fund perform last year and what affected its performance?For the fiscal year ended July 31, 2025, the Fund returned 16.61%, reflecting performance at the net asset value (NAV) of Class F shares, with all distributions reinvested, compared to the 17.18% return of a securities market index with investment characteristics similar to those of the Fund, the MSCI Emerging Markets Index (Net). The Fund's broad-based securities market index, the MSCI EAFE Net Index, returned 12.77% over the same period. Positive factors for the markets included resilient economic data and corporate earnings, continued disinflation, and other factors, such as productivity gains from generative artificial intelligence. Negative factors included increased policy uncertainty during the period, including U.S. President Trump's “Liberation Day” announcement, which led to market volatility. Against this backdrop, U.S. equity markets delivered generally strong returns. Top contributors to performance: Security selection within the Industrials sector contributed to relative performance, led by an overweight allocation to LS Electric Co., Ltd. Security selection within the Financials sector also contributed to relative performance, led by an overweight allocation to Alpha Bank S.A. Top detractors from performance: Security selection within the Information Technology sector detracted from relative performance, led by an overweight allocation to Samsung Electronics Co., Ltd. Security selection within the Consumer Staples sector also detracted from relative performance, led by an overweight allocation to Varun Beverages Ltd. |
|
| Performance Past Does Not Indicate Future [Text] |
The Fund's past performance is no guarantee of future results.
|
|
| Line Graph [Table Text Block] |
 | Class F | MSCI EAFE Net Index | MSCI Emerging Markets Index (Net) |
|---|
3/10/2022 | $10,000 | $10,000 | $10,000 |
|---|
3/31/2022 | $10,294 | $10,663 | $10,372 |
|---|
4/30/2022 | $9,626 | $9,973 | $9,795 |
|---|
5/31/2022 | $9,673 | $10,047 | $9,838 |
|---|
6/30/2022 | $9,139 | $9,115 | $9,184 |
|---|
7/31/2022 | $9,065 | $9,569 | $9,162 |
|---|
8/31/2022 | $8,979 | $9,115 | $9,200 |
|---|
9/30/2022 | $8,117 | $8,262 | $8,121 |
|---|
10/31/2022 | $8,031 | $8,707 | $7,869 |
|---|
11/30/2022 | $9,172 | $9,687 | $9,036 |
|---|
12/31/2022 | $8,896 | $9,695 | $8,909 |
|---|
1/31/2023 | $9,788 | $10,480 | $9,613 |
|---|
2/28/2023 | $9,100 | $10,261 | $8,989 |
|---|
3/31/2023 | $9,359 | $10,516 | $9,262 |
|---|
4/30/2023 | $9,243 | $10,813 | $9,157 |
|---|
5/31/2023 | $9,087 | $10,355 | $9,003 |
|---|
6/30/2023 | $9,461 | $10,826 | $9,345 |
|---|
7/31/2023 | $9,842 | $11,177 | $9,926 |
|---|
8/31/2023 | $9,263 | $10,748 | $9,315 |
|---|
9/30/2023 | $8,998 | $10,381 | $9,071 |
|---|
10/31/2023 | $8,719 | $9,960 | $8,719 |
|---|
11/30/2023 | $9,461 | $10,885 | $9,417 |
|---|
12/31/2023 | $9,817 | $11,463 | $9,785 |
|---|
1/31/2024 | $9,610 | $11,529 | $9,331 |
|---|
2/29/2024 | $9,976 | $11,740 | $9,775 |
|---|
3/31/2024 | $10,308 | $12,126 | $10,017 |
|---|
4/30/2024 | $10,239 | $11,816 | $10,062 |
|---|
5/31/2024 | $10,495 | $12,273 | $10,118 |
|---|
6/30/2024 | $10,930 | $12,075 | $10,517 |
|---|
7/31/2024 | $10,944 | $12,430 | $10,549 |
|---|
8/31/2024 | $11,027 | $12,834 | $10,719 |
|---|
9/30/2024 | $11,476 | $12,952 | $11,435 |
|---|
10/31/2024 | $11,241 | $12,248 | $10,926 |
|---|
11/30/2024 | $11,020 | $12,178 | $10,534 |
|---|
12/31/2024 | $10,894 | $11,901 | $10,519 |
|---|
1/31/2025 | $11,062 | $12,527 | $10,707 |
|---|
2/28/2025 | $11,223 | $12,770 | $10,759 |
|---|
3/31/2025 | $11,300 | $12,718 | $10,827 |
|---|
4/30/2025 | $11,412 | $13,301 | $10,969 |
|---|
5/31/2025 | $11,972 | $13,909 | $11,437 |
|---|
6/30/2025 | $12,706 | $14,216 | $12,125 |
|---|
7/31/2025 | $12,762 | $14,016 | $12,361 |
|---|
|
|
| Average Annual Return [Table Text Block] |
AATR | 1 Year | Since Inception
3/10/22 |
|---|
Class F at NAV | 16.61% | 7.46% |
|---|
MSCI Emerging Markets Index (Net) | 17.18% | 6.45% |
|---|
MSCI EAFE Net Index | 12.77% | 10.47% |
|---|
|
|
| Performance Inception Date |
Mar. 10, 2022
|
|
| No Deduction of Taxes [Text Block] |
The returns do not reflect the deduction of taxes that a shareholder would pay on Fund distributions or redemption of Fund shares.
|
|
| AssetsNet |
$ 6,374,014
|
|
| Holdings Count | Holding |
98
|
|
| Advisory Fees Paid, Amount |
$ 0
|
|
| InvestmentCompanyPortfolioTurnover |
80.00%
|
|
| Additional Fund Statistics [Text Block] |
Total Net Assets | $6,374,014 |
|---|
# of Portfolio Holdings | 98 |
|---|
Portfolio Turnover Rate | 80% |
|---|
Total Advisory Fees Paid | $0 |
|---|
|
|
| Holdings [Text Block] |
Portfolio Holdings Presented by SectorFootnote Reference* | % Footnote Reference** |
|---|
Communication Services | 12.82% | Consumer Discretionary | 11.91% | Consumer Staples | 4.50% | Energy | 3.54% | Financials | 25.66% | Health Care | 2.86% | Industrials | 8.23% | Information Technology | 24.02% | Materials | 2.01% | Real Estate | 0.75% | Utilities | 1.92% | Repurchase Agreements | 1.78% | Total | 100.00% |
| Footnote | Description | Footnote* | A sector may comprise several industries. | Footnote** | Represents percent of total investments, which excludes derivatives. |
|
|
| Material Fund Change [Text Block] |
There were no material fund changes during the period. |
|
| Summary of Change Legend [Text Block] |
There were no material fund changes during the period.
|
|
| C000231080 |
|
|
| Shareholder Report [Line Items] |
|
|
| Fund Name |
Lord Abbett Emerging Markets Equity Fund
|
|
| Class Name |
Class F3
|
|
| Trading Symbol |
EMOLX
|
|
| Annual or Semi-Annual Statement [Text Block] |
This annual shareholder report contains important information about the Lord Abbett Emerging Markets Equity Fund for the period of August 1, 2024 to July 31, 2025.
|
|
| Shareholder Report Annual or Semi-Annual |
Annual Shareholder Report
|
|
| Additional Information [Text Block] |
You can find additional information about the Fund at lordabbett.com/FundDocuments. You can also request this information by contacting us at 888-522-2388.
|
|
| Material Fund Change Notice [Text Block] |
This report describes changes to the Fund that occurred during the reporting period.
|
|
| Additional Information Phone Number |
888-522-2388
|
|
| Additional Information Website |
<span style="box-sizing: border-box; color: rgb(0, 0, 0); display: inline; flex-wrap: nowrap; font-size: 13.3333px; font-weight: 400; grid-area: auto; line-height: 20px; margin: 0px; overflow: visible; text-align: left; text-align-last: auto; white-space-collapse: preserve-breaks;">lordabbett.com/FundDocuments</span>
|
|
| Expenses [Text Block] |
What were the Fund costs for the last year?(based on a hypothetical $10,000 investment) Class Name | Costs of a $10,000 investment | Costs paid as a percentage of a $10,000 investment |
|---|
Class F3 | $94 | 0.87% |
|---|
|
|
| Expenses Paid, Amount |
$ 94
|
|
| Expense Ratio, Percent |
0.87%
|
|
| Factors Affecting Performance [Text Block] |
How did the Fund perform last year and what affected its performance?For the fiscal year ended July 31, 2025, the Fund returned 16.65%, reflecting performance at the net asset value (NAV) of Class F3 shares, with all distributions reinvested, compared to the 17.18% return of a securities market index with investment characteristics similar to those of the Fund, the MSCI Emerging Markets Index (Net). The Fund's broad-based securities market index, the MSCI EAFE Net Index, returned 12.77% over the same period. Positive factors for the markets included resilient economic data and corporate earnings, continued disinflation, and other factors, such as productivity gains from generative artificial intelligence. Negative factors included increased policy uncertainty during the period, including U.S. President Trump's “Liberation Day” announcement, which led to market volatility. Against this backdrop, U.S. equity markets delivered generally strong returns. Top contributors to performance: Security selection within the Industrials sector contributed to relative performance, led by an overweight allocation to LS Electric Co., Ltd. Security selection within the Financials sector also contributed to relative performance, led by an overweight allocation to Alpha Bank S.A. Top detractors from performance: Security selection within the Information Technology sector detracted from relative performance, led by an overweight allocation to Samsung Electronics Co., Ltd. Security selection within the Consumer Staples sector also detracted from relative performance, led by an overweight allocation to Varun Beverages Ltd. |
|
| Performance Past Does Not Indicate Future [Text] |
The Fund's past performance is no guarantee of future results.
|
|
| Line Graph [Table Text Block] |
 | Class F3 | MSCI EAFE Net Index | MSCI Emerging Markets Index (Net) |
|---|
3/10/2022 | $10,000 | $10,000 | $10,000 |
|---|
3/31/2022 | $10,294 | $10,663 | $10,372 |
|---|
4/30/2022 | $9,626 | $9,973 | $9,795 |
|---|
5/31/2022 | $9,680 | $10,047 | $9,838 |
|---|
6/30/2022 | $9,139 | $9,115 | $9,184 |
|---|
7/31/2022 | $9,072 | $9,569 | $9,162 |
|---|
8/31/2022 | $8,985 | $9,115 | $9,200 |
|---|
9/30/2022 | $8,117 | $8,262 | $8,121 |
|---|
10/31/2022 | $8,031 | $8,707 | $7,869 |
|---|
11/30/2022 | $9,172 | $9,687 | $9,036 |
|---|
12/31/2022 | $8,900 | $9,695 | $8,909 |
|---|
1/31/2023 | $9,792 | $10,480 | $9,613 |
|---|
2/28/2023 | $9,104 | $10,261 | $8,989 |
|---|
3/31/2023 | $9,370 | $10,516 | $9,262 |
|---|
4/30/2023 | $9,254 | $10,813 | $9,157 |
|---|
5/31/2023 | $9,097 | $10,355 | $9,003 |
|---|
6/30/2023 | $9,472 | $10,826 | $9,345 |
|---|
7/31/2023 | $9,853 | $11,177 | $9,926 |
|---|
8/31/2023 | $9,274 | $10,748 | $9,315 |
|---|
9/30/2023 | $9,009 | $10,381 | $9,071 |
|---|
10/31/2023 | $8,730 | $9,960 | $8,719 |
|---|
11/30/2023 | $9,479 | $10,885 | $9,417 |
|---|
12/31/2023 | $9,831 | $11,463 | $9,785 |
|---|
1/31/2024 | $9,623 | $11,529 | $9,331 |
|---|
2/29/2024 | $9,990 | $11,740 | $9,775 |
|---|
3/31/2024 | $10,322 | $12,126 | $10,017 |
|---|
4/30/2024 | $10,260 | $11,816 | $10,062 |
|---|
5/31/2024 | $10,509 | $12,273 | $10,118 |
|---|
6/30/2024 | $10,952 | $12,075 | $10,517 |
|---|
7/31/2024 | $10,966 | $12,430 | $10,549 |
|---|
8/31/2024 | $11,049 | $12,834 | $10,719 |
|---|
9/30/2024 | $11,506 | $12,952 | $11,435 |
|---|
10/31/2024 | $11,271 | $12,248 | $10,926 |
|---|
11/30/2024 | $11,042 | $12,178 | $10,534 |
|---|
12/31/2024 | $10,920 | $11,901 | $10,519 |
|---|
1/31/2025 | $11,088 | $12,527 | $10,707 |
|---|
2/28/2025 | $11,249 | $12,770 | $10,759 |
|---|
3/31/2025 | $11,326 | $12,718 | $10,827 |
|---|
4/30/2025 | $11,439 | $13,301 | $10,969 |
|---|
5/31/2025 | $11,993 | $13,909 | $11,437 |
|---|
6/30/2025 | $12,736 | $14,216 | $12,125 |
|---|
7/31/2025 | $12,792 | $14,016 | $12,361 |
|---|
|
|
| Average Annual Return [Table Text Block] |
AATR | 1 Year | Since Inception
3/10/22 |
|---|
Class F3 at NAV | 16.65% | 7.53% |
|---|
MSCI Emerging Markets Index (Net) | 17.18% | 6.45% |
|---|
MSCI EAFE Net Index | 12.77% | 10.47% |
|---|
|
|
| Performance Inception Date |
Mar. 10, 2022
|
|
| No Deduction of Taxes [Text Block] |
The returns do not reflect the deduction of taxes that a shareholder would pay on Fund distributions or redemption of Fund shares.
|
|
| AssetsNet |
$ 6,374,014
|
|
| Holdings Count | Holding |
98
|
|
| Advisory Fees Paid, Amount |
$ 0
|
|
| InvestmentCompanyPortfolioTurnover |
80.00%
|
|
| Additional Fund Statistics [Text Block] |
Total Net Assets | $6,374,014 |
|---|
# of Portfolio Holdings | 98 |
|---|
Portfolio Turnover Rate | 80% |
|---|
Total Advisory Fees Paid | $0 |
|---|
|
|
| Holdings [Text Block] |
Portfolio Holdings Presented by SectorFootnote Reference* | % Footnote Reference** |
|---|
Communication Services | 12.82% | Consumer Discretionary | 11.91% | Consumer Staples | 4.50% | Energy | 3.54% | Financials | 25.66% | Health Care | 2.86% | Industrials | 8.23% | Information Technology | 24.02% | Materials | 2.01% | Real Estate | 0.75% | Utilities | 1.92% | Repurchase Agreements | 1.78% | Total | 100.00% |
| Footnote | Description | Footnote* | A sector may comprise several industries. | Footnote** | Represents percent of total investments, which excludes derivatives. |
|
|
| Material Fund Change [Text Block] |
This is a summary of certain changes to the Fund that occurred during the reporting period, except as otherwise noted. For more information contact 888-522-2388. Expenses: As of December 1, 2024, the expense limitation on total net annual operating expenses increased from 0.82% to 0.89% as part of the annual review of transfer agency expenses. |
|
| Material Fund Change Expenses [Text Block] |
Expenses: As of December 1, 2024, the expense limitation on total net annual operating expenses increased from 0.82% to 0.89% as part of the annual review of transfer agency expenses.
|
|
| Summary of Change Legend [Text Block] |
This is a summary of certain changes to the Fund that occurred during the reporting period, except as otherwise noted. For more information contact 888-522-2388.
|
|
| Updated Prospectus Phone Number |
888-522-2388
|
|
| C000231079 |
|
|
| Shareholder Report [Line Items] |
|
|
| Fund Name |
Lord Abbett Emerging Markets Equity Fund
|
|
| Class Name |
Class I
|
|
| Trading Symbol |
EMILX
|
|
| Annual or Semi-Annual Statement [Text Block] |
This annual shareholder report contains important information about the Lord Abbett Emerging Markets Equity Fund for the period of August 1, 2024 to July 31, 2025.
|
|
| Shareholder Report Annual or Semi-Annual |
Annual Shareholder Report
|
|
| Additional Information [Text Block] |
You can find additional information about the Fund at lordabbett.com/FundDocuments. You can also request this information by contacting us at 888-522-2388.
|
|
| Additional Information Phone Number |
888-522-2388
|
|
| Additional Information Website |
<span style="box-sizing: border-box; color: rgb(0, 0, 0); display: inline; flex-wrap: nowrap; font-size: 13.3333px; font-weight: 400; grid-area: auto; line-height: 20px; margin: 0px; overflow: visible; text-align: left; text-align-last: auto; white-space-collapse: preserve-breaks;">lordabbett.com/FundDocuments</span>
|
|
| Expenses [Text Block] |
What were the Fund costs for the last year?(based on a hypothetical $10,000 investment) Class Name | Costs of a $10,000 investment | Costs paid as a percentage of a $10,000 investment |
|---|
Class I | $97 | 0.90% |
|---|
|
|
| Expenses Paid, Amount |
$ 97
|
|
| Expense Ratio, Percent |
0.90%
|
|
| Factors Affecting Performance [Text Block] |
How did the Fund perform last year and what affected its performance?For the fiscal year ended July 31, 2025, the Fund returned 16.62%, reflecting performance at the net asset value (NAV) of Class I shares, with all distributions reinvested, compared to the 17.18% return of a securities market index with investment characteristics similar to those of the Fund, the MSCI Emerging Markets Index (Net). The Fund's broad-based securities market index, the MSCI EAFE Net Index, returned 12.77% over the same period. Positive factors for the markets included resilient economic data and corporate earnings, continued disinflation, and other factors, such as productivity gains from generative artificial intelligence. Negative factors included increased policy uncertainty during the period, including U.S. President Trump's “Liberation Day” announcement, which led to market volatility. Against this backdrop, U.S. equity markets delivered generally strong returns. Top contributors to performance: Security selection within the Industrials sector contributed to relative performance, led by an overweight allocation to LS Electric Co., Ltd. Security selection within the Financials sector also contributed to relative performance, led by an overweight allocation to Alpha Bank S.A. Top detractors from performance: Security selection within the Information Technology sector detracted from relative performance, led by an overweight allocation to Samsung Electronics Co., Ltd. Security selection within the Consumer Staples sector also detracted from relative performance, led by an overweight allocation to Varun Beverages Ltd. |
|
| Performance Past Does Not Indicate Future [Text] |
The Fund's past performance is no guarantee of future results.
|
|
| Line Graph [Table Text Block] |
 | Class I | MSCI EAFE Net Index | MSCI Emerging Markets Index (Net) |
|---|
3/10/2022 | $10,000 | $10,000 | $10,000 |
|---|
3/31/2022 | $10,294 | $10,663 | $10,372 |
|---|
4/30/2022 | $9,626 | $9,973 | $9,795 |
|---|
5/31/2022 | $9,673 | $10,047 | $9,838 |
|---|
6/30/2022 | $9,139 | $9,115 | $9,184 |
|---|
7/31/2022 | $9,065 | $9,569 | $9,162 |
|---|
8/31/2022 | $8,979 | $9,115 | $9,200 |
|---|
9/30/2022 | $8,117 | $8,262 | $8,121 |
|---|
10/31/2022 | $8,031 | $8,707 | $7,869 |
|---|
11/30/2022 | $9,172 | $9,687 | $9,036 |
|---|
12/31/2022 | $8,900 | $9,695 | $8,909 |
|---|
1/31/2023 | $9,785 | $10,480 | $9,613 |
|---|
2/28/2023 | $9,097 | $10,261 | $8,989 |
|---|
3/31/2023 | $9,363 | $10,516 | $9,262 |
|---|
4/30/2023 | $9,247 | $10,813 | $9,157 |
|---|
5/31/2023 | $9,090 | $10,355 | $9,003 |
|---|
6/30/2023 | $9,465 | $10,826 | $9,345 |
|---|
7/31/2023 | $9,839 | $11,177 | $9,926 |
|---|
8/31/2023 | $9,260 | $10,748 | $9,315 |
|---|
9/30/2023 | $8,995 | $10,381 | $9,071 |
|---|
10/31/2023 | $8,716 | $9,960 | $8,719 |
|---|
11/30/2023 | $9,465 | $10,885 | $9,417 |
|---|
12/31/2023 | $9,817 | $11,463 | $9,785 |
|---|
1/31/2024 | $9,609 | $11,529 | $9,331 |
|---|
2/29/2024 | $9,976 | $11,740 | $9,775 |
|---|
3/31/2024 | $10,308 | $12,126 | $10,017 |
|---|
4/30/2024 | $10,239 | $11,816 | $10,062 |
|---|
5/31/2024 | $10,495 | $12,273 | $10,118 |
|---|
6/30/2024 | $10,931 | $12,075 | $10,517 |
|---|
7/31/2024 | $10,945 | $12,430 | $10,549 |
|---|
8/31/2024 | $11,028 | $12,834 | $10,719 |
|---|
9/30/2024 | $11,478 | $12,952 | $11,435 |
|---|
10/31/2024 | $11,243 | $12,248 | $10,926 |
|---|
11/30/2024 | $11,021 | $12,178 | $10,534 |
|---|
12/31/2024 | $10,898 | $11,901 | $10,519 |
|---|
1/31/2025 | $11,060 | $12,527 | $10,707 |
|---|
2/28/2025 | $11,221 | $12,770 | $10,759 |
|---|
3/31/2025 | $11,298 | $12,718 | $10,827 |
|---|
4/30/2025 | $11,410 | $13,301 | $10,969 |
|---|
5/31/2025 | $11,972 | $13,909 | $11,437 |
|---|
6/30/2025 | $12,708 | $14,216 | $12,125 |
|---|
7/31/2025 | $12,764 | $14,016 | $12,361 |
|---|
|
|
| Average Annual Return [Table Text Block] |
AATR | 1 Year | Since Inception
3/10/22 |
|---|
Class I at NAV | 16.62% | 7.46% |
|---|
MSCI Emerging Markets Index (Net) | 17.18% | 6.45% |
|---|
MSCI EAFE Net Index | 12.77% | 10.47% |
|---|
|
|
| Performance Inception Date |
Mar. 10, 2022
|
|
| No Deduction of Taxes [Text Block] |
The returns do not reflect the deduction of taxes that a shareholder would pay on Fund distributions or redemption of Fund shares.
|
|
| AssetsNet |
$ 6,374,014
|
|
| Holdings Count | Holding |
98
|
|
| Advisory Fees Paid, Amount |
$ 0
|
|
| InvestmentCompanyPortfolioTurnover |
80.00%
|
|
| Additional Fund Statistics [Text Block] |
Total Net Assets | $6,374,014 |
|---|
# of Portfolio Holdings | 98 |
|---|
Portfolio Turnover Rate | 80% |
|---|
Total Advisory Fees Paid | $0 |
|---|
|
|
| Holdings [Text Block] |
Portfolio Holdings Presented by SectorFootnote Reference* | % Footnote Reference** |
|---|
Communication Services | 12.82% | Consumer Discretionary | 11.91% | Consumer Staples | 4.50% | Energy | 3.54% | Financials | 25.66% | Health Care | 2.86% | Industrials | 8.23% | Information Technology | 24.02% | Materials | 2.01% | Real Estate | 0.75% | Utilities | 1.92% | Repurchase Agreements | 1.78% | Total | 100.00% |
| Footnote | Description | Footnote* | A sector may comprise several industries. | Footnote** | Represents percent of total investments, which excludes derivatives. |
|
|
| Material Fund Change [Text Block] |
There were no material fund changes during the period. |
|
| Summary of Change Legend [Text Block] |
There were no material fund changes during the period.
|
|
| C000231074 |
|
|
| Shareholder Report [Line Items] |
|
|
| Fund Name |
Lord Abbett Emerging Markets Equity Fund
|
|
| Class Name |
Class R6
|
|
| Trading Symbol |
EMWLX
|
|
| Annual or Semi-Annual Statement [Text Block] |
This annual shareholder report contains important information about the Lord Abbett Emerging Markets Equity Fund for the period of August 1, 2024 to July 31, 2025.
|
|
| Shareholder Report Annual or Semi-Annual |
Annual Shareholder Report
|
|
| Additional Information [Text Block] |
You can find additional information about the Fund at lordabbett.com/FundDocuments. You can also request this information by contacting us at 888-522-2388.
|
|
| Material Fund Change Notice [Text Block] |
This report describes changes to the Fund that occurred during the reporting period.
|
|
| Additional Information Phone Number |
888-522-2388
|
|
| Additional Information Website |
<span style="box-sizing: border-box; color: rgb(0, 0, 0); display: inline; flex-wrap: nowrap; font-size: 13.3333px; font-weight: 400; grid-area: auto; line-height: 20px; margin: 0px; overflow: visible; text-align: left; text-align-last: auto; white-space-collapse: preserve-breaks;">lordabbett.com/FundDocuments</span>
|
|
| Expenses [Text Block] |
What were the Fund costs for the last year?(based on a hypothetical $10,000 investment) Class Name | Costs of a $10,000 investment | Costs paid as a percentage of a $10,000 investment |
|---|
Class R6 | $94 | 0.87% |
|---|
|
|
| Expenses Paid, Amount |
$ 94
|
|
| Expense Ratio, Percent |
0.87%
|
|
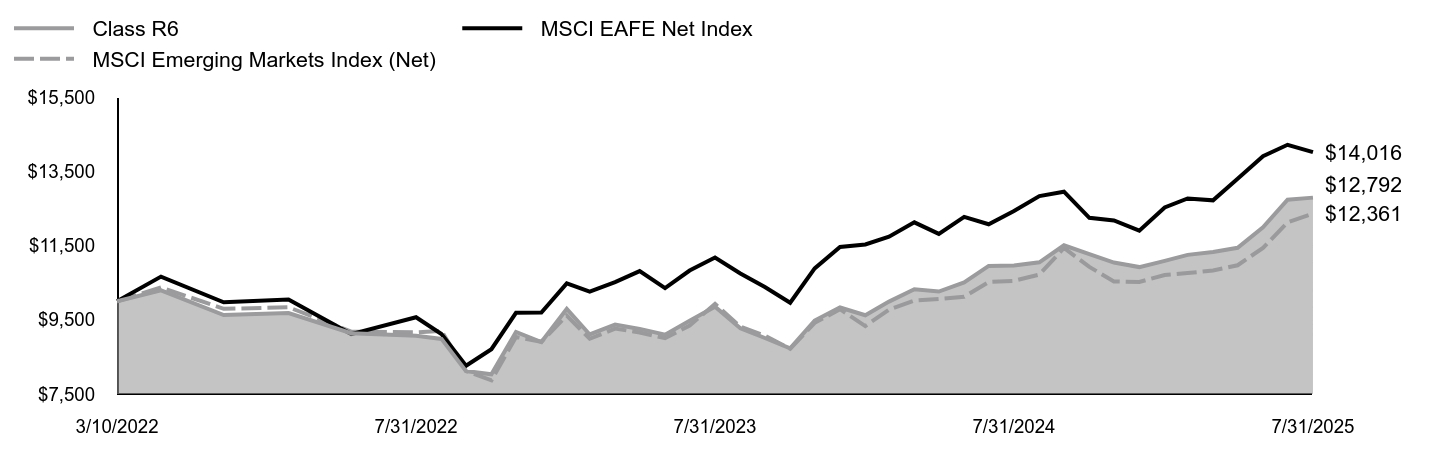
| Factors Affecting Performance [Text Block] |
How did the Fund perform last year and what affected its performance?For the fiscal year ended July 31, 2025, the Fund returned 16.65%, reflecting performance at the net asset value (NAV) of Class R6 shares, with all distributions reinvested, compared to the 17.18% return of a securities market index with investment characteristics similar to those of the Fund, the MSCI Emerging Markets Index (Net). The Fund's broad-based securities market index, the MSCI EAFE Net Index, returned 12.77% over the same period. Positive factors for the markets included resilient economic data and corporate earnings, continued disinflation, and other factors, such as productivity gains from generative artificial intelligence. Negative factors included increased policy uncertainty during the period, including U.S. President Trump's “Liberation Day” announcement, which led to market volatility. Against this backdrop, U.S. equity markets delivered generally strong returns. Top contributors to performance: Security selection within the Industrials sector contributed to relative performance, led by an overweight allocation to LS Electric Co., Ltd. Security selection within the Financials sector also contributed to relative performance, led by an overweight allocation to Alpha Bank S.A. Top detractors from performance: Security selection within the Information Technology sector detracted from relative performance, led by an overweight allocation to Samsung Electronics Co., Ltd. Security selection within the Consumer Staples sector also detracted from relative performance, led by an overweight allocation to Varun Beverages Ltd. |
|
| Performance Past Does Not Indicate Future [Text] |
The Fund's past performance is no guarantee of future results.
|
|
| Line Graph [Table Text Block] |
 | Class R6 | MSCI EAFE Net Index | MSCI Emerging Markets Index (Net) |
|---|
3/10/2022 | $10,000 | $10,000 | $10,000 |
|---|
3/31/2022 | $10,294 | $10,663 | $10,372 |
|---|
4/30/2022 | $9,626 | $9,973 | $9,795 |
|---|
5/31/2022 | $9,680 | $10,047 | $9,838 |
|---|
6/30/2022 | $9,139 | $9,115 | $9,184 |
|---|
7/31/2022 | $9,072 | $9,569 | $9,162 |
|---|
8/31/2022 | $8,985 | $9,115 | $9,200 |
|---|
9/30/2022 | $8,117 | $8,262 | $8,121 |
|---|
10/31/2022 | $8,031 | $8,707 | $7,869 |
|---|
11/30/2022 | $9,172 | $9,687 | $9,036 |
|---|
12/31/2022 | $8,900 | $9,695 | $8,909 |
|---|
1/31/2023 | $9,792 | $10,480 | $9,613 |
|---|
2/28/2023 | $9,104 | $10,261 | $8,989 |
|---|
3/31/2023 | $9,370 | $10,516 | $9,262 |
|---|
4/30/2023 | $9,254 | $10,813 | $9,157 |
|---|
5/31/2023 | $9,097 | $10,355 | $9,003 |
|---|
6/30/2023 | $9,472 | $10,826 | $9,345 |
|---|
7/31/2023 | $9,853 | $11,177 | $9,926 |
|---|
8/31/2023 | $9,274 | $10,748 | $9,315 |
|---|
9/30/2023 | $9,009 | $10,381 | $9,071 |
|---|
10/31/2023 | $8,730 | $9,960 | $8,719 |
|---|
11/30/2023 | $9,479 | $10,885 | $9,417 |
|---|
12/31/2023 | $9,831 | $11,463 | $9,785 |
|---|
1/31/2024 | $9,623 | $11,529 | $9,331 |
|---|
2/29/2024 | $9,990 | $11,740 | $9,775 |
|---|
3/31/2024 | $10,322 | $12,126 | $10,017 |
|---|
4/30/2024 | $10,260 | $11,816 | $10,062 |
|---|
5/31/2024 | $10,509 | $12,273 | $10,118 |
|---|
6/30/2024 | $10,952 | $12,075 | $10,517 |
|---|
7/31/2024 | $10,966 | $12,430 | $10,549 |
|---|
8/31/2024 | $11,049 | $12,834 | $10,719 |
|---|
9/30/2024 | $11,506 | $12,952 | $11,435 |
|---|
10/31/2024 | $11,271 | $12,248 | $10,926 |
|---|
11/30/2024 | $11,042 | $12,178 | $10,534 |
|---|
12/31/2024 | $10,920 | $11,901 | $10,519 |
|---|
1/31/2025 | $11,088 | $12,527 | $10,707 |
|---|
2/28/2025 | $11,249 | $12,770 | $10,759 |
|---|
3/31/2025 | $11,326 | $12,718 | $10,827 |
|---|
4/30/2025 | $11,439 | $13,301 | $10,969 |
|---|
5/31/2025 | $11,993 | $13,909 | $11,437 |
|---|
6/30/2025 | $12,736 | $14,216 | $12,125 |
|---|
7/31/2025 | $12,792 | $14,016 | $12,361 |
|---|
|
|
| Average Annual Return [Table Text Block] |
AATR | 1 Year | Since Inception
3/10/22 |
|---|
Class R6 at NAV | 16.65% | 7.53% |
|---|
MSCI Emerging Markets Index (Net) | 17.18% | 6.45% |
|---|
MSCI EAFE Net Index | 12.77% | 10.47% |
|---|
|
|
| Performance Inception Date |
Mar. 10, 2022
|
|
| No Deduction of Taxes [Text Block] |
The returns do not reflect the deduction of taxes that a shareholder would pay on Fund distributions or redemption of Fund shares.
|
|
| AssetsNet |
$ 6,374,014
|
|
| Holdings Count | Holding |
98
|
|
| Advisory Fees Paid, Amount |
$ 0
|
|
| InvestmentCompanyPortfolioTurnover |
80.00%
|
|
| Additional Fund Statistics [Text Block] |
Total Net Assets | $6,374,014 |
|---|
# of Portfolio Holdings | 98 |
|---|
Portfolio Turnover Rate | 80% |
|---|
Total Advisory Fees Paid | $0 |
|---|
|
|
| Holdings [Text Block] |
Portfolio Holdings Presented by SectorFootnote Reference* | % Footnote Reference** |
|---|
Communication Services | 12.82% | Consumer Discretionary | 11.91% | Consumer Staples | 4.50% | Energy | 3.54% | Financials | 25.66% | Health Care | 2.86% | Industrials | 8.23% | Information Technology | 24.02% | Materials | 2.01% | Real Estate | 0.75% | Utilities | 1.92% | Repurchase Agreements | 1.78% | Total | 100.00% |
| Footnote | Description | Footnote* | A sector may comprise several industries. | Footnote** | Represents percent of total investments, which excludes derivatives. |
|
|
| Material Fund Change [Text Block] |
This is a summary of certain changes to the Fund that occurred during the reporting period, except as otherwise noted. For more information contact 888-522-2388. Expenses: As of December 1, 2024, the expense limitation on total net annual operating expenses increased from 0.82% to 0.89% as part of the annual review of transfer agency expenses. |
|
| Material Fund Change Expenses [Text Block] |
Expenses: As of December 1, 2024, the expense limitation on total net annual operating expenses increased from 0.82% to 0.89% as part of the annual review of transfer agency expenses.
|
|
| Summary of Change Legend [Text Block] |
This is a summary of certain changes to the Fund that occurred during the reporting period, except as otherwise noted. For more information contact 888-522-2388.
|
|
| Updated Prospectus Phone Number |
888-522-2388
|
|
| C000248998 |
|
|
| Shareholder Report [Line Items] |
|
|
| Fund Name |
Lord Abbett Enhanced Municipal Yield Completion Fund
|
|
| Trading Symbol |
LAEMX
|
|
| Annual or Semi-Annual Statement [Text Block] |
This annual shareholder report contains important information about the Lord Abbett Enhanced Municipal Yield Completion Fund for the period of August 1, 2024 to July 31, 2025.
|
|
| Shareholder Report Annual or Semi-Annual |
Annual Shareholder Report
|
|
| Additional Information [Text Block] |
You can find additional information about the Fund at lordabbett.com/SMADocuments. You can also request this information by contacting us at 888-522-2388.
|
|
| Additional Information Phone Number |
888-522-2388
|
|
| Additional Information Website |
<span style="box-sizing: border-box; color: rgb(0, 0, 0); display: inline; flex-wrap: nowrap; font-size: 13.3333px; font-weight: 400; grid-area: auto; line-height: 20px; margin: 0px; overflow: visible; text-align: left; text-align-last: auto; white-space-collapse: preserve-breaks;">lordabbett.com/SMADocuments</span>
|
|
| Expenses [Text Block] |
What were the Fund costs for the last year?(based on a hypothetical $10,000 investment) Fund Name | Costs of a $10,000 investment | Costs paid as a percentage of a $10,000 investment |
|---|
Enhanced Municipal Yield Completion Fund | $0 | 0.00% |
|---|
|
|
| Expenses Paid, Amount |
$ 0
|
|
| Expense Ratio, Percent |
0.00%
|
|
| Factors Affecting Performance [Text Block] |
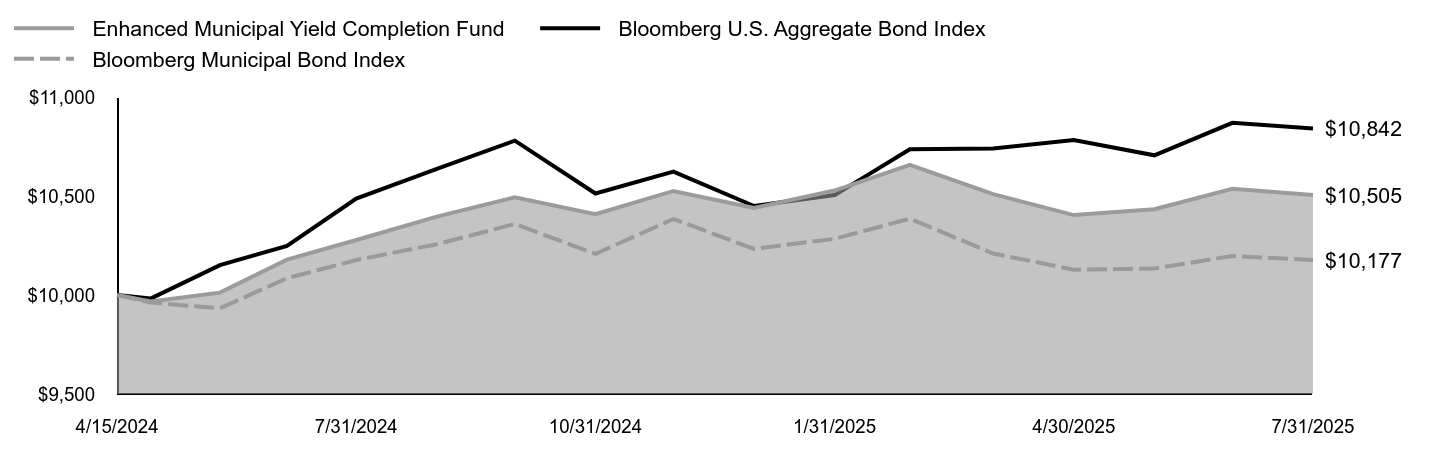
How did the Fund perform last year and what affected its performance?For the fiscal year ended July 31, 2025, the Fund returned 2.21%, reflecting performance at the net asset value (NAV), with all distributions reinvested, compared to the 0.00% return of a securities market index with investment characteristics similar to those of the Fund, the Bloomberg Municipal Bond Index. The Fund's broad-based securities market index, the Bloomberg U.S. Aggregate Bond Index, returned 3.38% over the same period. Positive factors for the municipal market included overall healthy demand for municipal bond funds and a strong fundamental backdrop, as evidenced by growing tax revenue throughout the period. News that the municipal bond tax exemption would be preserved also supported the municipal market. Negative factors included an above-average municipal bond supply, that pressured the market at various times throughout the fiscal year, and periods of interest rate volatility, particularly following the tariff announcements by the new administration in April. Top contributors to performance: The Fund’s yield curve positioning, specifically an underweight allocation to longer-term bonds contributed to relative performance. An overweight allocation to BBB-rated and non-investment grade bonds also contributed to relative performance. Top detractors from performance: A modest overweight allocation to the Education sector detracted from relative performance. An overweight allocation to the Industrial Development sector also detracted from relative performance. |
|
| Performance Past Does Not Indicate Future [Text] |
The Fund's past performance is no guarantee of future results.
|
|
| Line Graph [Table Text Block] |
| Enhanced Municipal Yield Completion Fund | Bloomberg U.S. Aggregate Bond Index | Bloomberg Municipal Bond Index |
|---|
4/15/2024 | $10,000 | $10,000 | $10,000 |
|---|
4/30/2024 | $9,967 | $9,982 | $9,962 |
|---|
5/31/2024 | $10,012 | $10,151 | $9,933 |
|---|
6/30/2024 | $10,179 | $10,248 | $10,085 |
|---|
7/31/2024 | $10,278 | $10,487 | $10,177 |
|---|
8/31/2024 | $10,396 | $10,638 | $10,257 |
|---|
9/30/2024 | $10,494 | $10,780 | $10,359 |
|---|
10/31/2024 | $10,409 | $10,513 | $10,208 |
|---|
11/30/2024 | $10,526 | $10,624 | $10,384 |
|---|
12/31/2024 | $10,440 | $10,450 | $10,233 |
|---|
1/31/2025 | $10,528 | $10,505 | $10,284 |
|---|
2/28/2025 | $10,658 | $10,737 | $10,386 |
|---|
3/31/2025 | $10,510 | $10,741 | $10,210 |
|---|
4/30/2025 | $10,404 | $10,783 | $10,128 |
|---|
5/31/2025 | $10,434 | $10,706 | $10,134 |
|---|
6/30/2025 | $10,537 | $10,870 | $10,197 |
|---|
7/31/2025 | $10,505 | $10,842 | $10,177 |
|---|
|
|
| Average Annual Return [Table Text Block] |
AATR | 1 Year | Since Inception
4/15/24Footnote Reference† |
|---|
Enhanced Municipal Yield Completion Fund at NAV | 2.21% | 3.88% |
|---|
Bloomberg Municipal Bond Index | 0.00% | 1.37% |
|---|
Bloomberg U.S. Aggregate Bond IndexFootnote Reference* | 3.38% | 6.45% |
|---|
|
|
| Performance Inception Date |
Apr. 15, 2024
|
[1] |
| No Deduction of Taxes [Text Block] |
The returns do not reflect the deduction of taxes that a shareholder would pay on Fund distributions or redemption of Fund shares.
|
|
| AssetsNet |
$ 187,663,802
|
|
| Holdings Count | Holding |
196
|
|
| Advisory Fees Paid, Amount |
$ 0
|
|
| InvestmentCompanyPortfolioTurnover |
19.00%
|
|
| Additional Fund Statistics [Text Block] |
Total Net Assets | $187,663,802 |
|---|
# of Portfolio Holdings | 196 |
|---|
Portfolio Turnover Rate | 19% |
|---|
Total Advisory Fees Paid | $0 |
|---|
|
|
| Holdings [Text Block] |
Portfolio Holdings Presented by Credit Rating
S&P or Moody'sFootnote Reference(a) | %Footnote Reference** |
|---|
| |
- A2.50%
- A-3.02%
- A+3.99%
- AA-1.07%
- AA+0.36%
- B1.21%
- B-3.50%
- B+2.40%
- BB7.55%
- BB-2.35%
- BB+5.14%
- BBB13.87%
- BBB-12.39%
- BBB+17.69%
- CCC+0.01%
- NR22.95%
- Total 100.00%
| Footnote | Description | Footnote** | Represents percent of total investments, which excludes derivatives. | Footnote(a) | Investments in investment grade municipal bonds, which as bonds that are rated, at the time of purchase, within the four highest grades assigned by an independent rating agency such as Moody’s, S&P, or Fitch, or an equivalent short-term rating, as applicable, or are unrated by rating agencies but deemed by Lord Abbett to be of comparable quality. Lower rated municipal bonds are rated, at the time of purchase, or an equivalent short-term rating, as applicable, by an independent rating agency or are unrated by rating agencies but deemed by Lord Abbett to be of comparable quality. |
|
|
| Credit Ratings Selection [Text Block] |
Investments in investment grade municipal bonds, which as bonds that are rated, at the time of purchase, within the four highest grades assigned by an independent rating agency such as Moody’s, S&P, or Fitch, or an equivalent short-term rating, as applicable, or are unrated by rating agencies but deemed by Lord Abbett to be of comparable quality. Lower rated municipal bonds are rated, at the time of purchase, or an equivalent short-term rating, as applicable, by an independent rating agency or are unrated by rating agencies but deemed by Lord Abbett to be of comparable quality.
|
|
| Material Fund Change [Text Block] |
There were no material fund changes during the period. |
|
| Summary of Change Legend [Text Block] |
There were no material fund changes during the period.
|
|
| C000241944 |
|
|
| Shareholder Report [Line Items] |
|
|
| Fund Name |
Lord Abbett Investment Grade Floating Rate Fund
|
|
| Class Name |
Class A
|
|
| Trading Symbol |
LGRAX
|
|
| Annual or Semi-Annual Statement [Text Block] |
This annual shareholder report contains important information about the Lord Abbett Investment Grade Floating Rate Fund for the period of August 1, 2024 to July 31, 2025.
|
|
| Shareholder Report Annual or Semi-Annual |
Annual Shareholder Report
|
|
| Additional Information [Text Block] |
You can find additional information about the Fund at lordabbett.com/FundDocuments. You can also request this information by contacting us at 888-522-2388.
|
|
| Additional Information Phone Number |
888-522-2388
|
|
| Additional Information Website |
<span style="box-sizing: border-box; color: rgb(0, 0, 0); display: inline; flex-wrap: nowrap; font-size: 13.3333px; font-weight: 400; grid-area: auto; line-height: 20px; margin: 0px; overflow: visible; text-align: left; text-align-last: auto; white-space-collapse: preserve-breaks;">lordabbett.com/FundDocuments</span>
|
|
| Expenses [Text Block] |
What were the Fund costs for the last year?(based on a hypothetical $10,000 investment) Class Name | Costs of a $10,000 investment | Costs paid as a percentage of a $10,000 investment |
|---|
Class A | $57 | 0.55% |
|---|
|
|
| Expenses Paid, Amount |
$ 57
|
|
| Expense Ratio, Percent |
0.55%
|
|
| Factors Affecting Performance [Text Block] |
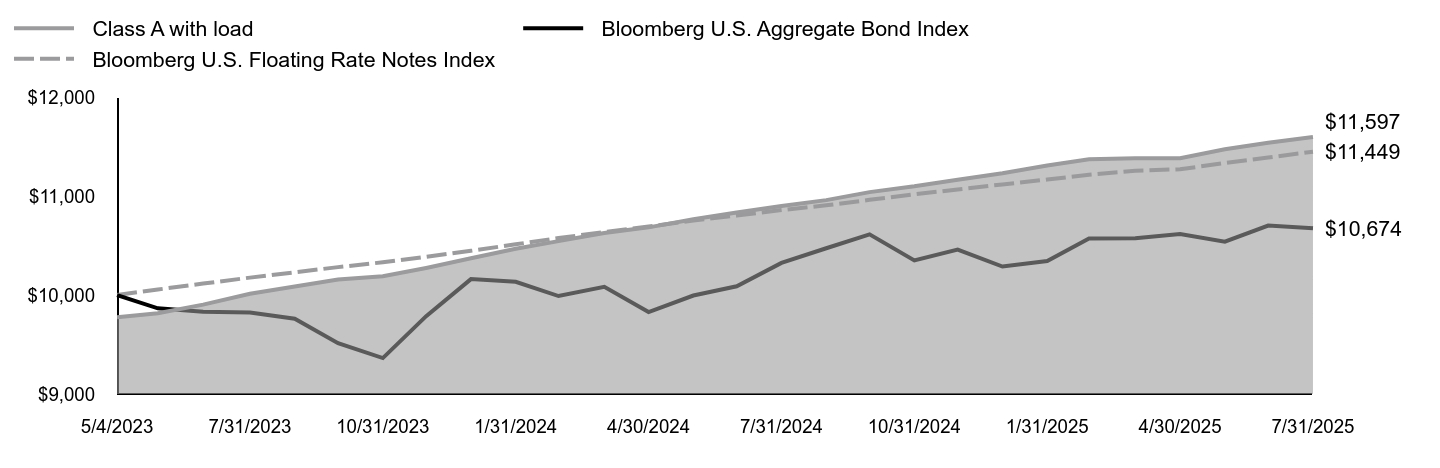
How did the Fund perform last year and what affected its performance?For the fiscal year ended July 31, 2025, the Fund returned 6.41%, reflecting performance at the net asset value (NAV) of Class A shares with all distributions reinvested, compared to a securities market index with investment characteristics similar to those of the Fund, the Bloomberg U.S. Floating Rate Notes Index, which returned 5.43% over the same period. The Fund's broad-based market index, the Bloomberg U.S. Aggregate Bond Index, returned 3.38% over the same period. U.S. fixed income markets have navigated a turbulent yet resilient path over the past several quarters, shaped by macroeconomic shifts, evolving monetary policy, and political developments. In the first half of the period, performance was mixed but ultimately constructive. Resilient macroeconomic data led to credit spreads reaching multi-year tights, though momentum faded amid growth concerns, tariff uncertainty, and skepticism around AI-driven expansion. This culminated in the April 2nd “Liberation Day” tariff announcement which triggered market volatility and sharp selloff of risk assets. Yet markets rebounded on trade policy concessions, as well as strong earnings, increased AI investment momentum, and consumer resilience. Top contributors to performance: The Fund’s allocation to collateralized loan obligations was the primary contributor to relative performance. An allocation to asset backed securities also contributed to relative performance. Top detractors from performance: The Fund’s allocation to investment grade corporate bonds detracted from relative performance. |
|
| Performance Past Does Not Indicate Future [Text] |
The Fund's past performance is no guarantee of future results.
|
|
| Line Graph [Table Text Block] |
| Class A with load | Bloomberg U.S. Aggregate Bond Index | Bloomberg U.S. Floating Rate Notes Index |
|---|
5/4/2023 | $9,775 | $10,000 | $10,000 |
|---|
5/31/2023 | $9,816 | $9,866 | $10,056 |
|---|
6/30/2023 | $9,903 | $9,831 | $10,116 |
|---|
7/31/2023 | $10,013 | $9,824 | $10,176 |
|---|
8/31/2023 | $10,086 | $9,761 | $10,230 |
|---|
9/30/2023 | $10,156 | $9,513 | $10,282 |
|---|
10/31/2023 | $10,190 | $9,363 | $10,331 |
|---|
11/30/2023 | $10,274 | $9,787 | $10,387 |
|---|
12/31/2023 | $10,371 | $10,161 | $10,447 |
|---|
1/31/2024 | $10,468 | $10,134 | $10,513 |
|---|
2/29/2024 | $10,545 | $9,990 | $10,576 |
|---|
3/31/2024 | $10,626 | $10,083 | $10,636 |
|---|
4/30/2024 | $10,684 | $9,828 | $10,692 |
|---|
5/31/2024 | $10,766 | $9,995 | $10,753 |
|---|
6/30/2024 | $10,835 | $10,089 | $10,803 |
|---|
7/31/2024 | $10,899 | $10,325 | $10,859 |
|---|
8/31/2024 | $10,959 | $10,473 | $10,907 |
|---|
9/30/2024 | $11,040 | $10,613 | $10,962 |
|---|
10/31/2024 | $11,099 | $10,350 | $11,018 |
|---|
11/30/2024 | $11,166 | $10,460 | $11,067 |
|---|
12/31/2024 | $11,230 | $10,288 | $11,118 |
|---|
1/31/2025 | $11,309 | $10,343 | $11,167 |
|---|
2/28/2025 | $11,372 | $10,571 | $11,215 |
|---|
3/31/2025 | $11,382 | $10,575 | $11,256 |
|---|
4/30/2025 | $11,382 | $10,616 | $11,271 |
|---|
5/31/2025 | $11,473 | $10,540 | $11,334 |
|---|
6/30/2025 | $11,539 | $10,702 | $11,389 |
|---|
7/31/2025 | $11,597 | $10,674 | $11,449 |
|---|
|
|
| Average Annual Return [Table Text Block] |
AATR | 1 Year | Since Inception
5/4/23 |
|---|
Class A at NAV | 6.41% | 7.92% |
|---|
Class A with sales charge | 3.97% | 6.83% |
|---|
Bloomberg U.S. Floating Rate Notes Index | 5.43% | 6.22% |
|---|
Bloomberg U.S. Aggregate Bond Index | 3.38% | 2.95% |
|---|
|
|
| Performance Inception Date |
May 04, 2023
|
|
| No Deduction of Taxes [Text Block] |
The returns do not reflect the deduction of taxes that a shareholder would pay on Fund distributions or redemption of Fund shares.
|
|
| AssetsNet |
$ 2,696,811,591
|
|
| Holdings Count | Holding |
580
|
|
| Advisory Fees Paid, Amount |
$ 1,693,699
|
|
| InvestmentCompanyPortfolioTurnover |
119.00%
|
|
| Additional Fund Statistics [Text Block] |
Total Net Assets | $2,696,811,591 |
|---|
# of Portfolio Holdings | 580 |
|---|
Portfolio Turnover Rate | 119% |
|---|
Total Advisory Fees Paid | $1,693,699 |
|---|
|
|
| Holdings [Text Block] |
Portfolio Holdings Presented by Portfolio Allocation | %Footnote Reference* |
|---|
Asset-Backed Securities | 69.99% | Corporate Bonds | 6.76% | Floating Rate Loans | 8.13% | Foreign Government Obligations | 1.92% | Government Sponsored Enterprises Collateralized Mortgage Obligations | 1.19% | Government Sponsored Enterprises Pass-Throughs | 1.45% | Non-Agency Commercial Mortgage-Backed Securities | 4.21% | Options Purchased | 0.01% | U.S. Treasury Obligations | 4.16% | Repurchase Agreements | 2.15% | Money Market FundsFootnote Reference(a) | 0.03% | Time DepositsFootnote Reference(a) | 0.00%Footnote Reference** | Total | 100.00% |
| Footnote | Description | Footnote* | Represents percent of total investments, which excludes derivatives. | Footnote** | Amount is less than 0.01% | Footnote(a) | Securities were purchased with the cash collateral from loaned securities. |
|
|
| Material Fund Change [Text Block] |
There were no material fund changes during the period. |
|
| Summary of Change Legend [Text Block] |
There were no material fund changes during the period.
|
|
| C000241948 |
|
|
| Shareholder Report [Line Items] |
|
|
| Fund Name |
Lord Abbett Investment Grade Floating Rate Fund
|
|
| Class Name |
Class C
|
|
| Trading Symbol |
IGRCX
|
|
| Annual or Semi-Annual Statement [Text Block] |
This annual shareholder report contains important information about the Lord Abbett Investment Grade Floating Rate Fund for the period of August 1, 2024 to July 31, 2025.
|
|
| Shareholder Report Annual or Semi-Annual |
Annual Shareholder Report
|
|
| Additional Information [Text Block] |
You can find additional information about the Fund at lordabbett.com/FundDocuments. You can also request this information by contacting us at 888-522-2388.
|
|
| Additional Information Phone Number |
888-522-2388
|
|
| Additional Information Website |
<span style="box-sizing: border-box; color: rgb(0, 0, 0); display: inline; flex-wrap: nowrap; font-size: 13.3333px; font-weight: 400; grid-area: auto; line-height: 20px; margin: 0px; overflow: visible; text-align: left; text-align-last: auto; white-space-collapse: preserve-breaks;">lordabbett.com/FundDocuments</span>
|
|
| Expenses [Text Block] |
What were the Fund costs for the last year?(based on a hypothetical $10,000 investment) Class Name | Costs of a $10,000 investment | Costs paid as a percentage of a $10,000 investment |
|---|
Class C | $132 | 1.28% |
|---|
|
|
| Expenses Paid, Amount |
$ 132
|
|
| Expense Ratio, Percent |
1.28%
|
|
| Factors Affecting Performance [Text Block] |
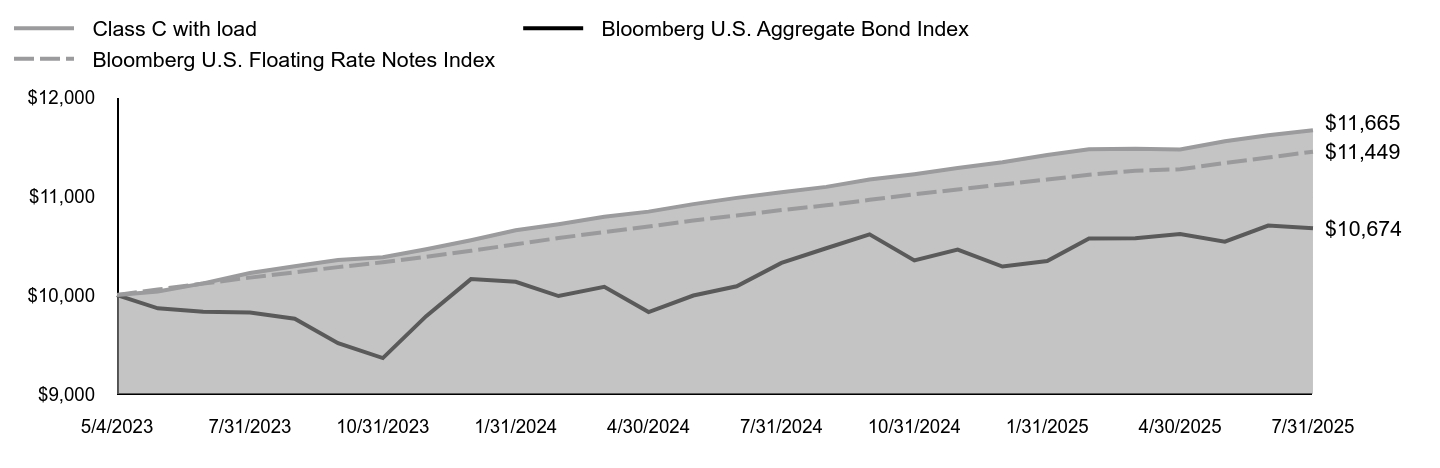
How did the Fund perform last year and what affected its performance?For the fiscal year ended July 31, 2025, the Fund returned 5.67%, reflecting performance at the net asset value (NAV) of Class C shares with all distributions reinvested, compared to a securities market index with investment characteristics similar to those of the Fund, the Bloomberg U.S. Floating Rate Notes Index, which returned 5.43% over the same period. The Fund's broad-based market index, the Bloomberg U.S. Aggregate Bond Index, returned 3.38% over the same period. U.S. fixed income markets have navigated a turbulent yet resilient path over the past several quarters, shaped by macroeconomic shifts, evolving monetary policy, and political developments. In the first half of the period, performance was mixed but ultimately constructive. Resilient macroeconomic data led to credit spreads reaching multi-year tights, though momentum faded amid growth concerns, tariff uncertainty, and skepticism around AI-driven expansion. This culminated in the April 2nd “Liberation Day” tariff announcement which triggered market volatility and sharp selloff of risk assets. Yet markets rebounded on trade policy concessions, as well as strong earnings, increased AI investment momentum, and consumer resilience. Top contributors to performance: The Fund’s allocation to collateralized loan obligations was the primary contributor to relative performance. An allocation to asset backed securities also contributed to relative performance. Top detractors from performance: The Fund’s allocation to investment grade corporate bonds detracted from relative performance. |
|
| Performance Past Does Not Indicate Future [Text] |
The Fund's past performance is no guarantee of future results.
|
|
| Line Graph [Table Text Block] |
| Class C with load | Bloomberg U.S. Aggregate Bond Index | Bloomberg U.S. Floating Rate Notes Index |
|---|
5/4/2023 | $10,000 | $10,000 | $10,000 |
|---|
5/31/2023 | $10,035 | $9,866 | $10,056 |
|---|
6/30/2023 | $10,118 | $9,831 | $10,116 |
|---|
7/31/2023 | $10,223 | $9,824 | $10,176 |
|---|
8/31/2023 | $10,290 | $9,761 | $10,230 |
|---|
9/30/2023 | $10,355 | $9,513 | $10,282 |
|---|
10/31/2023 | $10,383 | $9,363 | $10,331 |
|---|
11/30/2023 | $10,462 | $9,787 | $10,387 |
|---|
12/31/2023 | $10,554 | $10,161 | $10,447 |
|---|
1/31/2024 | $10,655 | $10,134 | $10,513 |
|---|
2/29/2024 | $10,716 | $9,990 | $10,576 |
|---|
3/31/2024 | $10,791 | $10,083 | $10,636 |
|---|
4/30/2024 | $10,843 | $9,828 | $10,692 |
|---|
5/31/2024 | $10,919 | $9,995 | $10,753 |
|---|
6/30/2024 | $10,982 | $10,089 | $10,803 |
|---|
7/31/2024 | $11,039 | $10,325 | $10,859 |
|---|
8/31/2024 | $11,093 | $10,473 | $10,907 |
|---|
9/30/2024 | $11,167 | $10,613 | $10,962 |
|---|
10/31/2024 | $11,221 | $10,350 | $11,018 |
|---|
11/30/2024 | $11,283 | $10,460 | $11,067 |
|---|
12/31/2024 | $11,342 | $10,288 | $11,118 |
|---|
1/31/2025 | $11,416 | $10,343 | $11,167 |
|---|
2/28/2025 | $11,474 | $10,571 | $11,215 |
|---|
3/31/2025 | $11,479 | $10,575 | $11,256 |
|---|
4/30/2025 | $11,471 | $10,616 | $11,271 |
|---|
5/31/2025 | $11,555 | $10,540 | $11,334 |
|---|
6/30/2025 | $11,614 | $10,702 | $11,389 |
|---|
7/31/2025 | $11,665 | $10,674 | $11,449 |
|---|
|
|
| Average Annual Return [Table Text Block] |
AATR | 1 Year | Since Inception
5/4/23 |
|---|
Class C at NAV | 5.67% | 7.11% |
|---|
Class C with sales charge | 4.67% | 7.11% |
|---|
Bloomberg U.S. Floating Rate Notes Index | 5.43% | 6.22% |
|---|
Bloomberg U.S. Aggregate Bond Index | 3.38% | 2.95% |
|---|
|
|
| Performance Inception Date |
May 04, 2023
|
|
| No Deduction of Taxes [Text Block] |
The returns do not reflect the deduction of taxes that a shareholder would pay on Fund distributions or redemption of Fund shares.
|
|
| AssetsNet |
$ 2,696,811,591
|
|
| Holdings Count | Holding |
580
|
|
| Advisory Fees Paid, Amount |
$ 1,693,699
|
|
| InvestmentCompanyPortfolioTurnover |
119.00%
|
|
| Additional Fund Statistics [Text Block] |
Total Net Assets | $2,696,811,591 |
|---|
# of Portfolio Holdings | 580 |
|---|
Portfolio Turnover Rate | 119% |
|---|
Total Advisory Fees Paid | $1,693,699 |
|---|
|
|
| Holdings [Text Block] |
Portfolio Holdings Presented by Portfolio Allocation | %Footnote Reference* |
|---|
Asset-Backed Securities | 69.99% | Corporate Bonds | 6.76% | Floating Rate Loans | 8.13% | Foreign Government Obligations | 1.92% | Government Sponsored Enterprises Collateralized Mortgage Obligations | 1.19% | Government Sponsored Enterprises Pass-Throughs | 1.45% | Non-Agency Commercial Mortgage-Backed Securities | 4.21% | Options Purchased | 0.01% | U.S. Treasury Obligations | 4.16% | Repurchase Agreements | 2.15% | Money Market FundsFootnote Reference(a) | 0.03% | Time DepositsFootnote Reference(a) | 0.00%Footnote Reference** | Total | 100.00% |
| Footnote | Description | Footnote* | Represents percent of total investments, which excludes derivatives. | Footnote** | Amount is less than 0.01% | Footnote(a) | Securities were purchased with the cash collateral from loaned securities. |
|
|
| Material Fund Change [Text Block] |
There were no material fund changes during the period. |
|
| Summary of Change Legend [Text Block] |
There were no material fund changes during the period.
|
|
| C000241947 |
|
|
| Shareholder Report [Line Items] |
|
|
| Fund Name |
Lord Abbett Investment Grade Floating Rate Fund
|
|
| Class Name |
Class F
|
|
| Trading Symbol |
LGRFX
|
|
| Annual or Semi-Annual Statement [Text Block] |
This annual shareholder report contains important information about the Lord Abbett Investment Grade Floating Rate Fund for the period of August 1, 2024 to July 31, 2025.
|
|
| Shareholder Report Annual or Semi-Annual |
Annual Shareholder Report
|
|
| Additional Information [Text Block] |
You can find additional information about the Fund at lordabbett.com/FundDocuments. You can also request this information by contacting us at 888-522-2388.
|
|
| Additional Information Phone Number |
888-522-2388
|
|
| Additional Information Website |
<span style="box-sizing: border-box; color: rgb(0, 0, 0); display: inline; flex-wrap: nowrap; font-size: 13.3333px; font-weight: 400; grid-area: auto; line-height: 20px; margin: 0px; overflow: visible; text-align: left; text-align-last: auto; white-space-collapse: preserve-breaks;">lordabbett.com/FundDocuments</span>
|
|
| Expenses [Text Block] |
What were the Fund costs for the last year?(based on a hypothetical $10,000 investment) Class Name | Costs of a $10,000 investment | Costs paid as a percentage of a $10,000 investment |
|---|
Class F | $36 | 0.35% |
|---|
|
|
| Expenses Paid, Amount |
$ 36
|
|
| Expense Ratio, Percent |
0.35%
|
|
| Factors Affecting Performance [Text Block] |
How did the Fund perform last year and what affected its performance?For the fiscal year ended July 31, 2025, the Fund returned 6.61%, reflecting performance at the net asset value (NAV) of Class F shares with all distributions reinvested, compared to a securities market index with investment characteristics similar to those of the Fund, the Bloomberg U.S. Floating Rate Notes Index, which returned 5.43% over the same period. The Fund's broad-based market index, the Bloomberg U.S. Aggregate Bond Index, returned 3.38% over the same period. U.S. fixed income markets have navigated a turbulent yet resilient path over the past several quarters, shaped by macroeconomic shifts, evolving monetary policy, and political developments. In the first half of the period, performance was mixed but ultimately constructive. Resilient macroeconomic data led to credit spreads reaching multi-year tights, though momentum faded amid growth concerns, tariff uncertainty, and skepticism around AI-driven expansion. This culminated in the April 2nd “Liberation Day” tariff announcement which triggered market volatility and sharp selloff of risk assets. Yet markets rebounded on trade policy concessions, as well as strong earnings, increased AI investment momentum, and consumer resilience. Top contributors to performance: The Fund’s allocation to collateralized loan obligations was the primary contributor to relative performance. An allocation to asset backed securities also contributed to relative performance. Top detractors from performance: The Fund’s allocation to investment grade corporate bonds detracted from relative performance. |
|
| Performance Past Does Not Indicate Future [Text] |
The Fund's past performance is no guarantee of future results.
|
|
| Line Graph [Table Text Block] |
| Class F | Bloomberg U.S. Aggregate Bond Index | Bloomberg U.S. Floating Rate Notes Index |
|---|
5/4/2023 | $10,000 | $10,000 | $10,000 |
|---|
5/31/2023 | $10,043 | $9,866 | $10,056 |
|---|
6/30/2023 | $10,134 | $9,831 | $10,116 |
|---|
7/31/2023 | $10,249 | $9,824 | $10,176 |
|---|
8/31/2023 | $10,324 | $9,761 | $10,230 |
|---|
9/30/2023 | $10,398 | $9,513 | $10,282 |
|---|
10/31/2023 | $10,435 | $9,363 | $10,331 |
|---|
11/30/2023 | $10,522 | $9,787 | $10,387 |
|---|
12/31/2023 | $10,624 | $10,161 | $10,447 |
|---|
1/31/2024 | $10,736 | $10,134 | $10,513 |
|---|
2/29/2024 | $10,816 | $9,990 | $10,576 |
|---|
3/31/2024 | $10,890 | $10,083 | $10,636 |
|---|
4/30/2024 | $10,951 | $9,828 | $10,692 |
|---|
5/31/2024 | $11,037 | $9,995 | $10,753 |
|---|
6/30/2024 | $11,110 | $10,089 | $10,803 |
|---|
7/31/2024 | $11,177 | $10,325 | $10,859 |
|---|
8/31/2024 | $11,241 | $10,473 | $10,907 |
|---|
9/30/2024 | $11,326 | $10,613 | $10,962 |
|---|
10/31/2024 | $11,388 | $10,350 | $11,018 |
|---|
11/30/2024 | $11,458 | $10,460 | $11,067 |
|---|
12/31/2024 | $11,526 | $10,288 | $11,118 |
|---|
1/31/2025 | $11,609 | $10,343 | $11,167 |
|---|
2/28/2025 | $11,675 | $10,571 | $11,215 |
|---|
3/31/2025 | $11,688 | $10,575 | $11,256 |
|---|
4/30/2025 | $11,690 | $10,616 | $11,271 |
|---|
5/31/2025 | $11,785 | $10,540 | $11,334 |
|---|
6/30/2025 | $11,855 | $10,702 | $11,389 |
|---|
7/31/2025 | $11,916 | $10,674 | $11,449 |
|---|
|
|
| Average Annual Return [Table Text Block] |
AATR | 1 Year | Since Inception
5/4/23 |
|---|
Class F at NAV | 6.61% | 8.14% |
|---|
Bloomberg U.S. Floating Rate Notes Index | 5.43% | 6.22% |
|---|
Bloomberg U.S. Aggregate Bond Index | 3.38% | 2.95% |
|---|
|
|
| Performance Inception Date |
May 04, 2023
|
|
| No Deduction of Taxes [Text Block] |
The returns do not reflect the deduction of taxes that a shareholder would pay on Fund distributions or redemption of Fund shares.
|
|
| AssetsNet |
$ 2,696,811,591
|
|
| Holdings Count | Holding |
580
|
|
| Advisory Fees Paid, Amount |
$ 1,693,699
|
|
| InvestmentCompanyPortfolioTurnover |
119.00%
|
|
| Additional Fund Statistics [Text Block] |
Total Net Assets | $2,696,811,591 |
|---|
# of Portfolio Holdings | 580 |
|---|
Portfolio Turnover Rate | 119% |
|---|
Total Advisory Fees Paid | $1,693,699 |
|---|
|
|
| Holdings [Text Block] |
Portfolio Holdings Presented by Portfolio Allocation | %Footnote Reference* |
|---|
Asset-Backed Securities | 69.99% | Corporate Bonds | 6.76% | Floating Rate Loans | 8.13% | Foreign Government Obligations | 1.92% | Government Sponsored Enterprises Collateralized Mortgage Obligations | 1.19% | Government Sponsored Enterprises Pass-Throughs | 1.45% | Non-Agency Commercial Mortgage-Backed Securities | 4.21% | Options Purchased | 0.01% | U.S. Treasury Obligations | 4.16% | Repurchase Agreements | 2.15% | Money Market FundsFootnote Reference(a) | 0.03% | Time DepositsFootnote Reference(a) | 0.00%Footnote Reference** | Total | 100.00% |
| Footnote | Description | Footnote* | Represents percent of total investments, which excludes derivatives. | Footnote** | Amount is less than 0.01% | Footnote(a) | Securities were purchased with the cash collateral from loaned securities. |
|
|
| Material Fund Change [Text Block] |
There were no material fund changes during the period. |
|
| Summary of Change Legend [Text Block] |
There were no material fund changes during the period.
|
|
| C000241946 |
|
|
| Shareholder Report [Line Items] |
|
|
| Fund Name |
Lord Abbett Investment Grade Floating Rate Fund
|
|
| Class Name |
Class F3
|
|
| Trading Symbol |
IGRNX
|
|
| Annual or Semi-Annual Statement [Text Block] |
This annual shareholder report contains important information about the Lord Abbett Investment Grade Floating Rate Fund for the period of August 1, 2024 to July 31, 2025.
|
|
| Shareholder Report Annual or Semi-Annual |
Annual Shareholder Report
|
|
| Additional Information [Text Block] |
You can find additional information about the Fund at lordabbett.com/FundDocuments. You can also request this information by contacting us at 888-522-2388.
|
|
| Material Fund Change Notice [Text Block] |
This report describes changes to the Fund that occurred during the reporting period.
|
|
| Additional Information Phone Number |
888-522-2388
|
|
| Additional Information Website |
<span style="box-sizing: border-box; color: rgb(0, 0, 0); display: inline; flex-wrap: nowrap; font-size: 13.3333px; font-weight: 400; grid-area: auto; line-height: 20px; margin: 0px; overflow: visible; text-align: left; text-align-last: auto; white-space-collapse: preserve-breaks;">lordabbett.com/FundDocuments</span>
|
|
| Expenses [Text Block] |
What were the Fund costs for the last year?(based on a hypothetical $10,000 investment) Class Name | Costs of a $10,000 investment | Costs paid as a percentage of a $10,000 investment |
|---|
Class F3 | $34 | 0.33% |
|---|
|
|
| Expenses Paid, Amount |
$ 34
|
|
| Expense Ratio, Percent |
0.33%
|
|
| Factors Affecting Performance [Text Block] |
How did the Fund perform last year and what affected its performance?For the fiscal year ended July 31, 2025, the Fund returned 6.65%, reflecting performance at the net asset value (NAV) of Class F3 shares with all distributions reinvested, compared to a securities market index with investment characteristics similar to those of the Fund, the Bloomberg U.S. Floating Rate Notes Index, which returned 5.43% over the same period. The Fund's broad-based market index, the Bloomberg U.S. Aggregate Bond Index, returned 3.38% over the same period. U.S. fixed income markets have navigated a turbulent yet resilient path over the past several quarters, shaped by macroeconomic shifts, evolving monetary policy, and political developments. In the first half of the period, performance was mixed but ultimately constructive. Resilient macroeconomic data led to credit spreads reaching multi-year tights, though momentum faded amid growth concerns, tariff uncertainty, and skepticism around AI-driven expansion. This culminated in the April 2nd “Liberation Day” tariff announcement which triggered market volatility and sharp selloff of risk assets. Yet markets rebounded on trade policy concessions, as well as strong earnings, increased AI investment momentum, and consumer resilience. Top contributors to performance: The Fund’s allocation to collateralized loan obligations was the primary contributor to relative performance. An allocation to asset backed securities also contributed to relative performance. Top detractors from performance: The Fund’s allocation to investment grade corporate bonds detracted from relative performance. |
|
| Performance Past Does Not Indicate Future [Text] |
The Fund's past performance is no guarantee of future results.
|
|
| Line Graph [Table Text Block] |
| Class F3 | Bloomberg U.S. Aggregate Bond Index | Bloomberg U.S. Floating Rate Notes Index |
|---|
5/4/2023 | $10,000 | $10,000 | $10,000 |
|---|
5/31/2023 | $10,044 | $9,866 | $10,056 |
|---|
6/30/2023 | $10,136 | $9,831 | $10,116 |
|---|
7/31/2023 | $10,250 | $9,824 | $10,176 |
|---|
8/31/2023 | $10,327 | $9,761 | $10,230 |
|---|
9/30/2023 | $10,401 | $9,513 | $10,282 |
|---|
10/31/2023 | $10,439 | $9,363 | $10,331 |
|---|
11/30/2023 | $10,527 | $9,787 | $10,387 |
|---|
12/31/2023 | $10,629 | $10,161 | $10,447 |
|---|
1/31/2024 | $10,731 | $10,134 | $10,513 |
|---|
2/29/2024 | $10,812 | $9,990 | $10,576 |
|---|
3/31/2024 | $10,897 | $10,083 | $10,636 |
|---|
4/30/2024 | $10,959 | $9,828 | $10,692 |
|---|
5/31/2024 | $11,045 | $9,995 | $10,753 |
|---|
6/30/2024 | $11,119 | $10,089 | $10,803 |
|---|
7/31/2024 | $11,187 | $10,325 | $10,859 |
|---|
8/31/2024 | $11,251 | $10,473 | $10,907 |
|---|
9/30/2024 | $11,337 | $10,613 | $10,962 |
|---|
10/31/2024 | $11,400 | $10,350 | $11,018 |
|---|
11/30/2024 | $11,471 | $10,460 | $11,067 |
|---|
12/31/2024 | $11,538 | $10,288 | $11,118 |
|---|
1/31/2025 | $11,621 | $10,343 | $11,167 |
|---|
2/28/2025 | $11,688 | $10,571 | $11,215 |
|---|
3/31/2025 | $11,702 | $10,575 | $11,256 |
|---|
4/30/2025 | $11,704 | $10,616 | $11,271 |
|---|
5/31/2025 | $11,799 | $10,540 | $11,334 |
|---|
6/30/2025 | $11,869 | $10,702 | $11,389 |
|---|
7/31/2025 | $11,931 | $10,674 | $11,449 |
|---|
|
|
| Average Annual Return [Table Text Block] |
AATR | 1 Year | Since Inception
5/4/23 |
|---|
Class F3 at NAV | 6.65% | 8.20% |
|---|
Bloomberg U.S. Floating Rate Notes Index | 5.43% | 6.22% |
|---|
Bloomberg U.S. Aggregate Bond Index | 3.38% | 2.95% |
|---|
|
|
| Performance Inception Date |
May 04, 2023
|
|
| No Deduction of Taxes [Text Block] |
The returns do not reflect the deduction of taxes that a shareholder would pay on Fund distributions or redemption of Fund shares.
|
|
| AssetsNet |
$ 2,696,811,591
|
|
| Holdings Count | Holding |
580
|
|
| Advisory Fees Paid, Amount |
$ 1,693,699
|
|
| InvestmentCompanyPortfolioTurnover |
119.00%
|
|
| Additional Fund Statistics [Text Block] |
Total Net Assets | $2,696,811,591 |
|---|
# of Portfolio Holdings | 580 |
|---|
Portfolio Turnover Rate | 119% |
|---|
Total Advisory Fees Paid | $1,693,699 |
|---|
|
|
| Holdings [Text Block] |
Portfolio Holdings Presented by Portfolio Allocation | %Footnote Reference* |
|---|
Asset-Backed Securities | 69.99% | Corporate Bonds | 6.76% | Floating Rate Loans | 8.13% | Foreign Government Obligations | 1.92% | Government Sponsored Enterprises Collateralized Mortgage Obligations | 1.19% | Government Sponsored Enterprises Pass-Throughs | 1.45% | Non-Agency Commercial Mortgage-Backed Securities | 4.21% | Options Purchased | 0.01% | U.S. Treasury Obligations | 4.16% | Repurchase Agreements | 2.15% | Money Market FundsFootnote Reference(a) | 0.03% | Time DepositsFootnote Reference(a) | 0.00%Footnote Reference** | Total | 100.00% |
| Footnote | Description | Footnote* | Represents percent of total investments, which excludes derivatives. | Footnote** | Amount is less than 0.01% | Footnote(a) | Securities were purchased with the cash collateral from loaned securities. |
|
|
| Material Fund Change [Text Block] |
This is a summary of certain changes to the Fund that occurred during the reporting period, except as otherwise noted. For more information contact 888-522-2388. Expenses: As of December 1, 2024, the expense limitation on total net annual operating expenses increased from 0.28% to 0.34% as part of the annual review of transfer agency expenses. |
|
| Material Fund Change Expenses [Text Block] |
Expenses: As of December 1, 2024, the expense limitation on total net annual operating expenses increased from 0.28% to 0.34% as part of the annual review of transfer agency expenses.
|
|
| Summary of Change Legend [Text Block] |
This is a summary of certain changes to the Fund that occurred during the reporting period, except as otherwise noted. For more information contact 888-522-2388.
|
|
| Updated Prospectus Phone Number |
888-522-2388
|
|
| C000241945 |
|
|
| Shareholder Report [Line Items] |
|
|
| Fund Name |
Lord Abbett Investment Grade Floating Rate Fund
|
|
| Class Name |
Class I
|
|
| Trading Symbol |
LGRYX
|
|
| Annual or Semi-Annual Statement [Text Block] |
This annual shareholder report contains important information about the Lord Abbett Investment Grade Floating Rate Fund for the period of August 1, 2024 to July 31, 2025.
|
|
| Shareholder Report Annual or Semi-Annual |
Annual Shareholder Report
|
|
| Additional Information [Text Block] |
You can find additional information about the Fund at lordabbett.com/FundDocuments. You can also request this information by contacting us at 888-522-2388.
|
|
| Additional Information Phone Number |
888-522-2388
|
|
| Additional Information Website |
<span style="box-sizing: border-box; color: rgb(0, 0, 0); display: inline; flex-wrap: nowrap; font-size: 13.3333px; font-weight: 400; grid-area: auto; line-height: 20px; margin: 0px; overflow: visible; text-align: left; text-align-last: auto; white-space-collapse: preserve-breaks;">lordabbett.com/FundDocuments</span>
|
|
| Expenses [Text Block] |
What were the Fund costs for the last year?(based on a hypothetical $10,000 investment) Class Name | Costs of a $10,000 investment | Costs paid as a percentage of a $10,000 investment |
|---|
Class I | $36 | 0.35% |
|---|
|
|
| Expenses Paid, Amount |
$ 36
|
|
| Expense Ratio, Percent |
0.35%
|
|
| Factors Affecting Performance [Text Block] |
How did the Fund perform last year and what affected its performance?For the fiscal year ended July 31, 2025, the Fund returned 6.61%, reflecting performance at the net asset value (NAV) of Class I shares with all distributions reinvested, compared to a securities market index with investment characteristics similar to those of the Fund, the Bloomberg U.S. Floating Rate Notes Index, which returned 5.43% over the same period. The Fund's broad-based market index, the Bloomberg U.S. Aggregate Bond Index, returned 3.38% over the same period. U.S. fixed income markets have navigated a turbulent yet resilient path over the past several quarters, shaped by macroeconomic shifts, evolving monetary policy, and political developments. In the first half of the period, performance was mixed but ultimately constructive. Resilient macroeconomic data led to credit spreads reaching multi-year tights, though momentum faded amid growth concerns, tariff uncertainty, and skepticism around AI-driven expansion. This culminated in the April 2nd “Liberation Day” tariff announcement which triggered market volatility and sharp selloff of risk assets. Yet markets rebounded on trade policy concessions, as well as strong earnings, increased AI investment momentum, and consumer resilience. Top contributors to performance: The Fund’s allocation to collateralized loan obligations was the primary contributor to relative performance. An allocation to asset backed securities also contributed to relative performance. Top detractors from performance: The Fund’s allocation to investment grade corporate bonds detracted from relative performance. |
|
| Performance Past Does Not Indicate Future [Text] |
The Fund's past performance is no guarantee of future results.
|
|
| Line Graph [Table Text Block] |
| Class I | Bloomberg U.S. Aggregate Bond Index | Bloomberg U.S. Floating Rate Notes Index |
|---|
5/4/2023 | $10,000 | $10,000 | $10,000 |
|---|
5/31/2023 | $10,044 | $9,866 | $10,056 |
|---|
6/30/2023 | $10,134 | $9,831 | $10,116 |
|---|
7/31/2023 | $10,249 | $9,824 | $10,176 |
|---|
8/31/2023 | $10,324 | $9,761 | $10,230 |
|---|
9/30/2023 | $10,398 | $9,513 | $10,282 |
|---|
10/31/2023 | $10,435 | $9,363 | $10,331 |
|---|
11/30/2023 | $10,522 | $9,787 | $10,387 |
|---|
12/31/2023 | $10,624 | $10,161 | $10,447 |
|---|
1/31/2024 | $10,725 | $10,134 | $10,513 |
|---|
2/29/2024 | $10,805 | $9,990 | $10,576 |
|---|
3/31/2024 | $10,890 | $10,083 | $10,636 |
|---|
4/30/2024 | $10,951 | $9,828 | $10,692 |
|---|
5/31/2024 | $11,037 | $9,995 | $10,753 |
|---|
6/30/2024 | $11,110 | $10,089 | $10,803 |
|---|
7/31/2024 | $11,177 | $10,325 | $10,859 |
|---|
8/31/2024 | $11,241 | $10,473 | $10,907 |
|---|
9/30/2024 | $11,326 | $10,613 | $10,962 |
|---|
10/31/2024 | $11,388 | $10,350 | $11,018 |
|---|
11/30/2024 | $11,459 | $10,460 | $11,067 |
|---|
12/31/2024 | $11,526 | $10,288 | $11,118 |
|---|
1/31/2025 | $11,609 | $10,343 | $11,167 |
|---|
2/28/2025 | $11,675 | $10,571 | $11,215 |
|---|
3/31/2025 | $11,688 | $10,575 | $11,256 |
|---|
4/30/2025 | $11,690 | $10,616 | $11,271 |
|---|
5/31/2025 | $11,785 | $10,540 | $11,334 |
|---|
6/30/2025 | $11,855 | $10,702 | $11,389 |
|---|
7/31/2025 | $11,916 | $10,674 | $11,449 |
|---|
|
|
| Average Annual Return [Table Text Block] |
AATR | 1 Year | Since Inception
5/4/23 |
|---|
Class I at NAV | 6.61% | 8.14% |
|---|
Bloomberg U.S. Floating Rate Notes Index | 5.43% | 6.22% |
|---|
Bloomberg U.S. Aggregate Bond Index | 3.38% | 2.95% |
|---|
|
|
| Performance Inception Date |
May 04, 2023
|
|
| No Deduction of Taxes [Text Block] |
The returns do not reflect the deduction of taxes that a shareholder would pay on Fund distributions or redemption of Fund shares.
|
|
| AssetsNet |
$ 2,696,811,591
|
|
| Holdings Count | Holding |
580
|
|
| Advisory Fees Paid, Amount |
$ 1,693,699
|
|
| InvestmentCompanyPortfolioTurnover |
119.00%
|
|
| Additional Fund Statistics [Text Block] |
Total Net Assets | $2,696,811,591 |
|---|
# of Portfolio Holdings | 580 |
|---|
Portfolio Turnover Rate | 119% |
|---|
Total Advisory Fees Paid | $1,693,699 |
|---|
|
|
| Holdings [Text Block] |
Portfolio Holdings Presented by Portfolio Allocation | %Footnote Reference* |
|---|
Asset-Backed Securities | 69.99% | Corporate Bonds | 6.76% | Floating Rate Loans | 8.13% | Foreign Government Obligations | 1.92% | Government Sponsored Enterprises Collateralized Mortgage Obligations | 1.19% | Government Sponsored Enterprises Pass-Throughs | 1.45% | Non-Agency Commercial Mortgage-Backed Securities | 4.21% | Options Purchased | 0.01% | U.S. Treasury Obligations | 4.16% | Repurchase Agreements | 2.15% | Money Market FundsFootnote Reference(a) | 0.03% | Time DepositsFootnote Reference(a) | 0.00%Footnote Reference** | Total | 100.00% |
| Footnote | Description | Footnote* | Represents percent of total investments, which excludes derivatives. | Footnote** | Amount is less than 0.01% | Footnote(a) | Securities were purchased with the cash collateral from loaned securities. |
|
|
| Material Fund Change [Text Block] |
There were no material fund changes during the period. |
|
| Summary of Change Legend [Text Block] |
There were no material fund changes during the period.
|
|
| C000241941 |
|
|
| Shareholder Report [Line Items] |
|
|
| Fund Name |
Lord Abbett Investment Grade Floating Rate Fund
|
|
| Class Name |
Class R5
|
|
| Trading Symbol |
IGRSX
|
|
| Annual or Semi-Annual Statement [Text Block] |
This annual shareholder report contains important information about the Lord Abbett Investment Grade Floating Rate Fund for the period of August 1, 2024 to July 31, 2025.
|
|
| Shareholder Report Annual or Semi-Annual |
Annual Shareholder Report
|
|
| Additional Information [Text Block] |
You can find additional information about the Fund at lordabbett.com/FundDocuments. You can also request this information by contacting us at 888-522-2388.
|
|
| Additional Information Phone Number |
888-522-2388
|
|
| Additional Information Website |
<span style="box-sizing: border-box; color: rgb(0, 0, 0); display: inline; flex-wrap: nowrap; font-size: 13.3333px; font-weight: 400; grid-area: auto; line-height: 20px; margin: 0px; overflow: visible; text-align: left; text-align-last: auto; white-space-collapse: preserve-breaks;">lordabbett.com/FundDocuments</span>
|
|
| Expenses [Text Block] |
What were the Fund costs for the last year?(based on a hypothetical $10,000 investment) Class Name | Costs of a $10,000 investment | Costs paid as a percentage of a $10,000 investment |
|---|
Class R5 | $36 | 0.35% |
|---|
|
|
| Expenses Paid, Amount |
$ 36
|
|
| Expense Ratio, Percent |
0.35%
|
|
| Factors Affecting Performance [Text Block] |
How did the Fund perform last year and what affected its performance?For the fiscal year ended July 31, 2025, the Fund returned 6.60%, reflecting performance at the net asset value (NAV) of Class R5 shares with all distributions reinvested, compared to a securities market index with investment characteristics similar to those of the Fund, the Bloomberg U.S. Floating Rate Notes Index, which returned 5.43% over the same period. The Fund's broad-based market index, the Bloomberg U.S. Aggregate Bond Index, returned 3.38% over the same period. U.S. fixed income markets have navigated a turbulent yet resilient path over the past several quarters, shaped by macroeconomic shifts, evolving monetary policy, and political developments. In the first half of the period, performance was mixed but ultimately constructive. Resilient macroeconomic data led to credit spreads reaching multi-year tights, though momentum faded amid growth concerns, tariff uncertainty, and skepticism around AI-driven expansion. This culminated in the April 2nd “Liberation Day” tariff announcement which triggered market volatility and sharp selloff of risk assets. Yet markets rebounded on trade policy concessions, as well as strong earnings, increased AI investment momentum, and consumer resilience. Top contributors to performance: The Fund’s allocation to collateralized loan obligations was the primary contributor to relative performance. An allocation to asset backed securities also contributed to relative performance. Top detractors from performance: The Fund’s allocation to investment grade corporate bonds detracted from relative performance. |
|
| Performance Past Does Not Indicate Future [Text] |
The Fund's past performance is no guarantee of future results.
|
|
| Line Graph [Table Text Block] |
| Class R5 | Bloomberg U.S. Aggregate Bond Index | Bloomberg U.S. Floating Rate Notes Index |
|---|
5/4/2023 | $10,000 | $10,000 | $10,000 |
|---|
5/31/2023 | $10,043 | $9,866 | $10,056 |
|---|
6/30/2023 | $10,134 | $9,831 | $10,116 |
|---|
7/31/2023 | $10,249 | $9,824 | $10,176 |
|---|
8/31/2023 | $10,324 | $9,761 | $10,230 |
|---|
9/30/2023 | $10,398 | $9,513 | $10,282 |
|---|
10/31/2023 | $10,435 | $9,363 | $10,331 |
|---|
11/30/2023 | $10,522 | $9,787 | $10,387 |
|---|
12/31/2023 | $10,624 | $10,161 | $10,447 |
|---|
1/31/2024 | $10,725 | $10,134 | $10,513 |
|---|
2/29/2024 | $10,805 | $9,990 | $10,576 |
|---|
3/31/2024 | $10,890 | $10,083 | $10,636 |
|---|
4/30/2024 | $10,951 | $9,828 | $10,692 |
|---|
5/31/2024 | $11,037 | $9,995 | $10,753 |
|---|
6/30/2024 | $11,110 | $10,089 | $10,803 |
|---|
7/31/2024 | $11,177 | $10,325 | $10,859 |
|---|
8/31/2024 | $11,241 | $10,473 | $10,907 |
|---|
9/30/2024 | $11,325 | $10,613 | $10,962 |
|---|
10/31/2024 | $11,388 | $10,350 | $11,018 |
|---|
11/30/2024 | $11,458 | $10,460 | $11,067 |
|---|
12/31/2024 | $11,526 | $10,288 | $11,118 |
|---|
1/31/2025 | $11,608 | $10,343 | $11,167 |
|---|
2/28/2025 | $11,674 | $10,571 | $11,215 |
|---|
3/31/2025 | $11,676 | $10,575 | $11,256 |
|---|
4/30/2025 | $11,689 | $10,616 | $11,271 |
|---|
5/31/2025 | $11,783 | $10,540 | $11,334 |
|---|
6/30/2025 | $11,854 | $10,702 | $11,389 |
|---|
7/31/2025 | $11,915 | $10,674 | $11,449 |
|---|
|
|
| Average Annual Return [Table Text Block] |
AATR | 1 Year | Since Inception
5/4/23 |
|---|
Class R5 at NAV | 6.60% | 8.13% |
|---|
Bloomberg U.S. Floating Rate Notes Index | 5.43% | 6.22% |
|---|
Bloomberg U.S. Aggregate Bond Index | 3.38% | 2.95% |
|---|
|
|
| Performance Inception Date |
May 04, 2023
|
|
| No Deduction of Taxes [Text Block] |
The returns do not reflect the deduction of taxes that a shareholder would pay on Fund distributions or redemption of Fund shares.
|
|
| AssetsNet |
$ 2,696,811,591
|
|
| Holdings Count | Holding |
580
|
|
| Advisory Fees Paid, Amount |
$ 1,693,699
|
|
| InvestmentCompanyPortfolioTurnover |
119.00%
|
|
| Additional Fund Statistics [Text Block] |
Total Net Assets | $2,696,811,591 |
|---|
# of Portfolio Holdings | 580 |
|---|
Portfolio Turnover Rate | 119% |
|---|
Total Advisory Fees Paid | $1,693,699 |
|---|
|
|
| Holdings [Text Block] |
Portfolio Holdings Presented by Portfolio Allocation | %Footnote Reference* |
|---|
Asset-Backed Securities | 69.99% | Corporate Bonds | 6.76% | Floating Rate Loans | 8.13% | Foreign Government Obligations | 1.92% | Government Sponsored Enterprises Collateralized Mortgage Obligations | 1.19% | Government Sponsored Enterprises Pass-Throughs | 1.45% | Non-Agency Commercial Mortgage-Backed Securities | 4.21% | Options Purchased | 0.01% | U.S. Treasury Obligations | 4.16% | Repurchase Agreements | 2.15% | Money Market FundsFootnote Reference(a) | 0.03% | Time DepositsFootnote Reference(a) | 0.00%Footnote Reference** | Total | 100.00% |
| Footnote | Description | Footnote* | Represents percent of total investments, which excludes derivatives. | Footnote** | Amount is less than 0.01% | Footnote(a) | Securities were purchased with the cash collateral from loaned securities. |
|
|
| Material Fund Change [Text Block] |
There were no material fund changes during the period. |
|
| Summary of Change Legend [Text Block] |
There were no material fund changes during the period.
|
|
| C000241940 |
|
|
| Shareholder Report [Line Items] |
|
|
| Fund Name |
Lord Abbett Investment Grade Floating Rate Fund
|
|
| Class Name |
Class R6
|
|
| Trading Symbol |
LGRUX
|
|
| Annual or Semi-Annual Statement [Text Block] |
This annual shareholder report contains important information about the Lord Abbett Investment Grade Floating Rate Fund for the period of August 1, 2024 to July 31, 2025.
|
|
| Shareholder Report Annual or Semi-Annual |
Annual Shareholder Report
|
|
| Additional Information [Text Block] |
You can find additional information about the Fund at lordabbett.com/FundDocuments. You can also request this information by contacting us at 888-522-2388.
|
|
| Material Fund Change Notice [Text Block] |
This report describes changes to the Fund that occurred during the reporting period.
|
|
| Additional Information Phone Number |
888-522-2388
|
|
| Additional Information Website |
<span style="box-sizing: border-box; color: rgb(0, 0, 0); display: inline; flex-wrap: nowrap; font-size: 13.3333px; font-weight: 400; grid-area: auto; line-height: 20px; margin: 0px; overflow: visible; text-align: left; text-align-last: auto; white-space-collapse: preserve-breaks;">lordabbett.com/FundDocuments</span>
|
|
| Expenses [Text Block] |
What were the Fund costs for the last year?(based on a hypothetical $10,000 investment) Class Name | Costs of a $10,000 investment | Costs paid as a percentage of a $10,000 investment |
|---|
Class R6 | $30 | 0.29% |
|---|
|
|
| Expenses Paid, Amount |
$ 30
|
|
| Expense Ratio, Percent |
0.29%
|
|
| Factors Affecting Performance [Text Block] |
How did the Fund perform last year and what affected its performance?For the fiscal year ended July 31, 2025, the Fund returned 6.64%, reflecting performance at the net asset value (NAV) of Class R6 shares with all distributions reinvested, compared to a securities market index with investment characteristics similar to those of the Fund, the Bloomberg U.S. Floating Rate Notes Index, which returned 5.43% over the same period. The Fund's broad-based market index, the Bloomberg U.S. Aggregate Bond Index, returned 3.38% over the same period. U.S. fixed income markets have navigated a turbulent yet resilient path over the past several quarters, shaped by macroeconomic shifts, evolving monetary policy, and political developments. In the first half of the period, performance was mixed but ultimately constructive. Resilient macroeconomic data led to credit spreads reaching multi-year tights, though momentum faded amid growth concerns, tariff uncertainty, and skepticism around AI-driven expansion. This culminated in the April 2nd “Liberation Day” tariff announcement which triggered market volatility and sharp selloff of risk assets. Yet markets rebounded on trade policy concessions, as well as strong earnings, increased AI investment momentum, and consumer resilience. Top contributors to performance: The Fund’s allocation to collateralized loan obligations was the primary contributor to relative performance. An allocation to asset backed securities also contributed to relative performance. Top detractors from performance: The Fund’s allocation to investment grade corporate bonds detracted from relative performance. |
|
| Performance Past Does Not Indicate Future [Text] |
The Fund's past performance is no guarantee of future results.
|
|
| Line Graph [Table Text Block] |
| Class R6 | Bloomberg U.S. Aggregate Bond Index | Bloomberg U.S. Floating Rate Notes Index |
|---|
5/4/2023 | $10,000 | $10,000 | $10,000 |
|---|
5/31/2023 | $10,044 | $9,866 | $10,056 |
|---|
6/30/2023 | $10,136 | $9,831 | $10,116 |
|---|
7/31/2023 | $10,250 | $9,824 | $10,176 |
|---|
8/31/2023 | $10,327 | $9,761 | $10,230 |
|---|
9/30/2023 | $10,401 | $9,513 | $10,282 |
|---|
10/31/2023 | $10,439 | $9,363 | $10,331 |
|---|
11/30/2023 | $10,527 | $9,787 | $10,387 |
|---|
12/31/2023 | $10,629 | $10,161 | $10,447 |
|---|
1/31/2024 | $10,731 | $10,134 | $10,513 |
|---|
2/29/2024 | $10,812 | $9,990 | $10,576 |
|---|
3/31/2024 | $10,897 | $10,083 | $10,636 |
|---|
4/30/2024 | $10,959 | $9,828 | $10,692 |
|---|
5/31/2024 | $11,045 | $9,995 | $10,753 |
|---|
6/30/2024 | $11,119 | $10,089 | $10,803 |
|---|
7/31/2024 | $11,187 | $10,325 | $10,859 |
|---|
8/31/2024 | $11,251 | $10,473 | $10,907 |
|---|
9/30/2024 | $11,337 | $10,613 | $10,962 |
|---|
10/31/2024 | $11,400 | $10,350 | $11,018 |
|---|
11/30/2024 | $11,471 | $10,460 | $11,067 |
|---|
12/31/2024 | $11,539 | $10,288 | $11,118 |
|---|
1/31/2025 | $11,621 | $10,343 | $11,167 |
|---|
2/28/2025 | $11,688 | $10,571 | $11,215 |
|---|
3/31/2025 | $11,690 | $10,575 | $11,256 |
|---|
4/30/2025 | $11,704 | $10,616 | $11,271 |
|---|
5/31/2025 | $11,798 | $10,540 | $11,334 |
|---|
6/30/2025 | $11,869 | $10,702 | $11,389 |
|---|
7/31/2025 | $11,930 | $10,674 | $11,449 |
|---|
|
|
| Average Annual Return [Table Text Block] |
AATR | 1 Year | Since Inception
5/4/23 |
|---|
Class R6 at NAV | 6.64% | 8.19% |
|---|
Bloomberg U.S. Floating Rate Notes Index | 5.43% | 6.22% |
|---|
Bloomberg U.S. Aggregate Bond Index | 3.38% | 2.95% |
|---|
|
|
| Performance Inception Date |
May 04, 2023
|
|
| No Deduction of Taxes [Text Block] |
The returns do not reflect the deduction of taxes that a shareholder would pay on Fund distributions or redemption of Fund shares.
|
|
| AssetsNet |
$ 2,696,811,591
|
|
| Holdings Count | Holding |
580
|
|
| Advisory Fees Paid, Amount |
$ 1,693,699
|
|
| InvestmentCompanyPortfolioTurnover |
119.00%
|
|
| Additional Fund Statistics [Text Block] |
Total Net Assets | $2,696,811,591 |
|---|
# of Portfolio Holdings | 580 |
|---|
Portfolio Turnover Rate | 119% |
|---|
Total Advisory Fees Paid | $1,693,699 |
|---|
|
|
| Holdings [Text Block] |
Portfolio Holdings Presented by Portfolio Allocation | %Footnote Reference* |
|---|
Asset-Backed Securities | 69.99% | Corporate Bonds | 6.76% | Floating Rate Loans | 8.13% | Foreign Government Obligations | 1.92% | Government Sponsored Enterprises Collateralized Mortgage Obligations | 1.19% | Government Sponsored Enterprises Pass-Throughs | 1.45% | Non-Agency Commercial Mortgage-Backed Securities | 4.21% | Options Purchased | 0.01% | U.S. Treasury Obligations | 4.16% | Repurchase Agreements | 2.15% | Money Market FundsFootnote Reference(a) | 0.03% | Time DepositsFootnote Reference(a) | 0.00%Footnote Reference** | Total | 100.00% |
| Footnote | Description | Footnote* | Represents percent of total investments, which excludes derivatives. | Footnote** | Amount is less than 0.01% | Footnote(a) | Securities were purchased with the cash collateral from loaned securities. |
|
|
| Material Fund Change [Text Block] |
This is a summary of certain changes to the Fund that occurred during the reporting period, except as otherwise noted. For more information contact 888-522-2388. Expenses: As of December 1, 2024, the expense limitation on total net annual operating expenses increased from 0.28% to 0.34% as part of the annual review of transfer agency expenses. |
|
| Material Fund Change Expenses [Text Block] |
Expenses: As of December 1, 2024, the expense limitation on total net annual operating expenses increased from 0.28% to 0.34% as part of the annual review of transfer agency expenses.
|
|
| Summary of Change Legend [Text Block] |
This is a summary of certain changes to the Fund that occurred during the reporting period, except as otherwise noted. For more information contact 888-522-2388.
|
|
| Updated Prospectus Phone Number |
888-522-2388
|
|
| C000228428 |
|
|
| Shareholder Report [Line Items] |
|
|
| Fund Name |
Lord Abbett International Growth Fund
|
|
| Class Name |
Class A
|
|
| Trading Symbol |
LAAGX
|
|
| Annual or Semi-Annual Statement [Text Block] |
This annual shareholder report contains important information about the Lord Abbett International Growth Fund for the period of August 1, 2024 to July 31, 2025.
|
|
| Shareholder Report Annual or Semi-Annual |
Annual Shareholder Report
|
|
| Additional Information [Text Block] |
You can find additional information about the Fund at lordabbett.com/FundDocuments. You can also request this information by contacting us at 888-522-2388.
|
|
| Additional Information Phone Number |
888-522-2388
|
|
| Additional Information Website |
<span style="box-sizing: border-box; color: rgb(0, 0, 0); display: inline; flex-wrap: nowrap; font-size: 13.3333px; font-weight: 400; grid-area: auto; line-height: 20px; margin: 0px; overflow: visible; text-align: left; text-align-last: auto; white-space-collapse: preserve-breaks;">lordabbett.com/FundDocuments</span>
|
|
| Expenses [Text Block] |
What were the Fund costs for the last year?(based on a hypothetical $10,000 investment) Class Name | Costs of a $10,000 investment | Costs paid as a percentage of a $10,000 investment |
|---|
Class A | $101 | 0.95% |
|---|
|
|
| Expenses Paid, Amount |
$ 101
|
|
| Expense Ratio, Percent |
0.95%
|
|
| Factors Affecting Performance [Text Block] |
How did the Fund perform last year and what affected its performance?For the fiscal year ended July 31, 2025, the Fund returned 12.59%, reflecting performance at the net asset value (NAV) of Class A shares, with all distributions reinvested, compared to the 11.58% return of a securities market index with investment characteristics similar to those of the Fund, the MSCI All Country World ex USA Growth Index (Net). The Fund's broad-based securities market index, the MSCI EAFE Net Index, returned 12.77% over the same period. Positive factors for the markets included resilient economic data and corporate earnings, continued disinflation, and other factors, such as productivity gains from generative artificial intelligence. Negative factors included increased policy uncertainty during the period, including U.S. President Trump's “Liberation Day” announcement, which led to market volatility. Against this backdrop, U.S. equity markets delivered generally strong returns. Top contributors to performance: Security selection within the Industrials sector contributed to relative performance, led by an overweight allocation to Rheinmetall AG. Security selection within the Health Care sector also contributed to performance, led by an overweight allocation to Galderma Group AG. Top detractors from performance: Security selection within the Consumer Discretionary sector detracted from relative performance, led by an overweight allocation to Meituan. Security selection within the Information Technology sector also detracted from relative performance, led by an overweight allocation to Atlassian Corp. |
|
| Performance Past Does Not Indicate Future [Text] |
The Fund's past performance is no guarantee of future results.
|
|
| Line Graph [Table Text Block] |
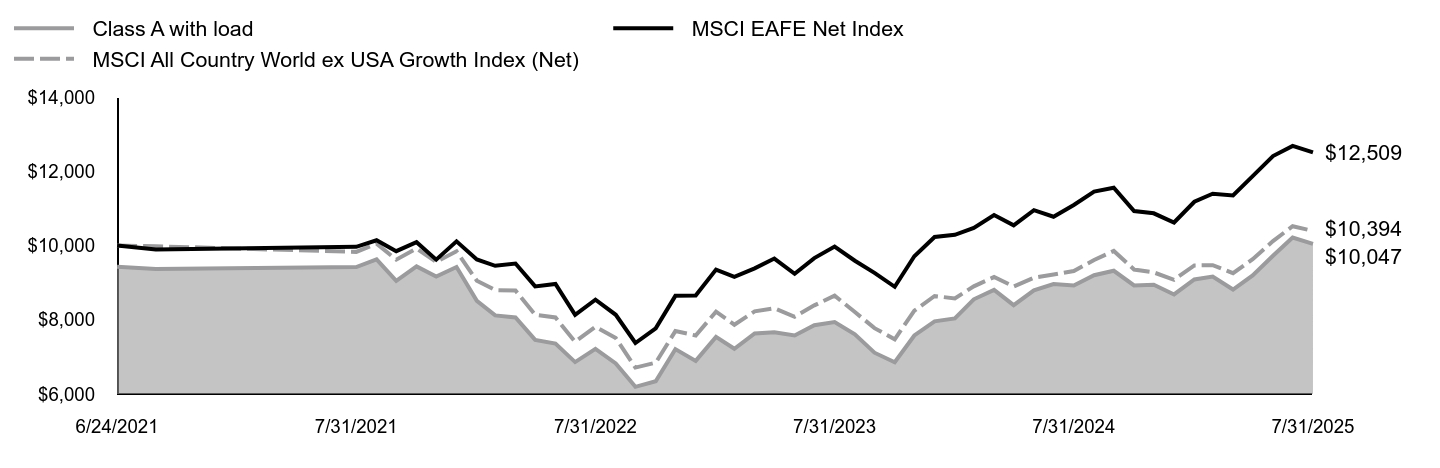 | Class A with load | MSCI EAFE Net Index | MSCI All Country World ex USA Growth Index (Net) |
|---|
6/24/2021 | $9,427 | $10,000 | $10,000 |
|---|
6/30/2021 | $9,371 | $9,893 | $9,981 |
|---|
7/31/2021 | $9,421 | $9,967 | $9,830 |
|---|
8/31/2021 | $9,626 | $10,143 | $10,052 |
|---|
9/30/2021 | $9,047 | $9,849 | $9,620 |
|---|
10/31/2021 | $9,439 | $10,091 | $9,918 |
|---|
11/30/2021 | $9,165 | $9,621 | $9,560 |
|---|
12/31/2021 | $9,421 | $10,114 | $9,847 |
|---|
1/31/2022 | $8,511 | $9,625 | $9,053 |
|---|
2/28/2022 | $8,118 | $9,455 | $8,801 |
|---|
3/31/2022 | $8,062 | $9,516 | $8,787 |
|---|
4/30/2022 | $7,458 | $8,900 | $8,133 |
|---|
5/31/2022 | $7,358 | $8,967 | $8,063 |
|---|
6/30/2022 | $6,860 | $8,135 | $7,406 |
|---|
7/31/2022 | $7,215 | $8,540 | $7,814 |
|---|
8/31/2022 | $6,822 | $8,135 | $7,509 |
|---|
9/30/2022 | $6,193 | $7,374 | $6,712 |
|---|
10/31/2022 | $6,343 | $7,770 | $6,844 |
|---|
11/30/2022 | $7,209 | $8,645 | $7,695 |
|---|
12/31/2022 | $6,893 | $8,652 | $7,577 |
|---|
1/31/2023 | $7,539 | $9,353 | $8,218 |
|---|
2/28/2023 | $7,219 | $9,158 | $7,867 |
|---|
3/31/2023 | $7,633 | $9,385 | $8,228 |
|---|
4/30/2023 | $7,665 | $9,650 | $8,312 |
|---|
5/31/2023 | $7,577 | $9,241 | $8,081 |
|---|
6/30/2023 | $7,853 | $9,662 | $8,388 |
|---|
7/31/2023 | $7,941 | $9,974 | $8,650 |
|---|
8/31/2023 | $7,608 | $9,592 | $8,209 |
|---|
9/30/2023 | $7,113 | $9,265 | $7,775 |
|---|
10/31/2023 | $6,856 | $8,889 | $7,473 |
|---|
11/30/2023 | $7,577 | $9,714 | $8,246 |
|---|
12/31/2023 | $7,959 | $10,230 | $8,641 |
|---|
1/31/2024 | $8,035 | $10,289 | $8,574 |
|---|
2/29/2024 | $8,552 | $10,477 | $8,902 |
|---|
3/31/2024 | $8,804 | $10,822 | $9,151 |
|---|
4/30/2024 | $8,394 | $10,545 | $8,898 |
|---|
5/31/2024 | $8,791 | $10,953 | $9,133 |
|---|
6/30/2024 | $8,962 | $10,777 | $9,218 |
|---|
7/31/2024 | $8,924 | $11,093 | $9,315 |
|---|
8/31/2024 | $9,201 | $11,453 | $9,611 |
|---|
9/30/2024 | $9,321 | $11,559 | $9,855 |
|---|
10/31/2024 | $8,924 | $10,931 | $9,354 |
|---|
11/30/2024 | $8,943 | $10,869 | $9,277 |
|---|
12/31/2024 | $8,683 | $10,621 | $9,078 |
|---|
1/31/2025 | $9,087 | $11,180 | $9,465 |
|---|
2/28/2025 | $9,163 | $11,396 | $9,472 |
|---|
3/31/2025 | $8,816 | $11,350 | $9,257 |
|---|
4/30/2025 | $9,195 | $11,870 | $9,634 |
|---|
5/31/2025 | $9,725 | $12,413 | $10,120 |
|---|
6/30/2025 | $10,218 | $12,687 | $10,521 |
|---|
7/31/2025 | $10,047 | $12,509 | $10,394 |
|---|
|
|
| Average Annual Return [Table Text Block] |
AATR | 1 Year | Since Inception
6/24/21 |
|---|
Class A at NAV | 12.59% | 1.57% |
|---|
Class A with sales charge | 6.14% | 0.12% |
|---|
MSCI All Country World ex USA Growth Index (Net) | 11.58% | 0.95% |
|---|
MSCI EAFE Net Index | 12.77% | 5.61% |
|---|
|
|
| Performance Inception Date |
Jun. 24, 2021
|
|
| No Deduction of Taxes [Text Block] |
The returns do not reflect the deduction of taxes that a shareholder would pay on Fund distributions or redemption of Fund shares.
|
|
| AssetsNet |
$ 3,553,729
|
|
| Holdings Count | Holding |
79
|
|
| Advisory Fees Paid, Amount |
$ 0
|
|
| InvestmentCompanyPortfolioTurnover |
125.00%
|
|
| Additional Fund Statistics [Text Block] |
Total Net Assets | $3,553,729 |
|---|
# of Portfolio Holdings | 79 |
|---|
Portfolio Turnover Rate | 125% |
|---|
Total Advisory Fees Paid | $0 |
|---|
|
|
| Holdings [Text Block] |
Portfolio Holdings Presented by SectorFootnote Reference* | % Footnote Reference** |
|---|
Communication Services | 12.12% | Consumer Discretionary | 9.50% | Consumer Staples | 5.53% | Financials | 9.65% | Health Care | 11.65% | Industrials | 25.93% | Information Technology | 20.76% | Materials | 4.86% | Total | 100.00% |
| Footnote | Description | Footnote* | A sector may comprise several industries. | Footnote** | Represents percent of total investments, which excludes derivatives. |
|
|
| Material Fund Change [Text Block] |
There were no material fund changes during the period. |
|
| Summary of Change Legend [Text Block] |
There were no material fund changes during the period.
|
|
| C000228432 |
|
|
| Shareholder Report [Line Items] |
|
|
| Fund Name |
Lord Abbett International Growth Fund
|
|
| Class Name |
Class C
|
|
| Trading Symbol |
LCAGX
|
|
| Annual or Semi-Annual Statement [Text Block] |
This annual shareholder report contains important information about the Lord Abbett International Growth Fund for the period of August 1, 2024 to July 31, 2025.
|
|
| Shareholder Report Annual or Semi-Annual |
Annual Shareholder Report
|
|
| Additional Information [Text Block] |
You can find additional information about the Fund at lordabbett.com/FundDocuments. You can also request this information by contacting us at 888-522-2388.
|
|
| Additional Information Phone Number |
888-522-2388
|
|
| Additional Information Website |
<span style="box-sizing: border-box; color: rgb(0, 0, 0); display: inline; flex-wrap: nowrap; font-size: 13.3333px; font-weight: 400; grid-area: auto; line-height: 20px; margin: 0px; overflow: visible; text-align: left; text-align-last: auto; white-space-collapse: preserve-breaks;">lordabbett.com/FundDocuments</span>
|
|
| Expenses [Text Block] |
What were the Fund costs for the last year?(based on a hypothetical $10,000 investment) Class Name | Costs of a $10,000 investment | Costs paid as a percentage of a $10,000 investment |
|---|
Class C | $180 | 1.70% |
|---|
|
|
| Expenses Paid, Amount |
$ 180
|
|
| Expense Ratio, Percent |
1.70%
|
|
| Factors Affecting Performance [Text Block] |
How did the Fund perform last year and what affected its performance?For the fiscal year ended July 31, 2025, the Fund returned 11.79%, reflecting performance at the net asset value (NAV) of Class C shares, with all distributions reinvested, compared to the 11.58% return of a securities market index with investment characteristics similar to those of the Fund, the MSCI All Country World ex USA Growth Index (Net). The Fund's broad-based securities market index, the MSCI EAFE Net Index, returned 12.77% over the same period. Positive factors for the markets included resilient economic data and corporate earnings, continued disinflation, and other factors, such as productivity gains from generative artificial intelligence. Negative factors included increased policy uncertainty during the period, including U.S. President Trump's “Liberation Day” announcement, which led to market volatility. Against this backdrop, U.S. equity markets delivered generally strong returns. Top contributors to performance: Security selection within the Industrials sector contributed to relative performance, led by an overweight allocation to Rheinmetall AG. Security selection within the Health Care sector also contributed to performance, led by an overweight allocation to Galderma Group AG. Top detractors from performance: Security selection within the Consumer Discretionary sector detracted from relative performance, led by an overweight allocation to Meituan. Security selection within the Information Technology sector also detracted from relative performance, led by an overweight allocation to Atlassian Corp. |
|
| Performance Past Does Not Indicate Future [Text] |
The Fund's past performance is no guarantee of future results.
|
|
| Line Graph [Table Text Block] |
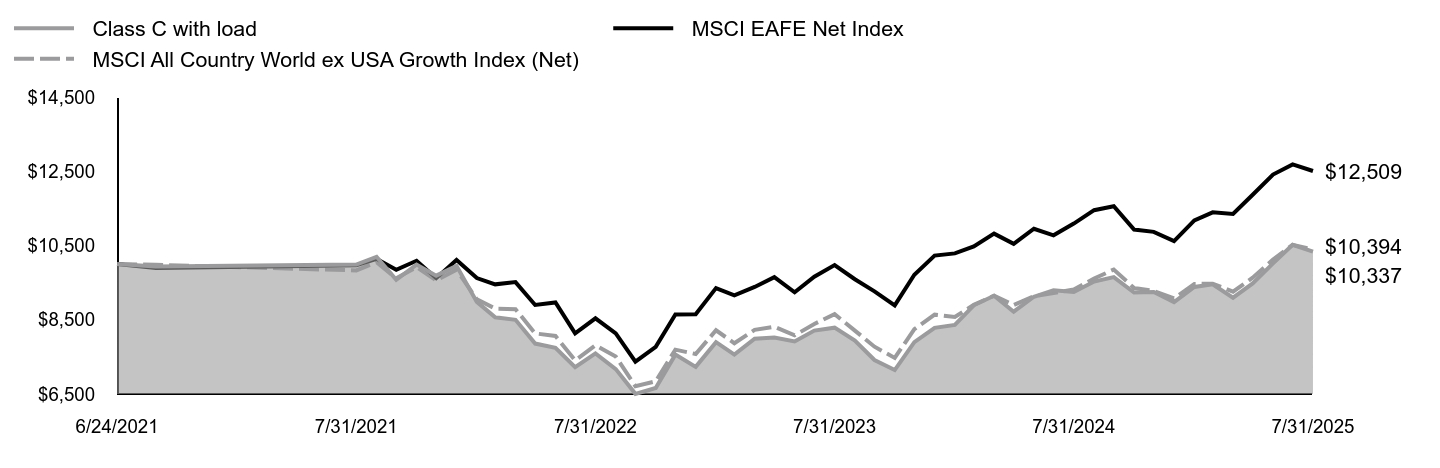 | Class C with load | MSCI EAFE Net Index | MSCI All Country World ex USA Growth Index (Net) |
|---|
6/24/2021 | $10,000 | $10,000 | $10,000 |
|---|
6/30/2021 | $9,934 | $9,893 | $9,981 |
|---|
7/31/2021 | $9,987 | $9,967 | $9,830 |
|---|
8/31/2021 | $10,198 | $10,143 | $10,052 |
|---|
9/30/2021 | $9,577 | $9,849 | $9,620 |
|---|
10/31/2021 | $9,987 | $10,091 | $9,918 |
|---|
11/30/2021 | $9,689 | $9,621 | $9,560 |
|---|
12/31/2021 | $9,954 | $10,114 | $9,847 |
|---|
1/31/2022 | $8,982 | $9,625 | $9,053 |
|---|
2/28/2022 | $8,566 | $9,455 | $8,801 |
|---|
3/31/2022 | $8,500 | $9,516 | $8,787 |
|---|
4/30/2022 | $7,859 | $8,900 | $8,133 |
|---|
5/31/2022 | $7,746 | $8,967 | $8,063 |
|---|
6/30/2022 | $7,224 | $8,135 | $7,406 |
|---|
7/31/2022 | $7,594 | $8,540 | $7,814 |
|---|
8/31/2022 | $7,171 | $8,135 | $7,509 |
|---|
9/30/2022 | $6,504 | $7,374 | $6,712 |
|---|
10/31/2022 | $6,662 | $7,770 | $6,844 |
|---|
11/30/2022 | $7,561 | $8,645 | $7,695 |
|---|
12/31/2022 | $7,231 | $8,652 | $7,577 |
|---|
1/31/2023 | $7,898 | $9,353 | $8,218 |
|---|
2/28/2023 | $7,561 | $9,158 | $7,867 |
|---|
3/31/2023 | $7,991 | $9,385 | $8,228 |
|---|
4/30/2023 | $8,024 | $9,650 | $8,312 |
|---|
5/31/2023 | $7,918 | $9,241 | $8,081 |
|---|
6/30/2023 | $8,209 | $9,662 | $8,388 |
|---|
7/31/2023 | $8,288 | $9,974 | $8,650 |
|---|
8/31/2023 | $7,938 | $9,592 | $8,209 |
|---|
9/30/2023 | $7,416 | $9,265 | $7,775 |
|---|
10/31/2023 | $7,145 | $8,889 | $7,473 |
|---|
11/30/2023 | $7,898 | $9,714 | $8,246 |
|---|
12/31/2023 | $8,282 | $10,230 | $8,641 |
|---|
1/31/2024 | $8,361 | $10,289 | $8,574 |
|---|
2/29/2024 | $8,890 | $10,477 | $8,902 |
|---|
3/31/2024 | $9,147 | $10,822 | $9,151 |
|---|
4/30/2024 | $8,718 | $10,545 | $8,898 |
|---|
5/31/2024 | $9,121 | $10,953 | $9,133 |
|---|
6/30/2024 | $9,293 | $10,777 | $9,218 |
|---|
7/31/2024 | $9,247 | $11,093 | $9,315 |
|---|
8/31/2024 | $9,531 | $11,453 | $9,611 |
|---|
9/30/2024 | $9,650 | $11,559 | $9,855 |
|---|
10/31/2024 | $9,233 | $10,931 | $9,354 |
|---|
11/30/2024 | $9,247 | $10,869 | $9,277 |
|---|
12/31/2024 | $8,976 | $10,621 | $9,078 |
|---|
1/31/2025 | $9,385 | $11,180 | $9,465 |
|---|
2/28/2025 | $9,458 | $11,396 | $9,472 |
|---|
3/31/2025 | $9,095 | $11,350 | $9,257 |
|---|
4/30/2025 | $9,478 | $11,870 | $9,634 |
|---|
5/31/2025 | $10,020 | $12,413 | $10,120 |
|---|
6/30/2025 | $10,522 | $12,687 | $10,521 |
|---|
7/31/2025 | $10,337 | $12,509 | $10,394 |
|---|
|
|
| Average Annual Return [Table Text Block] |
AATR | 1 Year | Since Inception
6/24/21 |
|---|
Class C at NAV | 11.79% | 0.81% |
|---|
Class C with sales charge | 10.79% | 0.81% |
|---|
MSCI All Country World ex USA Growth Index (Net) | 11.58% | 0.95% |
|---|
MSCI EAFE Net Index | 12.77% | 5.61% |
|---|
|
|
| Performance Inception Date |
Jun. 24, 2021
|
|
| No Deduction of Taxes [Text Block] |
The returns do not reflect the deduction of taxes that a shareholder would pay on Fund distributions or redemption of Fund shares.
|
|
| AssetsNet |
$ 3,553,729
|
|
| Holdings Count | Holding |
79
|
|
| Advisory Fees Paid, Amount |
$ 0
|
|
| InvestmentCompanyPortfolioTurnover |
125.00%
|
|
| Additional Fund Statistics [Text Block] |
Total Net Assets | $3,553,729 |
|---|
# of Portfolio Holdings | 79 |
|---|
Portfolio Turnover Rate | 125% |
|---|
Total Advisory Fees Paid | $0 |
|---|
|
|
| Holdings [Text Block] |
Portfolio Holdings Presented by SectorFootnote Reference* | % Footnote Reference** |
|---|
Communication Services | 12.12% | Consumer Discretionary | 9.50% | Consumer Staples | 5.53% | Financials | 9.65% | Health Care | 11.65% | Industrials | 25.93% | Information Technology | 20.76% | Materials | 4.86% | Total | 100.00% |
| Footnote | Description | Footnote* | A sector may comprise several industries. | Footnote** | Represents percent of total investments, which excludes derivatives. |
|
|
| Material Fund Change [Text Block] |
There were no material fund changes during the period. |
|
| Summary of Change Legend [Text Block] |
There were no material fund changes during the period.
|
|
| C000228431 |
|
|
| Shareholder Report [Line Items] |
|
|
| Fund Name |
Lord Abbett International Growth Fund
|
|
| Class Name |
Class F
|
|
| Trading Symbol |
LAFGX
|
|
| Annual or Semi-Annual Statement [Text Block] |
This annual shareholder report contains important information about the Lord Abbett International Growth Fund for the period of August 1, 2024 to July 31, 2025.
|
|
| Shareholder Report Annual or Semi-Annual |
Annual Shareholder Report
|
|
| Additional Information [Text Block] |
You can find additional information about the Fund at lordabbett.com/FundDocuments. You can also request this information by contacting us at 888-522-2388.
|
|
| Additional Information Phone Number |
888-522-2388
|
|
| Additional Information Website |
<span style="box-sizing: border-box; color: rgb(0, 0, 0); display: inline; flex-wrap: nowrap; font-size: 13.3333px; font-weight: 400; grid-area: auto; line-height: 20px; margin: 0px; overflow: visible; text-align: left; text-align-last: auto; white-space-collapse: preserve-breaks;">lordabbett.com/FundDocuments</span>
|
|
| Expenses [Text Block] |
What were the Fund costs for the last year?(based on a hypothetical $10,000 investment) Class Name | Costs of a $10,000 investment | Costs paid as a percentage of a $10,000 investment |
|---|
Class F | $75 | 0.70% |
|---|
|
|
| Expenses Paid, Amount |
$ 75
|
|
| Expense Ratio, Percent |
0.70%
|
|
| Factors Affecting Performance [Text Block] |
How did the Fund perform last year and what affected its performance?For the fiscal year ended July 31, 2025, the Fund returned 12.91%, reflecting performance at the net asset value (NAV) of Class F shares, with all distributions reinvested, compared to the 11.58% return of a securities market index with investment characteristics similar to those of the Fund, the MSCI All Country World ex USA Growth Index (Net). The Fund's broad-based securities market index, the MSCI EAFE Net Index, returned 12.77% over the same period. Positive factors for the markets included resilient economic data and corporate earnings, continued disinflation, and other factors, such as productivity gains from generative artificial intelligence. Negative factors included increased policy uncertainty during the period, including U.S. President Trump's “Liberation Day” announcement, which led to market volatility. Against this backdrop, U.S. equity markets delivered generally strong returns. Top contributors to performance: Security selection within the Industrials sector contributed to relative performance, led by an overweight allocation to Rheinmetall AG. Security selection within the Health Care sector also contributed to performance, led by an overweight allocation to Galderma Group AG. Top detractors from performance: Security selection within the Consumer Discretionary sector detracted from relative performance, led by an overweight allocation to Meituan. Security selection within the Information Technology sector also detracted from relative performance, led by an overweight allocation to Atlassian Corp. |
|
| Performance Past Does Not Indicate Future [Text] |
The Fund's past performance is no guarantee of future results.
|
|
| Line Graph [Table Text Block] |
 | Class F | MSCI EAFE Net Index | MSCI All Country World ex USA Growth Index (Net) |
|---|
6/24/2021 | $10,000 | $10,000 | $10,000 |
|---|
6/30/2021 | $9,941 | $9,893 | $9,981 |
|---|
7/31/2021 | $10,000 | $9,967 | $9,830 |
|---|
8/31/2021 | $10,218 | $10,143 | $10,052 |
|---|
9/30/2021 | $9,603 | $9,849 | $9,620 |
|---|
10/31/2021 | $10,020 | $10,091 | $9,918 |
|---|
11/30/2021 | $9,736 | $9,621 | $9,560 |
|---|
12/31/2021 | $10,007 | $10,114 | $9,847 |
|---|
1/31/2022 | $9,042 | $9,625 | $9,053 |
|---|
2/28/2022 | $8,625 | $9,455 | $8,801 |
|---|
3/31/2022 | $8,566 | $9,516 | $8,787 |
|---|
4/30/2022 | $7,925 | $8,900 | $8,133 |
|---|
5/31/2022 | $7,819 | $8,967 | $8,063 |
|---|
6/30/2022 | $7,297 | $8,135 | $7,406 |
|---|
7/31/2022 | $7,673 | $8,540 | $7,814 |
|---|
8/31/2022 | $7,257 | $8,135 | $7,509 |
|---|
9/30/2022 | $6,590 | $7,374 | $6,712 |
|---|
10/31/2022 | $6,748 | $7,770 | $6,844 |
|---|
11/30/2022 | $7,673 | $8,645 | $7,695 |
|---|
12/31/2022 | $7,341 | $8,652 | $7,577 |
|---|
1/31/2023 | $8,027 | $9,353 | $8,218 |
|---|
2/28/2023 | $7,687 | $9,158 | $7,867 |
|---|
3/31/2023 | $8,133 | $9,385 | $8,228 |
|---|
4/30/2023 | $8,173 | $9,650 | $8,312 |
|---|
5/31/2023 | $8,073 | $9,241 | $8,081 |
|---|
6/30/2023 | $8,373 | $9,662 | $8,388 |
|---|
7/31/2023 | $8,466 | $9,974 | $8,650 |
|---|
8/31/2023 | $8,113 | $9,592 | $8,209 |
|---|
9/30/2023 | $7,587 | $9,265 | $7,775 |
|---|
10/31/2023 | $7,314 | $8,889 | $7,473 |
|---|
11/30/2023 | $8,087 | $9,714 | $8,246 |
|---|
12/31/2023 | $8,498 | $10,230 | $8,641 |
|---|
1/31/2024 | $8,579 | $10,289 | $8,574 |
|---|
2/29/2024 | $9,128 | $10,477 | $8,902 |
|---|
3/31/2024 | $9,403 | $10,822 | $9,151 |
|---|
4/30/2024 | $8,967 | $10,545 | $8,898 |
|---|
5/31/2024 | $9,396 | $10,953 | $9,133 |
|---|
6/30/2024 | $9,577 | $10,777 | $9,218 |
|---|
7/31/2024 | $9,537 | $11,093 | $9,315 |
|---|
8/31/2024 | $9,839 | $11,453 | $9,611 |
|---|
9/30/2024 | $9,966 | $11,559 | $9,855 |
|---|
10/31/2024 | $9,544 | $10,931 | $9,354 |
|---|
11/30/2024 | $9,571 | $10,869 | $9,277 |
|---|
12/31/2024 | $9,296 | $10,621 | $9,078 |
|---|
1/31/2025 | $9,726 | $11,180 | $9,465 |
|---|
2/28/2025 | $9,807 | $11,396 | $9,472 |
|---|
3/31/2025 | $9,444 | $11,350 | $9,257 |
|---|
4/30/2025 | $9,847 | $11,870 | $9,634 |
|---|
5/31/2025 | $10,419 | $12,413 | $10,120 |
|---|
6/30/2025 | $10,950 | $12,687 | $10,521 |
|---|
7/31/2025 | $10,769 | $12,509 | $10,394 |
|---|
|
|
| Average Annual Return [Table Text Block] |
AATR | 1 Year | Since Inception
6/24/21 |
|---|
Class F at NAV | 12.91% | 1.82% |
|---|
MSCI All Country World ex USA Growth Index (Net) | 11.58% | 0.95% |
|---|
MSCI EAFE Net Index | 12.77% | 5.61% |
|---|
|
|
| Performance Inception Date |
Jun. 24, 2021
|
|
| No Deduction of Taxes [Text Block] |
The returns do not reflect the deduction of taxes that a shareholder would pay on Fund distributions or redemption of Fund shares.
|
|
| AssetsNet |
$ 3,553,729
|
|
| Holdings Count | Holding |
79
|
|
| Advisory Fees Paid, Amount |
$ 0
|
|
| InvestmentCompanyPortfolioTurnover |
125.00%
|
|
| Additional Fund Statistics [Text Block] |
Total Net Assets | $3,553,729 |
|---|
# of Portfolio Holdings | 79 |
|---|
Portfolio Turnover Rate | 125% |
|---|
Total Advisory Fees Paid | $0 |
|---|
|
|
| Holdings [Text Block] |
Portfolio Holdings Presented by SectorFootnote Reference* | % Footnote Reference** |
|---|
Communication Services | 12.12% | Consumer Discretionary | 9.50% | Consumer Staples | 5.53% | Financials | 9.65% | Health Care | 11.65% | Industrials | 25.93% | Information Technology | 20.76% | Materials | 4.86% | Total | 100.00% |
| Footnote | Description | Footnote* | A sector may comprise several industries. | Footnote** | Represents percent of total investments, which excludes derivatives. |
|
|
| Material Fund Change [Text Block] |
There were no material fund changes during the period. |
|
| Summary of Change Legend [Text Block] |
There were no material fund changes during the period.
|
|
| C000228430 |
|
|
| Shareholder Report [Line Items] |
|
|
| Fund Name |
Lord Abbett International Growth Fund
|
|
| Class Name |
Class F3
|
|
| Trading Symbol |
LOAGX
|
|
| Annual or Semi-Annual Statement [Text Block] |
This annual shareholder report contains important information about the Lord Abbett International Growth Fund for the period of August 1, 2024 to July 31, 2025.
|
|
| Shareholder Report Annual or Semi-Annual |
Annual Shareholder Report
|
|
| Additional Information [Text Block] |
You can find additional information about the Fund at lordabbett.com/FundDocuments. You can also request this information by contacting us at 888-522-2388.
|
|
| Additional Information Phone Number |
888-522-2388
|
|
| Additional Information Website |
<span style="box-sizing: border-box; color: rgb(0, 0, 0); display: inline; flex-wrap: nowrap; font-size: 13.3333px; font-weight: 400; grid-area: auto; line-height: 20px; margin: 0px; overflow: visible; text-align: left; text-align-last: auto; white-space-collapse: preserve-breaks;">lordabbett.com/FundDocuments</span>
|
|
| Expenses [Text Block] |
What were the Fund costs for the last year?(based on a hypothetical $10,000 investment) Class Name | Costs of a $10,000 investment | Costs paid as a percentage of a $10,000 investment |
|---|
Class F3 | $70 | 0.66% |
|---|
|
|
| Expenses Paid, Amount |
$ 70
|
|
| Expense Ratio, Percent |
0.66%
|
|
| Factors Affecting Performance [Text Block] |
How did the Fund perform last year and what affected its performance?For the fiscal year ended July 31, 2025, the Fund returned 12.95%, reflecting performance at the net asset value (NAV) of Class F3 shares, with all distributions reinvested, compared to the 11.58% return of a securities market index with investment characteristics similar to those of the Fund, the MSCI All Country World ex USA Growth Index (Net). The Fund's broad-based securities market index, the MSCI EAFE Net Index, returned 12.77% over the same period. Positive factors for the markets included resilient economic data and corporate earnings, continued disinflation, and other factors, such as productivity gains from generative artificial intelligence. Negative factors included increased policy uncertainty during the period, including U.S. President Trump's “Liberation Day” announcement, which led to market volatility. Against this backdrop, U.S. equity markets delivered generally strong returns. Top contributors to performance: Security selection within the Industrials sector contributed to relative performance, led by an overweight allocation to Rheinmetall AG. Security selection within the Health Care sector also contributed to performance, led by an overweight allocation to Galderma Group AG. Top detractors from performance: Security selection within the Consumer Discretionary sector detracted from relative performance, led by an overweight allocation to Meituan. Security selection within the Information Technology sector also detracted from relative performance, led by an overweight allocation to Atlassian Corp. |
|
| Performance Past Does Not Indicate Future [Text] |
The Fund's past performance is no guarantee of future results.
|
|
| Line Graph [Table Text Block] |
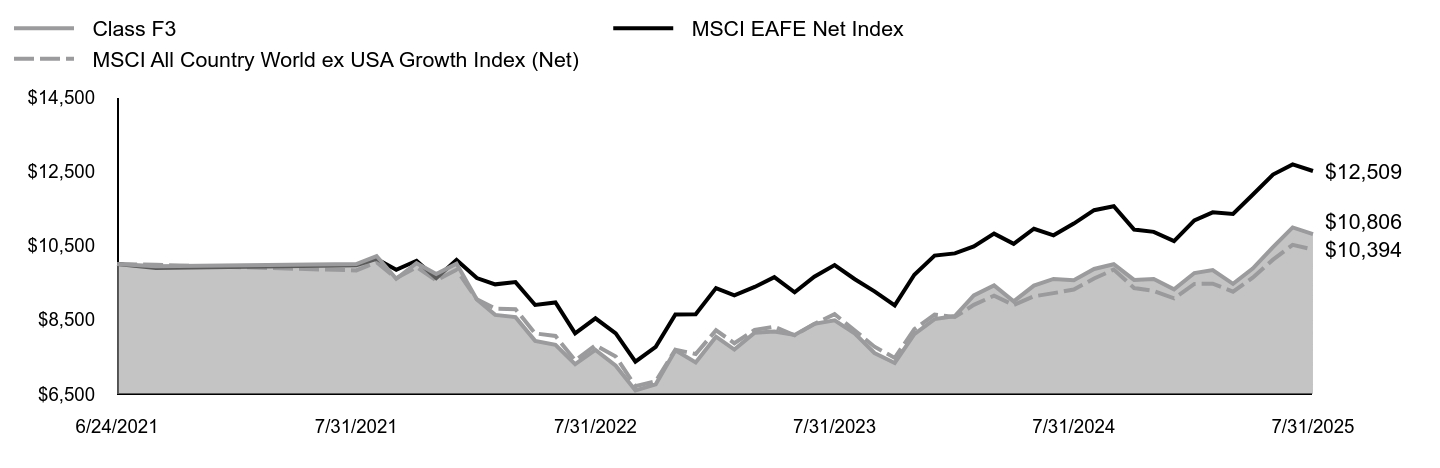 | Class F3 | MSCI EAFE Net Index | MSCI All Country World ex USA Growth Index (Net) |
|---|
6/24/2021 | $10,000 | $10,000 | $10,000 |
|---|
6/30/2021 | $9,941 | $9,893 | $9,981 |
|---|
7/31/2021 | $10,000 | $9,967 | $9,830 |
|---|
8/31/2021 | $10,218 | $10,143 | $10,052 |
|---|
9/30/2021 | $9,603 | $9,849 | $9,620 |
|---|
10/31/2021 | $10,026 | $10,091 | $9,918 |
|---|
11/30/2021 | $9,736 | $9,621 | $9,560 |
|---|
12/31/2021 | $10,013 | $10,114 | $9,847 |
|---|
1/31/2022 | $9,048 | $9,625 | $9,053 |
|---|
2/28/2022 | $8,632 | $9,455 | $8,801 |
|---|
3/31/2022 | $8,572 | $9,516 | $8,787 |
|---|
4/30/2022 | $7,931 | $8,900 | $8,133 |
|---|
5/31/2022 | $7,826 | $8,967 | $8,063 |
|---|
6/30/2022 | $7,303 | $8,135 | $7,406 |
|---|
7/31/2022 | $7,687 | $8,540 | $7,814 |
|---|
8/31/2022 | $7,264 | $8,135 | $7,509 |
|---|
9/30/2022 | $6,596 | $7,374 | $6,712 |
|---|
10/31/2022 | $6,761 | $7,770 | $6,844 |
|---|
11/30/2022 | $7,680 | $8,645 | $7,695 |
|---|
12/31/2022 | $7,350 | $8,652 | $7,577 |
|---|
1/31/2023 | $8,044 | $9,353 | $8,218 |
|---|
2/28/2023 | $7,697 | $9,158 | $7,867 |
|---|
3/31/2023 | $8,151 | $9,385 | $8,228 |
|---|
4/30/2023 | $8,184 | $9,650 | $8,312 |
|---|
5/31/2023 | $8,091 | $9,241 | $8,081 |
|---|
6/30/2023 | $8,391 | $9,662 | $8,388 |
|---|
7/31/2023 | $8,484 | $9,974 | $8,650 |
|---|
8/31/2023 | $8,131 | $9,592 | $8,209 |
|---|
9/30/2023 | $7,604 | $9,265 | $7,775 |
|---|
10/31/2023 | $7,337 | $8,889 | $7,473 |
|---|
11/30/2023 | $8,111 | $9,714 | $8,246 |
|---|
12/31/2023 | $8,519 | $10,230 | $8,641 |
|---|
1/31/2024 | $8,600 | $10,289 | $8,574 |
|---|
2/29/2024 | $9,158 | $10,477 | $8,902 |
|---|
3/31/2024 | $9,426 | $10,822 | $9,151 |
|---|
4/30/2024 | $8,996 | $10,545 | $8,898 |
|---|
5/31/2024 | $9,420 | $10,953 | $9,133 |
|---|
6/30/2024 | $9,601 | $10,777 | $9,218 |
|---|
7/31/2024 | $9,567 | $11,093 | $9,315 |
|---|
8/31/2024 | $9,870 | $11,453 | $9,611 |
|---|
9/30/2024 | $9,997 | $11,559 | $9,855 |
|---|
10/31/2024 | $9,574 | $10,931 | $9,354 |
|---|
11/30/2024 | $9,601 | $10,869 | $9,277 |
|---|
12/31/2024 | $9,321 | $10,621 | $9,078 |
|---|
1/31/2025 | $9,760 | $11,180 | $9,465 |
|---|
2/28/2025 | $9,841 | $11,396 | $9,472 |
|---|
3/31/2025 | $9,470 | $11,350 | $9,257 |
|---|
4/30/2025 | $9,881 | $11,870 | $9,634 |
|---|
5/31/2025 | $10,455 | $12,413 | $10,120 |
|---|
6/30/2025 | $10,988 | $12,687 | $10,521 |
|---|
7/31/2025 | $10,806 | $12,509 | $10,394 |
|---|
|
|
| Average Annual Return [Table Text Block] |
AATR | 1 Year | Since Inception
6/24/21 |
|---|
Class F3 at NAV | 12.95% | 1.91% |
|---|
MSCI All Country World ex USA Growth Index (Net) | 11.58% | 0.95% |
|---|
MSCI EAFE Net Index | 12.77% | 5.61% |
|---|
|
|
| Performance Inception Date |
Jun. 24, 2021
|
|
| No Deduction of Taxes [Text Block] |
The returns do not reflect the deduction of taxes that a shareholder would pay on Fund distributions or redemption of Fund shares.
|
|
| AssetsNet |
$ 3,553,729
|
|
| Holdings Count | Holding |
79
|
|
| Advisory Fees Paid, Amount |
$ 0
|
|
| InvestmentCompanyPortfolioTurnover |
125.00%
|
|
| Additional Fund Statistics [Text Block] |
Total Net Assets | $3,553,729 |
|---|
# of Portfolio Holdings | 79 |
|---|
Portfolio Turnover Rate | 125% |
|---|
Total Advisory Fees Paid | $0 |
|---|
|
|
| Holdings [Text Block] |
Portfolio Holdings Presented by SectorFootnote Reference* | % Footnote Reference** |
|---|
Communication Services | 12.12% | Consumer Discretionary | 9.50% | Consumer Staples | 5.53% | Financials | 9.65% | Health Care | 11.65% | Industrials | 25.93% | Information Technology | 20.76% | Materials | 4.86% | Total | 100.00% |
| Footnote | Description | Footnote* | A sector may comprise several industries. | Footnote** | Represents percent of total investments, which excludes derivatives. |
|
|
| Material Fund Change [Text Block] |
There were no material fund changes during the period. |
|
| Summary of Change Legend [Text Block] |
There were no material fund changes during the period.
|
|
| C000228429 |
|
|
| Shareholder Report [Line Items] |
|
|
| Fund Name |
Lord Abbett International Growth Fund
|
|
| Class Name |
Class I
|
|
| Trading Symbol |
LIAGX
|
|
| Annual or Semi-Annual Statement [Text Block] |
This annual shareholder report contains important information about the Lord Abbett International Growth Fund for the period of August 1, 2024 to July 31, 2025.
|
|
| Shareholder Report Annual or Semi-Annual |
Annual Shareholder Report
|
|
| Additional Information [Text Block] |
You can find additional information about the Fund at lordabbett.com/FundDocuments. You can also request this information by contacting us at 888-522-2388.
|
|
| Additional Information Phone Number |
888-522-2388
|
|
| Additional Information Website |
<span style="box-sizing: border-box; color: rgb(0, 0, 0); display: inline; flex-wrap: nowrap; font-size: 13.3333px; font-weight: 400; grid-area: auto; line-height: 20px; margin: 0px; overflow: visible; text-align: left; text-align-last: auto; white-space-collapse: preserve-breaks;">lordabbett.com/FundDocuments</span>
|
|
| Expenses [Text Block] |
What were the Fund costs for the last year?(based on a hypothetical $10,000 investment) Class Name | Costs of a $10,000 investment | Costs paid as a percentage of a $10,000 investment |
|---|
Class I | $73 | 0.69% |
|---|
|
|
| Expenses Paid, Amount |
$ 73
|
|
| Expense Ratio, Percent |
0.69%
|
|
| Factors Affecting Performance [Text Block] |
How did the Fund perform last year and what affected its performance?For the fiscal year ended July 31, 2025, the Fund returned 12.98%, reflecting performance at the net asset value (NAV) of Class I shares, with all distributions reinvested, compared to the 11.58% return of a securities market index with investment characteristics similar to those of the Fund, the MSCI All Country World ex USA Growth Index (Net). The Fund's broad-based securities market index, the MSCI EAFE Net Index, returned 12.77% over the same period. Positive factors for the markets included resilient economic data and corporate earnings, continued disinflation, and other factors, such as productivity gains from generative artificial intelligence. Negative factors included increased policy uncertainty during the period, including U.S. President Trump's “Liberation Day” announcement, which led to market volatility. Against this backdrop, U.S. equity markets delivered generally strong returns. Top contributors to performance: Security selection within the Industrials sector contributed to relative performance, led by an overweight allocation to Rheinmetall AG. Security selection within the Health Care sector also contributed to performance, led by an overweight allocation to Galderma Group AG. Top detractors from performance: Security selection within the Consumer Discretionary sector detracted from relative performance, led by an overweight allocation to Meituan. Security selection within the Information Technology sector also detracted from relative performance, led by an overweight allocation to Atlassian Corp. |
|
| Performance Past Does Not Indicate Future [Text] |
The Fund's past performance is no guarantee of future results.
|
|
| Line Graph [Table Text Block] |
 | Class I | MSCI EAFE Net Index | MSCI All Country World ex USA Growth Index (Net) |
|---|
6/24/2021 | $10,000 | $10,000 | $10,000 |
|---|
6/30/2021 | $9,941 | $9,893 | $9,981 |
|---|
7/31/2021 | $10,000 | $9,967 | $9,830 |
|---|
8/31/2021 | $10,218 | $10,143 | $10,052 |
|---|
9/30/2021 | $9,603 | $9,849 | $9,620 |
|---|
10/31/2021 | $10,020 | $10,091 | $9,918 |
|---|
11/30/2021 | $9,736 | $9,621 | $9,560 |
|---|
12/31/2021 | $10,007 | $10,114 | $9,847 |
|---|
1/31/2022 | $9,042 | $9,625 | $9,053 |
|---|
2/28/2022 | $8,625 | $9,455 | $8,801 |
|---|
3/31/2022 | $8,566 | $9,516 | $8,787 |
|---|
4/30/2022 | $7,925 | $8,900 | $8,133 |
|---|
5/31/2022 | $7,819 | $8,967 | $8,063 |
|---|
6/30/2022 | $7,297 | $8,135 | $7,406 |
|---|
7/31/2022 | $7,673 | $8,540 | $7,814 |
|---|
8/31/2022 | $7,257 | $8,135 | $7,509 |
|---|
9/30/2022 | $6,590 | $7,374 | $6,712 |
|---|
10/31/2022 | $6,748 | $7,770 | $6,844 |
|---|
11/30/2022 | $7,673 | $8,645 | $7,695 |
|---|
12/31/2022 | $7,341 | $8,652 | $7,577 |
|---|
1/31/2023 | $8,028 | $9,353 | $8,218 |
|---|
2/28/2023 | $7,688 | $9,158 | $7,867 |
|---|
3/31/2023 | $8,135 | $9,385 | $8,228 |
|---|
4/30/2023 | $8,175 | $9,650 | $8,312 |
|---|
5/31/2023 | $8,075 | $9,241 | $8,081 |
|---|
6/30/2023 | $8,375 | $9,662 | $8,388 |
|---|
7/31/2023 | $8,468 | $9,974 | $8,650 |
|---|
8/31/2023 | $8,115 | $9,592 | $8,209 |
|---|
9/30/2023 | $7,588 | $9,265 | $7,775 |
|---|
10/31/2023 | $7,315 | $8,889 | $7,473 |
|---|
11/30/2023 | $8,088 | $9,714 | $8,246 |
|---|
12/31/2023 | $8,496 | $10,230 | $8,641 |
|---|
1/31/2024 | $8,583 | $10,289 | $8,574 |
|---|
2/29/2024 | $9,134 | $10,477 | $8,902 |
|---|
3/31/2024 | $9,402 | $10,822 | $9,151 |
|---|
4/30/2024 | $8,973 | $10,545 | $8,898 |
|---|
5/31/2024 | $9,396 | $10,953 | $9,133 |
|---|
6/30/2024 | $9,577 | $10,777 | $9,218 |
|---|
7/31/2024 | $9,537 | $11,093 | $9,315 |
|---|
8/31/2024 | $9,839 | $11,453 | $9,611 |
|---|
9/30/2024 | $9,967 | $11,559 | $9,855 |
|---|
10/31/2024 | $9,550 | $10,931 | $9,354 |
|---|
11/30/2024 | $9,570 | $10,869 | $9,277 |
|---|
12/31/2024 | $9,297 | $10,621 | $9,078 |
|---|
1/31/2025 | $9,729 | $11,180 | $9,465 |
|---|
2/28/2025 | $9,810 | $11,396 | $9,472 |
|---|
3/31/2025 | $9,446 | $11,350 | $9,257 |
|---|
4/30/2025 | $9,850 | $11,870 | $9,634 |
|---|
5/31/2025 | $10,424 | $12,413 | $10,120 |
|---|
6/30/2025 | $10,950 | $12,687 | $10,521 |
|---|
7/31/2025 | $10,775 | $12,509 | $10,394 |
|---|
|
|
| Average Annual Return [Table Text Block] |
AATR | 1 Year | Since Inception
6/24/21 |
|---|
Class I at NAV | 12.98% | 1.84% |
|---|
MSCI All Country World ex USA Growth Index (Net) | 11.58% | 0.95% |
|---|
MSCI EAFE Net Index | 12.77% | 5.61% |
|---|
|
|
| Performance Inception Date |
Jun. 24, 2021
|
|
| No Deduction of Taxes [Text Block] |
The returns do not reflect the deduction of taxes that a shareholder would pay on Fund distributions or redemption of Fund shares.
|
|
| AssetsNet |
$ 3,553,729
|
|
| Holdings Count | Holding |
79
|
|
| Advisory Fees Paid, Amount |
$ 0
|
|
| InvestmentCompanyPortfolioTurnover |
125.00%
|
|
| Additional Fund Statistics [Text Block] |
Total Net Assets | $3,553,729 |
|---|
# of Portfolio Holdings | 79 |
|---|
Portfolio Turnover Rate | 125% |
|---|
Total Advisory Fees Paid | $0 |
|---|
|
|
| Holdings [Text Block] |
Portfolio Holdings Presented by SectorFootnote Reference* | % Footnote Reference** |
|---|
Communication Services | 12.12% | Consumer Discretionary | 9.50% | Consumer Staples | 5.53% | Financials | 9.65% | Health Care | 11.65% | Industrials | 25.93% | Information Technology | 20.76% | Materials | 4.86% | Total | 100.00% |
| Footnote | Description | Footnote* | A sector may comprise several industries. | Footnote** | Represents percent of total investments, which excludes derivatives. |
|
|
| Material Fund Change [Text Block] |
There were no material fund changes during the period. |
|
| Summary of Change Legend [Text Block] |
There were no material fund changes during the period.
|
|
| C000228427 |
|
|
| Shareholder Report [Line Items] |
|
|
| Fund Name |
Lord Abbett International Growth Fund
|
|
| Class Name |
Class R3
|
|
| Trading Symbol |
LRAGX
|
|
| Annual or Semi-Annual Statement [Text Block] |
This annual shareholder report contains important information about the Lord Abbett International Growth Fund for the period of August 1, 2024 to July 31, 2025.
|
|
| Shareholder Report Annual or Semi-Annual |
Annual Shareholder Report
|
|
| Additional Information [Text Block] |
You can find additional information about the Fund at lordabbett.com/FundDocuments. You can also request this information by contacting us at 888-522-2388.
|
|
| Additional Information Phone Number |
888-522-2388
|
|
| Additional Information Website |
<span style="box-sizing: border-box; color: rgb(0, 0, 0); display: inline; flex-wrap: nowrap; font-size: 13.3333px; font-weight: 400; grid-area: auto; line-height: 20px; margin: 0px; overflow: visible; text-align: left; text-align-last: auto; white-space-collapse: preserve-breaks;">lordabbett.com/FundDocuments</span>
|
|
| Expenses [Text Block] |
What were the Fund costs for the last year?(based on a hypothetical $10,000 investment) Class Name | Costs of a $10,000 investment | Costs paid as a percentage of a $10,000 investment |
|---|
Class R3 | $128 | 1.21% |
|---|
|
|
| Expenses Paid, Amount |
$ 128
|
|
| Expense Ratio, Percent |
1.21%
|
|
| Factors Affecting Performance [Text Block] |
How did the Fund perform last year and what affected its performance?For the fiscal year ended July 31, 2025, the Fund returned 12.39%, reflecting performance at the net asset value (NAV) of Class R3 shares, with all distributions reinvested, compared to the 11.58% return of a securities market index with investment characteristics similar to those of the Fund, the MSCI All Country World ex USA Growth Index (Net). The Fund's broad-based securities market index, the MSCI EAFE Net Index, returned 12.77% over the same period. Positive factors for the markets included resilient economic data and corporate earnings, continued disinflation, and other factors, such as productivity gains from generative artificial intelligence. Negative factors included increased policy uncertainty during the period, including U.S. President Trump's “Liberation Day” announcement, which led to market volatility. Against this backdrop, U.S. equity markets delivered generally strong returns. Top contributors to performance: Security selection within the Industrials sector contributed to relative performance, led by an overweight allocation to Rheinmetall AG. Security selection within the Health Care sector also contributed to performance, led by an overweight allocation to Galderma Group AG. Top detractors from performance: Security selection within the Consumer Discretionary sector detracted from relative performance, led by an overweight allocation to Meituan. Security selection within the Information Technology sector also detracted from relative performance, led by an overweight allocation to Atlassian Corp. |
|
| Performance Past Does Not Indicate Future [Text] |
The Fund's past performance is no guarantee of future results.
|
|
| Line Graph [Table Text Block] |
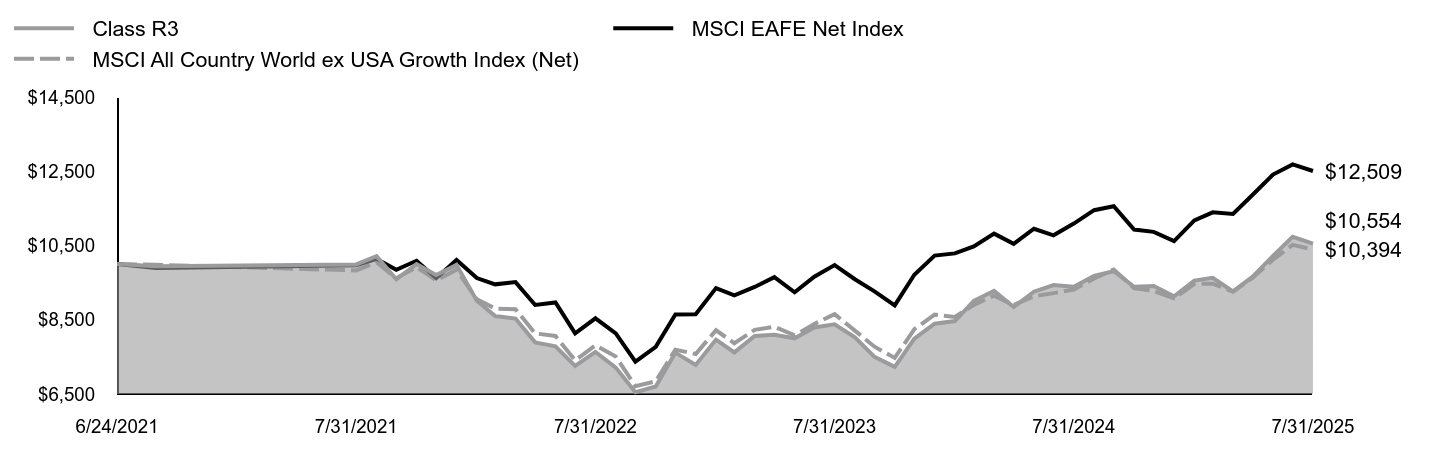 | Class R3 | MSCI EAFE Net Index | MSCI All Country World ex USA Growth Index (Net) |
|---|
6/24/2021 | $10,000 | $10,000 | $10,000 |
|---|
6/30/2021 | $9,941 | $9,893 | $9,981 |
|---|
7/31/2021 | $9,993 | $9,967 | $9,830 |
|---|
8/31/2021 | $10,212 | $10,143 | $10,052 |
|---|
9/30/2021 | $9,590 | $9,849 | $9,620 |
|---|
10/31/2021 | $10,000 | $10,091 | $9,918 |
|---|
11/30/2021 | $9,709 | $9,621 | $9,560 |
|---|
12/31/2021 | $9,980 | $10,114 | $9,847 |
|---|
1/31/2022 | $9,015 | $9,625 | $9,053 |
|---|
2/28/2022 | $8,599 | $9,455 | $8,801 |
|---|
3/31/2022 | $8,533 | $9,516 | $8,787 |
|---|
4/30/2022 | $7,892 | $8,900 | $8,133 |
|---|
5/31/2022 | $7,786 | $8,967 | $8,063 |
|---|
6/30/2022 | $7,257 | $8,135 | $7,406 |
|---|
7/31/2022 | $7,634 | $8,540 | $7,814 |
|---|
8/31/2022 | $7,211 | $8,135 | $7,509 |
|---|
9/30/2022 | $6,550 | $7,374 | $6,712 |
|---|
10/31/2022 | $6,702 | $7,770 | $6,844 |
|---|
11/30/2022 | $7,614 | $8,645 | $7,695 |
|---|
12/31/2022 | $7,283 | $8,652 | $7,577 |
|---|
1/31/2023 | $7,966 | $9,353 | $8,218 |
|---|
2/28/2023 | $7,621 | $9,158 | $7,867 |
|---|
3/31/2023 | $8,066 | $9,385 | $8,228 |
|---|
4/30/2023 | $8,099 | $9,650 | $8,312 |
|---|
5/31/2023 | $8,000 | $9,241 | $8,081 |
|---|
6/30/2023 | $8,291 | $9,662 | $8,388 |
|---|
7/31/2023 | $8,378 | $9,974 | $8,650 |
|---|
8/31/2023 | $8,026 | $9,592 | $8,209 |
|---|
9/30/2023 | $7,502 | $9,265 | $7,775 |
|---|
10/31/2023 | $7,230 | $8,889 | $7,473 |
|---|
11/30/2023 | $7,993 | $9,714 | $8,246 |
|---|
12/31/2023 | $8,393 | $10,230 | $8,641 |
|---|
1/31/2024 | $8,466 | $10,289 | $8,574 |
|---|
2/29/2024 | $9,011 | $10,477 | $8,902 |
|---|
3/31/2024 | $9,277 | $10,822 | $9,151 |
|---|
4/30/2024 | $8,845 | $10,545 | $8,898 |
|---|
5/31/2024 | $9,257 | $10,953 | $9,133 |
|---|
6/30/2024 | $9,437 | $10,777 | $9,218 |
|---|
7/31/2024 | $9,390 | $11,093 | $9,315 |
|---|
8/31/2024 | $9,683 | $11,453 | $9,611 |
|---|
9/30/2024 | $9,809 | $11,559 | $9,855 |
|---|
10/31/2024 | $9,390 | $10,931 | $9,354 |
|---|
11/30/2024 | $9,410 | $10,869 | $9,277 |
|---|
12/31/2024 | $9,131 | $10,621 | $9,078 |
|---|
1/31/2025 | $9,556 | $11,180 | $9,465 |
|---|
2/28/2025 | $9,630 | $11,396 | $9,472 |
|---|
3/31/2025 | $9,264 | $11,350 | $9,257 |
|---|
4/30/2025 | $9,663 | $11,870 | $9,634 |
|---|
5/31/2025 | $10,221 | $12,413 | $10,120 |
|---|
6/30/2025 | $10,734 | $12,687 | $10,521 |
|---|
7/31/2025 | $10,554 | $12,509 | $10,394 |
|---|
|
|
| Average Annual Return [Table Text Block] |
AATR | 1 Year | Since Inception
6/24/21 |
|---|
Class R3 at NAV | 12.39% | 1.32% |
|---|
MSCI All Country World ex USA Growth Index (Net) | 11.58% | 0.95% |
|---|
MSCI EAFE Net Index | 12.77% | 5.61% |
|---|
|
|
| Performance Inception Date |
Jun. 24, 2021
|
|
| No Deduction of Taxes [Text Block] |
The returns do not reflect the deduction of taxes that a shareholder would pay on Fund distributions or redemption of Fund shares.
|
|
| AssetsNet |
$ 3,553,729
|
|
| Holdings Count | Holding |
79
|
|
| Advisory Fees Paid, Amount |
$ 0
|
|
| InvestmentCompanyPortfolioTurnover |
125.00%
|
|
| Additional Fund Statistics [Text Block] |
Total Net Assets | $3,553,729 |
|---|
# of Portfolio Holdings | 79 |
|---|
Portfolio Turnover Rate | 125% |
|---|
Total Advisory Fees Paid | $0 |
|---|
|
|
| Holdings [Text Block] |
Portfolio Holdings Presented by SectorFootnote Reference* | % Footnote Reference** |
|---|
Communication Services | 12.12% | Consumer Discretionary | 9.50% | Consumer Staples | 5.53% | Financials | 9.65% | Health Care | 11.65% | Industrials | 25.93% | Information Technology | 20.76% | Materials | 4.86% | Total | 100.00% |
| Footnote | Description | Footnote* | A sector may comprise several industries. | Footnote** | Represents percent of total investments, which excludes derivatives. |
|
|
| Material Fund Change [Text Block] |
There were no material fund changes during the period. |
|
| Summary of Change Legend [Text Block] |
There were no material fund changes during the period.
|
|
| C000228426 |
|
|
| Shareholder Report [Line Items] |
|
|
| Fund Name |
Lord Abbett International Growth Fund
|
|
| Class Name |
Class R4
|
|
| Trading Symbol |
LASGX
|
|
| Annual or Semi-Annual Statement [Text Block] |
This annual shareholder report contains important information about the Lord Abbett International Growth Fund for the period of August 1, 2024 to July 31, 2025.
|
|
| Shareholder Report Annual or Semi-Annual |
Annual Shareholder Report
|
|
| Additional Information [Text Block] |
You can find additional information about the Fund at lordabbett.com/FundDocuments. You can also request this information by contacting us at 888-522-2388.
|
|
| Additional Information Phone Number |
888-522-2388
|
|
| Additional Information Website |
<span style="box-sizing: border-box; color: rgb(0, 0, 0); display: inline; flex-wrap: nowrap; font-size: 13.3333px; font-weight: 400; grid-area: auto; line-height: 20px; margin: 0px; overflow: visible; text-align: left; text-align-last: auto; white-space-collapse: preserve-breaks;">lordabbett.com/FundDocuments</span>
|
|
| Expenses [Text Block] |
What were the Fund costs for the last year?(based on a hypothetical $10,000 investment) Class Name | Costs of a $10,000 investment | Costs paid as a percentage of a $10,000 investment |
|---|
Class R4 | $99 | 0.93% |
|---|
|
|
| Expenses Paid, Amount |
$ 99
|
|
| Expense Ratio, Percent |
0.93%
|
|
| Factors Affecting Performance [Text Block] |
How did the Fund perform last year and what affected its performance?For the fiscal year ended July 31, 2025, the Fund returned 12.67%, reflecting performance at the net asset value (NAV) of Class R4 shares, with all distributions reinvested, compared to the 11.58% return of a securities market index with investment characteristics similar to those of the Fund, the MSCI All Country World ex USA Growth Index (Net). The Fund's broad-based securities market index, the MSCI EAFE Net Index, returned 12.77% over the same period. Positive factors for the markets included resilient economic data and corporate earnings, continued disinflation, and other factors, such as productivity gains from generative artificial intelligence. Negative factors included increased policy uncertainty during the period, including U.S. President Trump's “Liberation Day” announcement, which led to market volatility. Against this backdrop, U.S. equity markets delivered generally strong returns. Top contributors to performance: Security selection within the Industrials sector contributed to relative performance, led by an overweight allocation to Rheinmetall AG. Security selection within the Health Care sector also contributed to performance, led by an overweight allocation to Galderma Group AG. Top detractors from performance: Security selection within the Consumer Discretionary sector detracted from relative performance, led by an overweight allocation to Meituan. Security selection within the Information Technology sector also detracted from relative performance, led by an overweight allocation to Atlassian Corp. |
|
| Performance Past Does Not Indicate Future [Text] |
The Fund's past performance is no guarantee of future results.
|
|
| Line Graph [Table Text Block] |
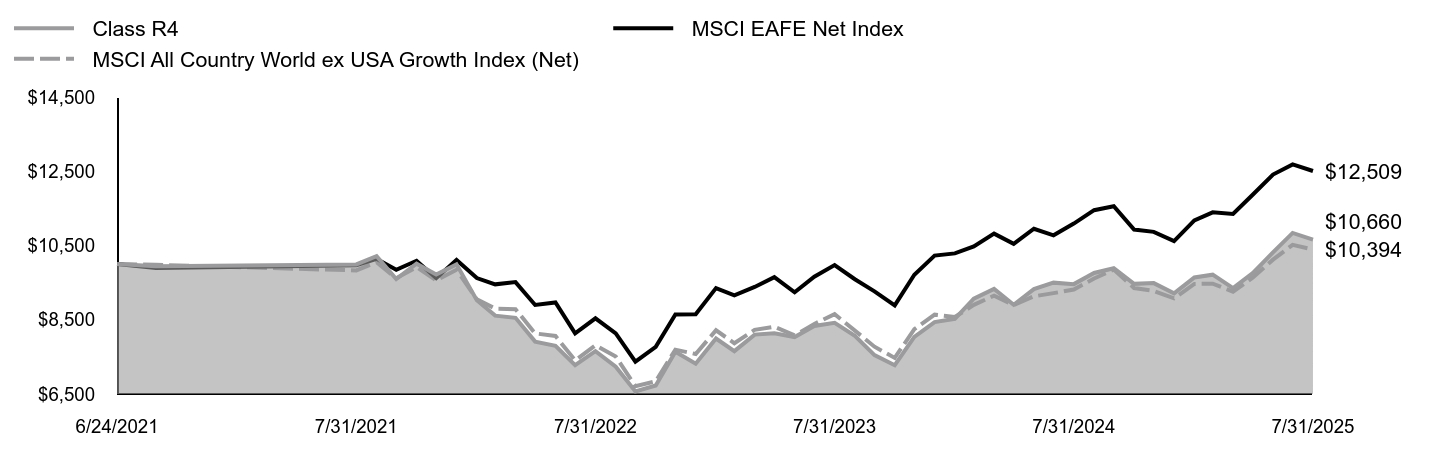 | Class R4 | MSCI EAFE Net Index | MSCI All Country World ex USA Growth Index (Net) |
|---|
6/24/2021 | $10,000 | $10,000 | $10,000 |
|---|
6/30/2021 | $9,941 | $9,893 | $9,981 |
|---|
7/31/2021 | $9,993 | $9,967 | $9,830 |
|---|
8/31/2021 | $10,212 | $10,143 | $10,052 |
|---|
9/30/2021 | $9,597 | $9,849 | $9,620 |
|---|
10/31/2021 | $10,013 | $10,091 | $9,918 |
|---|
11/30/2021 | $9,722 | $9,621 | $9,560 |
|---|
12/31/2021 | $9,993 | $10,114 | $9,847 |
|---|
1/31/2022 | $9,028 | $9,625 | $9,053 |
|---|
2/28/2022 | $8,612 | $9,455 | $8,801 |
|---|
3/31/2022 | $8,553 | $9,516 | $8,787 |
|---|
4/30/2022 | $7,911 | $8,900 | $8,133 |
|---|
5/31/2022 | $7,799 | $8,967 | $8,063 |
|---|
6/30/2022 | $7,277 | $8,135 | $7,406 |
|---|
7/31/2022 | $7,654 | $8,540 | $7,814 |
|---|
8/31/2022 | $7,237 | $8,135 | $7,509 |
|---|
9/30/2022 | $6,570 | $7,374 | $6,712 |
|---|
10/31/2022 | $6,728 | $7,770 | $6,844 |
|---|
11/30/2022 | $7,640 | $8,645 | $7,695 |
|---|
12/31/2022 | $7,316 | $8,652 | $7,577 |
|---|
1/31/2023 | $7,994 | $9,353 | $8,218 |
|---|
2/28/2023 | $7,655 | $9,158 | $7,867 |
|---|
3/31/2023 | $8,100 | $9,385 | $8,228 |
|---|
4/30/2023 | $8,134 | $9,650 | $8,312 |
|---|
5/31/2023 | $8,034 | $9,241 | $8,081 |
|---|
6/30/2023 | $8,333 | $9,662 | $8,388 |
|---|
7/31/2023 | $8,420 | $9,974 | $8,650 |
|---|
8/31/2023 | $8,067 | $9,592 | $8,209 |
|---|
9/30/2023 | $7,548 | $9,265 | $7,775 |
|---|
10/31/2023 | $7,276 | $8,889 | $7,473 |
|---|
11/30/2023 | $8,040 | $9,714 | $8,246 |
|---|
12/31/2023 | $8,439 | $10,230 | $8,641 |
|---|
1/31/2024 | $8,526 | $10,289 | $8,574 |
|---|
2/29/2024 | $9,067 | $10,477 | $8,902 |
|---|
3/31/2024 | $9,334 | $10,822 | $9,151 |
|---|
4/30/2024 | $8,906 | $10,545 | $8,898 |
|---|
5/31/2024 | $9,327 | $10,953 | $9,133 |
|---|
6/30/2024 | $9,501 | $10,777 | $9,218 |
|---|
7/31/2024 | $9,461 | $11,093 | $9,315 |
|---|
8/31/2024 | $9,762 | $11,453 | $9,611 |
|---|
9/30/2024 | $9,889 | $11,559 | $9,855 |
|---|
10/31/2024 | $9,468 | $10,931 | $9,354 |
|---|
11/30/2024 | $9,488 | $10,869 | $9,277 |
|---|
12/31/2024 | $9,214 | $10,621 | $9,078 |
|---|
1/31/2025 | $9,642 | $11,180 | $9,465 |
|---|
2/28/2025 | $9,716 | $11,396 | $9,472 |
|---|
3/31/2025 | $9,354 | $11,350 | $9,257 |
|---|
4/30/2025 | $9,756 | $11,870 | $9,634 |
|---|
5/31/2025 | $10,318 | $12,413 | $10,120 |
|---|
6/30/2025 | $10,841 | $12,687 | $10,521 |
|---|
7/31/2025 | $10,660 | $12,509 | $10,394 |
|---|
|
|
| Average Annual Return [Table Text Block] |
AATR | 1 Year | Since Inception
6/24/21 |
|---|
Class R4 at NAV | 12.67% | 1.57% |
|---|
MSCI All Country World ex USA Growth Index (Net) | 11.58% | 0.95% |
|---|
MSCI EAFE Net Index | 12.77% | 5.61% |
|---|
|
|
| Performance Inception Date |
Jun. 24, 2021
|
|
| No Deduction of Taxes [Text Block] |
The returns do not reflect the deduction of taxes that a shareholder would pay on Fund distributions or redemption of Fund shares.
|
|
| AssetsNet |
$ 3,553,729
|
|
| Holdings Count | Holding |
79
|
|
| Advisory Fees Paid, Amount |
$ 0
|
|
| InvestmentCompanyPortfolioTurnover |
125.00%
|
|
| Additional Fund Statistics [Text Block] |
Total Net Assets | $3,553,729 |
|---|
# of Portfolio Holdings | 79 |
|---|
Portfolio Turnover Rate | 125% |
|---|
Total Advisory Fees Paid | $0 |
|---|
|
|
| Holdings [Text Block] |
Portfolio Holdings Presented by SectorFootnote Reference* | % Footnote Reference** |
|---|
Communication Services | 12.12% | Consumer Discretionary | 9.50% | Consumer Staples | 5.53% | Financials | 9.65% | Health Care | 11.65% | Industrials | 25.93% | Information Technology | 20.76% | Materials | 4.86% | Total | 100.00% |
| Footnote | Description | Footnote* | A sector may comprise several industries. | Footnote** | Represents percent of total investments, which excludes derivatives. |
|
|
| Material Fund Change [Text Block] |
There were no material fund changes during the period. |
|
| Summary of Change Legend [Text Block] |
There were no material fund changes during the period.
|
|
| C000228425 |
|
|
| Shareholder Report [Line Items] |
|
|
| Fund Name |
Lord Abbett International Growth Fund
|
|
| Class Name |
Class R5
|
|
| Trading Symbol |
LTAGX
|
|
| Annual or Semi-Annual Statement [Text Block] |
This annual shareholder report contains important information about the Lord Abbett International Growth Fund for the period of August 1, 2024 to July 31, 2025.
|
|
| Shareholder Report Annual or Semi-Annual |
Annual Shareholder Report
|
|
| Additional Information [Text Block] |
You can find additional information about the Fund at lordabbett.com/FundDocuments. You can also request this information by contacting us at 888-522-2388.
|
|
| Additional Information Phone Number |
888-522-2388
|
|
| Additional Information Website |
<span style="box-sizing: border-box; color: rgb(0, 0, 0); display: inline; flex-wrap: nowrap; font-size: 13.3333px; font-weight: 400; grid-area: auto; line-height: 20px; margin: 0px; overflow: visible; text-align: left; text-align-last: auto; white-space-collapse: preserve-breaks;">lordabbett.com/FundDocuments</span>
|
|
| Expenses [Text Block] |
What were the Fund costs for the last year?(based on a hypothetical $10,000 investment) Class Name | Costs of a $10,000 investment | Costs paid as a percentage of a $10,000 investment |
|---|
Class R5 | $76 | 0.71% |
|---|
|
|
| Expenses Paid, Amount |
$ 76
|
|
| Expense Ratio, Percent |
0.71%
|
|
| Factors Affecting Performance [Text Block] |
How did the Fund perform last year and what affected its performance?For the fiscal year ended July 31, 2025, the Fund returned 12.98%, reflecting performance at the net asset value (NAV) of Class R5 shares, with all distributions reinvested, compared to the 11.58% return of a securities market index with investment characteristics similar to those of the Fund, the MSCI All Country World ex USA Growth Index (Net). The Fund's broad-based securities market index, the MSCI EAFE Net Index, returned 12.77% over the same period. Positive factors for the markets included resilient economic data and corporate earnings, continued disinflation, and other factors, such as productivity gains from generative artificial intelligence. Negative factors included increased policy uncertainty during the period, including U.S. President Trump's “Liberation Day” announcement, which led to market volatility. Against this backdrop, U.S. equity markets delivered generally strong returns. Top contributors to performance: Security selection within the Industrials sector contributed to relative performance, led by an overweight allocation to Rheinmetall AG. Security selection within the Health Care sector also contributed to performance, led by an overweight allocation to Galderma Group AG. Top detractors from performance: Security selection within the Consumer Discretionary sector detracted from relative performance, led by an overweight allocation to Meituan. Security selection within the Information Technology sector also detracted from relative performance, led by an overweight allocation to Atlassian Corp. |
|
| Performance Past Does Not Indicate Future [Text] |
The Fund's past performance is no guarantee of future results.
|
|
| Line Graph [Table Text Block] |
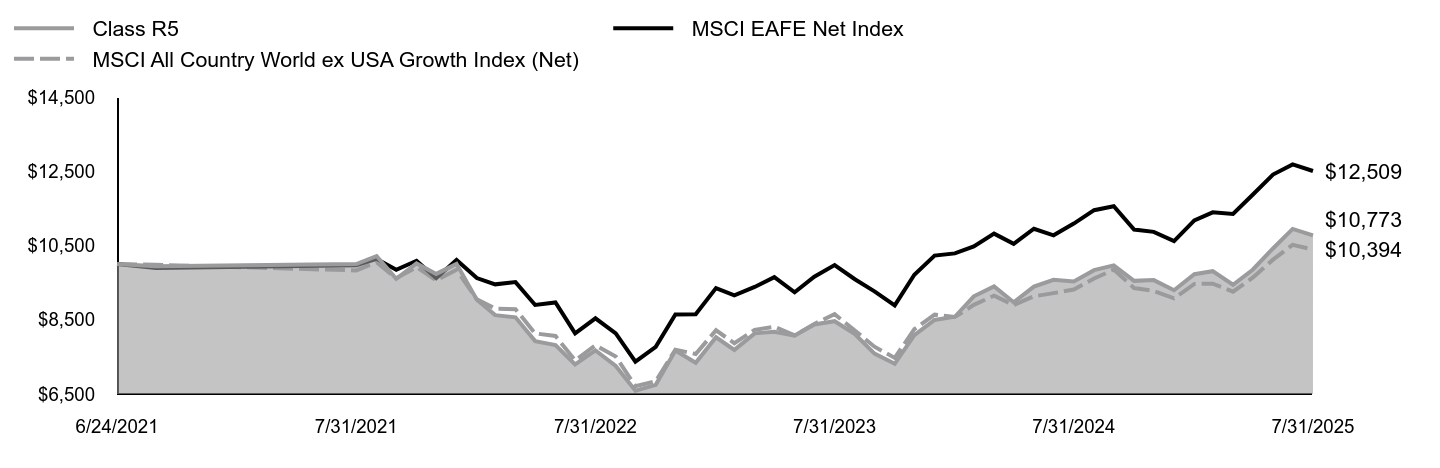 | Class R5 | MSCI EAFE Net Index | MSCI All Country World ex USA Growth Index (Net) |
|---|
6/24/2021 | $10,000 | $10,000 | $10,000 |
|---|
6/30/2021 | $9,941 | $9,893 | $9,981 |
|---|
7/31/2021 | $10,000 | $9,967 | $9,830 |
|---|
8/31/2021 | $10,218 | $10,143 | $10,052 |
|---|
9/30/2021 | $9,603 | $9,849 | $9,620 |
|---|
10/31/2021 | $10,020 | $10,091 | $9,918 |
|---|
11/30/2021 | $9,736 | $9,621 | $9,560 |
|---|
12/31/2021 | $10,007 | $10,114 | $9,847 |
|---|
1/31/2022 | $9,042 | $9,625 | $9,053 |
|---|
2/28/2022 | $8,625 | $9,455 | $8,801 |
|---|
3/31/2022 | $8,566 | $9,516 | $8,787 |
|---|
4/30/2022 | $7,925 | $8,900 | $8,133 |
|---|
5/31/2022 | $7,819 | $8,967 | $8,063 |
|---|
6/30/2022 | $7,297 | $8,135 | $7,406 |
|---|
7/31/2022 | $7,673 | $8,540 | $7,814 |
|---|
8/31/2022 | $7,257 | $8,135 | $7,509 |
|---|
9/30/2022 | $6,590 | $7,374 | $6,712 |
|---|
10/31/2022 | $6,748 | $7,770 | $6,844 |
|---|
11/30/2022 | $7,673 | $8,645 | $7,695 |
|---|
12/31/2022 | $7,341 | $8,652 | $7,577 |
|---|
1/31/2023 | $8,028 | $9,353 | $8,218 |
|---|
2/28/2023 | $7,688 | $9,158 | $7,867 |
|---|
3/31/2023 | $8,135 | $9,385 | $8,228 |
|---|
4/30/2023 | $8,175 | $9,650 | $8,312 |
|---|
5/31/2023 | $8,075 | $9,241 | $8,081 |
|---|
6/30/2023 | $8,375 | $9,662 | $8,388 |
|---|
7/31/2023 | $8,462 | $9,974 | $8,650 |
|---|
8/31/2023 | $8,115 | $9,592 | $8,209 |
|---|
9/30/2023 | $7,588 | $9,265 | $7,775 |
|---|
10/31/2023 | $7,315 | $8,889 | $7,473 |
|---|
11/30/2023 | $8,088 | $9,714 | $8,246 |
|---|
12/31/2023 | $8,495 | $10,230 | $8,641 |
|---|
1/31/2024 | $8,582 | $10,289 | $8,574 |
|---|
2/29/2024 | $9,132 | $10,477 | $8,902 |
|---|
3/31/2024 | $9,401 | $10,822 | $9,151 |
|---|
4/30/2024 | $8,971 | $10,545 | $8,898 |
|---|
5/31/2024 | $9,394 | $10,953 | $9,133 |
|---|
6/30/2024 | $9,576 | $10,777 | $9,218 |
|---|
7/31/2024 | $9,535 | $11,093 | $9,315 |
|---|
8/31/2024 | $9,838 | $11,453 | $9,611 |
|---|
9/30/2024 | $9,965 | $11,559 | $9,855 |
|---|
10/31/2024 | $9,549 | $10,931 | $9,354 |
|---|
11/30/2024 | $9,569 | $10,869 | $9,277 |
|---|
12/31/2024 | $9,296 | $10,621 | $9,078 |
|---|
1/31/2025 | $9,728 | $11,180 | $9,465 |
|---|
2/28/2025 | $9,809 | $11,396 | $9,472 |
|---|
3/31/2025 | $9,444 | $11,350 | $9,257 |
|---|
4/30/2025 | $9,849 | $11,870 | $9,634 |
|---|
5/31/2025 | $10,422 | $12,413 | $10,120 |
|---|
6/30/2025 | $10,949 | $12,687 | $10,521 |
|---|
7/31/2025 | $10,773 | $12,509 | $10,394 |
|---|
|
|
| Average Annual Return [Table Text Block] |
AATR | 1 Year | Since Inception
6/24/21 |
|---|
Class R5 at NAV | 12.98% | 1.83% |
|---|
MSCI All Country World ex USA Growth Index (Net) | 11.58% | 0.95% |
|---|
MSCI EAFE Net Index | 12.77% | 5.61% |
|---|
|
|
| Performance Inception Date |
Jun. 24, 2021
|
|
| No Deduction of Taxes [Text Block] |
The returns do not reflect the deduction of taxes that a shareholder would pay on Fund distributions or redemption of Fund shares.
|
|
| AssetsNet |
$ 3,553,729
|
|
| Holdings Count | Holding |
79
|
|
| Advisory Fees Paid, Amount |
$ 0
|
|
| InvestmentCompanyPortfolioTurnover |
125.00%
|
|
| Additional Fund Statistics [Text Block] |
Total Net Assets | $3,553,729 |
|---|
# of Portfolio Holdings | 79 |
|---|
Portfolio Turnover Rate | 125% |
|---|
Total Advisory Fees Paid | $0 |
|---|
|
|
| Holdings [Text Block] |
Portfolio Holdings Presented by SectorFootnote Reference* | % Footnote Reference** |
|---|
Communication Services | 12.12% | Consumer Discretionary | 9.50% | Consumer Staples | 5.53% | Financials | 9.65% | Health Care | 11.65% | Industrials | 25.93% | Information Technology | 20.76% | Materials | 4.86% | Total | 100.00% |
| Footnote | Description | Footnote* | A sector may comprise several industries. | Footnote** | Represents percent of total investments, which excludes derivatives. |
|
|
| Material Fund Change [Text Block] |
There were no material fund changes during the period. |
|
| Summary of Change Legend [Text Block] |
There were no material fund changes during the period.
|
|
| C000228424 |
|
|
| Shareholder Report [Line Items] |
|
|
| Fund Name |
Lord Abbett International Growth Fund
|
|
| Class Name |
Class R6
|
|
| Trading Symbol |
LAVGX
|
|
| Annual or Semi-Annual Statement [Text Block] |
This annual shareholder report contains important information about the Lord Abbett International Growth Fund for the period of August 1, 2024 to July 31, 2025.
|
|
| Shareholder Report Annual or Semi-Annual |
Annual Shareholder Report
|
|
| Additional Information [Text Block] |
You can find additional information about the Fund at lordabbett.com/FundDocuments. You can also request this information by contacting us at 888-522-2388.
|
|
| Additional Information Phone Number |
888-522-2388
|
|
| Additional Information Website |
<span style="box-sizing: border-box; color: rgb(0, 0, 0); display: inline; flex-wrap: nowrap; font-size: 13.3333px; font-weight: 400; grid-area: auto; line-height: 20px; margin: 0px; overflow: visible; text-align: left; text-align-last: auto; white-space-collapse: preserve-breaks;">lordabbett.com/FundDocuments</span>
|
|
| Expenses [Text Block] |
What were the Fund costs for the last year?(based on a hypothetical $10,000 investment) Class Name | Costs of a $10,000 investment | Costs paid as a percentage of a $10,000 investment |
|---|
Class R6 | $71 | 0.67% |
|---|
|
|
| Expenses Paid, Amount |
$ 71
|
|
| Expense Ratio, Percent |
0.67%
|
|
| Factors Affecting Performance [Text Block] |
How did the Fund perform last year and what affected its performance?For the fiscal year ended July 31, 2025, the Fund returned 12.95%, reflecting performance at the net asset value (NAV) of Class R6 shares, with all distributions reinvested, compared to the 11.58% return of a securities market index with investment characteristics similar to those of the Fund, the MSCI All Country World ex USA Growth Index (Net). The Fund's broad-based securities market index, the MSCI EAFE Net Index, returned 12.77% over the same period. Positive factors for the markets included resilient economic data and corporate earnings, continued disinflation, and other factors, such as productivity gains from generative artificial intelligence. Negative factors included increased policy uncertainty during the period, including U.S. President Trump's “Liberation Day” announcement, which led to market volatility. Against this backdrop, U.S. equity markets delivered generally strong returns. Top contributors to performance: Security selection within the Industrials sector contributed to relative performance, led by an overweight allocation to Rheinmetall AG. Security selection within the Health Care sector also contributed to performance, led by an overweight allocation to Galderma Group AG. Top detractors from performance: Security selection within the Consumer Discretionary sector detracted from relative performance, led by an overweight allocation to Meituan. Security selection within the Information Technology sector also detracted from relative performance, led by an overweight allocation to Atlassian Corp. |
|
| Performance Past Does Not Indicate Future [Text] |
The Fund's past performance is no guarantee of future results.
|
|
| Line Graph [Table Text Block] |
 | Class R6 | MSCI EAFE Net Index | MSCI All Country World ex USA Growth Index (Net) |
|---|
6/24/2021 | $10,000 | $10,000 | $10,000 |
|---|
6/30/2021 | $9,941 | $9,893 | $9,981 |
|---|
7/31/2021 | $10,000 | $9,967 | $9,830 |
|---|
8/31/2021 | $10,218 | $10,143 | $10,052 |
|---|
9/30/2021 | $9,603 | $9,849 | $9,620 |
|---|
10/31/2021 | $10,026 | $10,091 | $9,918 |
|---|
11/30/2021 | $9,736 | $9,621 | $9,560 |
|---|
12/31/2021 | $10,013 | $10,114 | $9,847 |
|---|
1/31/2022 | $9,048 | $9,625 | $9,053 |
|---|
2/28/2022 | $8,632 | $9,455 | $8,801 |
|---|
3/31/2022 | $8,572 | $9,516 | $8,787 |
|---|
4/30/2022 | $7,931 | $8,900 | $8,133 |
|---|
5/31/2022 | $7,826 | $8,967 | $8,063 |
|---|
6/30/2022 | $7,303 | $8,135 | $7,406 |
|---|
7/31/2022 | $7,687 | $8,540 | $7,814 |
|---|
8/31/2022 | $7,264 | $8,135 | $7,509 |
|---|
9/30/2022 | $6,596 | $7,374 | $6,712 |
|---|
10/31/2022 | $6,755 | $7,770 | $6,844 |
|---|
11/30/2022 | $7,680 | $8,645 | $7,695 |
|---|
12/31/2022 | $7,350 | $8,652 | $7,577 |
|---|
1/31/2023 | $8,037 | $9,353 | $8,218 |
|---|
2/28/2023 | $7,697 | $9,158 | $7,867 |
|---|
3/31/2023 | $8,144 | $9,385 | $8,228 |
|---|
4/30/2023 | $8,184 | $9,650 | $8,312 |
|---|
5/31/2023 | $8,091 | $9,241 | $8,081 |
|---|
6/30/2023 | $8,391 | $9,662 | $8,388 |
|---|
7/31/2023 | $8,484 | $9,974 | $8,650 |
|---|
8/31/2023 | $8,131 | $9,592 | $8,209 |
|---|
9/30/2023 | $7,604 | $9,265 | $7,775 |
|---|
10/31/2023 | $7,330 | $8,889 | $7,473 |
|---|
11/30/2023 | $8,111 | $9,714 | $8,246 |
|---|
12/31/2023 | $8,519 | $10,230 | $8,641 |
|---|
1/31/2024 | $8,600 | $10,289 | $8,574 |
|---|
2/29/2024 | $9,151 | $10,477 | $8,902 |
|---|
3/31/2024 | $9,426 | $10,822 | $9,151 |
|---|
4/30/2024 | $8,990 | $10,545 | $8,898 |
|---|
5/31/2024 | $9,420 | $10,953 | $9,133 |
|---|
6/30/2024 | $9,601 | $10,777 | $9,218 |
|---|
7/31/2024 | $9,568 | $11,093 | $9,315 |
|---|
8/31/2024 | $9,863 | $11,453 | $9,611 |
|---|
9/30/2024 | $9,998 | $11,559 | $9,855 |
|---|
10/31/2024 | $9,574 | $10,931 | $9,354 |
|---|
11/30/2024 | $9,594 | $10,869 | $9,277 |
|---|
12/31/2024 | $9,321 | $10,621 | $9,078 |
|---|
1/31/2025 | $9,760 | $11,180 | $9,465 |
|---|
2/28/2025 | $9,841 | $11,396 | $9,472 |
|---|
3/31/2025 | $9,470 | $11,350 | $9,257 |
|---|
4/30/2025 | $9,882 | $11,870 | $9,634 |
|---|
5/31/2025 | $10,455 | $12,413 | $10,120 |
|---|
6/30/2025 | $10,982 | $12,687 | $10,521 |
|---|
7/31/2025 | $10,806 | $12,509 | $10,394 |
|---|
|
|
| Average Annual Return [Table Text Block] |
AATR | 1 Year | Since Inception
6/24/21 |
|---|
Class R6 at NAV | 12.95% | 1.91% |
|---|
MSCI All Country World ex USA Growth Index (Net) | 11.58% | 0.95% |
|---|
MSCI EAFE Net Index | 12.77% | 5.61% |
|---|
|
|
| Performance Inception Date |
Jun. 24, 2021
|
|
| No Deduction of Taxes [Text Block] |
The returns do not reflect the deduction of taxes that a shareholder would pay on Fund distributions or redemption of Fund shares.
|
|
| AssetsNet |
$ 3,553,729
|
|
| Holdings Count | Holding |
79
|
|
| Advisory Fees Paid, Amount |
$ 0
|
|
| InvestmentCompanyPortfolioTurnover |
125.00%
|
|
| Additional Fund Statistics [Text Block] |
Total Net Assets | $3,553,729 |
|---|
# of Portfolio Holdings | 79 |
|---|
Portfolio Turnover Rate | 125% |
|---|
Total Advisory Fees Paid | $0 |
|---|
|
|
| Holdings [Text Block] |
Portfolio Holdings Presented by SectorFootnote Reference* | % Footnote Reference** |
|---|
Communication Services | 12.12% | Consumer Discretionary | 9.50% | Consumer Staples | 5.53% | Financials | 9.65% | Health Care | 11.65% | Industrials | 25.93% | Information Technology | 20.76% | Materials | 4.86% | Total | 100.00% |
| Footnote | Description | Footnote* | A sector may comprise several industries. | Footnote** | Represents percent of total investments, which excludes derivatives. |
|
|
| Material Fund Change [Text Block] |
There were no material fund changes during the period. |
|
| Summary of Change Legend [Text Block] |
There were no material fund changes during the period.
|
|
| C000218936 |
|
|
| Shareholder Report [Line Items] |
|
|
| Fund Name |
Lord Abbett Short Duration High Yield Fund
|
|
| Class Name |
Class A
|
|
| Trading Symbol |
LSYAX
|
|
| Annual or Semi-Annual Statement [Text Block] |
This annual shareholder report contains important information about the Lord Abbett Short Duration High Yield Fund for the period of August 1, 2024 to July 31, 2025.
|
|
| Shareholder Report Annual or Semi-Annual |
Annual Shareholder Report
|
|
| Additional Information [Text Block] |
You can find additional information about the Fund at lordabbett.com/FundDocuments. You can also request this information by contacting us at 888-522-2388.
|
|
| Additional Information Phone Number |
888-522-2388
|
|
| Additional Information Website |
<span style="box-sizing: border-box; color: rgb(0, 0, 0); display: inline; flex-wrap: nowrap; font-size: 13.3333px; font-weight: 400; grid-area: auto; line-height: 20px; margin: 0px; overflow: visible; text-align: left; text-align-last: auto; white-space-collapse: preserve-breaks;">lordabbett.com/FundDocuments</span>
|
|
| Expenses [Text Block] |
What were the Fund costs for the last year?(based on a hypothetical $10,000 investment) Class Name | Costs of a $10,000 investment | Costs paid as a percentage of a $10,000 investment |
|---|
Class A | $67 | 0.65% |
|---|
|
|
| Expenses Paid, Amount |
$ 67
|
|
| Expense Ratio, Percent |
0.65%
|
|
| Factors Affecting Performance [Text Block] |
How did the Fund perform last year and what affected its performance?For the fiscal year ended July 31, 2025, the Fund returned 7.62%, reflecting performance at the net asset value (NAV) of Class A shares, with all distributions reinvested, compared to the 7.41% return of a securities market index with investment characteristics similar to those of the Fund, the ICE BofA High Yield U.S. Corporate Cash Pay BB-B (1-5yrs) Index. The Fund's broad-based securities market index, the Bloomberg U.S. Aggregate Bond Index, returned 3.38% over the same period. U.S. fixed income markets have navigated a turbulent yet resilient path over the past several quarters, shaped by macroeconomic shifts, evolving monetary policy, and political developments. In the first half of the period, performance was mixed but ultimately constructive. Resilient macroeconomic data led to credit spreads reaching multi-year tights, though momentum faded amid growth concerns, tariff uncertainty, and skepticism around AI-driven expansion. This culminated in the April 2nd “Liberation Day” U.S. tariff announcement which triggered market volatility and a sharp selloff of risk assets. Markets rebounded on trade policy concessions, as well as strong earnings, increased AI investment momentum, and consumer resilience. Top contributors to performance: Security selection within the Telecommunications, Financial Services and Technology sectors. Credit selection within Single Bs. Allocation to convertible bonds. Top detractors from performance: Credit selection within Capital Goods, Automotive and Healthcare sectors. |
|
| Performance Past Does Not Indicate Future [Text] |
The Fund's past performance is no guarantee of future results.
|
|
| Line Graph [Table Text Block] |
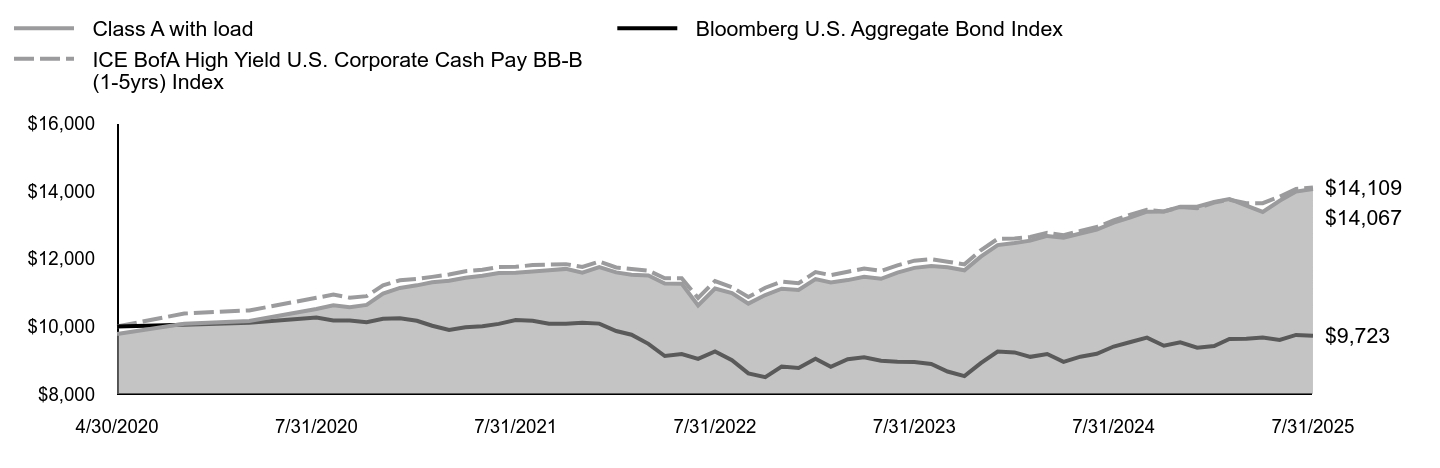 | Class A with load | Bloomberg U.S. Aggregate Bond Index | ICE BofA High Yield U.S. Corporate Cash Pay BB-B (1-5yrs) Index |
|---|
4/30/2020 | $9,776 | $10,000 | $10,000 |
|---|
5/31/2020 | $10,080 | $10,047 | $10,381 |
|---|
6/30/2020 | $10,163 | $10,110 | $10,474 |
|---|
7/31/2020 | $10,515 | $10,261 | $10,846 |
|---|
8/31/2020 | $10,627 | $10,178 | $10,941 |
|---|
9/30/2020 | $10,571 | $10,172 | $10,851 |
|---|
10/31/2020 | $10,636 | $10,127 | $10,896 |
|---|
11/30/2020 | $10,972 | $10,226 | $11,216 |
|---|
12/31/2020 | $11,138 | $10,240 | $11,367 |
|---|
1/31/2021 | $11,216 | $10,167 | $11,404 |
|---|
2/28/2021 | $11,305 | $10,020 | $11,467 |
|---|
3/31/2021 | $11,354 | $9,895 | $11,538 |
|---|
4/30/2021 | $11,443 | $9,973 | $11,635 |
|---|
5/31/2021 | $11,501 | $10,006 | $11,675 |
|---|
6/30/2021 | $11,583 | $10,076 | $11,761 |
|---|
7/31/2021 | $11,589 | $10,189 | $11,764 |
|---|
8/31/2021 | $11,626 | $10,169 | $11,815 |
|---|
9/30/2021 | $11,665 | $10,081 | $11,832 |
|---|
10/31/2021 | $11,703 | $10,079 | $11,843 |
|---|
11/30/2021 | $11,592 | $10,108 | $11,760 |
|---|
12/31/2021 | $11,754 | $10,083 | $11,921 |
|---|
1/31/2022 | $11,599 | $9,865 | $11,745 |
|---|
2/28/2022 | $11,529 | $9,755 | $11,700 |
|---|
3/31/2022 | $11,507 | $9,484 | $11,650 |
|---|
4/30/2022 | $11,272 | $9,124 | $11,427 |
|---|
5/31/2022 | $11,261 | $9,183 | $11,428 |
|---|
6/30/2022 | $10,623 | $9,039 | $10,843 |
|---|
7/31/2022 | $11,121 | $9,260 | $11,344 |
|---|
8/31/2022 | $10,989 | $8,998 | $11,158 |
|---|
9/30/2022 | $10,675 | $8,610 | $10,869 |
|---|
10/31/2022 | $10,928 | $8,498 | $11,145 |
|---|
11/30/2022 | $11,117 | $8,811 | $11,330 |
|---|
12/31/2022 | $11,077 | $8,771 | $11,278 |
|---|
1/31/2023 | $11,402 | $9,041 | $11,606 |
|---|
2/28/2023 | $11,298 | $8,807 | $11,518 |
|---|
3/31/2023 | $11,371 | $9,031 | $11,618 |
|---|
4/30/2023 | $11,468 | $9,085 | $11,712 |
|---|
5/31/2023 | $11,411 | $8,986 | $11,645 |
|---|
6/30/2023 | $11,595 | $8,954 | $11,805 |
|---|
7/31/2023 | $11,733 | $8,948 | $11,947 |
|---|
8/31/2023 | $11,786 | $8,891 | $11,991 |
|---|
9/30/2023 | $11,753 | $8,665 | $11,916 |
|---|
10/31/2023 | $11,662 | $8,528 | $11,836 |
|---|
11/30/2023 | $12,065 | $8,914 | $12,253 |
|---|
12/31/2023 | $12,407 | $9,256 | $12,592 |
|---|
1/31/2024 | $12,468 | $9,230 | $12,605 |
|---|
2/29/2024 | $12,540 | $9,100 | $12,645 |
|---|
3/31/2024 | $12,678 | $9,184 | $12,770 |
|---|
4/30/2024 | $12,624 | $8,952 | $12,702 |
|---|
5/31/2024 | $12,751 | $9,104 | $12,826 |
|---|
6/30/2024 | $12,865 | $9,190 | $12,942 |
|---|
7/31/2024 | $13,071 | $9,405 | $13,135 |
|---|
8/31/2024 | $13,227 | $9,540 | $13,310 |
|---|
9/30/2024 | $13,395 | $9,667 | $13,450 |
|---|
10/31/2024 | $13,400 | $9,428 | $13,401 |
|---|
11/30/2024 | $13,540 | $9,527 | $13,534 |
|---|
12/31/2024 | $13,542 | $9,371 | $13,500 |
|---|
1/31/2025 | $13,686 | $9,421 | $13,668 |
|---|
2/28/2025 | $13,772 | $9,628 | $13,750 |
|---|
3/31/2025 | $13,574 | $9,632 | $13,644 |
|---|
4/30/2025 | $13,388 | $9,670 | $13,649 |
|---|
5/31/2025 | $13,719 | $9,601 | $13,838 |
|---|
6/30/2025 | $13,991 | $9,748 | $14,066 |
|---|
7/31/2025 | $14,067 | $9,723 | $14,109 |
|---|
|
|
| Average Annual Return [Table Text Block] |
AATR | 1 Year | 5 Years | Since Inception
4/30/20 |
|---|
Class A at NAV | 7.62% | 5.99% | 7.18% |
|---|
Class A with sales charge | 5.18% | 5.52% | 6.71% |
|---|
ICE BofA High Yield U.S. Corporate Cash Pay BB-B (1-5yrs) Index | 7.41% | 5.40% | 6.77% |
|---|
Bloomberg U.S. Aggregate Bond Index | 3.38% | (1.07%) | (0.53%) |
|---|
|
|
| Performance Inception Date |
Apr. 30, 2020
|
|
| No Deduction of Taxes [Text Block] |
The returns do not reflect the deduction of taxes that a shareholder would pay on Fund distributions or redemption of Fund shares.
|
|
| AssetsNet |
$ 8,607,815,333
|
|
| Holdings Count | Holding |
636
|
|
| Advisory Fees Paid, Amount |
$ 20,005,780
|
|
| InvestmentCompanyPortfolioTurnover |
140.00%
|
|
| Additional Fund Statistics [Text Block] |
Total Net Assets | $8,607,815,333 |
|---|
# of Portfolio Holdings | 636 |
|---|
Portfolio Turnover Rate | 140% |
|---|
Total Advisory Fees Paid | $20,005,780 |
|---|
|
|
| Holdings [Text Block] |
Portfolio Holdings Presented by Portfolio Allocation | %Footnote Reference* |
|---|
Asset-Backed Securities | 1.28% | Common Stocks | 0.01% | Convertible Bonds | 2.25% | Corporate Bonds | 82.01% | Floating Rate Loans | 10.83% | Foreign Government Obligations | 0.21% | Repurchase Agreements | 0.22% | Money Market FundsFootnote Reference(a) | 2.87% | Time DepositsFootnote Reference(a) | 0.32% | Total | 100.00% |
| Footnote | Description | Footnote* | Represents percent of total investments, which excludes derivatives. | Footnote(a) | Securities were purchased with the cash collateral from loaned securities. |
|
|
| Material Fund Change [Text Block] |
There were no material fund changes during the period. |
|
| Summary of Change Legend [Text Block] |
There were no material fund changes during the period.
|
|
| C000218940 |
|
|
| Shareholder Report [Line Items] |
|
|
| Fund Name |
Lord Abbett Short Duration High Yield Fund
|
|
| Class Name |
Class C
|
|
| Trading Symbol |
LSYCX
|
|
| Annual or Semi-Annual Statement [Text Block] |
This annual shareholder report contains important information about the Lord Abbett Short Duration High Yield Fund for the period of August 1, 2024 to July 31, 2025.
|
|
| Shareholder Report Annual or Semi-Annual |
Annual Shareholder Report
|
|
| Additional Information [Text Block] |
You can find additional information about the Fund at lordabbett.com/FundDocuments. You can also request this information by contacting us at 888-522-2388.
|
|
| Additional Information Phone Number |
888-522-2388
|
|
| Additional Information Website |
<span style="box-sizing: border-box; color: rgb(0, 0, 0); display: inline; flex-wrap: nowrap; font-size: 13.3333px; font-weight: 400; grid-area: auto; line-height: 20px; margin: 0px; overflow: visible; text-align: left; text-align-last: auto; white-space-collapse: preserve-breaks;">lordabbett.com/FundDocuments</span>
|
|
| Expenses [Text Block] |
What were the Fund costs for the last year?(based on a hypothetical $10,000 investment) Class Name | Costs of a $10,000 investment | Costs paid as a percentage of a $10,000 investment |
|---|
Class C | $144 | 1.39% |
|---|
|
|
| Expenses Paid, Amount |
$ 144
|
|
| Expense Ratio, Percent |
1.39%
|
|
| Factors Affecting Performance [Text Block] |
How did the Fund perform last year and what affected its performance?For the fiscal year ended July 31, 2025, the Fund returned 6.83%, reflecting performance at the net asset value (NAV) of Class C shares, with all distributions reinvested, compared to the 7.41% return of a securities market index with investment characteristics similar to those of the Fund, the ICE BofA High Yield U.S. Corporate Cash Pay BB-B (1-5yrs) Index. The Fund's broad-based securities market index, the Bloomberg U.S. Aggregate Bond Index, returned 3.38% over the same period. U.S. fixed income markets have navigated a turbulent yet resilient path over the past several quarters, shaped by macroeconomic shifts, evolving monetary policy, and political developments. In the first half of the period, performance was mixed but ultimately constructive. Resilient macroeconomic data led to credit spreads reaching multi-year tights, though momentum faded amid growth concerns, tariff uncertainty, and skepticism around AI-driven expansion. This culminated in the April 2nd “Liberation Day” U.S. tariff announcement which triggered market volatility and a sharp selloff of risk assets. Markets rebounded on trade policy concessions, as well as strong earnings, increased AI investment momentum, and consumer resilience. Top contributors to performance: Security selection within the Telecommunications, Financial Services and Technology sectors. Credit selection within Single Bs. Allocation to convertible bonds. Top detractors from performance: Credit selection within Capital Goods, Automotive and Healthcare sectors. |
|
| Performance Past Does Not Indicate Future [Text] |
The Fund's past performance is no guarantee of future results.
|
|
| Line Graph [Table Text Block] |
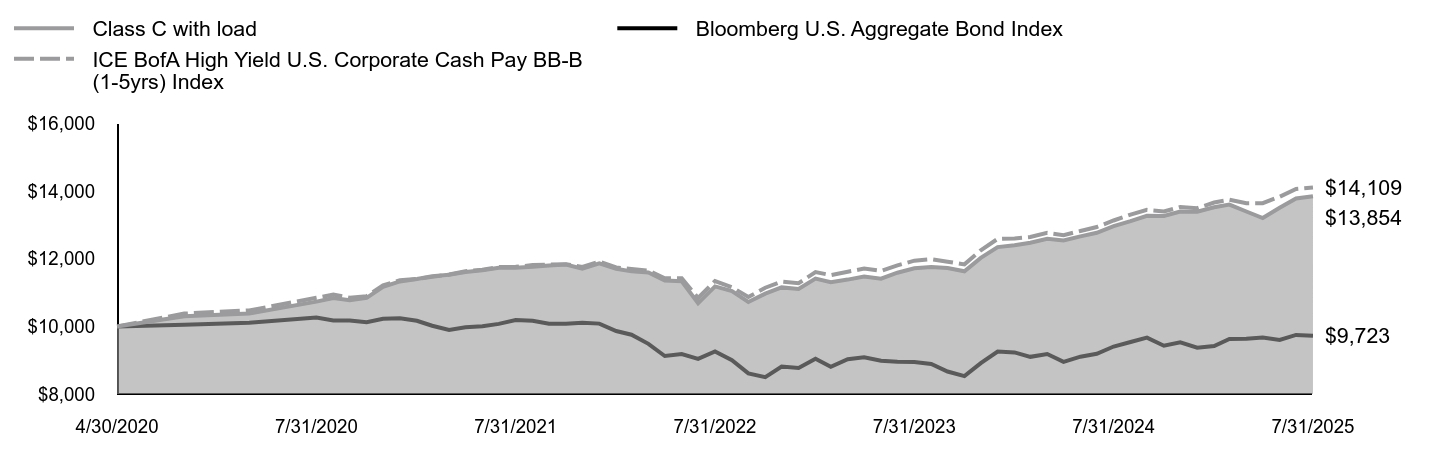 | Class C with load | Bloomberg U.S. Aggregate Bond Index | ICE BofA High Yield U.S. Corporate Cash Pay BB-B (1-5yrs) Index |
|---|
4/30/2020 | $10,000 | $10,000 | $10,000 |
|---|
5/31/2020 | $10,304 | $10,047 | $10,381 |
|---|
6/30/2020 | $10,382 | $10,110 | $10,474 |
|---|
7/31/2020 | $10,734 | $10,261 | $10,846 |
|---|
8/31/2020 | $10,842 | $10,178 | $10,941 |
|---|
9/30/2020 | $10,777 | $10,172 | $10,851 |
|---|
10/31/2020 | $10,845 | $10,127 | $10,896 |
|---|
11/30/2020 | $11,169 | $10,226 | $11,216 |
|---|
12/31/2020 | $11,331 | $10,240 | $11,367 |
|---|
1/31/2021 | $11,403 | $10,167 | $11,404 |
|---|
2/28/2021 | $11,487 | $10,020 | $11,467 |
|---|
3/31/2021 | $11,529 | $9,895 | $11,538 |
|---|
4/30/2021 | $11,611 | $9,973 | $11,635 |
|---|
5/31/2021 | $11,663 | $10,006 | $11,675 |
|---|
6/30/2021 | $11,739 | $10,076 | $11,761 |
|---|
7/31/2021 | $11,737 | $10,189 | $11,764 |
|---|
8/31/2021 | $11,768 | $10,169 | $11,815 |
|---|
9/30/2021 | $11,800 | $10,081 | $11,832 |
|---|
10/31/2021 | $11,831 | $10,079 | $11,843 |
|---|
11/30/2021 | $11,712 | $10,108 | $11,760 |
|---|
12/31/2021 | $11,869 | $10,083 | $11,921 |
|---|
1/31/2022 | $11,705 | $9,865 | $11,745 |
|---|
2/28/2022 | $11,629 | $9,755 | $11,700 |
|---|
3/31/2022 | $11,599 | $9,484 | $11,650 |
|---|
4/30/2022 | $11,356 | $9,124 | $11,427 |
|---|
5/31/2022 | $11,338 | $9,183 | $11,428 |
|---|
6/30/2022 | $10,690 | $9,039 | $10,843 |
|---|
7/31/2022 | $11,184 | $9,260 | $11,344 |
|---|
8/31/2022 | $11,045 | $8,998 | $11,158 |
|---|
9/30/2022 | $10,723 | $8,610 | $10,869 |
|---|
10/31/2022 | $10,971 | $8,498 | $11,145 |
|---|
11/30/2022 | $11,155 | $8,811 | $11,330 |
|---|
12/31/2022 | $11,109 | $8,771 | $11,278 |
|---|
1/31/2023 | $11,417 | $9,041 | $11,606 |
|---|
2/28/2023 | $11,307 | $8,807 | $11,518 |
|---|
3/31/2023 | $11,386 | $9,031 | $11,618 |
|---|
4/30/2023 | $11,476 | $9,085 | $11,712 |
|---|
5/31/2023 | $11,413 | $8,986 | $11,645 |
|---|
6/30/2023 | $11,590 | $8,954 | $11,805 |
|---|
7/31/2023 | $11,722 | $8,948 | $11,947 |
|---|
8/31/2023 | $11,757 | $8,891 | $11,991 |
|---|
9/30/2023 | $11,730 | $8,665 | $11,916 |
|---|
10/31/2023 | $11,632 | $8,528 | $11,836 |
|---|
11/30/2023 | $12,027 | $8,914 | $12,253 |
|---|
12/31/2023 | $12,348 | $9,256 | $12,592 |
|---|
1/31/2024 | $12,401 | $9,230 | $12,605 |
|---|
2/29/2024 | $12,478 | $9,100 | $12,645 |
|---|
3/31/2024 | $12,595 | $9,184 | $12,770 |
|---|
4/30/2024 | $12,547 | $8,952 | $12,702 |
|---|
5/31/2024 | $12,665 | $9,104 | $12,826 |
|---|
6/30/2024 | $12,771 | $9,190 | $12,942 |
|---|
7/31/2024 | $12,968 | $9,405 | $13,135 |
|---|
8/31/2024 | $13,115 | $9,540 | $13,310 |
|---|
9/30/2024 | $13,273 | $9,667 | $13,450 |
|---|
10/31/2024 | $13,269 | $9,428 | $13,401 |
|---|
11/30/2024 | $13,400 | $9,527 | $13,534 |
|---|
12/31/2024 | $13,394 | $9,371 | $13,500 |
|---|
1/31/2025 | $13,528 | $9,421 | $13,668 |
|---|
2/28/2025 | $13,605 | $9,628 | $13,750 |
|---|
3/31/2025 | $13,401 | $9,632 | $13,644 |
|---|
4/30/2025 | $13,209 | $9,670 | $13,649 |
|---|
5/31/2025 | $13,513 | $9,601 | $13,838 |
|---|
6/30/2025 | $13,787 | $9,748 | $14,066 |
|---|
7/31/2025 | $13,854 | $9,723 | $14,109 |
|---|
|
|
| Average Annual Return [Table Text Block] |
AATR | 1 Year | 5 Years | Since Inception
4/30/20 |
|---|
Class C at NAV | 6.83% | 5.23% | 6.40% |
|---|
Class C with sales charge | 5.84% | 5.23% | 6.40% |
|---|
ICE BofA High Yield U.S. Corporate Cash Pay BB-B (1-5yrs) Index | 7.41% | 5.40% | 6.77% |
|---|
Bloomberg U.S. Aggregate Bond Index | 3.38% | (1.07%) | (0.53%) |
|---|
|
|
| Performance Inception Date |
Apr. 30, 2020
|
|
| No Deduction of Taxes [Text Block] |
The returns do not reflect the deduction of taxes that a shareholder would pay on Fund distributions or redemption of Fund shares.
|
|
| AssetsNet |
$ 8,607,815,333
|
|
| Holdings Count | Holding |
636
|
|
| Advisory Fees Paid, Amount |
$ 20,005,780
|
|
| InvestmentCompanyPortfolioTurnover |
140.00%
|
|
| Additional Fund Statistics [Text Block] |
Total Net Assets | $8,607,815,333 |
|---|
# of Portfolio Holdings | 636 |
|---|
Portfolio Turnover Rate | 140% |
|---|
Total Advisory Fees Paid | $20,005,780 |
|---|
|
|
| Holdings [Text Block] |
Portfolio Holdings Presented by Portfolio Allocation | %Footnote Reference* |
|---|
Asset-Backed Securities | 1.28% | Common Stocks | 0.01% | Convertible Bonds | 2.25% | Corporate Bonds | 82.01% | Floating Rate Loans | 10.83% | Foreign Government Obligations | 0.21% | Repurchase Agreements | 0.22% | Money Market FundsFootnote Reference(a) | 2.87% | Time DepositsFootnote Reference(a) | 0.32% | Total | 100.00% |
| Footnote | Description | Footnote* | Represents percent of total investments, which excludes derivatives. | Footnote(a) | Securities were purchased with the cash collateral from loaned securities. |
|
|
| Material Fund Change [Text Block] |
There were no material fund changes during the period. |
|
| Summary of Change Legend [Text Block] |
There were no material fund changes during the period.
|
|
| C000218939 |
|
|
| Shareholder Report [Line Items] |
|
|
| Fund Name |
Lord Abbett Short Duration High Yield Fund
|
|
| Class Name |
Class F
|
|
| Trading Symbol |
LSYFX
|
|
| Annual or Semi-Annual Statement [Text Block] |
This annual shareholder report contains important information about the Lord Abbett Short Duration High Yield Fund for the period of August 1, 2024 to July 31, 2025.
|
|
| Shareholder Report Annual or Semi-Annual |
Annual Shareholder Report
|
|
| Additional Information [Text Block] |
You can find additional information about the Fund at lordabbett.com/FundDocuments. You can also request this information by contacting us at 888-522-2388.
|
|
| Additional Information Phone Number |
888-522-2388
|
|
| Additional Information Website |
<span style="box-sizing: border-box; color: rgb(0, 0, 0); display: inline; flex-wrap: nowrap; font-size: 13.3333px; font-weight: 400; grid-area: auto; line-height: 20px; margin: 0px; overflow: visible; text-align: left; text-align-last: auto; white-space-collapse: preserve-breaks;">lordabbett.com/FundDocuments</span>
|
|
| Expenses [Text Block] |
What were the Fund costs for the last year?(based on a hypothetical $10,000 investment) Class Name | Costs of a $10,000 investment | Costs paid as a percentage of a $10,000 investment |
|---|
Class F | $47 | 0.45% |
|---|
|
|
| Expenses Paid, Amount |
$ 47
|
|
| Expense Ratio, Percent |
0.45%
|
|
| Factors Affecting Performance [Text Block] |
How did the Fund perform last year and what affected its performance?For the fiscal year ended July 31, 2025, the Fund returned 7.83%, reflecting performance at the net asset value (NAV) of Class F shares, with all distributions reinvested, compared to the 7.41% return of a securities market index with investment characteristics similar to those of the Fund, the ICE BofA High Yield U.S. Corporate Cash Pay BB-B (1-5yrs) Index. The Fund's broad-based securities market index, the Bloomberg U.S. Aggregate Bond Index, returned 3.38% over the same period. U.S. fixed income markets have navigated a turbulent yet resilient path over the past several quarters, shaped by macroeconomic shifts, evolving monetary policy, and political developments. In the first half of the period, performance was mixed but ultimately constructive. Resilient macroeconomic data led to credit spreads reaching multi-year tights, though momentum faded amid growth concerns, tariff uncertainty, and skepticism around AI-driven expansion. This culminated in the April 2nd “Liberation Day” U.S. tariff announcement which triggered market volatility and a sharp selloff of risk assets. Markets rebounded on trade policy concessions, as well as strong earnings, increased AI investment momentum, and consumer resilience. Top contributors to performance: Security selection within the Telecommunications, Financial Services and Technology sectors. Credit selection within Single Bs. Allocation to convertible bonds. Top detractors from performance: Credit selection within Capital Goods, Automotive and Healthcare sectors. |
|
| Performance Past Does Not Indicate Future [Text] |
The Fund's past performance is no guarantee of future results.
|
|
| Line Graph [Table Text Block] |
 | Class F | Bloomberg U.S. Aggregate Bond Index | ICE BofA High Yield U.S. Corporate Cash Pay BB-B (1-5yrs) Index |
|---|
4/30/2020 | $10,000 | $10,000 | $10,000 |
|---|
5/31/2020 | $10,313 | $10,047 | $10,381 |
|---|
6/30/2020 | $10,400 | $10,110 | $10,474 |
|---|
7/31/2020 | $10,761 | $10,261 | $10,846 |
|---|
8/31/2020 | $10,878 | $10,178 | $10,941 |
|---|
9/30/2020 | $10,822 | $10,172 | $10,851 |
|---|
10/31/2020 | $10,890 | $10,127 | $10,896 |
|---|
11/30/2020 | $11,235 | $10,226 | $11,216 |
|---|
12/31/2020 | $11,407 | $10,240 | $11,367 |
|---|
1/31/2021 | $11,489 | $10,167 | $11,404 |
|---|
2/28/2021 | $11,582 | $10,020 | $11,467 |
|---|
3/31/2021 | $11,634 | $9,895 | $11,538 |
|---|
4/30/2021 | $11,727 | $9,973 | $11,635 |
|---|
5/31/2021 | $11,789 | $10,006 | $11,675 |
|---|
6/30/2021 | $11,875 | $10,076 | $11,761 |
|---|
7/31/2021 | $11,883 | $10,189 | $11,764 |
|---|
8/31/2021 | $11,924 | $10,169 | $11,815 |
|---|
9/30/2021 | $11,966 | $10,081 | $11,832 |
|---|
10/31/2021 | $11,996 | $10,079 | $11,843 |
|---|
11/30/2021 | $11,895 | $10,108 | $11,760 |
|---|
12/31/2021 | $12,063 | $10,083 | $11,921 |
|---|
1/31/2022 | $11,905 | $9,865 | $11,745 |
|---|
2/28/2022 | $11,836 | $9,755 | $11,700 |
|---|
3/31/2022 | $11,815 | $9,484 | $11,650 |
|---|
4/30/2022 | $11,575 | $9,124 | $11,427 |
|---|
5/31/2022 | $11,555 | $9,183 | $11,428 |
|---|
6/30/2022 | $10,913 | $9,039 | $10,843 |
|---|
7/31/2022 | $11,426 | $9,260 | $11,344 |
|---|
8/31/2022 | $11,281 | $8,998 | $11,158 |
|---|
9/30/2022 | $10,960 | $8,610 | $10,869 |
|---|
10/31/2022 | $11,233 | $8,498 | $11,145 |
|---|
11/30/2022 | $11,418 | $8,811 | $11,330 |
|---|
12/31/2022 | $11,390 | $8,771 | $11,278 |
|---|
1/31/2023 | $11,715 | $9,041 | $11,606 |
|---|
2/28/2023 | $11,610 | $8,807 | $11,518 |
|---|
3/31/2023 | $11,699 | $9,031 | $11,618 |
|---|
4/30/2023 | $11,799 | $9,085 | $11,712 |
|---|
5/31/2023 | $11,731 | $8,986 | $11,645 |
|---|
6/30/2023 | $11,934 | $8,954 | $11,805 |
|---|
7/31/2023 | $12,066 | $8,948 | $11,947 |
|---|
8/31/2023 | $12,123 | $8,891 | $11,991 |
|---|
9/30/2023 | $12,091 | $8,665 | $11,916 |
|---|
10/31/2023 | $11,999 | $8,528 | $11,836 |
|---|
11/30/2023 | $12,428 | $8,914 | $12,253 |
|---|
12/31/2023 | $12,770 | $9,256 | $12,592 |
|---|
1/31/2024 | $12,835 | $9,230 | $12,605 |
|---|
2/29/2024 | $12,911 | $9,100 | $12,645 |
|---|
3/31/2024 | $13,055 | $9,184 | $12,770 |
|---|
4/30/2024 | $13,001 | $8,952 | $12,702 |
|---|
5/31/2024 | $13,134 | $9,104 | $12,826 |
|---|
6/30/2024 | $13,254 | $9,190 | $12,942 |
|---|
7/31/2024 | $13,469 | $9,405 | $13,135 |
|---|
8/31/2024 | $13,646 | $9,540 | $13,310 |
|---|
9/30/2024 | $13,807 | $9,667 | $13,450 |
|---|
10/31/2024 | $13,815 | $9,428 | $13,401 |
|---|
11/30/2024 | $13,976 | $9,527 | $13,534 |
|---|
12/31/2024 | $13,966 | $9,371 | $13,500 |
|---|
1/31/2025 | $14,117 | $9,421 | $13,668 |
|---|
2/28/2025 | $14,222 | $9,628 | $13,750 |
|---|
3/31/2025 | $14,005 | $9,632 | $13,644 |
|---|
4/30/2025 | $13,815 | $9,670 | $13,649 |
|---|
5/31/2025 | $14,160 | $9,601 | $13,838 |
|---|
6/30/2025 | $14,443 | $9,748 | $14,066 |
|---|
7/31/2025 | $14,524 | $9,723 | $14,109 |
|---|
|
|
| Average Annual Return [Table Text Block] |
AATR | 1 Year | 5 Years | Since Inception
4/30/20 |
|---|
Class F at NAV | 7.83% | 6.18% | 7.36% |
|---|
ICE BofA High Yield U.S. Corporate Cash Pay BB-B (1-5yrs) Index | 7.41% | 5.40% | 6.77% |
|---|
Bloomberg U.S. Aggregate Bond Index | 3.38% | (1.07%) | (0.53%) |
|---|
|
|
| Performance Inception Date |
Apr. 30, 2020
|
|
| No Deduction of Taxes [Text Block] |
The returns do not reflect the deduction of taxes that a shareholder would pay on Fund distributions or redemption of Fund shares.
|
|
| AssetsNet |
$ 8,607,815,333
|
|
| Holdings Count | Holding |
636
|
|
| Advisory Fees Paid, Amount |
$ 20,005,780
|
|
| InvestmentCompanyPortfolioTurnover |
140.00%
|
|
| Additional Fund Statistics [Text Block] |
Total Net Assets | $8,607,815,333 |
|---|
# of Portfolio Holdings | 636 |
|---|
Portfolio Turnover Rate | 140% |
|---|
Total Advisory Fees Paid | $20,005,780 |
|---|
|
|
| Holdings [Text Block] |
Portfolio Holdings Presented by Portfolio Allocation | %Footnote Reference* |
|---|
Asset-Backed Securities | 1.28% | Common Stocks | 0.01% | Convertible Bonds | 2.25% | Corporate Bonds | 82.01% | Floating Rate Loans | 10.83% | Foreign Government Obligations | 0.21% | Repurchase Agreements | 0.22% | Money Market FundsFootnote Reference(a) | 2.87% | Time DepositsFootnote Reference(a) | 0.32% | Total | 100.00% |
| Footnote | Description | Footnote* | Represents percent of total investments, which excludes derivatives. | Footnote(a) | Securities were purchased with the cash collateral from loaned securities. |
|
|
| Material Fund Change [Text Block] |
There were no material fund changes during the period. |
|
| Summary of Change Legend [Text Block] |
There were no material fund changes during the period.
|
|
| C000218938 |
|
|
| Shareholder Report [Line Items] |
|
|
| Fund Name |
Lord Abbett Short Duration High Yield Fund
|
|
| Class Name |
Class F3
|
|
| Trading Symbol |
LSYNX
|
|
| Annual or Semi-Annual Statement [Text Block] |
This annual shareholder report contains important information about the Lord Abbett Short Duration High Yield Fund for the period of August 1, 2024 to July 31, 2025.
|
|
| Shareholder Report Annual or Semi-Annual |
Annual Shareholder Report
|
|
| Additional Information [Text Block] |
You can find additional information about the Fund at lordabbett.com/FundDocuments. You can also request this information by contacting us at 888-522-2388.
|
|
| Additional Information Phone Number |
888-522-2388
|
|
| Additional Information Website |
<span style="box-sizing: border-box; color: rgb(0, 0, 0); display: inline; flex-wrap: nowrap; font-size: 13.3333px; font-weight: 400; grid-area: auto; line-height: 20px; margin: 0px; overflow: visible; text-align: left; text-align-last: auto; white-space-collapse: preserve-breaks;">lordabbett.com/FundDocuments</span>
|
|
| Expenses [Text Block] |
What were the Fund costs for the last year?(based on a hypothetical $10,000 investment) Class Name | Costs of a $10,000 investment | Costs paid as a percentage of a $10,000 investment |
|---|
Class F3 | $38 | 0.37% |
|---|
|
|
| Expenses Paid, Amount |
$ 38
|
|
| Expense Ratio, Percent |
0.37%
|
|
| Factors Affecting Performance [Text Block] |
How did the Fund perform last year and what affected its performance?For the fiscal year ended July 31, 2025, the Fund returned 7.92%, reflecting performance at the net asset value (NAV) of Class F3 shares, with all distributions reinvested, compared to the 7.41% return of a securities market index with investment characteristics similar to those of the Fund, the ICE BofA High Yield U.S. Corporate Cash Pay BB-B (1-5yrs) Index. The Fund's broad-based securities market index, the Bloomberg U.S. Aggregate Bond Index, returned 3.38% over the same period. U.S. fixed income markets have navigated a turbulent yet resilient path over the past several quarters, shaped by macroeconomic shifts, evolving monetary policy, and political developments. In the first half of the period, performance was mixed but ultimately constructive. Resilient macroeconomic data led to credit spreads reaching multi-year tights, though momentum faded amid growth concerns, tariff uncertainty, and skepticism around AI-driven expansion. This culminated in the April 2nd “Liberation Day” U.S. tariff announcement which triggered market volatility and a sharp selloff of risk assets. Markets rebounded on trade policy concessions, as well as strong earnings, increased AI investment momentum, and consumer resilience. Top contributors to performance: Security selection within the Telecommunications, Financial Services and Technology sectors. Credit selection within Single Bs. Allocation to convertible bonds. Top detractors from performance: Credit selection within Capital Goods, Automotive and Healthcare sectors. |
|
| Performance Past Does Not Indicate Future [Text] |
The Fund's past performance is no guarantee of future results.
|
|
| Line Graph [Table Text Block] |
 | Class F3 | Bloomberg U.S. Aggregate Bond Index | ICE BofA High Yield U.S. Corporate Cash Pay BB-B (1-5yrs) Index |
|---|
4/30/2020 | $10,000 | $10,000 | $10,000 |
|---|
5/31/2020 | $10,314 | $10,047 | $10,381 |
|---|
6/30/2020 | $10,401 | $10,110 | $10,474 |
|---|
7/31/2020 | $10,763 | $10,261 | $10,846 |
|---|
8/31/2020 | $10,880 | $10,178 | $10,941 |
|---|
9/30/2020 | $10,825 | $10,172 | $10,851 |
|---|
10/31/2020 | $10,893 | $10,127 | $10,896 |
|---|
11/30/2020 | $11,239 | $10,226 | $11,216 |
|---|
12/31/2020 | $11,411 | $10,240 | $11,367 |
|---|
1/31/2021 | $11,495 | $10,167 | $11,404 |
|---|
2/28/2021 | $11,589 | $10,020 | $11,467 |
|---|
3/31/2021 | $11,641 | $9,895 | $11,538 |
|---|
4/30/2021 | $11,735 | $9,973 | $11,635 |
|---|
5/31/2021 | $11,798 | $10,006 | $11,675 |
|---|
6/30/2021 | $11,884 | $10,076 | $11,761 |
|---|
7/31/2021 | $11,893 | $10,189 | $11,764 |
|---|
8/31/2021 | $11,935 | $10,169 | $11,815 |
|---|
9/30/2021 | $11,977 | $10,081 | $11,832 |
|---|
10/31/2021 | $12,019 | $10,079 | $11,843 |
|---|
11/30/2021 | $11,908 | $10,108 | $11,760 |
|---|
12/31/2021 | $12,077 | $10,083 | $11,921 |
|---|
1/31/2022 | $11,920 | $9,865 | $11,745 |
|---|
2/28/2022 | $11,851 | $9,755 | $11,700 |
|---|
3/31/2022 | $11,830 | $9,484 | $11,650 |
|---|
4/30/2022 | $11,591 | $9,124 | $11,427 |
|---|
5/31/2022 | $11,582 | $9,183 | $11,428 |
|---|
6/30/2022 | $10,929 | $9,039 | $10,843 |
|---|
7/31/2022 | $11,443 | $9,260 | $11,344 |
|---|
8/31/2022 | $11,309 | $8,998 | $11,158 |
|---|
9/30/2022 | $10,988 | $8,610 | $10,869 |
|---|
10/31/2022 | $11,251 | $8,498 | $11,145 |
|---|
11/30/2022 | $11,447 | $8,811 | $11,330 |
|---|
12/31/2022 | $11,408 | $8,771 | $11,278 |
|---|
1/31/2023 | $11,746 | $9,041 | $11,606 |
|---|
2/28/2023 | $11,641 | $8,807 | $11,518 |
|---|
3/31/2023 | $11,718 | $9,031 | $11,618 |
|---|
4/30/2023 | $11,832 | $9,085 | $11,712 |
|---|
5/31/2023 | $11,764 | $8,986 | $11,645 |
|---|
6/30/2023 | $11,968 | $8,954 | $11,805 |
|---|
7/31/2023 | $12,100 | $8,948 | $11,947 |
|---|
8/31/2023 | $12,158 | $8,891 | $11,991 |
|---|
9/30/2023 | $12,126 | $8,665 | $11,916 |
|---|
10/31/2023 | $12,034 | $8,528 | $11,836 |
|---|
11/30/2023 | $12,465 | $8,914 | $12,253 |
|---|
12/31/2023 | $12,808 | $9,256 | $12,592 |
|---|
1/31/2024 | $12,874 | $9,230 | $12,605 |
|---|
2/29/2024 | $12,952 | $9,100 | $12,645 |
|---|
3/31/2024 | $13,097 | $9,184 | $12,770 |
|---|
4/30/2024 | $13,044 | $8,952 | $12,702 |
|---|
5/31/2024 | $13,179 | $9,104 | $12,826 |
|---|
6/30/2024 | $13,300 | $9,190 | $12,942 |
|---|
7/31/2024 | $13,516 | $9,405 | $13,135 |
|---|
8/31/2024 | $13,695 | $9,540 | $13,310 |
|---|
9/30/2024 | $13,858 | $9,667 | $13,450 |
|---|
10/31/2024 | $13,866 | $9,428 | $13,401 |
|---|
11/30/2024 | $14,029 | $9,527 | $13,534 |
|---|
12/31/2024 | $14,020 | $9,371 | $13,500 |
|---|
1/31/2025 | $14,187 | $9,421 | $13,668 |
|---|
2/28/2025 | $14,279 | $9,628 | $13,750 |
|---|
3/31/2025 | $14,063 | $9,632 | $13,644 |
|---|
4/30/2025 | $13,888 | $9,670 | $13,649 |
|---|
5/31/2025 | $14,220 | $9,601 | $13,838 |
|---|
6/30/2025 | $14,505 | $9,748 | $14,066 |
|---|
7/31/2025 | $14,588 | $9,723 | $14,109 |
|---|
|
|
| Average Annual Return [Table Text Block] |
AATR | 1 Year | 5 Years | Since Inception
4/30/20 |
|---|
Class F3 at NAV | 7.92% | 6.27% | 7.45% |
|---|
ICE BofA High Yield U.S. Corporate Cash Pay BB-B (1-5yrs) Index | 7.41% | 5.40% | 6.77% |
|---|
Bloomberg U.S. Aggregate Bond Index | 3.38% | (1.07%) | (0.53%) |
|---|
|
|
| Performance Inception Date |
Apr. 30, 2020
|
|
| No Deduction of Taxes [Text Block] |
The returns do not reflect the deduction of taxes that a shareholder would pay on Fund distributions or redemption of Fund shares.
|
|
| AssetsNet |
$ 8,607,815,333
|
|
| Holdings Count | Holding |
636
|
|
| Advisory Fees Paid, Amount |
$ 20,005,780
|
|
| InvestmentCompanyPortfolioTurnover |
140.00%
|
|
| Additional Fund Statistics [Text Block] |
Total Net Assets | $8,607,815,333 |
|---|
# of Portfolio Holdings | 636 |
|---|
Portfolio Turnover Rate | 140% |
|---|
Total Advisory Fees Paid | $20,005,780 |
|---|
|
|
| Holdings [Text Block] |
Portfolio Holdings Presented by Portfolio Allocation | %Footnote Reference* |
|---|
Asset-Backed Securities | 1.28% | Common Stocks | 0.01% | Convertible Bonds | 2.25% | Corporate Bonds | 82.01% | Floating Rate Loans | 10.83% | Foreign Government Obligations | 0.21% | Repurchase Agreements | 0.22% | Money Market FundsFootnote Reference(a) | 2.87% | Time DepositsFootnote Reference(a) | 0.32% | Total | 100.00% |
| Footnote | Description | Footnote* | Represents percent of total investments, which excludes derivatives. | Footnote(a) | Securities were purchased with the cash collateral from loaned securities. |
|
|
| Material Fund Change [Text Block] |
There were no material fund changes during the period. |
|
| Summary of Change Legend [Text Block] |
There were no material fund changes during the period.
|
|
| C000218937 |
|
|
| Shareholder Report [Line Items] |
|
|
| Fund Name |
Lord Abbett Short Duration High Yield Fund
|
|
| Class Name |
Class I
|
|
| Trading Symbol |
LSYIX
|
|
| Annual or Semi-Annual Statement [Text Block] |
This annual shareholder report contains important information about the Lord Abbett Short Duration High Yield Fund for the period of August 1, 2024 to July 31, 2025.
|
|
| Shareholder Report Annual or Semi-Annual |
Annual Shareholder Report
|
|
| Additional Information [Text Block] |
You can find additional information about the Fund at lordabbett.com/FundDocuments. You can also request this information by contacting us at 888-522-2388.
|
|
| Additional Information Phone Number |
888-522-2388
|
|
| Additional Information Website |
<span style="box-sizing: border-box; color: rgb(0, 0, 0); display: inline; flex-wrap: nowrap; font-size: 13.3333px; font-weight: 400; grid-area: auto; line-height: 20px; margin: 0px; overflow: visible; text-align: left; text-align-last: auto; white-space-collapse: preserve-breaks;">lordabbett.com/FundDocuments</span>
|
|
| Expenses [Text Block] |
What were the Fund costs for the last year?(based on a hypothetical $10,000 investment) Class Name | Costs of a $10,000 investment | Costs paid as a percentage of a $10,000 investment |
|---|
Class I | $47 | 0.45% |
|---|
|
|
| Expenses Paid, Amount |
$ 47
|
|
| Expense Ratio, Percent |
0.45%
|
|
| Factors Affecting Performance [Text Block] |
How did the Fund perform last year and what affected its performance?For the fiscal year ended July 31, 2025, the Fund returned 7.83%, reflecting performance at the net asset value (NAV) of Class I shares, with all distributions reinvested, compared to the 7.41% return of a securities market index with investment characteristics similar to those of the Fund, the ICE BofA High Yield U.S. Corporate Cash Pay BB-B (1-5yrs) Index. The Fund's broad-based securities market index, the Bloomberg U.S. Aggregate Bond Index, returned 3.38% over the same period. U.S. fixed income markets have navigated a turbulent yet resilient path over the past several quarters, shaped by macroeconomic shifts, evolving monetary policy, and political developments. In the first half of the period, performance was mixed but ultimately constructive. Resilient macroeconomic data led to credit spreads reaching multi-year tights, though momentum faded amid growth concerns, tariff uncertainty, and skepticism around AI-driven expansion. This culminated in the April 2nd “Liberation Day” U.S. tariff announcement which triggered market volatility and a sharp selloff of risk assets. Markets rebounded on trade policy concessions, as well as strong earnings, increased AI investment momentum, and consumer resilience. Top contributors to performance: Security selection within the Telecommunications, Financial Services and Technology sectors. Credit selection within Single Bs. Allocation to convertible bonds. Top detractors from performance: Credit selection within Capital Goods, Automotive and Healthcare sectors. |
|
| Performance Past Does Not Indicate Future [Text] |
The Fund's past performance is no guarantee of future results.
|
|
| Line Graph [Table Text Block] |
 | Class I | Bloomberg U.S. Aggregate Bond Index | ICE BofA High Yield U.S. Corporate Cash Pay BB-B (1-5yrs) Index |
|---|
4/30/2020 | $10,000 | $10,000 | $10,000 |
|---|
5/31/2020 | $10,313 | $10,047 | $10,381 |
|---|
6/30/2020 | $10,400 | $10,110 | $10,474 |
|---|
7/31/2020 | $10,761 | $10,261 | $10,846 |
|---|
8/31/2020 | $10,878 | $10,178 | $10,941 |
|---|
9/30/2020 | $10,822 | $10,172 | $10,851 |
|---|
10/31/2020 | $10,890 | $10,127 | $10,896 |
|---|
11/30/2020 | $11,235 | $10,226 | $11,216 |
|---|
12/31/2020 | $11,408 | $10,240 | $11,367 |
|---|
1/31/2021 | $11,490 | $10,167 | $11,404 |
|---|
2/28/2021 | $11,584 | $10,020 | $11,467 |
|---|
3/31/2021 | $11,636 | $9,895 | $11,538 |
|---|
4/30/2021 | $11,729 | $9,973 | $11,635 |
|---|
5/31/2021 | $11,791 | $10,006 | $11,675 |
|---|
6/30/2021 | $11,877 | $10,076 | $11,761 |
|---|
7/31/2021 | $11,885 | $10,189 | $11,764 |
|---|
8/31/2021 | $11,926 | $10,169 | $11,815 |
|---|
9/30/2021 | $11,968 | $10,081 | $11,832 |
|---|
10/31/2021 | $12,009 | $10,079 | $11,843 |
|---|
11/30/2021 | $11,897 | $10,108 | $11,760 |
|---|
12/31/2021 | $12,066 | $10,083 | $11,921 |
|---|
1/31/2022 | $11,908 | $9,865 | $11,745 |
|---|
2/28/2022 | $11,839 | $9,755 | $11,700 |
|---|
3/31/2022 | $11,817 | $9,484 | $11,650 |
|---|
4/30/2022 | $11,578 | $9,124 | $11,427 |
|---|
5/31/2022 | $11,558 | $9,183 | $11,428 |
|---|
6/30/2022 | $10,904 | $9,039 | $10,843 |
|---|
7/31/2022 | $11,417 | $9,260 | $11,344 |
|---|
8/31/2022 | $11,283 | $8,998 | $11,158 |
|---|
9/30/2022 | $10,962 | $8,610 | $10,869 |
|---|
10/31/2022 | $11,224 | $8,498 | $11,145 |
|---|
11/30/2022 | $11,408 | $8,811 | $11,330 |
|---|
12/31/2022 | $11,381 | $8,771 | $11,278 |
|---|
1/31/2023 | $11,705 | $9,041 | $11,606 |
|---|
2/28/2023 | $11,600 | $8,807 | $11,518 |
|---|
3/31/2023 | $11,677 | $9,031 | $11,618 |
|---|
4/30/2023 | $11,790 | $9,085 | $11,712 |
|---|
5/31/2023 | $11,722 | $8,986 | $11,645 |
|---|
6/30/2023 | $11,925 | $8,954 | $11,805 |
|---|
7/31/2023 | $12,057 | $8,948 | $11,947 |
|---|
8/31/2023 | $12,113 | $8,891 | $11,991 |
|---|
9/30/2023 | $12,081 | $8,665 | $11,916 |
|---|
10/31/2023 | $11,989 | $8,528 | $11,836 |
|---|
11/30/2023 | $12,418 | $8,914 | $12,253 |
|---|
12/31/2023 | $12,760 | $9,256 | $12,592 |
|---|
1/31/2024 | $12,825 | $9,230 | $12,605 |
|---|
2/29/2024 | $12,901 | $9,100 | $12,645 |
|---|
3/31/2024 | $13,045 | $9,184 | $12,770 |
|---|
4/30/2024 | $12,991 | $8,952 | $12,702 |
|---|
5/31/2024 | $13,124 | $9,104 | $12,826 |
|---|
6/30/2024 | $13,244 | $9,190 | $12,942 |
|---|
7/31/2024 | $13,459 | $9,405 | $13,135 |
|---|
8/31/2024 | $13,622 | $9,540 | $13,310 |
|---|
9/30/2024 | $13,797 | $9,667 | $13,450 |
|---|
10/31/2024 | $13,804 | $9,428 | $13,401 |
|---|
11/30/2024 | $13,951 | $9,527 | $13,534 |
|---|
12/31/2024 | $13,955 | $9,371 | $13,500 |
|---|
1/31/2025 | $14,106 | $9,421 | $13,668 |
|---|
2/28/2025 | $14,197 | $9,628 | $13,750 |
|---|
3/31/2025 | $13,994 | $9,632 | $13,644 |
|---|
4/30/2025 | $13,804 | $9,670 | $13,649 |
|---|
5/31/2025 | $14,149 | $9,601 | $13,838 |
|---|
6/30/2025 | $14,432 | $9,748 | $14,066 |
|---|
7/31/2025 | $14,513 | $9,723 | $14,109 |
|---|
|
|
| Average Annual Return [Table Text Block] |
AATR | 1 Year | 5 Years | Since Inception
4/30/20 |
|---|
Class I at NAV | 7.83% | 6.16% | 7.35% |
|---|
ICE BofA High Yield U.S. Corporate Cash Pay BB-B (1-5yrs) Index | 7.41% | 5.40% | 6.77% |
|---|
Bloomberg U.S. Aggregate Bond Index | 3.38% | (1.07%) | (0.53%) |
|---|
|
|
| Performance Inception Date |
Apr. 30, 2020
|
|
| No Deduction of Taxes [Text Block] |
The returns do not reflect the deduction of taxes that a shareholder would pay on Fund distributions or redemption of Fund shares.
|
|
| AssetsNet |
$ 8,607,815,333
|
|
| Holdings Count | Holding |
636
|
|
| Advisory Fees Paid, Amount |
$ 20,005,780
|
|
| InvestmentCompanyPortfolioTurnover |
140.00%
|
|
| Additional Fund Statistics [Text Block] |
Total Net Assets | $8,607,815,333 |
|---|
# of Portfolio Holdings | 636 |
|---|
Portfolio Turnover Rate | 140% |
|---|
Total Advisory Fees Paid | $20,005,780 |
|---|
|
|
| Holdings [Text Block] |
Portfolio Holdings Presented by Portfolio Allocation | %Footnote Reference* |
|---|
Asset-Backed Securities | 1.28% | Common Stocks | 0.01% | Convertible Bonds | 2.25% | Corporate Bonds | 82.01% | Floating Rate Loans | 10.83% | Foreign Government Obligations | 0.21% | Repurchase Agreements | 0.22% | Money Market FundsFootnote Reference(a) | 2.87% | Time DepositsFootnote Reference(a) | 0.32% | Total | 100.00% |
| Footnote | Description | Footnote* | Represents percent of total investments, which excludes derivatives. | Footnote(a) | Securities were purchased with the cash collateral from loaned securities. |
|
|
| Material Fund Change [Text Block] |
There were no material fund changes during the period. |
|
| Summary of Change Legend [Text Block] |
There were no material fund changes during the period.
|
|
| C000218935 |
|
|
| Shareholder Report [Line Items] |
|
|
| Fund Name |
Lord Abbett Short Duration High Yield Fund
|
|
| Class Name |
Class R3
|
|
| Trading Symbol |
LSYQX
|
|
| Annual or Semi-Annual Statement [Text Block] |
This annual shareholder report contains important information about the Lord Abbett Short Duration High Yield Fund for the period of August 1, 2024 to July 31, 2025.
|
|
| Shareholder Report Annual or Semi-Annual |
Annual Shareholder Report
|
|
| Additional Information [Text Block] |
You can find additional information about the Fund at lordabbett.com/FundDocuments. You can also request this information by contacting us at 888-522-2388.
|
|
| Additional Information Phone Number |
888-522-2388
|
|
| Additional Information Website |
<span style="box-sizing: border-box; color: rgb(0, 0, 0); display: inline; flex-wrap: nowrap; font-size: 13.3333px; font-weight: 400; grid-area: auto; line-height: 20px; margin: 0px; overflow: visible; text-align: left; text-align-last: auto; white-space-collapse: preserve-breaks;">lordabbett.com/FundDocuments</span>
|
|
| Expenses [Text Block] |
What were the Fund costs for the last year?(based on a hypothetical $10,000 investment) Class Name | Costs of a $10,000 investment | Costs paid as a percentage of a $10,000 investment |
|---|
Class R3 | $98 | 0.95% |
|---|
|
|
| Expenses Paid, Amount |
$ 98
|
|
| Expense Ratio, Percent |
0.95%
|
|
| Factors Affecting Performance [Text Block] |
How did the Fund perform last year and what affected its performance?For the fiscal year ended July 31, 2025, the Fund returned 7.31%, reflecting performance at the net asset value (NAV) of Class R3 shares, with all distributions reinvested, compared to the 7.41% return of a securities market index with investment characteristics similar to those of the Fund, the ICE BofA High Yield U.S. Corporate Cash Pay BB-B (1-5yrs) Index. The Fund's broad-based securities market index, the Bloomberg U.S. Aggregate Bond Index, returned 3.38% over the same period. U.S. fixed income markets have navigated a turbulent yet resilient path over the past several quarters, shaped by macroeconomic shifts, evolving monetary policy, and political developments. In the first half of the period, performance was mixed but ultimately constructive. Resilient macroeconomic data led to credit spreads reaching multi-year tights, though momentum faded amid growth concerns, tariff uncertainty, and skepticism around AI-driven expansion. This culminated in the April 2nd “Liberation Day” U.S. tariff announcement which triggered market volatility and a sharp selloff of risk assets. Markets rebounded on trade policy concessions, as well as strong earnings, increased AI investment momentum, and consumer resilience. Top contributors to performance: Security selection within the Telecommunications, Financial Services and Technology sectors. Credit selection within Single Bs. Allocation to convertible bonds. Top detractors from performance: Credit selection within Capital Goods, Automotive and Healthcare sectors. |
|
| Performance Past Does Not Indicate Future [Text] |
The Fund's past performance is no guarantee of future results.
|
|
| Line Graph [Table Text Block] |
 | Class R3 | Bloomberg U.S. Aggregate Bond Index | ICE BofA High Yield U.S. Corporate Cash Pay BB-B (1-5yrs) Index |
|---|
4/30/2020 | $10,000 | $10,000 | $10,000 |
|---|
5/31/2020 | $10,309 | $10,047 | $10,381 |
|---|
6/30/2020 | $10,391 | $10,110 | $10,474 |
|---|
7/31/2020 | $10,748 | $10,261 | $10,846 |
|---|
8/31/2020 | $10,859 | $10,178 | $10,941 |
|---|
9/30/2020 | $10,799 | $10,172 | $10,851 |
|---|
10/31/2020 | $10,862 | $10,127 | $10,896 |
|---|
11/30/2020 | $11,201 | $10,226 | $11,216 |
|---|
12/31/2020 | $11,368 | $10,240 | $11,367 |
|---|
1/31/2021 | $11,445 | $10,167 | $11,404 |
|---|
2/28/2021 | $11,534 | $10,020 | $11,467 |
|---|
3/31/2021 | $11,581 | $9,895 | $11,538 |
|---|
4/30/2021 | $11,668 | $9,973 | $11,635 |
|---|
5/31/2021 | $11,725 | $10,006 | $11,675 |
|---|
6/30/2021 | $11,805 | $10,076 | $11,761 |
|---|
7/31/2021 | $11,809 | $10,189 | $11,764 |
|---|
8/31/2021 | $11,844 | $10,169 | $11,815 |
|---|
9/30/2021 | $11,881 | $10,081 | $11,832 |
|---|
10/31/2021 | $11,917 | $10,079 | $11,843 |
|---|
11/30/2021 | $11,801 | $10,108 | $11,760 |
|---|
12/31/2021 | $11,963 | $10,083 | $11,921 |
|---|
1/31/2022 | $11,802 | $9,865 | $11,745 |
|---|
2/28/2022 | $11,729 | $9,755 | $11,700 |
|---|
3/31/2022 | $11,703 | $9,484 | $11,650 |
|---|
4/30/2022 | $11,462 | $9,124 | $11,427 |
|---|
5/31/2022 | $11,448 | $9,183 | $11,428 |
|---|
6/30/2022 | $10,797 | $9,039 | $10,843 |
|---|
7/31/2022 | $11,300 | $9,260 | $11,344 |
|---|
8/31/2022 | $11,163 | $8,998 | $11,158 |
|---|
9/30/2022 | $10,841 | $8,610 | $10,869 |
|---|
10/31/2022 | $11,095 | $8,498 | $11,145 |
|---|
11/30/2022 | $11,285 | $8,811 | $11,330 |
|---|
12/31/2022 | $11,241 | $8,771 | $11,278 |
|---|
1/31/2023 | $11,568 | $9,041 | $11,606 |
|---|
2/28/2023 | $11,460 | $8,807 | $11,518 |
|---|
3/31/2023 | $11,532 | $9,031 | $11,618 |
|---|
4/30/2023 | $11,639 | $9,085 | $11,712 |
|---|
5/31/2023 | $11,566 | $8,986 | $11,645 |
|---|
6/30/2023 | $11,762 | $8,954 | $11,805 |
|---|
7/31/2023 | $11,887 | $8,948 | $11,947 |
|---|
8/31/2023 | $11,938 | $8,891 | $11,991 |
|---|
9/30/2023 | $11,901 | $8,665 | $11,916 |
|---|
10/31/2023 | $11,806 | $8,528 | $11,836 |
|---|
11/30/2023 | $12,210 | $8,914 | $12,253 |
|---|
12/31/2023 | $12,554 | $9,256 | $12,592 |
|---|
1/31/2024 | $12,613 | $9,230 | $12,605 |
|---|
2/29/2024 | $12,683 | $9,100 | $12,645 |
|---|
3/31/2024 | $12,806 | $9,184 | $12,770 |
|---|
4/30/2024 | $12,761 | $8,952 | $12,702 |
|---|
5/31/2024 | $12,886 | $9,104 | $12,826 |
|---|
6/30/2024 | $12,998 | $9,190 | $12,942 |
|---|
7/31/2024 | $13,203 | $9,405 | $13,135 |
|---|
8/31/2024 | $13,358 | $9,540 | $13,310 |
|---|
9/30/2024 | $13,524 | $9,667 | $13,450 |
|---|
10/31/2024 | $13,512 | $9,428 | $13,401 |
|---|
11/30/2024 | $13,664 | $9,527 | $13,534 |
|---|
12/31/2024 | $13,663 | $9,371 | $13,500 |
|---|
1/31/2025 | $13,804 | $9,421 | $13,668 |
|---|
2/28/2025 | $13,888 | $9,628 | $13,750 |
|---|
3/31/2025 | $13,684 | $9,632 | $13,644 |
|---|
4/30/2025 | $13,494 | $9,670 | $13,649 |
|---|
5/31/2025 | $13,810 | $9,601 | $13,838 |
|---|
6/30/2025 | $14,095 | $9,748 | $14,066 |
|---|
7/31/2025 | $14,168 | $9,723 | $14,109 |
|---|
|
|
| Average Annual Return [Table Text Block] |
AATR | 1 Year | 5 Years | Since Inception
4/30/20 |
|---|
Class R3 at NAV | 7.31% | 5.68% | 6.86% |
|---|
ICE BofA High Yield U.S. Corporate Cash Pay BB-B (1-5yrs) Index | 7.41% | 5.40% | 6.77% |
|---|
Bloomberg U.S. Aggregate Bond Index | 3.38% | (1.07%) | (0.53%) |
|---|
|
|
| Performance Inception Date |
Apr. 30, 2020
|
|
| No Deduction of Taxes [Text Block] |
The returns do not reflect the deduction of taxes that a shareholder would pay on Fund distributions or redemption of Fund shares.
|
|
| AssetsNet |
$ 8,607,815,333
|
|
| Holdings Count | Holding |
636
|
|
| Advisory Fees Paid, Amount |
$ 20,005,780
|
|
| InvestmentCompanyPortfolioTurnover |
140.00%
|
|
| Additional Fund Statistics [Text Block] |
Total Net Assets | $8,607,815,333 |
|---|
# of Portfolio Holdings | 636 |
|---|
Portfolio Turnover Rate | 140% |
|---|
Total Advisory Fees Paid | $20,005,780 |
|---|
|
|
| Holdings [Text Block] |
Portfolio Holdings Presented by Portfolio Allocation | %Footnote Reference* |
|---|
Asset-Backed Securities | 1.28% | Common Stocks | 0.01% | Convertible Bonds | 2.25% | Corporate Bonds | 82.01% | Floating Rate Loans | 10.83% | Foreign Government Obligations | 0.21% | Repurchase Agreements | 0.22% | Money Market FundsFootnote Reference(a) | 2.87% | Time DepositsFootnote Reference(a) | 0.32% | Total | 100.00% |
| Footnote | Description | Footnote* | Represents percent of total investments, which excludes derivatives. | Footnote(a) | Securities were purchased with the cash collateral from loaned securities. |
|
|
| Material Fund Change [Text Block] |
There were no material fund changes during the period. |
|
| Summary of Change Legend [Text Block] |
There were no material fund changes during the period.
|
|
| C000218934 |
|
|
| Shareholder Report [Line Items] |
|
|
| Fund Name |
Lord Abbett Short Duration High Yield Fund
|
|
| Class Name |
Class R4
|
|
| Trading Symbol |
LSYSX
|
|
| Annual or Semi-Annual Statement [Text Block] |
This annual shareholder report contains important information about the Lord Abbett Short Duration High Yield Fund for the period of August 1, 2024 to July 31, 2025.
|
|
| Shareholder Report Annual or Semi-Annual |
Annual Shareholder Report
|
|
| Additional Information [Text Block] |
You can find additional information about the Fund at lordabbett.com/FundDocuments. You can also request this information by contacting us at 888-522-2388.
|
|
| Additional Information Phone Number |
888-522-2388
|
|
| Additional Information Website |
<span style="box-sizing: border-box; color: rgb(0, 0, 0); display: inline; flex-wrap: nowrap; font-size: 13.3333px; font-weight: 400; grid-area: auto; line-height: 20px; margin: 0px; overflow: visible; text-align: left; text-align-last: auto; white-space-collapse: preserve-breaks;">lordabbett.com/FundDocuments</span>
|
|
| Expenses [Text Block] |
What were the Fund costs for the last year?(based on a hypothetical $10,000 investment) Class Name | Costs of a $10,000 investment | Costs paid as a percentage of a $10,000 investment |
|---|
Class R4 | $73 | 0.70% |
|---|
|
|
| Expenses Paid, Amount |
$ 73
|
|
| Expense Ratio, Percent |
0.70%
|
|
| Factors Affecting Performance [Text Block] |
How did the Fund perform last year and what affected its performance?For the fiscal year ended July 31, 2025, the Fund returned 7.56%, reflecting performance at the net asset value (NAV) of Class R4 shares, with all distributions reinvested, compared to the 7.41% return of a securities market index with investment characteristics similar to those of the Fund, the ICE BofA High Yield U.S. Corporate Cash Pay BB-B (1-5yrs) Index. The Fund's broad-based securities market index, the Bloomberg U.S. Aggregate Bond Index, returned 3.38% over the same period. U.S. fixed income markets have navigated a turbulent yet resilient path over the past several quarters, shaped by macroeconomic shifts, evolving monetary policy, and political developments. In the first half of the period, performance was mixed but ultimately constructive. Resilient macroeconomic data led to credit spreads reaching multi-year tights, though momentum faded amid growth concerns, tariff uncertainty, and skepticism around AI-driven expansion. This culminated in the April 2nd “Liberation Day” U.S. tariff announcement which triggered market volatility and a sharp selloff of risk assets. Markets rebounded on trade policy concessions, as well as strong earnings, increased AI investment momentum, and consumer resilience. Top contributors to performance: Security selection within the Telecommunications, Financial Services and Technology sectors. Credit selection within Single Bs. Allocation to convertible bonds. Top detractors from performance: Credit selection within Capital Goods, Automotive and Healthcare sectors. |
|
| Performance Past Does Not Indicate Future [Text] |
The Fund's past performance is no guarantee of future results.
|
|
| Line Graph [Table Text Block] |
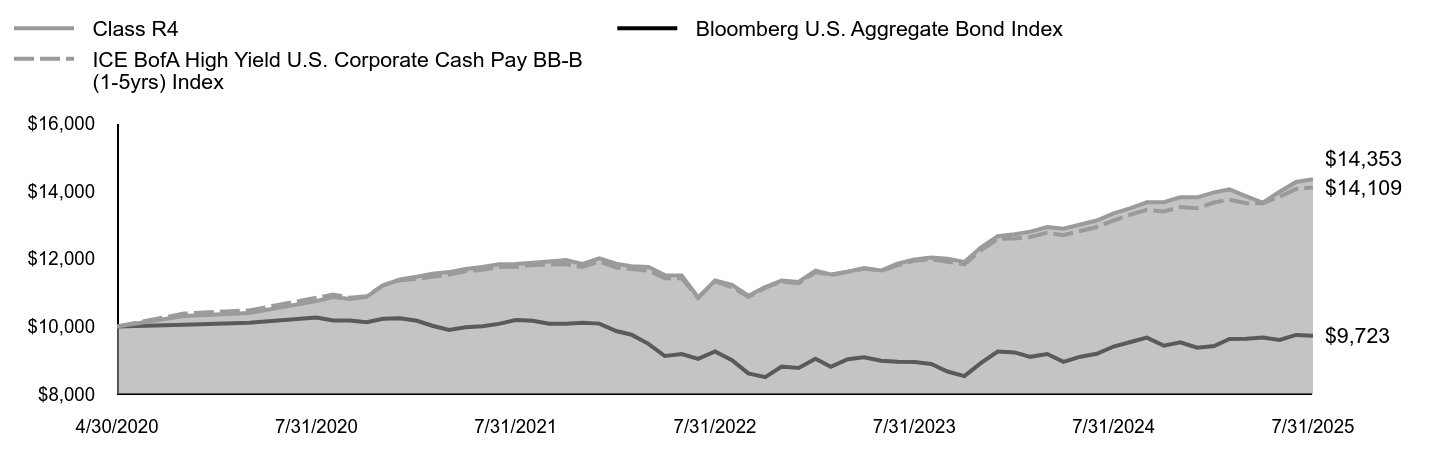 | Class R4 | Bloomberg U.S. Aggregate Bond Index | ICE BofA High Yield U.S. Corporate Cash Pay BB-B (1-5yrs) Index |
|---|
4/30/2020 | $10,000 | $10,000 | $10,000 |
|---|
5/31/2020 | $10,311 | $10,047 | $10,381 |
|---|
6/30/2020 | $10,395 | $10,110 | $10,474 |
|---|
7/31/2020 | $10,754 | $10,261 | $10,846 |
|---|
8/31/2020 | $10,869 | $10,178 | $10,941 |
|---|
9/30/2020 | $10,810 | $10,172 | $10,851 |
|---|
10/31/2020 | $10,876 | $10,127 | $10,896 |
|---|
11/30/2020 | $11,218 | $10,226 | $11,216 |
|---|
12/31/2020 | $11,388 | $10,240 | $11,367 |
|---|
1/31/2021 | $11,468 | $10,167 | $11,404 |
|---|
2/28/2021 | $11,559 | $10,020 | $11,467 |
|---|
3/31/2021 | $11,608 | $9,895 | $11,538 |
|---|
4/30/2021 | $11,698 | $9,973 | $11,635 |
|---|
5/31/2021 | $11,757 | $10,006 | $11,675 |
|---|
6/30/2021 | $11,840 | $10,076 | $11,761 |
|---|
7/31/2021 | $11,846 | $10,189 | $11,764 |
|---|
8/31/2021 | $11,884 | $10,169 | $11,815 |
|---|
9/30/2021 | $11,923 | $10,081 | $11,832 |
|---|
10/31/2021 | $11,962 | $10,079 | $11,843 |
|---|
11/30/2021 | $11,847 | $10,108 | $11,760 |
|---|
12/31/2021 | $12,013 | $10,083 | $11,921 |
|---|
1/31/2022 | $11,854 | $9,865 | $11,745 |
|---|
2/28/2022 | $11,782 | $9,755 | $11,700 |
|---|
3/31/2022 | $11,759 | $9,484 | $11,650 |
|---|
4/30/2022 | $11,518 | $9,124 | $11,427 |
|---|
5/31/2022 | $11,507 | $9,183 | $11,428 |
|---|
6/30/2022 | $10,855 | $9,039 | $10,843 |
|---|
7/31/2022 | $11,363 | $9,260 | $11,344 |
|---|
8/31/2022 | $11,228 | $8,998 | $11,158 |
|---|
9/30/2022 | $10,907 | $8,610 | $10,869 |
|---|
10/31/2022 | $11,165 | $8,498 | $11,145 |
|---|
11/30/2022 | $11,357 | $8,811 | $11,330 |
|---|
12/31/2022 | $11,316 | $8,771 | $11,278 |
|---|
1/31/2023 | $11,648 | $9,041 | $11,606 |
|---|
2/28/2023 | $11,541 | $8,807 | $11,518 |
|---|
3/31/2023 | $11,616 | $9,031 | $11,618 |
|---|
4/30/2023 | $11,726 | $9,085 | $11,712 |
|---|
5/31/2023 | $11,655 | $8,986 | $11,645 |
|---|
6/30/2023 | $11,855 | $8,954 | $11,805 |
|---|
7/31/2023 | $11,983 | $8,948 | $11,947 |
|---|
8/31/2023 | $12,038 | $8,891 | $11,991 |
|---|
9/30/2023 | $12,003 | $8,665 | $11,916 |
|---|
10/31/2023 | $11,910 | $8,528 | $11,836 |
|---|
11/30/2023 | $12,333 | $8,914 | $12,253 |
|---|
12/31/2023 | $12,669 | $9,256 | $12,592 |
|---|
1/31/2024 | $12,731 | $9,230 | $12,605 |
|---|
2/29/2024 | $12,805 | $9,100 | $12,645 |
|---|
3/31/2024 | $12,944 | $9,184 | $12,770 |
|---|
4/30/2024 | $12,889 | $8,952 | $12,702 |
|---|
5/31/2024 | $13,018 | $9,104 | $12,826 |
|---|
6/30/2024 | $13,133 | $9,190 | $12,942 |
|---|
7/31/2024 | $13,344 | $9,405 | $13,135 |
|---|
8/31/2024 | $13,503 | $9,540 | $13,310 |
|---|
9/30/2024 | $13,673 | $9,667 | $13,450 |
|---|
10/31/2024 | $13,677 | $9,428 | $13,401 |
|---|
11/30/2024 | $13,820 | $9,527 | $13,534 |
|---|
12/31/2024 | $13,821 | $9,371 | $13,500 |
|---|
1/31/2025 | $13,968 | $9,421 | $13,668 |
|---|
2/28/2025 | $14,055 | $9,628 | $13,750 |
|---|
3/31/2025 | $13,852 | $9,632 | $13,644 |
|---|
4/30/2025 | $13,661 | $9,670 | $13,649 |
|---|
5/31/2025 | $13,984 | $9,601 | $13,838 |
|---|
6/30/2025 | $14,276 | $9,748 | $14,066 |
|---|
7/31/2025 | $14,353 | $9,723 | $14,109 |
|---|
|
|
| Average Annual Return [Table Text Block] |
AATR | 1 Year | 5 Years | Since Inception
4/30/20 |
|---|
Class R4 at NAV | 7.56% | 5.94% | 7.12% |
|---|
ICE BofA High Yield U.S. Corporate Cash Pay BB-B (1-5yrs) Index | 7.41% | 5.40% | 6.77% |
|---|
Bloomberg U.S. Aggregate Bond Index | 3.38% | (1.07%) | (0.53%) |
|---|
|
|
| Performance Inception Date |
Apr. 30, 2020
|
|
| No Deduction of Taxes [Text Block] |
The returns do not reflect the deduction of taxes that a shareholder would pay on Fund distributions or redemption of Fund shares.
|
|
| AssetsNet |
$ 8,607,815,333
|
|
| Holdings Count | Holding |
636
|
|
| Advisory Fees Paid, Amount |
$ 20,005,780
|
|
| InvestmentCompanyPortfolioTurnover |
140.00%
|
|
| Additional Fund Statistics [Text Block] |
Total Net Assets | $8,607,815,333 |
|---|
# of Portfolio Holdings | 636 |
|---|
Portfolio Turnover Rate | 140% |
|---|
Total Advisory Fees Paid | $20,005,780 |
|---|
|
|
| Holdings [Text Block] |
Portfolio Holdings Presented by Portfolio Allocation | %Footnote Reference* |
|---|
Asset-Backed Securities | 1.28% | Common Stocks | 0.01% | Convertible Bonds | 2.25% | Corporate Bonds | 82.01% | Floating Rate Loans | 10.83% | Foreign Government Obligations | 0.21% | Repurchase Agreements | 0.22% | Money Market FundsFootnote Reference(a) | 2.87% | Time DepositsFootnote Reference(a) | 0.32% | Total | 100.00% |
| Footnote | Description | Footnote* | Represents percent of total investments, which excludes derivatives. | Footnote(a) | Securities were purchased with the cash collateral from loaned securities. |
|
|
| Material Fund Change [Text Block] |
There were no material fund changes during the period. |
|
| Summary of Change Legend [Text Block] |
There were no material fund changes during the period.
|
|
| C000218933 |
|
|
| Shareholder Report [Line Items] |
|
|
| Fund Name |
Lord Abbett Short Duration High Yield Fund
|
|
| Class Name |
Class R5
|
|
| Trading Symbol |
LSYTX
|
|
| Annual or Semi-Annual Statement [Text Block] |
This annual shareholder report contains important information about the Lord Abbett Short Duration High Yield Fund for the period of August 1, 2024 to July 31, 2025.
|
|
| Shareholder Report Annual or Semi-Annual |
Annual Shareholder Report
|
|
| Additional Information [Text Block] |
You can find additional information about the Fund at lordabbett.com/FundDocuments. You can also request this information by contacting us at 888-522-2388.
|
|
| Additional Information Phone Number |
888-522-2388
|
|
| Additional Information Website |
<span style="box-sizing: border-box; color: rgb(0, 0, 0); display: inline; flex-wrap: nowrap; font-size: 13.3333px; font-weight: 400; grid-area: auto; line-height: 20px; margin: 0px; overflow: visible; text-align: left; text-align-last: auto; white-space-collapse: preserve-breaks;">lordabbett.com/FundDocuments</span>
|
|
| Expenses [Text Block] |
What were the Fund costs for the last year?(based on a hypothetical $10,000 investment) Class Name | Costs of a $10,000 investment | Costs paid as a percentage of a $10,000 investment |
|---|
Class R5 | $46 | 0.44% |
|---|
|
|
| Expenses Paid, Amount |
$ 46
|
|
| Expense Ratio, Percent |
0.44%
|
|
| Factors Affecting Performance [Text Block] |
How did the Fund perform last year and what affected its performance?For the fiscal year ended July 31, 2025, the Fund returned 7.84%, reflecting performance at the net asset value (NAV) of Class R5 shares, with all distributions reinvested, compared to the 7.41% return of a securities market index with investment characteristics similar to those of the Fund, the ICE BofA High Yield U.S. Corporate Cash Pay BB-B (1-5yrs) Index. The Fund's broad-based securities market index, the Bloomberg U.S. Aggregate Bond Index, returned 3.38% over the same period. U.S. fixed income markets have navigated a turbulent yet resilient path over the past several quarters, shaped by macroeconomic shifts, evolving monetary policy, and political developments. In the first half of the period, performance was mixed but ultimately constructive. Resilient macroeconomic data led to credit spreads reaching multi-year tights, though momentum faded amid growth concerns, tariff uncertainty, and skepticism around AI-driven expansion. This culminated in the April 2nd “Liberation Day” U.S. tariff announcement which triggered market volatility and a sharp selloff of risk assets. Markets rebounded on trade policy concessions, as well as strong earnings, increased AI investment momentum, and consumer resilience. Top contributors to performance: Security selection within the Telecommunications, Financial Services and Technology sectors. Credit selection within Single Bs. Allocation to convertible bonds. Top detractors from performance: Credit selection within Capital Goods, Automotive and Healthcare sectors. |
|
| Performance Past Does Not Indicate Future [Text] |
The Fund's past performance is no guarantee of future results.
|
|
| Line Graph [Table Text Block] |
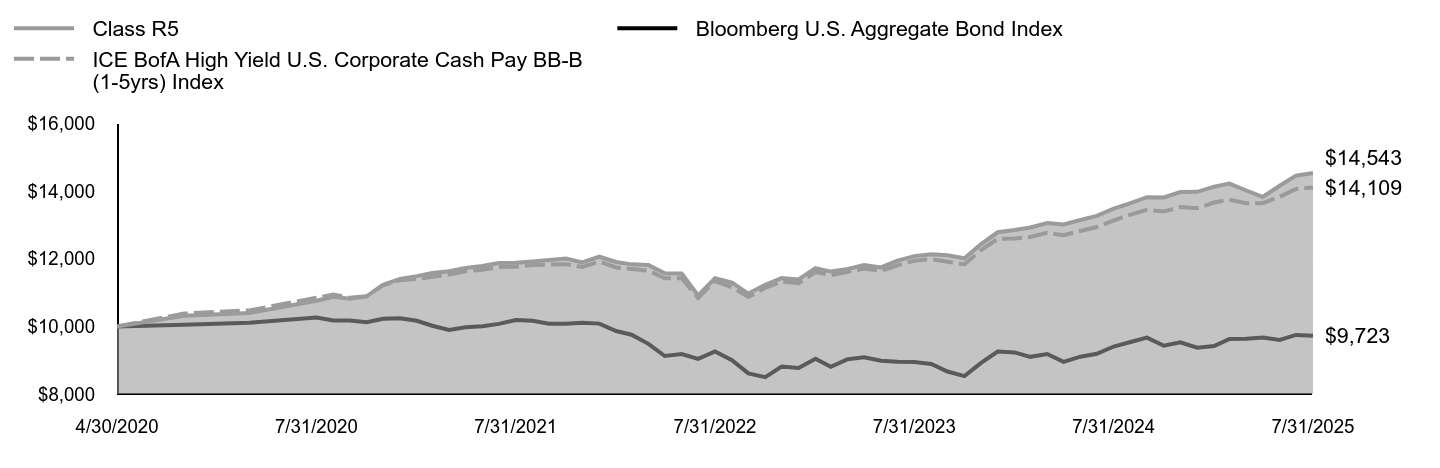 | Class R5 | Bloomberg U.S. Aggregate Bond Index | ICE BofA High Yield U.S. Corporate Cash Pay BB-B (1-5yrs) Index |
|---|
4/30/2020 | $10,000 | $10,000 | $10,000 |
|---|
5/31/2020 | $10,313 | $10,047 | $10,381 |
|---|
6/30/2020 | $10,399 | $10,110 | $10,474 |
|---|
7/31/2020 | $10,761 | $10,261 | $10,846 |
|---|
8/31/2020 | $10,878 | $10,178 | $10,941 |
|---|
9/30/2020 | $10,821 | $10,172 | $10,851 |
|---|
10/31/2020 | $10,889 | $10,127 | $10,896 |
|---|
11/30/2020 | $11,234 | $10,226 | $11,216 |
|---|
12/31/2020 | $11,406 | $10,240 | $11,367 |
|---|
1/31/2021 | $11,489 | $10,167 | $11,404 |
|---|
2/28/2021 | $11,582 | $10,020 | $11,467 |
|---|
3/31/2021 | $11,634 | $9,895 | $11,538 |
|---|
4/30/2021 | $11,727 | $9,973 | $11,635 |
|---|
5/31/2021 | $11,789 | $10,006 | $11,675 |
|---|
6/30/2021 | $11,874 | $10,076 | $11,761 |
|---|
7/31/2021 | $11,883 | $10,189 | $11,764 |
|---|
8/31/2021 | $11,923 | $10,169 | $11,815 |
|---|
9/30/2021 | $11,965 | $10,081 | $11,832 |
|---|
10/31/2021 | $12,007 | $10,079 | $11,843 |
|---|
11/30/2021 | $11,895 | $10,108 | $11,760 |
|---|
12/31/2021 | $12,063 | $10,083 | $11,921 |
|---|
1/31/2022 | $11,906 | $9,865 | $11,745 |
|---|
2/28/2022 | $11,837 | $9,755 | $11,700 |
|---|
3/31/2022 | $11,816 | $9,484 | $11,650 |
|---|
4/30/2022 | $11,576 | $9,124 | $11,427 |
|---|
5/31/2022 | $11,568 | $9,183 | $11,428 |
|---|
6/30/2022 | $10,915 | $9,039 | $10,843 |
|---|
7/31/2022 | $11,428 | $9,260 | $11,344 |
|---|
8/31/2022 | $11,294 | $8,998 | $11,158 |
|---|
9/30/2022 | $10,973 | $8,610 | $10,869 |
|---|
10/31/2022 | $11,235 | $8,498 | $11,145 |
|---|
11/30/2022 | $11,431 | $8,811 | $11,330 |
|---|
12/31/2022 | $11,392 | $8,771 | $11,278 |
|---|
1/31/2023 | $11,728 | $9,041 | $11,606 |
|---|
2/28/2023 | $11,623 | $8,807 | $11,518 |
|---|
3/31/2023 | $11,701 | $9,031 | $11,618 |
|---|
4/30/2023 | $11,814 | $9,085 | $11,712 |
|---|
5/31/2023 | $11,745 | $8,986 | $11,645 |
|---|
6/30/2023 | $11,949 | $8,954 | $11,805 |
|---|
7/31/2023 | $12,081 | $8,948 | $11,947 |
|---|
8/31/2023 | $12,138 | $8,891 | $11,991 |
|---|
9/30/2023 | $12,106 | $8,665 | $11,916 |
|---|
10/31/2023 | $12,015 | $8,528 | $11,836 |
|---|
11/30/2023 | $12,431 | $8,914 | $12,253 |
|---|
12/31/2023 | $12,786 | $9,256 | $12,592 |
|---|
1/31/2024 | $12,851 | $9,230 | $12,605 |
|---|
2/29/2024 | $12,927 | $9,100 | $12,645 |
|---|
3/31/2024 | $13,058 | $9,184 | $12,770 |
|---|
4/30/2024 | $13,017 | $8,952 | $12,702 |
|---|
5/31/2024 | $13,151 | $9,104 | $12,826 |
|---|
6/30/2024 | $13,270 | $9,190 | $12,942 |
|---|
7/31/2024 | $13,486 | $9,405 | $13,135 |
|---|
8/31/2024 | $13,649 | $9,540 | $13,310 |
|---|
9/30/2024 | $13,824 | $9,667 | $13,450 |
|---|
10/31/2024 | $13,818 | $9,428 | $13,401 |
|---|
11/30/2024 | $13,979 | $9,527 | $13,534 |
|---|
12/31/2024 | $13,983 | $9,371 | $13,500 |
|---|
1/31/2025 | $14,135 | $9,421 | $13,668 |
|---|
2/28/2025 | $14,226 | $9,628 | $13,750 |
|---|
3/31/2025 | $14,023 | $9,632 | $13,644 |
|---|
4/30/2025 | $13,833 | $9,670 | $13,649 |
|---|
5/31/2025 | $14,163 | $9,601 | $13,838 |
|---|
6/30/2025 | $14,462 | $9,748 | $14,066 |
|---|
7/31/2025 | $14,543 | $9,723 | $14,109 |
|---|
|
|
| Average Annual Return [Table Text Block] |
AATR | 1 Year | 5 Years | Since Inception
4/30/20 |
|---|
Class R5 at NAV | 7.84% | 6.21% | 7.39% |
|---|
ICE BofA High Yield U.S. Corporate Cash Pay BB-B (1-5yrs) Index | 7.41% | 5.40% | 6.77% |
|---|
Bloomberg U.S. Aggregate Bond Index | 3.38% | (1.07%) | (0.53%) |
|---|
|
|
| Performance Inception Date |
Apr. 30, 2020
|
|
| No Deduction of Taxes [Text Block] |
The returns do not reflect the deduction of taxes that a shareholder would pay on Fund distributions or redemption of Fund shares.
|
|
| AssetsNet |
$ 8,607,815,333
|
|
| Holdings Count | Holding |
636
|
|
| Advisory Fees Paid, Amount |
$ 20,005,780
|
|
| InvestmentCompanyPortfolioTurnover |
140.00%
|
|
| Additional Fund Statistics [Text Block] |
Total Net Assets | $8,607,815,333 |
|---|
# of Portfolio Holdings | 636 |
|---|
Portfolio Turnover Rate | 140% |
|---|
Total Advisory Fees Paid | $20,005,780 |
|---|
|
|
| Holdings [Text Block] |
Portfolio Holdings Presented by Portfolio Allocation | %Footnote Reference* |
|---|
Asset-Backed Securities | 1.28% | Common Stocks | 0.01% | Convertible Bonds | 2.25% | Corporate Bonds | 82.01% | Floating Rate Loans | 10.83% | Foreign Government Obligations | 0.21% | Repurchase Agreements | 0.22% | Money Market FundsFootnote Reference(a) | 2.87% | Time DepositsFootnote Reference(a) | 0.32% | Total | 100.00% |
| Footnote | Description | Footnote* | Represents percent of total investments, which excludes derivatives. | Footnote(a) | Securities were purchased with the cash collateral from loaned securities. |
|
|
| Material Fund Change [Text Block] |
There were no material fund changes during the period. |
|
| Summary of Change Legend [Text Block] |
There were no material fund changes during the period.
|
|
| C000218932 |
|
|
| Shareholder Report [Line Items] |
|
|
| Fund Name |
Lord Abbett Short Duration High Yield Fund
|
|
| Class Name |
Class R6
|
|
| Trading Symbol |
LSYUX
|
|
| Annual or Semi-Annual Statement [Text Block] |
This annual shareholder report contains important information about the Lord Abbett Short Duration High Yield Fund for the period of August 1, 2024 to July 31, 2025.
|
|
| Shareholder Report Annual or Semi-Annual |
Annual Shareholder Report
|
|
| Additional Information [Text Block] |
You can find additional information about the Fund at lordabbett.com/FundDocuments. You can also request this information by contacting us at 888-522-2388.
|
|
| Additional Information Phone Number |
888-522-2388
|
|
| Additional Information Website |
<span style="box-sizing: border-box; color: rgb(0, 0, 0); display: inline; flex-wrap: nowrap; font-size: 13.3333px; font-weight: 400; grid-area: auto; line-height: 20px; margin: 0px; overflow: visible; text-align: left; text-align-last: auto; white-space-collapse: preserve-breaks;">lordabbett.com/FundDocuments</span>
|
|
| Expenses [Text Block] |
What were the Fund costs for the last year?(based on a hypothetical $10,000 investment) Class Name | Costs of a $10,000 investment | Costs paid as a percentage of a $10,000 investment |
|---|
Class R6 | $38 | 0.37% |
|---|
|
|
| Expenses Paid, Amount |
$ 38
|
|
| Expense Ratio, Percent |
0.37%
|
|
| Factors Affecting Performance [Text Block] |
How did the Fund perform last year and what affected its performance?For the fiscal year ended July 31, 2025, the Fund returned 7.92%, reflecting performance at the net asset value (NAV) of Class R6 shares, with all distributions reinvested, compared to the 7.41% return of a securities market index with investment characteristics similar to those of the Fund, the ICE BofA High Yield U.S. Corporate Cash Pay BB-B (1-5yrs) Index. The Fund's broad-based securities market index, the Bloomberg U.S. Aggregate Bond Index, returned 3.38% over the same period. U.S. fixed income markets have navigated a turbulent yet resilient path over the past several quarters, shaped by macroeconomic shifts, evolving monetary policy, and political developments. In the first half of the period, performance was mixed but ultimately constructive. Resilient macroeconomic data led to credit spreads reaching multi-year tights, though momentum faded amid growth concerns, tariff uncertainty, and skepticism around AI-driven expansion. This culminated in the April 2nd “Liberation Day” U.S. tariff announcement which triggered market volatility and a sharp selloff of risk assets. Markets rebounded on trade policy concessions, as well as strong earnings, increased AI investment momentum, and consumer resilience. Top contributors to performance: Security selection within the Telecommunications, Financial Services and Technology sectors. Credit selection within Single Bs. Allocation to convertible bonds. Top detractors from performance: Credit selection within Capital Goods, Automotive and Healthcare sectors. |
|
| Performance Past Does Not Indicate Future [Text] |
The Fund's past performance is no guarantee of future results.
|
|
| Line Graph [Table Text Block] |
 | Class R6 | Bloomberg U.S. Aggregate Bond Index | ICE BofA High Yield U.S. Corporate Cash Pay BB-B (1-5yrs) Index |
|---|
4/30/2020 | $10,000 | $10,000 | $10,000 |
|---|
5/31/2020 | $10,314 | $10,047 | $10,381 |
|---|
6/30/2020 | $10,401 | $10,110 | $10,474 |
|---|
7/31/2020 | $10,763 | $10,261 | $10,846 |
|---|
8/31/2020 | $10,881 | $10,178 | $10,941 |
|---|
9/30/2020 | $10,825 | $10,172 | $10,851 |
|---|
10/31/2020 | $10,894 | $10,127 | $10,896 |
|---|
11/30/2020 | $11,239 | $10,226 | $11,216 |
|---|
12/31/2020 | $11,412 | $10,240 | $11,367 |
|---|
1/31/2021 | $11,495 | $10,167 | $11,404 |
|---|
2/28/2021 | $11,589 | $10,020 | $11,467 |
|---|
3/31/2021 | $11,642 | $9,895 | $11,538 |
|---|
4/30/2021 | $11,735 | $9,973 | $11,635 |
|---|
5/31/2021 | $11,798 | $10,006 | $11,675 |
|---|
6/30/2021 | $11,884 | $10,076 | $11,761 |
|---|
7/31/2021 | $11,894 | $10,189 | $11,764 |
|---|
8/31/2021 | $11,946 | $10,169 | $11,815 |
|---|
9/30/2021 | $11,988 | $10,081 | $11,832 |
|---|
10/31/2021 | $12,019 | $10,079 | $11,843 |
|---|
11/30/2021 | $11,908 | $10,108 | $11,760 |
|---|
12/31/2021 | $12,076 | $10,083 | $11,921 |
|---|
1/31/2022 | $11,930 | $9,865 | $11,745 |
|---|
2/28/2022 | $11,850 | $9,755 | $11,700 |
|---|
3/31/2022 | $11,829 | $9,484 | $11,650 |
|---|
4/30/2022 | $11,601 | $9,124 | $11,427 |
|---|
5/31/2022 | $11,581 | $9,183 | $11,428 |
|---|
6/30/2022 | $10,927 | $9,039 | $10,843 |
|---|
7/31/2022 | $11,441 | $9,260 | $11,344 |
|---|
8/31/2022 | $11,307 | $8,998 | $11,158 |
|---|
9/30/2022 | $10,987 | $8,610 | $10,869 |
|---|
10/31/2022 | $11,249 | $8,498 | $11,145 |
|---|
11/30/2022 | $11,446 | $8,811 | $11,330 |
|---|
12/31/2022 | $11,407 | $8,771 | $11,278 |
|---|
1/31/2023 | $11,744 | $9,041 | $11,606 |
|---|
2/28/2023 | $11,627 | $8,807 | $11,518 |
|---|
3/31/2023 | $11,717 | $9,031 | $11,618 |
|---|
4/30/2023 | $11,818 | $9,085 | $11,712 |
|---|
5/31/2023 | $11,762 | $8,986 | $11,645 |
|---|
6/30/2023 | $11,954 | $8,954 | $11,805 |
|---|
7/31/2023 | $12,099 | $8,948 | $11,947 |
|---|
8/31/2023 | $12,156 | $8,891 | $11,991 |
|---|
9/30/2023 | $12,124 | $8,665 | $11,916 |
|---|
10/31/2023 | $12,033 | $8,528 | $11,836 |
|---|
11/30/2023 | $12,450 | $8,914 | $12,253 |
|---|
12/31/2023 | $12,794 | $9,256 | $12,592 |
|---|
1/31/2024 | $12,860 | $9,230 | $12,605 |
|---|
2/29/2024 | $12,950 | $9,100 | $12,645 |
|---|
3/31/2024 | $13,082 | $9,184 | $12,770 |
|---|
4/30/2024 | $13,043 | $8,952 | $12,702 |
|---|
5/31/2024 | $13,177 | $9,104 | $12,826 |
|---|
6/30/2024 | $13,298 | $9,190 | $12,942 |
|---|
7/31/2024 | $13,515 | $9,405 | $13,135 |
|---|
8/31/2024 | $13,680 | $9,540 | $13,310 |
|---|
9/30/2024 | $13,856 | $9,667 | $13,450 |
|---|
10/31/2024 | $13,851 | $9,428 | $13,401 |
|---|
11/30/2024 | $14,013 | $9,527 | $13,534 |
|---|
12/31/2024 | $14,004 | $9,371 | $13,500 |
|---|
1/31/2025 | $14,171 | $9,421 | $13,668 |
|---|
2/28/2025 | $14,263 | $9,628 | $13,750 |
|---|
3/31/2025 | $14,061 | $9,632 | $13,644 |
|---|
4/30/2025 | $13,872 | $9,670 | $13,649 |
|---|
5/31/2025 | $14,203 | $9,601 | $13,838 |
|---|
6/30/2025 | $14,504 | $9,748 | $14,066 |
|---|
7/31/2025 | $14,586 | $9,723 | $14,109 |
|---|
|
|
| Average Annual Return [Table Text Block] |
AATR | 1 Year | 5 Years | Since Inception
4/30/20 |
|---|
Class R6 at NAV | 7.92% | 6.27% | 7.45% |
|---|
ICE BofA High Yield U.S. Corporate Cash Pay BB-B (1-5yrs) Index | 7.41% | 5.40% | 6.77% |
|---|
Bloomberg U.S. Aggregate Bond Index | 3.38% | (1.07%) | (0.53%) |
|---|
|
|
| Performance Inception Date |
Apr. 30, 2020
|
|
| No Deduction of Taxes [Text Block] |
The returns do not reflect the deduction of taxes that a shareholder would pay on Fund distributions or redemption of Fund shares.
|
|
| AssetsNet |
$ 8,607,815,333
|
|
| Holdings Count | Holding |
636
|
|
| Advisory Fees Paid, Amount |
$ 20,005,780
|
|
| InvestmentCompanyPortfolioTurnover |
140.00%
|
|
| Additional Fund Statistics [Text Block] |
Total Net Assets | $8,607,815,333 |
|---|
# of Portfolio Holdings | 636 |
|---|
Portfolio Turnover Rate | 140% |
|---|
Total Advisory Fees Paid | $20,005,780 |
|---|
|
|
| Holdings [Text Block] |
Portfolio Holdings Presented by Portfolio Allocation | %Footnote Reference* |
|---|
Asset-Backed Securities | 1.28% | Common Stocks | 0.01% | Convertible Bonds | 2.25% | Corporate Bonds | 82.01% | Floating Rate Loans | 10.83% | Foreign Government Obligations | 0.21% | Repurchase Agreements | 0.22% | Money Market FundsFootnote Reference(a) | 2.87% | Time DepositsFootnote Reference(a) | 0.32% | Total | 100.00% |
| Footnote | Description | Footnote* | Represents percent of total investments, which excludes derivatives. | Footnote(a) | Securities were purchased with the cash collateral from loaned securities. |
|
|
| Material Fund Change [Text Block] |
There were no material fund changes during the period. |
|
| Summary of Change Legend [Text Block] |
There were no material fund changes during the period.
|
|
|
|