Shareholder Report
Jul. 31, 2025
USD ($)
Holding
| [1] | Annualized. |
| [2] | Annualized. |
| [3] | Annualized. |
Shareholder Report |
6 Months Ended | |||||||
|---|---|---|---|---|---|---|---|---|
|
Jul. 31, 2025
USD ($)
Holding
| ||||||||
| Shareholder Report [Line Items] | ||||||||
| Document Type | N-CSRS | |||||||
| Amendment Flag | false | |||||||
| Registrant Name | AMERICAN BEACON SELECT FUNDS | |||||||
| Entity Central Index Key | 0001096012 | |||||||
| Entity Investment Company Type | N-1A | |||||||
| Document Period End Date | Jul. 31, 2025 | |||||||
| C000243995 | ||||||||
| Shareholder Report [Line Items] | ||||||||
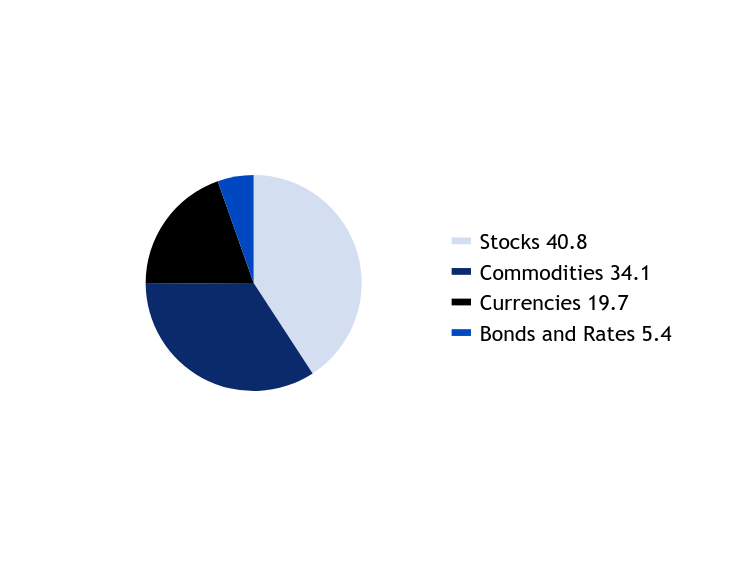
| Fund Name | AHL Trend ETF | |||||||
| Trading Symbol | AHLT | |||||||
| Security Exchange Name | NYSE | |||||||
| Annual or Semi-Annual Statement [Text Block] | This semi-annual shareholder report contains important information about American Beacon AHL Trend ETF for the period of February 1, 2025 to July 31, 2025. | |||||||
| Shareholder Report Annual or Semi-Annual | Semi-Annual Shareholder Report | |||||||
| Additional Information [Text Block] | You can find additional information about the Fund at www.americanbeaconfunds.com/fund-resources/. You can also request this information by contacting us at 833-471-3562. | |||||||
| Additional Information Phone Number | 833-471-3562 | |||||||
| Additional Information Website | <span style="box-sizing: border-box; color: rgb(0, 0, 0); display: inline; flex-wrap: nowrap; font-size: 13.3333px; font-weight: 400; grid-area: auto; line-height: 20px; margin: 0px; overflow: visible; text-align: left; text-align-last: auto; white-space-collapse: preserve-breaks;">www.americanbeaconfunds.com/fund-resources/</span> | |||||||
| Expenses [Text Block] | ||||||||
| Expenses Paid, Amount | $ 45 | |||||||
| Expense Ratio, Percent | 0.96% | [1] | ||||||
| AssetsNet | $ 47,491,089 | |||||||
| Holdings Count | Holding | 8 | |||||||
| Advisory Fees Paid, Amount | $ 219,374 | |||||||
| InvestmentCompanyPortfolioTurnover | 0.00% | |||||||
| Additional Fund Statistics [Text Block] | ||||||||
| Holdings [Text Block] | ||||||||
| Largest Holdings [Text Block] | ||||||||
| Material Fund Change [Text Block] | ||||||||
| C000247981 | ||||||||
| Shareholder Report [Line Items] | ||||||||
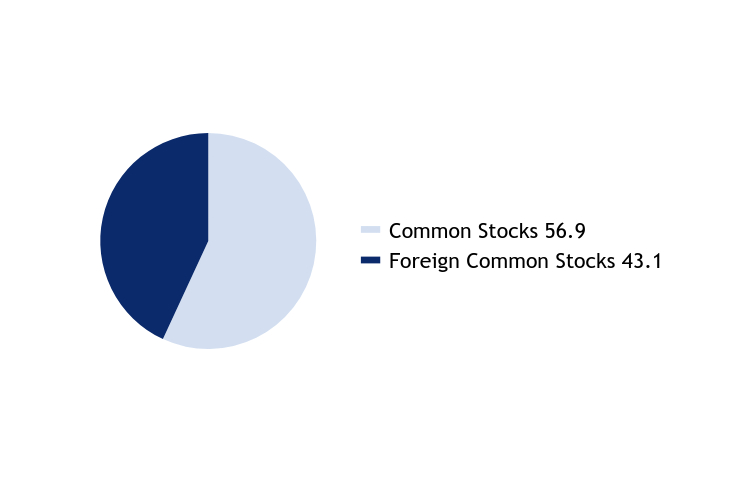
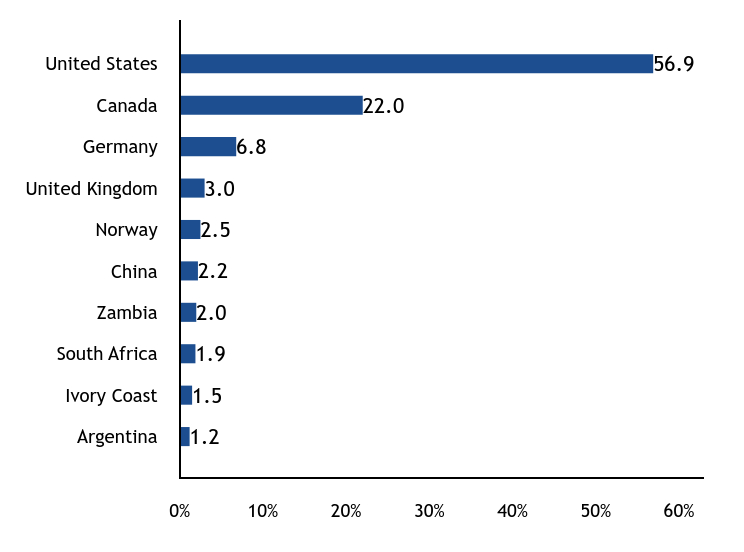
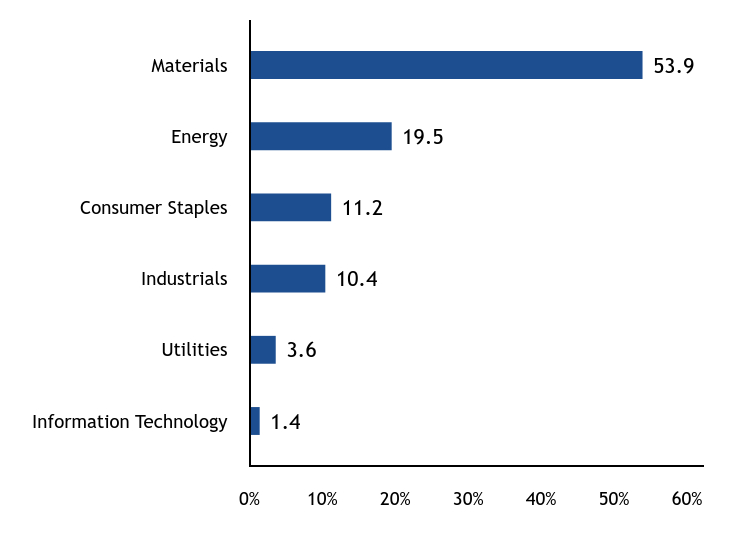
| Fund Name | GLG Natural Resources ETF | |||||||
| Trading Symbol | MGNR | |||||||
| Security Exchange Name | NYSE | |||||||
| Annual or Semi-Annual Statement [Text Block] | This semi-annual shareholder report contains important information about American Beacon GLG Natural Resources ETF for the period of February 1, 2025 to July 31, 2025. | |||||||
| Shareholder Report Annual or Semi-Annual | Semi-Annual Shareholder Report | |||||||
| Additional Information [Text Block] | You can find additional information about the Fund at www.americanbeaconfunds.com/fund-resources/. You can also request this information by contacting us at 833-471-3562. | |||||||
| Additional Information Phone Number | 833-471-3562 | |||||||
| Additional Information Website | <span style="box-sizing: border-box; color: rgb(0, 0, 0); display: inline; flex-wrap: nowrap; font-size: 12px; font-weight: 400; grid-area: auto; line-height: 18px; margin: 0px; overflow: visible; text-align: left; text-align-last: auto; white-space-collapse: preserve-breaks;">www.americanbeaconfunds.com/fund-resources/</span> | |||||||
| Expenses [Text Block] | ||||||||
| Expenses Paid, Amount | $ 38 | |||||||
| Expense Ratio, Percent | 0.75% | [2] | ||||||
| AssetsNet | $ 172,154,019 | |||||||
| Holdings Count | Holding | 51 | |||||||
| Advisory Fees Paid, Amount | $ 533,522 | |||||||
| InvestmentCompanyPortfolioTurnover | 40.00% | |||||||
| Additional Fund Statistics [Text Block] | ||||||||
| Holdings [Text Block] | ||||||||
| Largest Holdings [Text Block] | ||||||||
| Material Fund Change [Text Block] | ||||||||
| C000257150 | ||||||||
| Shareholder Report [Line Items] | ||||||||
| Fund Name | Ionic Inflation Protection ETF | |||||||
| Trading Symbol | CPII | |||||||
| Security Exchange Name | NYSE | |||||||
| Annual or Semi-Annual Statement [Text Block] | This semi-annual shareholder report contains important information about American Beacon Ionic Inflation Protection ETF for the period of May 1, 2025 to July 31, 2025. | |||||||
| Shareholder Report Annual or Semi-Annual | Semi-Annual Shareholder Report | |||||||
| Additional Information [Text Block] | You can find additional information about the Fund at www.americanbeaconfunds.com/fund-resources/. You can also request this information by contacting us at 833-471-3562. | |||||||
| Additional Information Phone Number | 833-471-3562 | |||||||
| Additional Information Website | <span style="box-sizing: border-box; color: rgb(0, 0, 0); display: inline; flex-wrap: nowrap; font-size: 13.3333px; font-weight: 400; grid-area: auto; line-height: 20px; margin: 0px; overflow: visible; text-align: left; text-align-last: auto; white-space-collapse: preserve-breaks;">www.americanbeaconfunds.com/fund-resources/</span> | |||||||
| Expenses [Text Block] | ||||||||
| Expenses Paid, Amount | $ 18 | |||||||
| Expense Ratio, Percent | 0.70% | [3] | ||||||
| AssetsNet | $ 10,576,023 | |||||||
| Holdings Count | Holding | 9 | |||||||
| Advisory Fees Paid, Amount | $ 17,904 | |||||||
| InvestmentCompanyPortfolioTurnover | 1.00% | |||||||
| Additional Fund Statistics [Text Block] | ||||||||
| Holdings [Text Block] | ||||||||
| Largest Holdings [Text Block] | ||||||||
| Material Fund Change [Text Block] | ||||||||
| ||||||||