Shareholder Report
Jul. 31, 2025
USD ($)
Holding
This report describes changes to the Fund that occurred during the reporting period.
What were the Fund costs for the last year?
(based on a hypothetical $10,000 investment)
| Fund name | Costs of a $10,000 investment |
Costs paid as a percentage of a $10,000 investment |
| $33 | 0.33% |
How did the Fund perform last year?
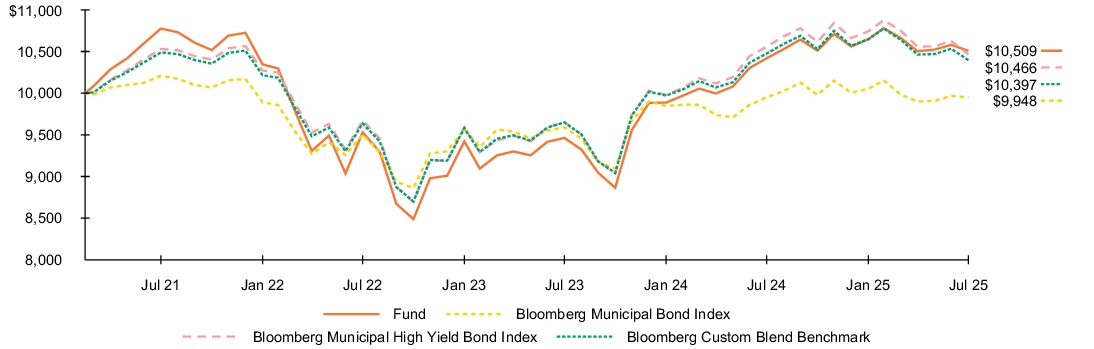
- For the reporting period ended July 31, 2025, the Fund returned 0.86%.
- For the same period, the Bloomberg Municipal Bond Index returned 0.00%, the Bloomberg Municipal High Yield Bond Index returned (0.86)%, and the Bloomberg Custom Blend Benchmark returned (0.75)%.
What contributed to performance?
Income, which offset the impact of falling prices and widening yield spreads, was the key contributor to performance. At the sector level, holdings in short-term development district issues and prepaid gas bonds contributed.
What detracted from performance?
Holdings in longer-duration securities and those with maturities of 20 years and longer, which posted negative total returns, detracted from performance. (Duration is a measure of interest rate sensitivity.) In terms of sectors, transportation was the largest detractor.
The views expressed reflect the opinions of BlackRock as of the date of this report and are subject to change based on changes in market, economic or other conditions. These views are not intended to be a forecast of future events and are no guarantee of future results.
Fund performance
Cumulative performance: March 16, 2021 through July 31, 2025
Initial investment of $10,000
See “Average annual total returns” for additional information on fund performance.
| Average annual total returns | ||||
| 1 Year | Since Fund Inception |
|||
| 0.86 | % | 1.14 | % | |
| 0.00 | (0.12 | ) | ||
| (0.86 | ) | 1.05 | ||
| (0.75 | ) | 0.89 |
Effective July 1, 2025, the Fund has changed the benchmark against which it measures its performance from Bloomberg Municipal High Yield Bond Index and Bloomberg Custom Blend Benchmark to Bloomberg Custom Blend Muni Index. The Bloomberg Custom Blend Muni Index is relevant to the Fund because it has characteristics similar to the Fund's investment strategies. The Fund's returns shown prior to July 1, 2025 are the returns of the Fund when it followed different investment strategies under the name iShares High Yield Muni Income Active ETF.
| Key Fund statistics | |
| $366,732,564 | |
| 321 | |
| $895,878 | |
| 50% |
What did the Fund invest in?
(as of July 31, 2025)
Credit quality allocation
| Credit Rating* | Percent of Total Investments(a) |
|
| 0.1 | % | |
| 8.9 | ||
| 10.2 | ||
| 8.9 | ||
| 14.9 | ||
| 7.5 | ||
| 0.2 | ||
| 49.3 |
Ten largest holdings
| Security | Percent of Total Investments(a) |
|
| 3.8 | % | |
| 3.4 | ||
| 2.9 | ||
| 2.2 | ||
| 2.2 | ||
| 2.1 | ||
| 2.1 | ||
| 1.9 | ||
| 1.6 | ||
| 1.6 |
| Excludes money market funds. |
| For purposes of this report, credit quality ratings shown above reflect the highest rating assigned by either S&P Global Ratings or Moody’s Investors Service, Inc. if ratings differ. These rating agencies are independent, nationally recognized statistical rating organizations and are widely used. Investment grade ratings are credit ratings of BBB/Baa or higher. Below investment grade ratings are credit ratings of BB/Ba or lower. Investments designated N/R are not rated by either rating agency. Unrated investments do not necessarily indicate low credit quality. Credit quality ratings are subject to change. |
Ten largest holdings
| Security | Percent of Total Investments(a) |
|
| 3.8 | % | |
| 3.4 | ||
| 2.9 | ||
| 2.2 | ||
| 2.2 | ||
| 2.1 | ||
| 2.1 | ||
| 1.9 | ||
| 1.6 | ||
| 1.6 |
Material Fund changes
This is a summary of certain changes to the Fund since July 31, 2024. For more complete information, you may review the Fund’s next prospectus, which we expect to be available approximately 120 days after July 31, 2025 at blackrock.com/fundreports or upon request by contacting us at (800) 474-2737.
On July 30, 2024, the Fund’s Board approved to change the name of the Fund from BlackRock High Yield Muni Income ETF to iShares High Yield Muni Income Active ETF. This change became effective on October 10, 2024. Additionally, on February 10, 2025, the Fund changed its ticker from HYMU to SHYM.
On September 13, 2024, the Fund’s Board approved to change the name of the Fund from iShares High Yield Muni Income Active ETF to iShares Short Duration High Yield Muni Active ETF. In connection with the Fund’s name change, the Fund made certain changes to its investment strategies, including (i) seeking a weighted average effective duration of less than 5 years and (ii) adding the ability to invest in derivatives, other investment companies, and tender option bonds. These changes became effective on July 1, 2025.
Effective July 1, 2025, BlackRock Fund Advisors LLC has contractually agreed to reduce the Fund’s investment advisory fee from 0.45% to 0.40% based on the Fund’s average daily net assets and to reduce the advisory fee waiver from 0.10% to 0.05%.
On July 30, 2024, the Fund’s Board approved to change the name of the Fund from BlackRock High Yield Muni Income ETF to iShares High Yield Muni Income Active ETF. This change became effective on October 10, 2024. Additionally, on February 10, 2025, the Fund changed its ticker from HYMU to SHYM.
On September 13, 2024, the Fund’s Board approved to change the name of the Fund from iShares High Yield Muni Income Active ETF to iShares Short Duration High Yield Muni Active ETF.
Effective July 1, 2025, BlackRock Fund Advisors LLC has contractually agreed to reduce the Fund’s investment advisory fee from 0.45% to 0.40% based on the Fund’s average daily net assets and to reduce the advisory fee waiver from 0.10% to 0.05%.
This is a summary of certain changes to the Fund since July 31, 2024. For more complete information, you may review the Fund’s next prospectus, which we expect to be available approximately 120 days after July 31, 2025 at blackrock.com/fundreports or upon request by contacting us at (800) 474-2737.
This report describes changes to the Fund that occurred during the reporting period.
What were the Fund costs for the last year?
(based on a hypothetical $10,000 investment)
| Fund name | Costs of a $10,000 investment |
Costs paid as a percentage of a $10,000 investment |
| $29 | 0.29% |
How did the Fund perform last year?
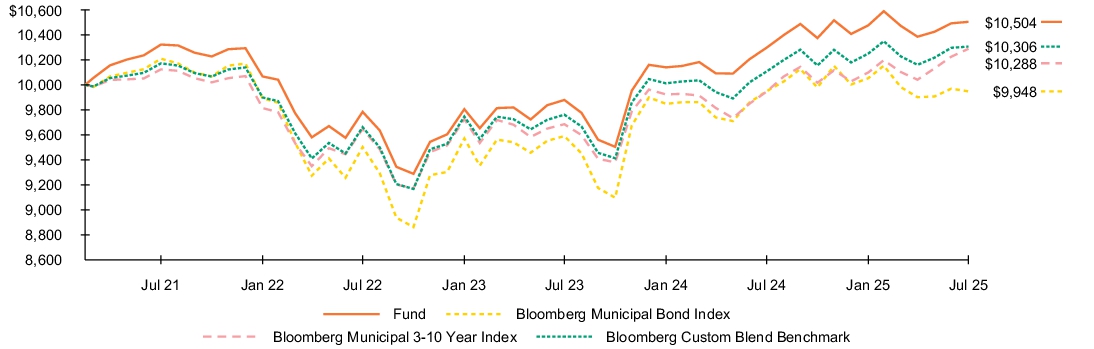
- For the reporting period ended July 31, 2025, the Fund returned 2.01%.
- For the same period, the Bloomberg Municipal Bond Index returned 0.00%, the Bloomberg Municipal Bond 3-10 Year Index returned 3.44%, and the Bloomberg Custom Blend Benchmark returned 1.98%.
What contributed to performance?
Income, which offset the impact of falling prices and widening yield spreads, was the key contributor to performance. At the sector level, transportation and corporate-backed issues made the largest contributions.
What detracted from performance?
Positions in longer-duration securities, which posted negative total returns, detracted from performance. (Duration is a measure of interest rate sensitivity.) The decision to add to the Fund’s weighting in the intermediate-term portion of the yield curve during the course of the period detracted from results.
The views expressed reflect the opinions of BlackRock as of the date of this report and are subject to change based on changes in market, economic or other conditions. These views are not intended to be a forecast of future events and are no guarantee of future results.
Fund performance
Cumulative performance: March 16, 2021 through July 31, 2025
Initial investment of $10,000
See “Average annual total returns” for additional information on fund performance.
| Average annual total returns | ||||
| 1 Year | Since Fund Inception |
|||
| 2.01 | % | 1.13 | % | |
| 0.00 | (0.12 | ) | ||
| 3.44 | 0.65 | |||
| 1.98 | 0.69 |
| Key Fund statistics | |
| $116,731,073 | |
| 216 | |
| $151,879 | |
| 66% |
What did the Fund invest in?
(as of July 31, 2025)
Credit quality allocation
| Credit Rating* | Percent of Total Investments(a) |
|
| 13.9 | % | |
| 37.2 | ||
| 34.9 | ||
| 9.2 | ||
| 1.0 | ||
| 0.4 | ||
| 3.4 |
Ten largest holdings
| Security | Percent of Total Investments(a) |
|
| 1.7 | % | |
| 1.6 | ||
| 1.4 | ||
| 1.4 | ||
| 1.4 | ||
| 1.4 | ||
| 1.4 | ||
| 1.1 | ||
| 1.1 | ||
| 1.1 |
| Excludes money market funds. |
| For purposes of this report, credit quality ratings shown above reflect the highest rating assigned by either S&P Global Ratings or Moody’s Investors Service, Inc. if ratings differ. These rating agencies are independent, nationally recognized statistical rating organizations and are widely used. Investment grade ratings are credit ratings of BBB/Baa or higher. Below investment grade ratings are credit ratings of BB/Ba or lower. Investments designated N/R are not rated by either rating agency. Unrated investments do not necessarily indicate low credit quality. Credit quality ratings are subject to change. |
Ten largest holdings
| Security | Percent of Total Investments(a) |
|
| 1.7 | % | |
| 1.6 | ||
| 1.4 | ||
| 1.4 | ||
| 1.4 | ||
| 1.4 | ||
| 1.4 | ||
| 1.1 | ||
| 1.1 | ||
| 1.1 |
Material Fund changes
This is a summary of certain changes to the Fund since July 31, 2024. For more complete information, you may review the Fund’s next prospectus, which we expect to be available approximately 120 days after July 31, 2025 at blackrock.com/fundreports or upon request by contacting us at (800) 474-2737.
On July 30, 2024, the Fund’s Board approved a proposal to change the name of the Fund from BlackRock Intermediate Muni Income Bond ETF to iShares Intermediate Muni Income Active ETF. This change became effective on October 10, 2024.
On July 30, 2024, the Fund’s Board approved a proposal to change the name of the Fund from BlackRock Intermediate Muni Income Bond ETF to iShares Intermediate Muni Income Active ETF. This change became effective on October 10, 2024.
This is a summary of certain changes to the Fund since July 31, 2024. For more complete information, you may review the Fund’s next prospectus, which we expect to be available approximately 120 days after July 31, 2025 at blackrock.com/fundreports or upon request by contacting us at (800) 474-2737.
This report describes changes to the Fund that occurred during the reporting period.
What were the Fund costs for the last year?
(based on a hypothetical $10,000 investment)
| Fund name | Costs of a $10,000 investment |
Costs paid as a percentage of a $10,000 investment |
| $55 | 0.53% |
How did the Fund perform last year?
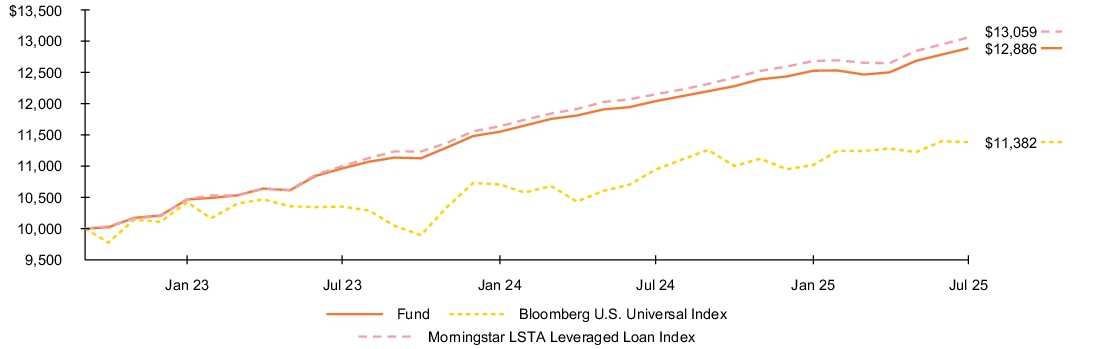
- For the reporting period ended July 31, 2025, the Fund returned 7.04%.
- For the same period, the Bloomberg U.S. Universal Index returned 4.00%, and the Morningstar LSTA Leveraged Loan Index returned 7.50%.
What contributed to performance?
The core allocation to bank loans was the primary contributor to the Fund’s absolute return. The overall bank loan market experienced strong performance over the period, returning 7.50%. Allocations to both high yield corporate bonds and bank loans via indexed products also contributed positively to performance, as both asset classes posted strong returns over the period. In terms of credit categories, issues rated BB and higher led positive contributions, followed by those rated B2 and B3. In sector terms, holdings within technology, diversified manufacturing, and property & casualty insurance proved most additive.
What detracted from performance?
While there were no material detractors from performance, holdings within the lodging and construction machinery sectors detracted very slightly.
The views expressed reflect the opinions of BlackRock as of the date of this report and are subject to change based on changes in market, economic or other conditions. These views are not intended to be a forecast of future events and are no guarantee of future results.
Fund performance
Cumulative performance: October 4, 2022 through July 31, 2025
Initial investment of $10,000
See “Average annual total returns” for additional information on fund performance.
| Average annual total returns | ||||
| 1 Year | Since Fund Inception |
|||
| 7.04 | % | 9.39 | % | |
| 4.00 | 4.69 | |||
| 7.50 | 9.92 |
| Key Fund statistics | |
| $60,015,526 | |
| 448 | |
| $307,665 | |
| 38% |
What did the Fund invest in?
(as of July 31, 2025)
Credit quality allocation
| Credit Rating* | Percent of Total Investments(a) |
|
| 0.0 | %(b) | |
| 8.2 | ||
| 29.1 | ||
| 55.3 | ||
| 2.8 | ||
| 4.6 |
Maturity allocation
| Maturity | Percent of Total Investments(a) |
|
| 0.1 | % | |
| 44.4 | ||
| 55.5 |
| Excludes money market funds. |
| Rounds to less than 0.1%. |
| For purposes of this report, credit quality ratings shown above reflect the highest rating assigned by either S&P Global Ratings or Moody’s Investors Service, Inc. if ratings differ. These rating agencies are independent, nationally recognized statistical rating organizations and are widely used. Investment grade ratings are credit ratings of BBB/Baa or higher. Below investment grade ratings are credit ratings of BB/Ba or lower. Investments designated N/R are not rated by either rating agency. Unrated investments do not necessarily indicate low credit quality. Credit quality ratings are subject to change. |
Material Fund changes
This is a summary of certain changes to the Fund since July 31, 2024. For more complete information, you may review the Fund’s next prospectus, which we expect to be available approximately 120 days after July 31, 2025 at blackrock.com/fundreports or upon request by contacting us at (800) 474-2737.
On July 30, 2024, the Fund’s Board approved a proposal to change the name of the Fund from BlackRock Floating Rate Loan ETF to iShares Floating Rate Loan Active ETF. This change became effective on October 10, 2024.
On July 30, 2024, the Fund’s Board approved a proposal to change the name of the Fund from BlackRock Floating Rate Loan ETF to iShares Floating Rate Loan Active ETF. This change became effective on October 10, 2024.
This is a summary of certain changes to the Fund since July 31, 2024. For more complete information, you may review the Fund’s next prospectus, which we expect to be available approximately 120 days after July 31, 2025 at blackrock.com/fundreports or upon request by contacting us at (800) 474-2737.
This report describes changes to the Fund that occurred during the reporting period.
What were the Fund costs for the last year?
(based on a hypothetical $10,000 investment)
| Fund name | Costs of a $10,000 investment |
Costs paid as a percentage of a $10,000 investment |
| $21 | 0.20% |
How did the Fund perform last year?
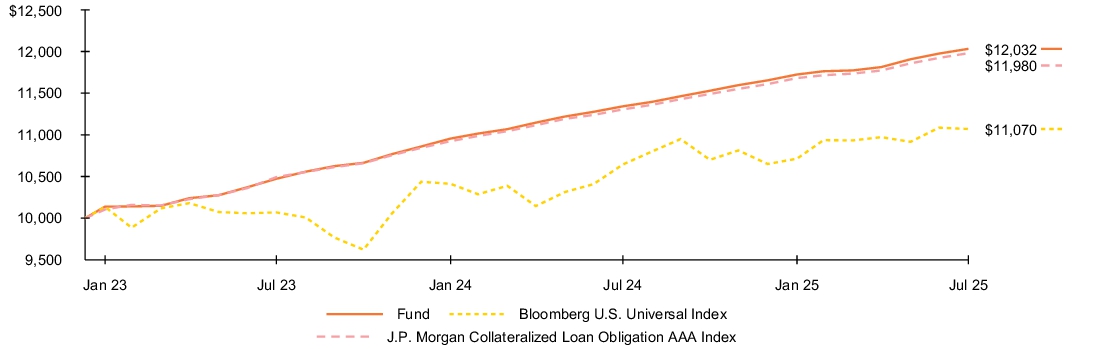
- For the reporting period ended July 31, 2025, the Fund returned 6.09%.
- For the same period, the Bloomberg U.S. Universal Index returned 4.00%, and the J.P. Morgan Collateralized Loan Obligation AAA Index returned 5.97%.
What contributed to performance?
The largest contributor to the Fund’s absolute return was portfolio yield as the Secured Overnight Financing Rate which serves as the base rate for CLOs benefited from the U.S. Federal Reserve holding short term policy rates steady over the time frame. In addition, discount margins on the floating rate securities held generally tightened over the period, despite some volatility in April of 2025, resulting in a modest contribution from price appreciation. Modest allocations to CLOs rated AA and A also proved additive.
What detracted from performance?
There were no material detractors from performance.
The views expressed reflect the opinions of BlackRock as of the date of this report and are subject to change based on changes in market, economic or other conditions. These views are not intended to be a forecast of future events and are no guarantee of future results.
Fund performance
Cumulative performance: January 10, 2023 through July 31, 2025
Initial investment of $10,000
See “Average annual total returns” for additional information on fund performance.
| Average annual total returns | ||||
| 1 Year | Since Fund Inception |
|||
| 6.09 | % | 7.50 | % | |
| 4.00 | 4.06 | |||
| 5.97 | 7.32 |
| Key Fund statistics | |
| $1,023,592,905 | |
| 316 | |
| $1,356,604 | |
| 89% |
What did the Fund invest in?
(as of July 31, 2025)
Maturity allocation
| Maturity | Percent of Total Investments(a) |
|
| 0.3 | % | |
| 19.3 | ||
| 80.4 |
Ten largest holdings
| Security | Percent of Total Investments(a) |
|
| 1.4 | % | |
| 1.0 | ||
| 1.0 | ||
| 1.0 | ||
| 1.0 | ||
| 0.8 | ||
| 0.8 | ||
| 0.8 | ||
| 0.8 | ||
| 0.8 |
| Excludes money market funds. |
Ten largest holdings
| Security | Percent of Total Investments(a) |
|
| 1.4 | % | |
| 1.0 | ||
| 1.0 | ||
| 1.0 | ||
| 1.0 | ||
| 0.8 | ||
| 0.8 | ||
| 0.8 | ||
| 0.8 | ||
| 0.8 |
| Excludes money market funds. |
Material Fund changes
This is a summary of certain changes to the Fund since July 31, 2024. For more complete information, you may review the Fund’s next prospectus, which we expect to be available approximately 120 days after July 31, 2025 at blackrock.com/fundreports or upon request by contacting us at (800) 474-2737.
On July 30, 2024, the Fund’s Board approved a proposal to change the name of the Fund from BlackRock AAA CLO ETF to iShares AAA CLO Active ETF. This change became effective on October 10, 2024.
On July 30, 2024, the Fund’s Board approved a proposal to change the name of the Fund from BlackRock AAA CLO ETF to iShares AAA CLO Active ETF. This change became effective on October 10, 2024.
This is a summary of certain changes to the Fund since July 31, 2024. For more complete information, you may review the Fund’s next prospectus, which we expect to be available approximately 120 days after July 31, 2025 at blackrock.com/fundreports or upon request by contacting us at (800) 474-2737.
This report describes changes to the Fund that occurred during the reporting period.
What were the Fund costs for the last year?
(based on a hypothetical $10,000 investment)
| Fund name | Costs of a $10,000 investment |
Costs paid as a percentage of a $10,000 investment |
| $39 | 0.38% |
How did the Fund perform last year?
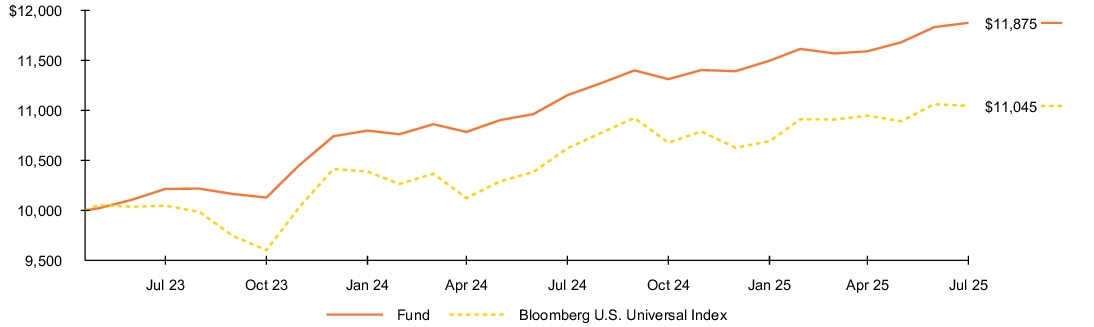
- For the reporting period ended July 31, 2025, the Fund returned 6.50%.
- For the same period, the Bloomberg U.S. Universal Index returned 4.00%.
What contributed to performance?
For the 12-month period, positive contributions to the Fund’s performance were led by exposures to U.S. high yield and European high yield corporate bonds. The allocation to securitized assets including commercial mortgage-backed securities, collateralized loan obligations, asset-backed securities and non-agency residential mortgage-backed securities also proved additive. Positioning with respect to duration and corresponding interest rate sensitivity in emerging markets as well as in European and other developed international markets also contributed to return. Other contributors included exposures to emerging market hard currencies, agency mortgage-backed securities and European investment grade corporate bonds.
The Fund utilized derivatives to help manage interest rate and credit exposures, as well as to hedge foreign currency exposures. The use of derivatives contributed modestly to the Fund’s performance during the period.
What detracted from performance?
The Fund’s positioning with respect to duration and corresponding interest rate sensitivity in the U.S. market weighed most heavily on return over the 12-month period. Exposure to U.S. investment grade corporate bonds also detracted from performance.
The views expressed reflect the opinions of BlackRock as of the date of this report and are subject to change based on changes in market, economic or other conditions. These views are not intended to be a forecast of future events and are no guarantee of future results.
Fund performance
Cumulative performance: May 19, 2023 through July 31, 2025
Initial investment of $10,000
See “Average annual total returns” for additional information on fund performance.
| Average annual total returns | ||||
| 1 Year | Since Fund Inception |
|||
| 6.50 | % | 8.11 | % | |
| 4.00 | 4.63 |
| Key Fund statistics | |
| $10,728,405,834 | |
| 3,774 | |
| $28,226,931 | |
| 291% |
What did the Fund invest in?
(as of July 31, 2025)
Portfolio composition
| Investment Type | Percent of Total Investments(a) |
|
| 39.8 | % | |
| 21.2 | ||
| 15.5 | ||
| 15.0 | ||
| 8.0 | ||
| 2.8 | ||
| 1.6 | ||
| 0.2 | ||
| 0.0 | (b) | |
| 0.0 | (b) | |
| (4.1 | ) |
Credit quality allocation
| Credit Rating* | Percent of Total Investments(a) |
|
| 30.6 | % | |
| 5.1 | ||
| 3.7 | ||
| 7.2 | ||
| 19.7 | ||
| 14.4 | ||
| 1.4 | ||
| 0.1 | ||
| 0.0 | (b) | |
| 0.0 | (b) | |
| 17.8 |
| Excludes money market funds. |
| Rounds to less than 0.1%. |
| Ten largest investment types are presented. Additional asset types are found in Other. |
| For purposes of this report, credit quality ratings shown above reflect the highest rating assigned by either S&P Global Ratings or Moody’s Investors Service, Inc. if ratings differ. These rating agencies are independent, nationally recognized statistical rating organizations and are widely used. Investment grade ratings are credit ratings of BBB/Baa or higher. Below investment grade ratings are credit ratings of BB/Ba or lower. Investments designated N/R are not rated by either rating agency. Unrated investments do not necessarily indicate low credit quality. Credit quality ratings are subject to change. |
Material Fund changes
This is a summary of certain changes to the Fund since July 31, 2024. For more complete information, you may review the Fund’s next prospectus, which we expect to be available approximately 120 days after July 31, 2025 at blackrock.com/fundreports or upon request by contacting us at (800) 474-2737.
On July 30, 2024, the Fund’s Board approved a proposal to change the name of the Fund from BlackRock Flexible Income ETF to iShares Flexible Income Active ETF. This change became effective on October 10, 2024.
On July 30, 2024, the Fund’s Board approved a proposal to change the name of the Fund from BlackRock Flexible Income ETF to iShares Flexible Income Active ETF. This change became effective on October 10, 2024.
This is a summary of certain changes to the Fund since July 31, 2024. For more complete information, you may review the Fund’s next prospectus, which we expect to be available approximately 120 days after July 31, 2025 at blackrock.com/fundreports or upon request by contacting us at (800) 474-2737.
This report describes changes to the Fund that occurred during the reporting period.
What were the Fund costs for the last year?
(based on a hypothetical $10,000 investment)
| Fund name | Costs of a $10,000 investment |
Costs paid as a percentage of a $10,000 investment |
| $20 | 0.20% |
How did the Fund perform last year?
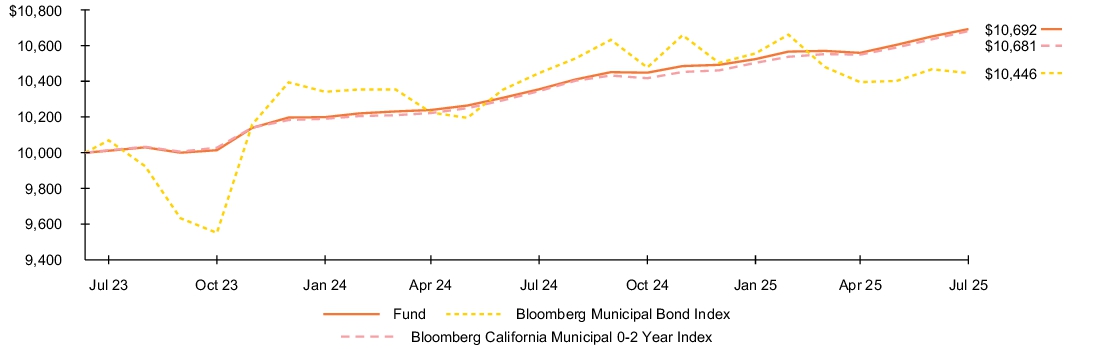
- For the reporting period ended July 31, 2025, the Fund returned 3.26%.
- For the same period, the Bloomberg Municipal Bond Index returned 0.00%, and the Bloomberg California Municipal 0-2 Year Index returned 3.24%.
What contributed to performance?
Holdings in longer-dated securities—those with maturities of up to five years—in the corporate, prepaid gas, and transportation sectors contributed to performance, as did select holdings in the school district, tax-backed state, and tax-backed local categories. A focus on variable rate demand notes (VRDNs) and tender option bond floaters (TOBs) as core holdings, which in the adviser’s view featured both attractive yields and price stability, also contributed. Select commercial paper purchases, which offered additional yield and short maturity profiles, further helped results in a volatile interest rate environment. In terms of credit tiers, holdings in AA and A rated bonds had the strongest influence on the Fund’s performance.
What detracted from performance?
At a time of positive return for the California municipal market, there were no meaningful detractors from absolute returns.
The views expressed reflect the opinions of BlackRock as of the date of this report and are subject to change based on changes in market, economic or other conditions. These views are not intended to be a forecast of future events and are no guarantee of future results.
Fund performance
Cumulative performance: July 11, 2023 through July 31, 2025
Initial investment of $10,000
See “Average annual total returns” for additional information on fund performance.
| Average annual total returns | ||||
| 1 Year | Since Fund Inception |
|||
| 3.26 | % | 3.30 | % | |
| 0.00 | 2.15 | |||
| 3.24 | 3.26 |
| Key Fund statistics | |
| $131,136,615 | |
| 138 | |
| $125,081 | |
| 113% |
What did the Fund invest in?
(as of July 31, 2025)
Credit quality allocation
| Credit Rating* | Percent of Total Investments(a) |
|
| 4.2 | % | |
| 64.0 | ||
| 30.3 | ||
| 1.3 | ||
| 0.2 |
Ten largest holdings
| Security | Percent of Total Investments(a) |
|
| 4.6 | % | |
| 4.2 | ||
| 3.5 | ||
| 3.4 | ||
| 3.0 | ||
| 2.9 | ||
| 2.3 | ||
| 2.3 | ||
| 2.2 | ||
| 1.8 |
| Excludes money market funds. |
| For purposes of this report, credit quality ratings shown above reflect the highest rating assigned by either S&P Global Ratings or Moody’s Investors Service, Inc. if ratings differ. These rating agencies are independent, nationally recognized statistical rating organizations and are widely used. Investment grade ratings are credit ratings of BBB/Baa or higher. Below investment grade ratings are credit ratings of BB/Ba or lower. Investments designated N/R are not rated by either rating agency. Unrated investments do not necessarily indicate low credit quality. Credit quality ratings are subject to change. |
Ten largest holdings
| Security | Percent of Total Investments(a) |
|
| 4.6 | % | |
| 4.2 | ||
| 3.5 | ||
| 3.4 | ||
| 3.0 | ||
| 2.9 | ||
| 2.3 | ||
| 2.3 | ||
| 2.2 | ||
| 1.8 |
Material Fund changes
This is a summary of certain changes to the Fund since July 31, 2024. For more complete information, you may review the Fund’s next prospectus, which we expect to be available approximately 120 days after July 31, 2025 at blackrock.com/fundreports or upon request by contacting us at (800) 474-2737.
On July 30, 2024, the Fund’s Board approved a proposal to change the name of the Fund from BlackRock Short-Term California Muni Bond ETF to iShares Short-Term California Muni Active ETF. The Fund's ticker was changed from CALY to CALI. These changes became effective on October 10, 2024.
On July 30, 2024, the Fund’s Board approved a proposal to change the name of the Fund from BlackRock Short-Term California Muni Bond ETF to iShares Short-Term California Muni Active ETF. The Fund's ticker was changed from CALY to CALI. These changes became effective on October 10, 2024.
This is a summary of certain changes to the Fund since July 31, 2024. For more complete information, you may review the Fund’s next prospectus, which we expect to be available approximately 120 days after July 31, 2025 at blackrock.com/fundreports or upon request by contacting us at (800) 474-2737.
This report describes changes to the Fund that occurred during the reporting period.
What were the Fund costs for the last year?
(based on a hypothetical $10,000 investment)
| Fund name | Costs of a $10,000 investment |
Costs paid as a percentage of a $10,000 investment |
| $38 | 0.37% |
How did the Fund perform last year?
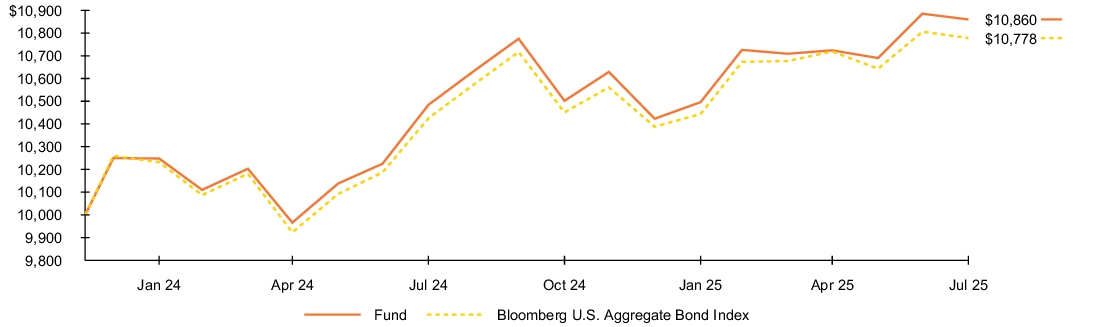
- For the reporting period ended July 31, 2025, the Fund returned 3.59%.
- For the same period, the Bloomberg U.S. Aggregate Bond Index returned 3.38%.
What contributed to performance?
Over the 12-month period, economic growth generally surprised to the upside and credit sensitive sectors across fixed income performed well despite elevated interest rate volatility. Positive contributions to the Fund’s performance were led by the allocation to securitized assets including commercial mortgage-backed securities, non-agency mortgage-backed securities, collateralized loan obligations and asset-backed securities. The Fund’s allocation to and positioning within both investment grade corporate bonds and agency mortgage-backed securities also proved additive, along with an allocation to high yield corporate bonds.
What detracted from performance?
The Fund’s positioning with respect to duration and corresponding interest rate sensitivity was a modest detractor from performance over the period.
The views expressed reflect the opinions of BlackRock as of the date of this report and are subject to change based on changes in market, economic or other conditions. These views are not intended to be a forecast of future events and are no guarantee of future results.
Fund performance
Cumulative performance: December 12, 2023 through July 31, 2025
Initial investment of $10,000
See “Average annual total returns” for additional information on fund performance.
| Average annual total returns | ||||
| 1 Year | Since Fund Inception |
|||
| 3.59 | % | 5.17 | % | |
| 3.38 | 4.69 |
| Key Fund statistics | |
| $257,870,012 | |
| 1,681 | |
| $594,314 | |
| 647% |
What did the Fund invest in?
(as of July 31, 2025)
Credit quality allocation
| Credit Rating* | Percent of Total Investments(a) |
|
| 63.2 | % | |
| 3.1 | ||
| 5.6 | ||
| 13.8 | ||
| 3.8 | ||
| 0.9 | ||
| 0.8 | ||
| 0.1 | ||
| 0.5 | ||
| 8.2 |
Maturity allocation
| Maturity | Percent of Total Investments(a) |
|
| 2.0 | % | |
| 19.9 | ||
| 21.2 | ||
| 10.1 | ||
| 4.9 | ||
| 41.9 |
| Excludes money market funds. |
| For purposes of this report, credit quality ratings shown above reflect the highest rating assigned by either S&P Global Ratings or Moody’s Investors Service, Inc. if ratings differ. These rating agencies are independent, nationally recognized statistical rating organizations and are widely used. Investment grade ratings are credit ratings of BBB/Baa or higher. Below investment grade ratings are credit ratings of BB/Ba or lower. Investments designated N/R are not rated by either rating agency. Unrated investments do not necessarily indicate low credit quality. Credit quality ratings are subject to change. |
Material Fund changes
This is a summary of certain changes to the Fund since July 31, 2024. For more complete information, you may review the Fund’s next prospectus, which we expect to be available approximately 120 days after July 31, 2025 at blackrock.com/fundreports or upon request by contacting us at (800) 474-2737.
On July 30, 2024, the Fund’s Board approved a proposal to change the name of the Fund from BlackRock Total Return ETF to iShares Total Return Active ETF. This change became effective on October 10, 2024.
On July 30, 2024, the Fund’s Board approved a proposal to change the name of the Fund from BlackRock Total Return ETF to iShares Total Return Active ETF. This change became effective on October 10, 2024.
This is a summary of certain changes to the Fund since July 31, 2024. For more complete information, you may review the Fund’s next prospectus, which we expect to be available approximately 120 days after July 31, 2025 at blackrock.com/fundreports or upon request by contacting us at (800) 474-2737.
What were the Fund costs for the period?
(based on a hypothetical $10,000 investment)
| Fund name | Costs of a $10,000 investment |
Costs paid as a percentage of a $10,000 investment |
| $23(a) | 0.45%(b) |
| The Fund commenced operations during the reporting period. Expenses for a full reporting period would be higher than the amount shown. |
| Annualized. |
How did the Fund perform during the period?
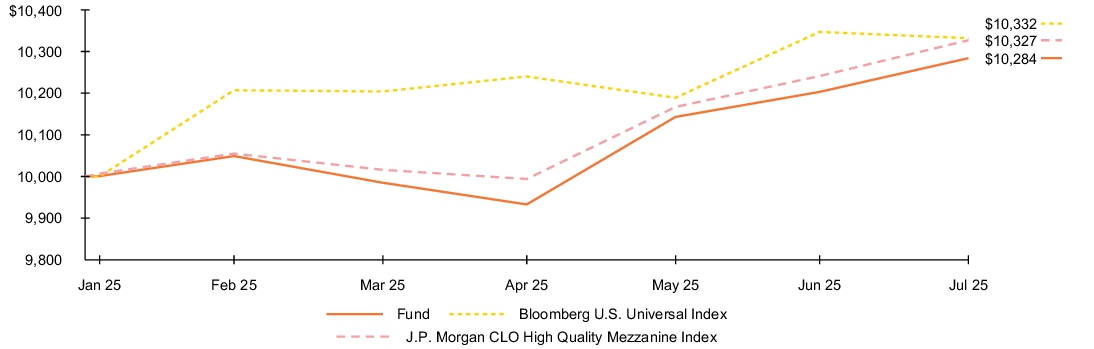
- For the period beginning with the Fund’s January 29, 2025 inception and ended July 31, 2025, the Fund returned 2.84%.
- For the same period, the Bloomberg U.S. Universal Index returned 3.32%, and the J.P. Morgan CLO High Quality Mezzanine Index returned 3.27%.
What contributed to performance?
The largest contributor to the Fund’s absolute return was portfolio yield as the Secured Overnight Financing Rate which serves as the base rate for CLOs benefited from the U.S. Federal Reserve holding short term policy rates steady over the time frame. In addition, the average discount margin on the floating rate securities held contributed positively to the contribution to return from portfolio yield.
What detracted from performance?
The widening of spreads and accompanying downward pressure on prices for CLOs rated BBB and BB during the elevated market volatility in April of 2025 weighed on returns for the period.
The views expressed reflect the opinions of BlackRock as of the date of this report and are subject to change based on changes in market, economic or other conditions. These views are not intended to be a forecast of future events and are no guarantee of future results.
Fund performance
Cumulative performance: January 29, 2025 through July 31, 2025
Initial investment of $10,000
See “Average annual total returns” for additional information on fund performance.
Average annual total returns
As of the date of this report, the Fund does not have a full fiscal year of performance information to report.
| Key Fund statistics | |
| $64,849,853 | |
| 41 | |
| $134,857 | |
| 30% |
What did the Fund invest in?
(as of July 31, 2025)
Maturity allocation
| Maturity | Percent of Total Investments(a) |
|
| 4.7 | % | |
| 95.3 |
Ten largest holdings
| Security | Percent of Total Investments(a) |
|
| 6.3 | % | |
| 4.8 | ||
| 4.6 | ||
| 4.0 | ||
| 3.6 | ||
| 3.2 | ||
| 3.2 | ||
| 3.2 | ||
| 3.2 | ||
| 3.2 |
| Excludes money market funds. |
Ten largest holdings
| Security | Percent of Total Investments(a) |
|
| 6.3 | % | |
| 4.8 | ||
| 4.6 | ||
| 4.0 | ||
| 3.6 | ||
| 3.2 | ||
| 3.2 | ||
| 3.2 | ||
| 3.2 | ||
| 3.2 |
| Excludes money market funds. |
| [1] | The Fund commenced operations during the reporting period. Expenses for a full reporting period would be higher than the amount shown. |
| [2] | Annualized. |