Shareholder Report
|
12 Months Ended |
|
Jul. 31, 2025
USD ($)
Holding
|
|---|
| Shareholder Report [Line Items] |
|
| Document Type |
N-CSR
|
| Amendment Flag |
false
|
| Registrant Name |
AB LARGE CAP GROWTH FUND INC
|
| Entity Central Index Key |
0000889508
|
| Entity Investment Company Type |
N-1A
|
| Document Period End Date |
Jul. 31, 2025
|
| C000028342 |
|
| Shareholder Report [Line Items] |
|
| Fund Name |
AB Large Cap Growth Fund
|
| Class Name |
Advisor Class
|
| Trading Symbol |
APGYX
|
| Annual or Semi-Annual Statement [Text Block] |
This annual shareholder report contains important information about the AB Large Cap Growth Fund (the “Fund”) for the period of August 1, 2024 to July 31, 2025.
|
| Shareholder Report Annual or Semi-Annual |
Annual Shareholder Report
|
| Additional Information [Text Block] |
You can find additional information about the Fund at https://www.abfunds.com/link/AB/APGYX-A. You can also request this information by contacting us at (800) 227 4618.
|
| Additional Information Phone Number |
(800) 227 4618
|
| Additional Information Website |
https://www.abfunds.com/link/AB/APGYX-A
|
| Expenses [Text Block] |
What were the Fund costs for the last year?(Based on a hypothetical $10,000 investment)
Class Name |
Cost of a $10,000 investment |
Costs paid as a percentage of a $10,000 investment |
Advisor Class |
$60 |
0.55% | |
| Expenses Paid, Amount |
$ 60
|
| Expense Ratio, Percent |
0.55%
|
| Factors Affecting Performance [Text Block] |
How did the Fund perform last year? What affected the Fund’s performance?During the 12-month period ended July 31, 2025, all share classes of the Fund underperformed the Russell 1000 Growth index (the "benchmark"), before sales charges. Overall sector allocation and security selection were negative, which drove underperformance, relative to the benchmark. Overweights to health care and consumer staples and an underweight to technology detracted from performance, while an overweight to communication services and underweights to consumer discretionary and real estate contributed. Security selection within industrials, consumer discretionary and health detracted, while selection within communication services, technology and consumer staples contributed to the Fund's absolute returns throughout the reporting period. |
| Performance Past Does Not Indicate Future [Text] |
<span style="font-weight: 700; box-sizing: border-box; color: rgb(0, 0, 0); display: inline; flex-wrap: nowrap; font-size: 12px; grid-area: auto; line-height: 15.6px; margin: 0px; overflow: visible; text-align: left; text-align-last: auto; white-space-collapse: preserve-breaks;">The Fund’s past performance is not a good predictor of the Fund’s future performance.</span>
|
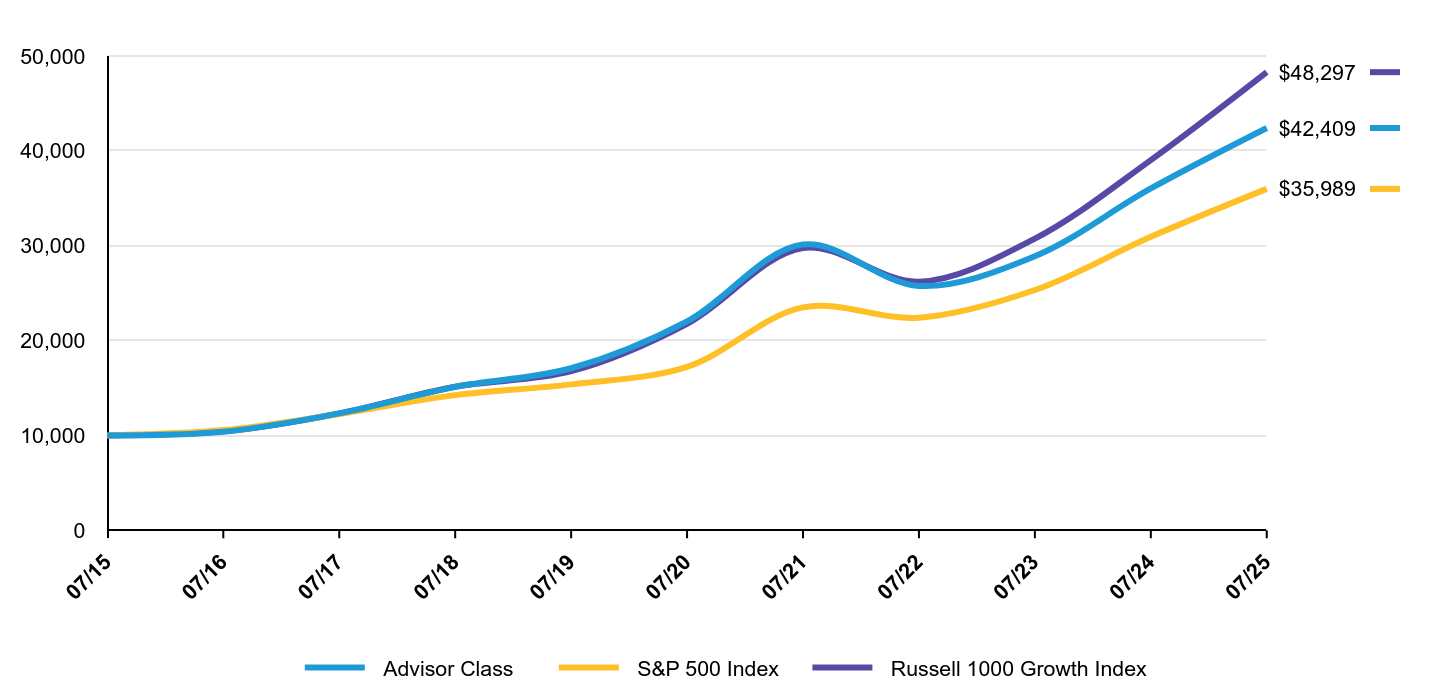
| Line Graph [Table Text Block] |
|
Advisor Class |
S&P 500 Index |
Russell 1000 Growth Index |
07/15 |
$10,000 |
$10,000 |
$10,000 |
07/16 |
$10,385 |
$10,561 |
$10,435 |
07/17 |
$12,320 |
$12,256 |
$12,318 |
07/18 |
$15,120 |
$14,246 |
$15,132 |
07/19 |
$17,081 |
$15,384 |
$16,770 |
07/20 |
$22,021 |
$17,223 |
$21,774 |
07/21 |
$30,123 |
$23,500 |
$29,760 |
07/22 |
$25,760 |
$22,410 |
$26,210 |
07/23 |
$28,895 |
$25,327 |
$30,747 |
07/24 |
$36,035 |
$30,936 |
$39,029 |
07/25 |
$42,409 |
$35,989 |
$48,297 |
|
| Average Annual Return [Table Text Block] |
AATR |
1 Year |
5 Years |
10 Years |
Advisor Class |
17.68% |
14.00% |
15.54% |
S&P 500 Index |
16.33% |
15.88% |
13.66% |
Russell 1000 Growth Index |
23.75% |
17.27% |
17.06% | |
| No Deduction of Taxes [Text Block] |
The graph and table do not reflect the deduction of taxes that a shareholder would pay on Fund distributions or the redemption or sale of Fund shares.
|
| AssetsNet |
$ 27,503,262,935
|
| Holdings Count | Holding |
56
|
| Advisory Fees Paid, Amount |
$ 127,310,383
|
| InvestmentCompanyPortfolioTurnover |
25.00%
|
| Additional Fund Statistics [Text Block] |
Net Assets |
$27,503,262,935 |
# of Portfolio Holdings |
56 |
Portfolio Turnover Rate |
25% |
Total Advisory Fees Paid (Net) |
$127,310,383 | |
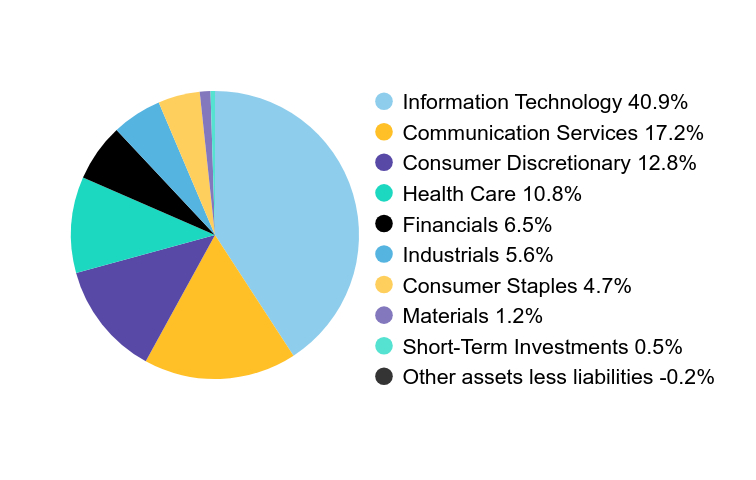
| Holdings [Text Block] |
Sector Breakdown (% of Net Assets)
Value |
Value |
Information Technology |
40.9% |
Communication Services |
17.2% |
Consumer Discretionary |
12.8% |
Health Care |
10.8% |
Financials |
6.5% |
Industrials |
5.6% |
Consumer Staples |
4.7% |
Materials |
1.2% |
Short-Term Investments |
0.5% |
Other assets less liabilities |
-0.2% | |
| Largest Holdings [Text Block] |
Company |
U.S. $ Value |
% of Net Assets |
NVIDIA Corp. |
$3,300,230,574 |
12.0% |
Microsoft Corp. |
$2,607,912,318 |
9.5% |
Amazon.com, Inc. |
$1,888,492,328 |
6.9% |
Meta Platforms, Inc. - Class A |
$1,879,569,802 |
6.8% |
Broadcom, Inc. |
$1,512,080,381 |
5.5% |
Alphabet, Inc. - Class C |
$1,498,078,622 |
5.4% |
Netflix, Inc. |
$1,266,505,372 |
4.6% |
Visa, Inc. - Class A |
$1,167,324,820 |
4.2% |
Costco Wholesale Corp. |
$682,350,594 |
2.5% |
Eli Lilly & Co. |
$652,871,992 |
2.4% |
Total |
$16,455,416,803 |
59.8% | |
| Material Fund Change [Text Block] |
|
| C000028338 |
|
| Shareholder Report [Line Items] |
|
| Fund Name |
AB Large Cap Growth Fund
|
| Class Name |
Class A
|
| Trading Symbol |
APGAX
|
| Annual or Semi-Annual Statement [Text Block] |
This annual shareholder report contains important information about the AB Large Cap Growth Fund (the “Fund”) for the period of August 1, 2024 to July 31, 2025.
|
| Shareholder Report Annual or Semi-Annual |
Annual Shareholder Report
|
| Additional Information [Text Block] |
You can find additional information about the Fund at https://www.abfunds.com/link/AB/APGAX-A. You can also request this information by contacting us at (800) 227 4618.
|
| Additional Information Phone Number |
(800) 227 4618
|
| Additional Information Website |
https://www.abfunds.com/link/AB/APGAX-A
|
| Expenses [Text Block] |
What were the Fund costs for the last year?(Based on a hypothetical $10,000 investment)
Class Name |
Cost of a $10,000 investment |
Costs paid as a percentage of a $10,000 investment |
Class A |
$87 |
0.80% | |
| Expenses Paid, Amount |
$ 87
|
| Expense Ratio, Percent |
0.80%
|
| Factors Affecting Performance [Text Block] |
How did the Fund perform last year? What affected the Fund’s performance?During the 12-month period ended July 31, 2025, all share classes of the Fund underperformed the Russell 1000 Growth index (the "benchmark"), before sales charges. Overall sector allocation and security selection were negative, which drove underperformance, relative to the benchmark. Overweights to health care and consumer staples and an underweight to technology detracted from performance, while an overweight to communication services and underweights to consumer discretionary and real estate contributed. Security selection within industrials, consumer discretionary and health detracted, while selection within communication services, technology and consumer staples contributed to the Fund's absolute returns throughout the reporting period. |
| Performance Past Does Not Indicate Future [Text] |
<span style="font-weight: 700; box-sizing: border-box; color: rgb(0, 0, 0); display: inline; flex-wrap: nowrap; font-size: 12px; grid-area: auto; line-height: 15.6px; margin: 0px; overflow: visible; text-align: left; text-align-last: auto; white-space-collapse: preserve-breaks;">The Fund’s past performance is not a good predictor of the Fund’s future performance.</span>
|
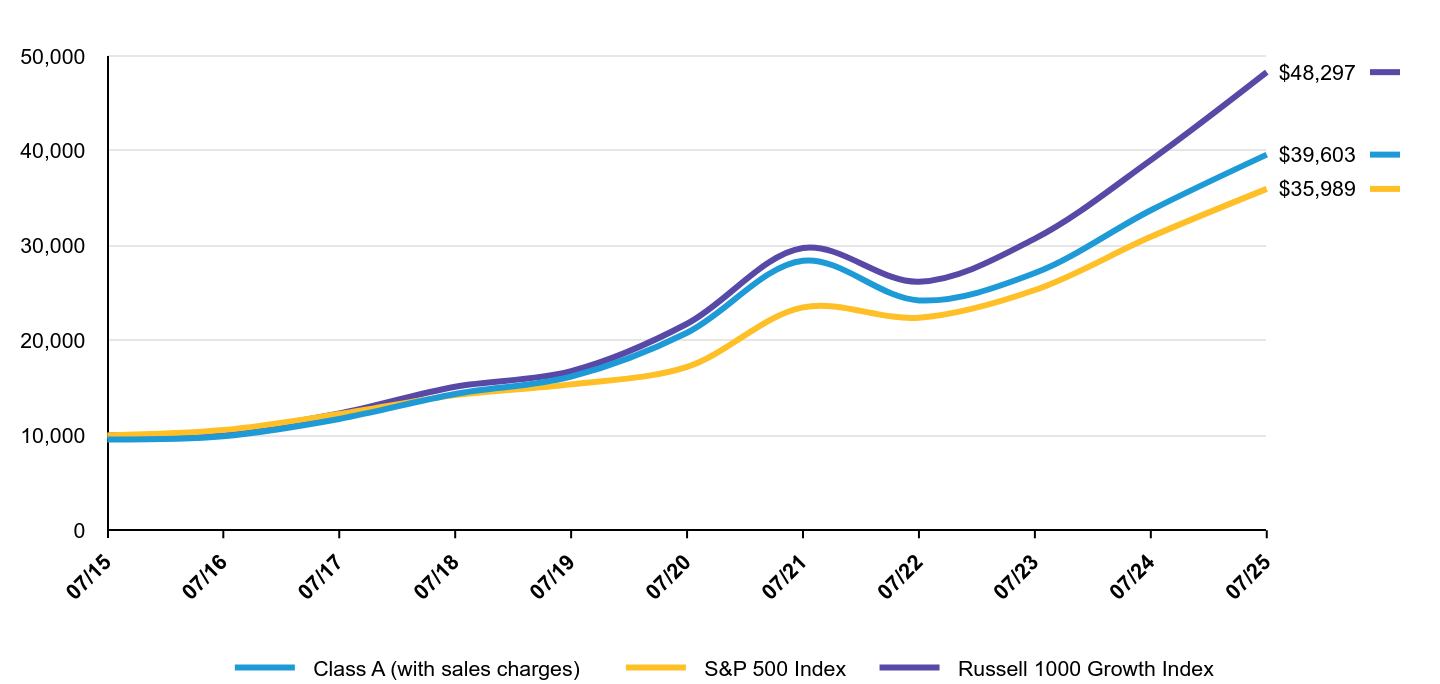
| Line Graph [Table Text Block] |
|
Class A (with sales charges) |
S&P 500 Index |
Russell 1000 Growth Index |
07/15 |
$9,575 |
$10,000 |
$10,000 |
07/16 |
$9,919 |
$10,561 |
$10,435 |
07/17 |
$11,737 |
$12,256 |
$12,318 |
07/18 |
$14,369 |
$14,246 |
$15,132 |
07/19 |
$16,194 |
$15,384 |
$16,770 |
07/20 |
$20,826 |
$17,223 |
$21,774 |
07/21 |
$28,415 |
$23,500 |
$29,760 |
07/22 |
$24,236 |
$22,410 |
$26,210 |
07/23 |
$27,119 |
$25,327 |
$30,747 |
07/24 |
$33,737 |
$30,936 |
$39,029 |
07/25 |
$39,603 |
$35,989 |
$48,297 |
|
| Average Annual Return [Table Text Block] |
AATR |
1 Year |
5 Years |
10 Years |
Class A (without sales charges) |
17.39% |
13.72% |
15.26% |
Class A (with sales charges) |
12.39% |
12.73% |
14.76% |
S&P 500 Index |
16.33% |
15.88% |
13.66% |
Russell 1000 Growth Index |
23.75% |
17.27% |
17.06% | |
| No Deduction of Taxes [Text Block] |
The graph and table do not reflect the deduction of taxes that a shareholder would pay on Fund distributions or the redemption or sale of Fund shares.
|
| AssetsNet |
$ 27,503,262,935
|
| Holdings Count | Holding |
56
|
| Advisory Fees Paid, Amount |
$ 127,310,383
|
| InvestmentCompanyPortfolioTurnover |
25.00%
|
| Additional Fund Statistics [Text Block] |
Net Assets |
$27,503,262,935 |
# of Portfolio Holdings |
56 |
Portfolio Turnover Rate |
25% |
Total Advisory Fees Paid (Net) |
$127,310,383 | |
| Holdings [Text Block] |
Sector Breakdown (% of Net Assets)
Value |
Value |
Information Technology |
40.9% |
Communication Services |
17.2% |
Consumer Discretionary |
12.8% |
Health Care |
10.8% |
Financials |
6.5% |
Industrials |
5.6% |
Consumer Staples |
4.7% |
Materials |
1.2% |
Short-Term Investments |
0.5% |
Other assets less liabilities |
-0.2% | |
| Largest Holdings [Text Block] |
Company |
U.S. $ Value |
% of Net Assets |
NVIDIA Corp. |
$3,300,230,574 |
12.0% |
Microsoft Corp. |
$2,607,912,318 |
9.5% |
Amazon.com, Inc. |
$1,888,492,328 |
6.9% |
Meta Platforms, Inc. - Class A |
$1,879,569,802 |
6.8% |
Broadcom, Inc. |
$1,512,080,381 |
5.5% |
Alphabet, Inc. - Class C |
$1,498,078,622 |
5.4% |
Netflix, Inc. |
$1,266,505,372 |
4.6% |
Visa, Inc. - Class A |
$1,167,324,820 |
4.2% |
Costco Wholesale Corp. |
$682,350,594 |
2.5% |
Eli Lilly & Co. |
$652,871,992 |
2.4% |
Total |
$16,455,416,803 |
59.8% | |
| Material Fund Change [Text Block] |
|
| C000028341 |
|
| Shareholder Report [Line Items] |
|
| Fund Name |
AB Large Cap Growth Fund
|
| Class Name |
Class C
|
| Trading Symbol |
APGCX
|
| Annual or Semi-Annual Statement [Text Block] |
This annual shareholder report contains important information about the AB Large Cap Growth Fund (the “Fund”) for the period of August 1, 2024 to July 31, 2025.
|
| Shareholder Report Annual or Semi-Annual |
Annual Shareholder Report
|
| Additional Information [Text Block] |
You can find additional information about the Fund at https://www.abfunds.com/link/AB/APGCX-A. You can also request this information by contacting us at (800) 227 4618.
|
| Additional Information Phone Number |
(800) 227 4618
|
| Additional Information Website |
https://www.abfunds.com/link/AB/APGCX-A
|
| Expenses [Text Block] |
What were the Fund costs for the last year?(Based on a hypothetical $10,000 investment)
Class Name |
Cost of a $10,000 investment |
Costs paid as a percentage of a $10,000 investment |
Class C |
$168 |
1.55% | |
| Expenses Paid, Amount |
$ 168
|
| Expense Ratio, Percent |
1.55%
|
| Factors Affecting Performance [Text Block] |
How did the Fund perform last year? What affected the Fund’s performance?During the 12-month period ended July 31, 2025, all share classes of the Fund underperformed the Russell 1000 Growth index (the "benchmark"), before sales charges. Overall sector allocation and security selection were negative, which drove underperformance, relative to the benchmark. Overweights to health care and consumer staples and an underweight to technology detracted from performance, while an overweight to communication services and underweights to consumer discretionary and real estate contributed. Security selection within industrials, consumer discretionary and health detracted, while selection within communication services, technology and consumer staples contributed to the Fund's absolute returns throughout the reporting period. |
| Performance Past Does Not Indicate Future [Text] |
<span style="font-weight: 700; box-sizing: border-box; color: rgb(0, 0, 0); display: inline; flex-wrap: nowrap; font-size: 12px; grid-area: auto; line-height: 15.6px; margin: 0px; overflow: visible; text-align: left; text-align-last: auto; white-space-collapse: preserve-breaks;">The Fund’s past performance is not a good predictor of the Fund’s future performance.</span>
|
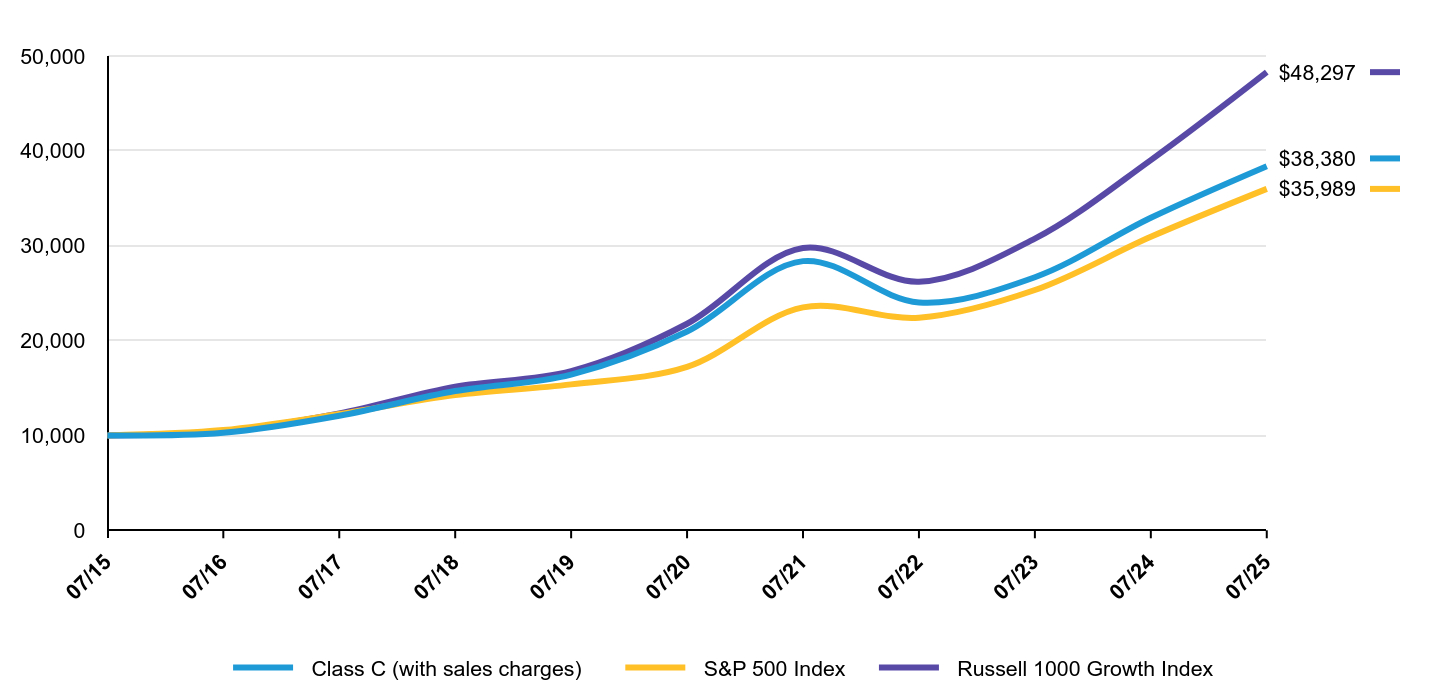
| Line Graph [Table Text Block] |
|
Class C (with sales charges) |
S&P 500 Index |
Russell 1000 Growth Index |
07/15 |
$10,000 |
$10,000 |
$10,000 |
07/16 |
$10,282 |
$10,561 |
$10,435 |
07/17 |
$12,078 |
$12,256 |
$12,318 |
07/18 |
$14,676 |
$14,246 |
$15,132 |
07/19 |
$16,415 |
$15,384 |
$16,770 |
07/20 |
$20,951 |
$17,223 |
$21,774 |
07/21 |
$28,376 |
$23,500 |
$29,760 |
07/22 |
$24,024 |
$22,410 |
$26,210 |
07/23 |
$26,677 |
$25,327 |
$30,747 |
07/24 |
$32,942 |
$30,936 |
$39,029 |
07/25 |
$38,380 |
$35,989 |
$48,297 |
|
| Average Annual Return [Table Text Block] |
AATR |
1 Year |
5 Years |
10 Years |
Class C (without sales charges) |
16.51% |
12.87% |
14.40% |
Class C (with sales charges) |
15.51% |
12.87% |
14.40% |
S&P 500 Index |
16.33% |
15.88% |
13.66% |
Russell 1000 Growth Index |
23.75% |
17.27% |
17.06% | |
| No Deduction of Taxes [Text Block] |
The graph and table do not reflect the deduction of taxes that a shareholder would pay on Fund distributions or the redemption or sale of Fund shares.
|
| AssetsNet |
$ 27,503,262,935
|
| Holdings Count | Holding |
56
|
| Advisory Fees Paid, Amount |
$ 127,310,383
|
| InvestmentCompanyPortfolioTurnover |
25.00%
|
| Additional Fund Statistics [Text Block] |
Net Assets |
$27,503,262,935 |
# of Portfolio Holdings |
56 |
Portfolio Turnover Rate |
25% |
Total Advisory Fees Paid (Net) |
$127,310,383 | |
| Holdings [Text Block] |
Sector Breakdown (% of Net Assets)
Value |
Value |
Information Technology |
40.9% |
Communication Services |
17.2% |
Consumer Discretionary |
12.8% |
Health Care |
10.8% |
Financials |
6.5% |
Industrials |
5.6% |
Consumer Staples |
4.7% |
Materials |
1.2% |
Short-Term Investments |
0.5% |
Other assets less liabilities |
-0.2% | |
| Largest Holdings [Text Block] |
Company |
U.S. $ Value |
% of Net Assets |
NVIDIA Corp. |
$3,300,230,574 |
12.0% |
Microsoft Corp. |
$2,607,912,318 |
9.5% |
Amazon.com, Inc. |
$1,888,492,328 |
6.9% |
Meta Platforms, Inc. - Class A |
$1,879,569,802 |
6.8% |
Broadcom, Inc. |
$1,512,080,381 |
5.5% |
Alphabet, Inc. - Class C |
$1,498,078,622 |
5.4% |
Netflix, Inc. |
$1,266,505,372 |
4.6% |
Visa, Inc. - Class A |
$1,167,324,820 |
4.2% |
Costco Wholesale Corp. |
$682,350,594 |
2.5% |
Eli Lilly & Co. |
$652,871,992 |
2.4% |
Total |
$16,455,416,803 |
59.8% | |
| Material Fund Change [Text Block] |
|
| C000028345 |
|
| Shareholder Report [Line Items] |
|
| Fund Name |
AB Large Cap Growth Fund
|
| Class Name |
Class I
|
| Trading Symbol |
ALLIX
|
| Annual or Semi-Annual Statement [Text Block] |
This annual shareholder report contains important information about the AB Large Cap Growth Fund (the “Fund”) for the period of August 1, 2024 to July 31, 2025.
|
| Shareholder Report Annual or Semi-Annual |
Annual Shareholder Report
|
| Additional Information [Text Block] |
You can find additional information about the Fund at https://www.abfunds.com/link/AB/ALLIX-A. You can also request this information by contacting us at (800) 227 4618.
|
| Additional Information Phone Number |
(800) 227 4618
|
| Additional Information Website |
https://www.abfunds.com/link/AB/ALLIX-A
|
| Expenses [Text Block] |
What were the Fund costs for the last year?(Based on a hypothetical $10,000 investment)
Class Name |
Cost of a $10,000 investment |
Costs paid as a percentage of a $10,000 investment |
Class I |
$65 |
0.60% | |
| Expenses Paid, Amount |
$ 65
|
| Expense Ratio, Percent |
0.60%
|
| Factors Affecting Performance [Text Block] |
How did the Fund perform last year? What affected the Fund’s performance?During the 12-month period ended July 31, 2025, all share classes of the Fund underperformed the Russell 1000 Growth index (the "benchmark"), before sales charges. Overall sector allocation and security selection were negative, which drove underperformance, relative to the benchmark. Overweights to health care and consumer staples and an underweight to technology detracted from performance, while an overweight to communication services and underweights to consumer discretionary and real estate contributed. Security selection within industrials, consumer discretionary and health detracted, while selection within communication services, technology and consumer staples contributed to the Fund's absolute returns throughout the reporting period. |
| Performance Past Does Not Indicate Future [Text] |
<span style="font-weight: 700; box-sizing: border-box; color: rgb(0, 0, 0); display: inline; flex-wrap: nowrap; font-size: 12px; grid-area: auto; line-height: 15.6px; margin: 0px; overflow: visible; text-align: left; text-align-last: auto; white-space-collapse: preserve-breaks;">The Fund’s past performance is not a good predictor of the Fund’s future performance.</span>
|
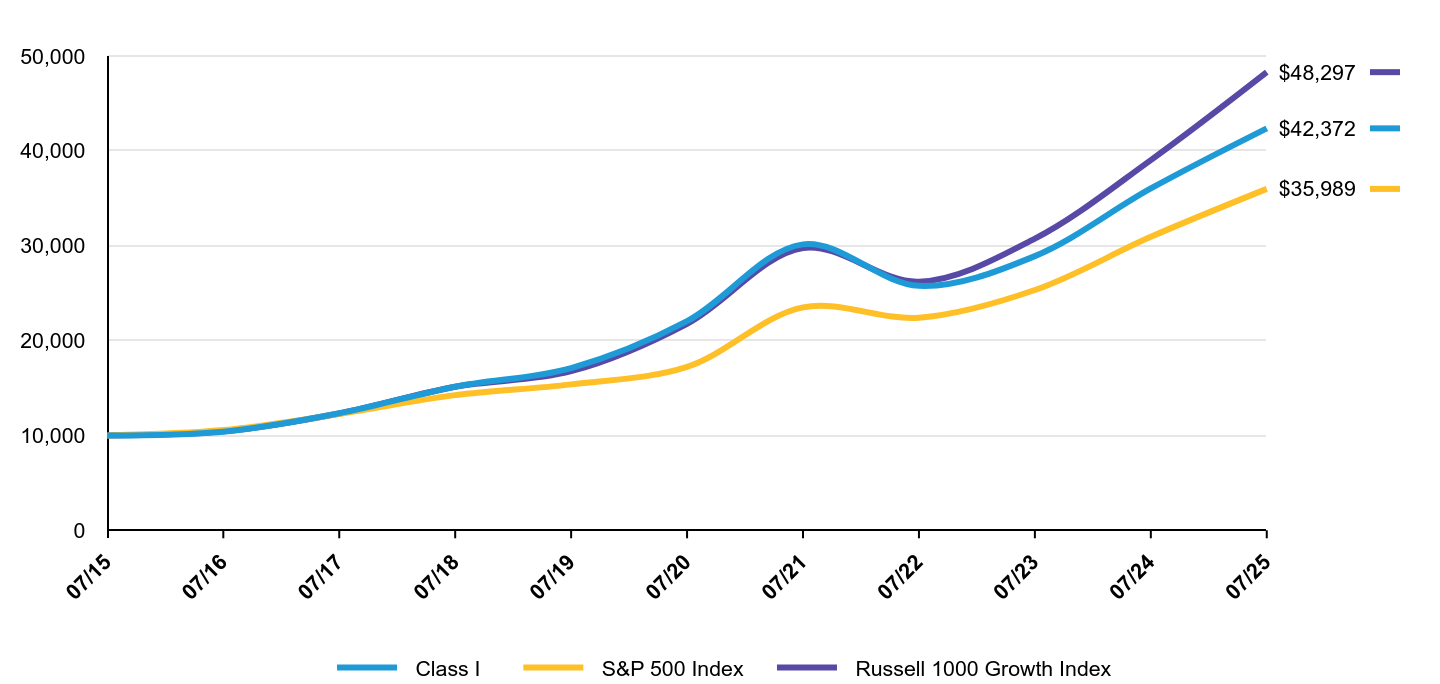
| Line Graph [Table Text Block] |
|
Class I |
S&P 500 Index |
Russell 1000 Growth Index |
07/15 |
$10,000 |
$10,000 |
$10,000 |
07/16 |
$10,395 |
$10,561 |
$10,435 |
07/17 |
$12,332 |
$12,256 |
$12,318 |
07/18 |
$15,136 |
$14,246 |
$15,132 |
07/19 |
$17,103 |
$15,384 |
$16,770 |
07/20 |
$22,042 |
$17,223 |
$21,774 |
07/21 |
$30,140 |
$23,500 |
$29,760 |
07/22 |
$25,767 |
$22,410 |
$26,210 |
07/23 |
$28,903 |
$25,327 |
$30,747 |
07/24 |
$36,036 |
$30,936 |
$39,029 |
07/25 |
$42,372 |
$35,989 |
$48,297 |
|
| Average Annual Return [Table Text Block] |
AATR |
1 Year |
5 Years |
10 Years |
Class I |
17.60% |
13.96% |
15.53% |
S&P 500 Index |
16.33% |
15.88% |
13.66% |
Russell 1000 Growth Index |
23.75% |
17.27% |
17.06% | |
| No Deduction of Taxes [Text Block] |
The graph and table do not reflect the deduction of taxes that a shareholder would pay on Fund distributions or the redemption or sale of Fund shares.
|
| AssetsNet |
$ 27,503,262,935
|
| Holdings Count | Holding |
56
|
| Advisory Fees Paid, Amount |
$ 127,310,383
|
| InvestmentCompanyPortfolioTurnover |
25.00%
|
| Additional Fund Statistics [Text Block] |
Net Assets |
$27,503,262,935 |
# of Portfolio Holdings |
56 |
Portfolio Turnover Rate |
25% |
Total Advisory Fees Paid (Net) |
$127,310,383 | |
| Holdings [Text Block] |
Sector Breakdown (% of Net Assets)
Value |
Value |
Information Technology |
40.9% |
Communication Services |
17.2% |
Consumer Discretionary |
12.8% |
Health Care |
10.8% |
Financials |
6.5% |
Industrials |
5.6% |
Consumer Staples |
4.7% |
Materials |
1.2% |
Short-Term Investments |
0.5% |
Other assets less liabilities |
-0.2% | |
| Largest Holdings [Text Block] |
Company |
U.S. $ Value |
% of Net Assets |
NVIDIA Corp. |
$3,300,230,574 |
12.0% |
Microsoft Corp. |
$2,607,912,318 |
9.5% |
Amazon.com, Inc. |
$1,888,492,328 |
6.9% |
Meta Platforms, Inc. - Class A |
$1,879,569,802 |
6.8% |
Broadcom, Inc. |
$1,512,080,381 |
5.5% |
Alphabet, Inc. - Class C |
$1,498,078,622 |
5.4% |
Netflix, Inc. |
$1,266,505,372 |
4.6% |
Visa, Inc. - Class A |
$1,167,324,820 |
4.2% |
Costco Wholesale Corp. |
$682,350,594 |
2.5% |
Eli Lilly & Co. |
$652,871,992 |
2.4% |
Total |
$16,455,416,803 |
59.8% | |
| Material Fund Change [Text Block] |
|
| C000159956 |
|
| Shareholder Report [Line Items] |
|
| Fund Name |
AB Large Cap Growth Fund
|
| Class Name |
Class Z
|
| Trading Symbol |
APGZX
|
| Annual or Semi-Annual Statement [Text Block] |
This annual shareholder report contains important information about the AB Large Cap Growth Fund (the “Fund”) for the period of August 1, 2024 to July 31, 2025.
|
| Shareholder Report Annual or Semi-Annual |
Annual Shareholder Report
|
| Additional Information [Text Block] |
You can find additional information about the Fund at https://www.abfunds.com/link/AB/APGZX-A. You can also request this information by contacting us at (800) 227 4618.
|
| Additional Information Phone Number |
(800) 227 4618
|
| Additional Information Website |
https://www.abfunds.com/link/AB/APGZX-A
|
| Expenses [Text Block] |
What were the Fund costs for the last year?(Based on a hypothetical $10,000 investment)
Class Name |
Cost of a $10,000 investment |
Costs paid as a percentage of a $10,000 investment |
Class Z |
$54 |
0.50% | |
| Expenses Paid, Amount |
$ 54
|
| Expense Ratio, Percent |
0.50%
|
| Factors Affecting Performance [Text Block] |
How did the Fund perform last year? What affected the Fund’s performance?During the 12-month period ended July 31, 2025, all share classes of the Fund underperformed the Russell 1000 Growth index (the "benchmark"), before sales charges. Overall sector allocation and security selection were negative, which drove underperformance, relative to the benchmark. Overweights to health care and consumer staples and an underweight to technology detracted from performance, while an overweight to communication services and underweights to consumer discretionary and real estate contributed. Security selection within industrials, consumer discretionary and health detracted, while selection within communication services, technology and consumer staples contributed to the Fund's absolute returns throughout the reporting period. |
| Performance Past Does Not Indicate Future [Text] |
<span style="font-weight: 700; box-sizing: border-box; color: rgb(0, 0, 0); display: inline; flex-wrap: nowrap; font-size: 12px; grid-area: auto; line-height: 15.6px; margin: 0px; overflow: visible; text-align: left; text-align-last: auto; white-space-collapse: preserve-breaks;">The Fund’s past performance is not a good predictor of the Fund’s future performance.</span>
|
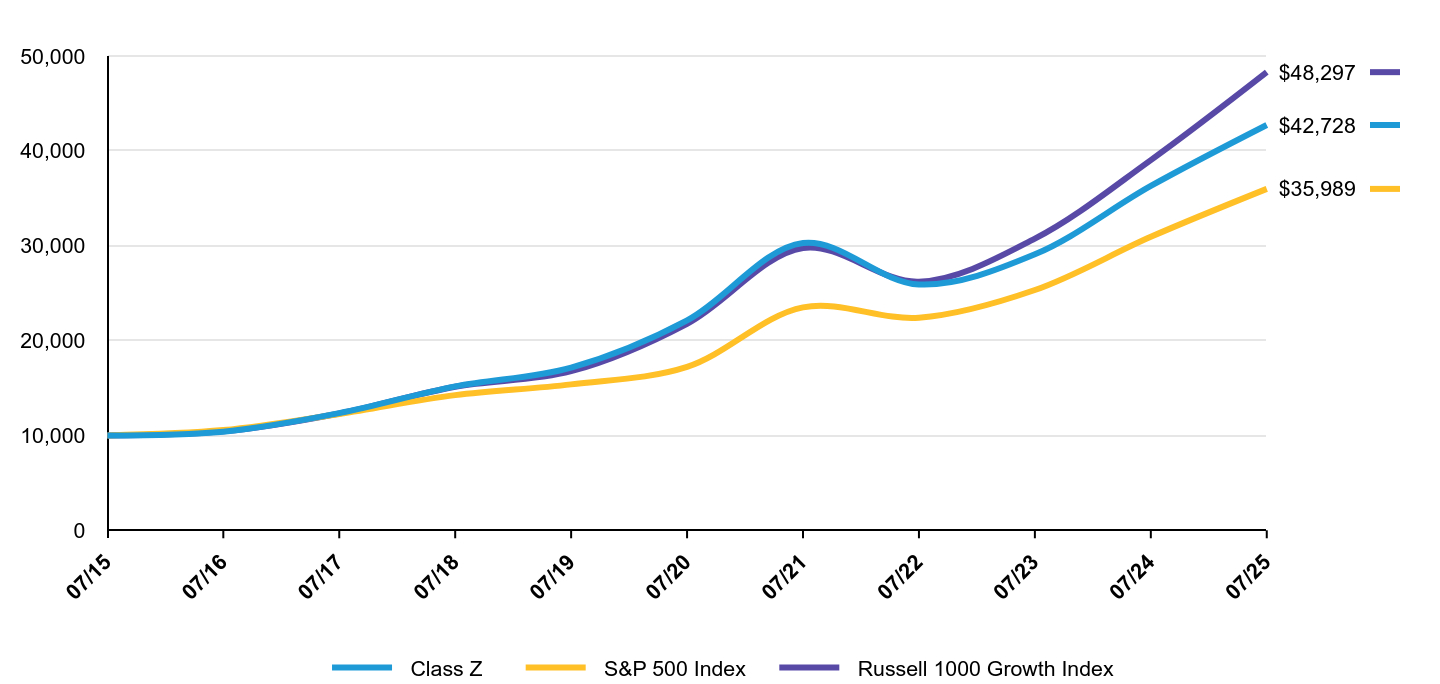
| Line Graph [Table Text Block] |
|
Class Z |
S&P 500 Index |
Russell 1000 Growth Index |
07/15 |
$10,000 |
$10,000 |
$10,000 |
07/16 |
$10,397 |
$10,561 |
$10,435 |
07/17 |
$12,349 |
$12,256 |
$12,318 |
07/18 |
$15,167 |
$14,246 |
$15,132 |
07/19 |
$17,151 |
$15,384 |
$16,770 |
07/20 |
$22,126 |
$17,223 |
$21,774 |
07/21 |
$30,285 |
$23,500 |
$29,760 |
07/22 |
$25,915 |
$22,410 |
$26,210 |
07/23 |
$29,090 |
$25,327 |
$30,747 |
07/24 |
$36,303 |
$30,936 |
$39,029 |
07/25 |
$42,728 |
$35,989 |
$48,297 |
|
| Average Annual Return [Table Text Block] |
AATR |
1 Year |
5 Years |
10 Years |
Class Z |
17.69% |
14.07% |
15.63% |
S&P 500 Index |
16.33% |
15.88% |
13.66% |
Russell 1000 Growth Index |
23.75% |
17.27% |
17.06% | |
| No Deduction of Taxes [Text Block] |
The graph and table do not reflect the deduction of taxes that a shareholder would pay on Fund distributions or the redemption or sale of Fund shares.
|
| AssetsNet |
$ 27,503,262,935
|
| Holdings Count | Holding |
56
|
| Advisory Fees Paid, Amount |
$ 127,310,383
|
| InvestmentCompanyPortfolioTurnover |
25.00%
|
| Additional Fund Statistics [Text Block] |
Net Assets |
$27,503,262,935 |
# of Portfolio Holdings |
56 |
Portfolio Turnover Rate |
25% |
Total Advisory Fees Paid (Net) |
$127,310,383 | |
| Holdings [Text Block] |
Sector Breakdown (% of Net Assets)
Value |
Value |
Information Technology |
40.9% |
Communication Services |
17.2% |
Consumer Discretionary |
12.8% |
Health Care |
10.8% |
Financials |
6.5% |
Industrials |
5.6% |
Consumer Staples |
4.7% |
Materials |
1.2% |
Short-Term Investments |
0.5% |
Other assets less liabilities |
-0.2% | |
| Largest Holdings [Text Block] |
Company |
U.S. $ Value |
% of Net Assets |
NVIDIA Corp. |
$3,300,230,574 |
12.0% |
Microsoft Corp. |
$2,607,912,318 |
9.5% |
Amazon.com, Inc. |
$1,888,492,328 |
6.9% |
Meta Platforms, Inc. - Class A |
$1,879,569,802 |
6.8% |
Broadcom, Inc. |
$1,512,080,381 |
5.5% |
Alphabet, Inc. - Class C |
$1,498,078,622 |
5.4% |
Netflix, Inc. |
$1,266,505,372 |
4.6% |
Visa, Inc. - Class A |
$1,167,324,820 |
4.2% |
Costco Wholesale Corp. |
$682,350,594 |
2.5% |
Eli Lilly & Co. |
$652,871,992 |
2.4% |
Total |
$16,455,416,803 |
59.8% | |
| Material Fund Change [Text Block] |
|