Shareholder Report
Jul. 31, 2025
USD ($)
Holding
columbiathreadneedleus.com/resources/literature
1-800-345-6611.
What were the Fund costs for the reporting period?
(Based on a hypothetical $10,000 investment)
| Class | Cost of a $10,000 investment | Cost paid as a percentage of a $10,000 investment |
| Class A | $ 80 |
0.81 % |
Management's Discussion of Fund Performance
The performance of Class A shares for the period presented is shown in the Average Annual Total Returns table.
Top Performance Contributors
Credit quality security selection
| Positive contribution to benchmark-relative performance was driven by security selection in AAA, AA and BBB rated bonds.Sector security selection
| Strong sector security selection in local general obligation (GO) and hospital bonds contributed to the Fund’s performance relative to its benchmark.Credit quality allocation
| Underweight to AAA bonds added to relative performance.Sector allocation
| An underweight to the state GO bonds added to the Fund’s relative performance.Top Performance Detractors
Yield curve positioning
Heavy
supply and market uncertainty
resulted in a reshaping of the yield curve, driving the curve steeper as short rates declined and intermediate and long rates moved higher. The Fund’s yield curve positioning was the main detractor from performance, relative to its benchmark. Specifically, the Fund’s overweight to longer maturity bonds (20 years and longer) and underweight to the shorter end of the curve detracted, as municipal market interest rates saw a material increase on the long end of the curve.Credit quality allocation
| Overweights to not-rated and BB bonds detracted from relative performance.Sector allocation
| Overweights to charter schools and continuing care retirement communities (CCRCs) detracted.Sector security selection
| Security selection in housing bonds detracted from relative performance.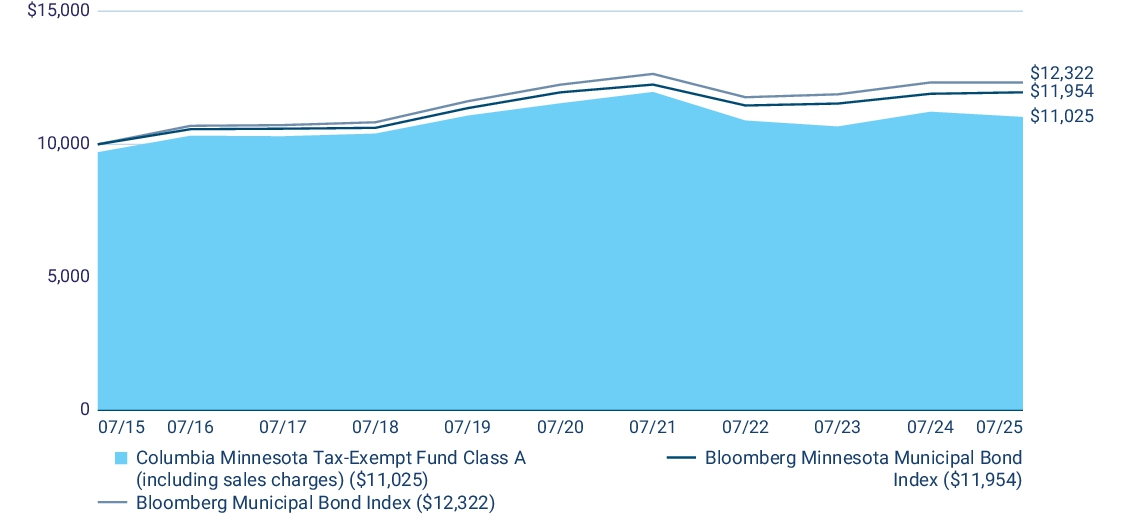
| Average Annual Total Returns (%) | 1 year | 5 years | 10 years |
| Class A (excluding sales charges) | (1.75 ) |
(0.91 ) |
1.29 |
| Class A (including sales charges) | (4.70 ) |
(1.49 ) |
0.98 |
| Bloomberg Minnesota Municipal Bond Index | 0.47 | 0.00 | 1.80 |
| Bloomberg Municipal Bond Index | 0.00 | 0.13 | 2.11 |
columbiathreadneedleus.com/investment-products/mutual-funds
for more recent performance information.
Key Fund Statistics
Fund net assets |
$ 461,142,016 |
Total number of portfolio holdings |
242 |
Management services fees (represents 0.47% of Fund average net assets) |
$ 2,362,545 |
Portfolio turnover for the reporting period |
13% |
Graphical Representation of Fund Holdings
The tables below show the investment makeup of the Fund is subject to change.
represented
as a percentage
of Fund net assets. Derivatives are excluded from the tables unless otherwise noted. The Fund's portfolio
compositio
nTop Holdings
| City of Rochester 11/15/2057 5.000% |
2.8 % |
| Roseville Independent School District No. 623 02/01/2038 4.000% |
2.2 % |
| Southern Minnesota Municipal Power Agency 01/01/2026 0.000% |
2.1 % |
| Brainerd Independent School District No. 181 02/01/2037 4.000% |
2.1 % |
| City of Maple Grove 05/01/2037 4.000% |
2.1 % |
| Minnesota Higher Education Facilities Authority 10/01/2052 5.000% |
1.7 % |
| County of Chippewa 03/01/2037 4.000% |
1.5 % |
| City of Minneapolis 11/15/2037 4.000% |
1.4 % |
| Stillwater Independent School District No. 834 02/01/2042 4.000% |
1.4 % |
| State of Minnesota 08/01/2043 4.000% |
1.4 % |
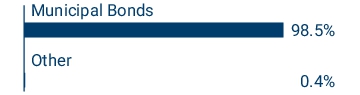
Asset Categories

Top Holdings
| City of Rochester 11/15/2057 5.000% |
2.8 % |
| Roseville Independent School District No. 623 02/01/2038 4.000% |
2.2 % |
| Southern Minnesota Municipal Power Agency 01/01/2026 0.000% |
2.1 % |
| Brainerd Independent School District No. 181 02/01/2037 4.000% |
2.1 % |
| City of Maple Grove 05/01/2037 4.000% |
2.1 % |
| Minnesota Higher Education Facilities Authority 10/01/2052 5.000% |
1.7 % |
| County of Chippewa 03/01/2037 4.000% |
1.5 % |
| City of Minneapolis 11/15/2037 4.000% |
1.4 % |
| Stillwater Independent School District No. 834 02/01/2042 4.000% |
1.4 % |
| State of Minnesota 08/01/2043 4.000% |
1.4 % |
columbiathreadneedleus.com/resources/literature
. You can also request more information by contacting us at 1-800-345-6611.
What were the Fund costs for the reporting period?
(Based on a hypothetical $10,000 investment)
| Class | Cost of a $10,000 investment | Cost paid as a percentage of a $10,000 investment |
| Class C | $ 153 | 1.55 % |
Management's Discussion of Fund Performance
The performance of Class C shares for the period presented is shown in the Average Annual Total Returns table.
Sector security selection
| Strong sector security selection in local general obligation (GO) and hospital bonds contributed to the Fund’s performance relative to its benchmark.Credit quality allocation
| Underweight to AAA bonds added to relative performance.Sector allocation
| An underweight to the state GO bonds added to the Fund’s relative performance.Top Performance Detractors
Yield curve positioning
Credit quality allocation
| Overweights to not-rated and BB bonds
detracted from relative performance.Sector allocation
| Overweights to charter schools and continuing care retirement communities (CCRCs) detracted.Sector security selection
| Security selection in housing bonds detracted from relative performance.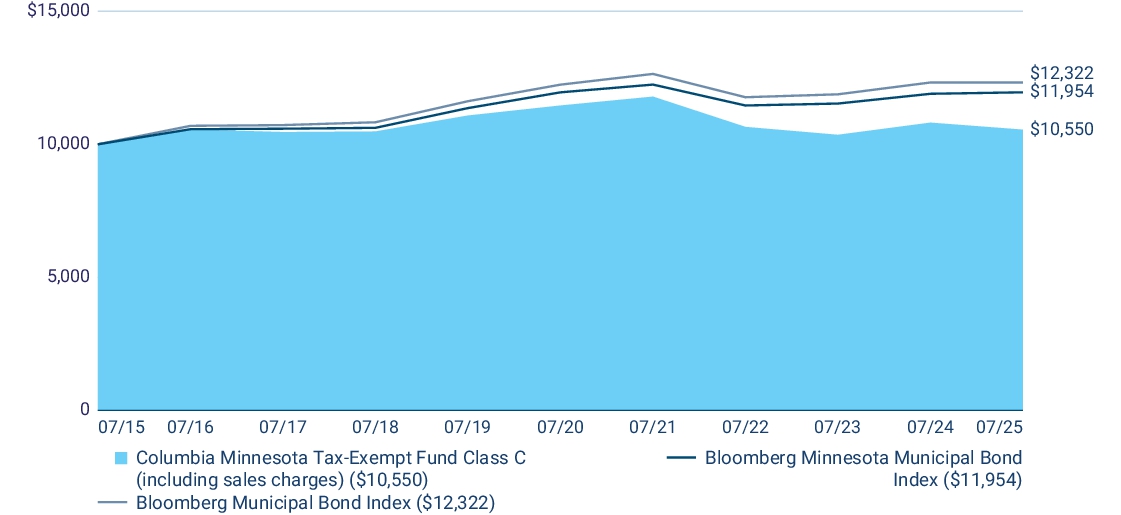
| Average Annual Total Returns (%) | 1 year | 5 years | 10 years |
| Class C (excluding sales charges) | (2.43 ) | (1.64 ) | 0.54 |
| Class C (including sales charges) | (3.39 ) | (1.64 ) | 0.54 |
| Bloomberg Minnesota Municipal Bond Index | 0.47 | 0.00 | 1.80 |
| Bloomberg Municipal Bond Index | 0.00 | 0.13 | 2.11 |
columbiathreadneedleus.com/investment-products/mutual-funds
for more recent performance information.
Key Fund
Statistics
Fund net assets | $ 461,142,016 |
Total number of portfolio holdings | 242 |
Management services fees (represents 0.47% of Fund average net assets) | $ 2,362,545 |
Portfolio turnover for the reporting period | 13% |
Graphical Repr Holdings
es
entation of FundTop
Holdings
| City of Rochester 11/15/2057 5.000% | 2.8 % |
| Roseville Independent School District No. 623 02/01/2038 4.000% | 2.2 % |
| Southern Minnesota Municipal Power Agency 01/01/2026 0.000% | 2.1 % |
| Brainerd Independent School District No. 181 02/01/2037 4.000% | 2.1 % |
| City of Maple Grove 05/01/2037 4.000% | 2.1 % |
| Minnesota Higher Education Facilities Authority 10/01/2052 5.000% | 1.7 % |
| County of Chippewa 03/01/2037 4.000% | 1.5 % |
| City of Minneapolis 11/15/2037 4.000% | 1.4 % |
| Stillwater Independent School District No. 834 02/01/2042 4.000% | 1.4 % |
| State of Minnesota 08/01/2043 4.000% | 1.4 % |
Asset Categories

Top
Holdings
| City of Rochester 11/15/2057 5.000% | 2.8 % |
| Roseville Independent School District No. 623 02/01/2038 4.000% | 2.2 % |
| Southern Minnesota Municipal Power Agency 01/01/2026 0.000% | 2.1 % |
| Brainerd Independent School District No. 181 02/01/2037 4.000% | 2.1 % |
| City of Maple Grove 05/01/2037 4.000% | 2.1 % |
| Minnesota Higher Education Facilities Authority 10/01/2052 5.000% | 1.7 % |
| County of Chippewa 03/01/2037 4.000% | 1.5 % |
| City of Minneapolis 11/15/2037 4.000% | 1.4 % |
| Stillwater Independent School District No. 834 02/01/2042 4.000% | 1.4 % |
| State of Minnesota 08/01/2043 4.000% | 1.4 % |
columbiathreadneedleus.com/resources/literature
. You can also request more information by contacting us at 1-800-345-6611.
What were the Fund costs for the reporting period?
(Based on a hypothetical $10,000 investment)
| Class | Cost of a $10,000 investment | Cost paid as a percentage of a $10,000 investment |
| Institutional Class | $ 56 | 0.56 % |
Management's Discussion of Fund Performance
The performance of Institutional Class shares for the period presented is shown in the Average Annual Total Returns table.
Top Performance Contributors
Credit quality security selection
| Positive contribution to benchmark-relative performance was driven by security selection in AAA, AA and BBB rated bonds.Sector security selection
| Strong sector security selection in local general obligation (GO) and hospital bonds contributed to the Fund’s performance relative to its benchmark.Credit quality allocation
| Underweight to AAA bonds added to relative performance.Sector allocation
| An underweight to the state GO bonds added to the Fund’s relative performance.Top Performance Detractors
Yield curve positioning
Credit quality allocation
| Overweights to not-rated and BB bonds detracted from relative performance.Sector allocation
| Overweights to charter schools and continuing care retirement
communities (CCRCs) detracted.Sector security selection
| Security selection in housing bonds detracted from relative performance.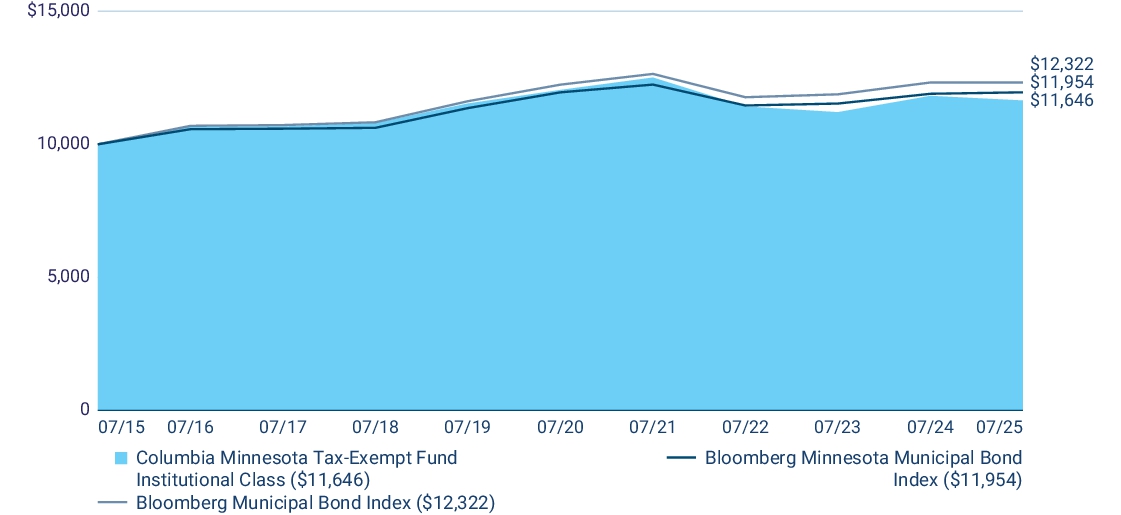
| Average Annual Total Returns (%) | 1 year | 5 years | 10 years |
| Institutional Class | (1.46 ) | (0.67 ) | 1.54 |
| Bloomberg Minnesota Municipal Bond Index | 0.47 | 0.00 | 1.80 |
| Bloomberg Municipal Bond Index | 0.00 | 0.13 | 2.11 |
columbiathreadneedleus.com/investment-products/mutual-funds
for more recent performance information.
Key Fund Statistics
Fund net assets | $ 461,142,016 |
Total number of portfolio holdings | 242 |
Management services fees (represents 0.47% of Fund average net assets) | $ 2,362,545 |
Portfolio turnover for the reporting period | 13% |
Graphical Holdings
Representation
of FundThe tables below show the investment makeup of the Fund represented as a percentage of Fund net assets. Derivatives are excluded from the tables unless otherwise noted. The Fund's portfolio composition is subject to change.
Top Holdings
| City of Rochester 11/15/2057 5.000% | 2.8 % |
| Roseville Independent School District No. 623 02/01/2038 4.000% | 2.2 % |
| Southern Minnesota Municipal Power Agency 01/01/2026 0.000% | 2.1 % |
| Brainerd Independent School District No. 181 02/01/2037 4.000% | 2.1 % |
| City of Maple Grove 05/01/2037 4.000% | 2.1 % |
| Minnesota Higher Education Facilities Authority 10/01/2052 5.000% | 1.7 % |
| County of Chippewa 03/01/2037 4.000% | 1.5 % |
| City of Minneapolis 11/15/2037 4.000% | 1.4 % |
| Stillwater Independent School District No. 834 02/01/2042 4.000% | 1.4 % |
| State of Minnesota 08/01/2043 4.000% | 1.4 % |
Asset Categories
Top Holdings
| City of Rochester 11/15/2057 5.000% | 2.8 % |
| Roseville Independent School District No. 623 02/01/2038 4.000% | 2.2 % |
| Southern Minnesota Municipal Power Agency 01/01/2026 0.000% | 2.1 % |
| Brainerd Independent School District No. 181 02/01/2037 4.000% | 2.1 % |
| City of Maple Grove 05/01/2037 4.000% | 2.1 % |
| Minnesota Higher Education Facilities Authority 10/01/2052 5.000% | 1.7 % |
| County of Chippewa 03/01/2037 4.000% | 1.5 % |
| City of Minneapolis 11/15/2037 4.000% | 1.4 % |
| Stillwater Independent School District No. 834 02/01/2042 4.000% | 1.4 % |
| State of Minnesota 08/01/2043 4.000% | 1.4 % |
columbiathreadneedleus.com/resources/literature
. You can also request more information by contacting us at 1-800-345-6611.
What were the Fund costs for the reporting period?
(Based on a hypothetical $10,000 investment)
| Class | Cost of a $10,000 investment | Cost paid as a percentage of a $10,000 investment |
| Institutional 2 Class | $ 56 |
0.56 % |
Management's Discussion of Fund Performance
The performance of Institutional 2 Class shares for the period presented is shown in the Average Annual Total Returns table.
Top Performance Contributors
Credit quality security selection
| Positive contribution to benchmark-relative performance was driven by security selection in AAA, AA and BBB rated bonds.Sector security selection
| Strong sector security selection in local general obligation (GO) and hospital bonds contributed to the Fund’s performance relative to its benchmark.Credit quality allocation
| Underweight to AAA bonds added to relative performance.Sector allocation
| An underweight to the state GO bonds added to the Fund’s relative performance.Top Performance Detractors
Yield curve positioning
uncertainty
resulted in a reshaping of the yield curve, driving the curve steeper as short rates declined and intermediate and long rates moved higher. The Fund’s yield curve positioning was the main detractor from performance, relative to its benchmark. Specifically, the Fund’s overweight to longer maturity bonds (20 years and longer) and underweight to the shorter end of the curve detracted, as municipal market interest rates saw a material increase on the long end of the curve.Credit quality allocation
| Overweights to not-rated and BB bonds detracted from relative performance.Sector allocation
| Overweights to charter schools and continuing care retirement communities (CCRCs) detracted.Sector security selection
| Security selection in housing bonds detracted from relative performance.
| Average Annual Total Returns (%) | 1 year | 5 years | 10 years |
| Institutional 2 Class | (1.46 ) |
(0.65 ) |
1.53 |
| Bloomberg Minnesota Municipal Bond Index | 0.47 | 0.00 | 1.80 |
| Bloomberg Municipal Bond Index | 0.00 | 0.13 | 2.11 |
columbiathreadneedleus.com/investment-products/mutual-funds
for more recent performance information.
Key Fund Statistics
Fund net assets |
$ 461,142,016 |
Total number of portfolio holdings |
242 |
Management services fees (represents 0.47% of Fund average net assets) |
$ 2,362,545 |
Portfolio turnover for the reporting period |
13% |
Graphical Holdings
Representation
of FundThe tables below show the investment makeup of the Fund represented as a percentage of Fund net assets. Derivatives are excluded from the tables unless otherwise noted. The Fund's portfolio composition is subject to change.
Top Holdings
| City of Rochester 11/15/2057 5.000% |
2.8 % |
| Roseville Independent School District No. 623 02/01/2038 4.000% |
2.2 % |
| Southern Minnesota Municipal Power Agency 01/01/2026 0.000% |
2.1 % |
| Brainerd Independent School District No. 181 02/01/2037 4.000% |
2.1 % |
| City of Maple Grove 05/01/2037 4.000% |
2.1 % |
| Minnesota Higher Education Facilities Authority 10/01/2052 5.000% |
1.7 % |
| County of Chippewa 03/01/2037 4.000% |
1.5 % |
| City of Minneapolis 11/15/2037 4.000% |
1.4 % |
| Stillwater Independent School District No. 834 02/01/2042 4.000% |
1.4 % |
| State of Minnesota 08/01/2043 4.000% |
1.4 % |
Asset Categories

Top Holdings
| City of Rochester 11/15/2057 5.000% |
2.8 % |
| Roseville Independent School District No. 623 02/01/2038 4.000% |
2.2 % |
| Southern Minnesota Municipal Power Agency 01/01/2026 0.000% |
2.1 % |
| Brainerd Independent School District No. 181 02/01/2037 4.000% |
2.1 % |
| City of Maple Grove 05/01/2037 4.000% |
2.1 % |
| Minnesota Higher Education Facilities Authority 10/01/2052 5.000% |
1.7 % |
| County of Chippewa 03/01/2037 4.000% |
1.5 % |
| City of Minneapolis 11/15/2037 4.000% |
1.4 % |
| Stillwater Independent School District No. 834 02/01/2042 4.000% |
1.4 % |
| State of Minnesota 08/01/2043 4.000% |
1.4 % |
columbiathreadneedleus.com/resources/literature
. You can also request more information by contacting us at 1-800-345-6611.
What were the Fund costs for the reporting period?
(Based on a hypothetical $10,000 investment)
| Class | Cost of a $10,000 investment | Cost paid as a percentage of a $10,000 investment |
| Institutional 3 Class | $ 51 | 0.51 % |
Management's Discussion of Fund Performance
The performance of Institutional 3 Class shares for the period presented is shown in the Average Annual Total Returns table.
Top Performance Contributors
Credit quality security selection
| Positive contribution to benchmark-relative performance was driven by security selection in AAA, AA and BBB rated bonds.Sector security selection
| Strong sector security selection in local general obligation (GO) and hospital bonds contributed to the Fund’s performance relative to its benchmark.Credit quality allocation
| Underweight to AAA bonds added to relative performance.Sector allocation
| An underweight to the state GO bonds added to the Fund’s relative performance.Top Performance Detractors
Yield curve positioning
Credit quality allocation
| Overweights to not-rated and BB bonds detracted from relative performance.Sector allocation
| Overweights to charter schools and continuing care retirement communities (CCRCs) detracted.Sector security selection
| Security selection in housing bonds detracted from relative performance.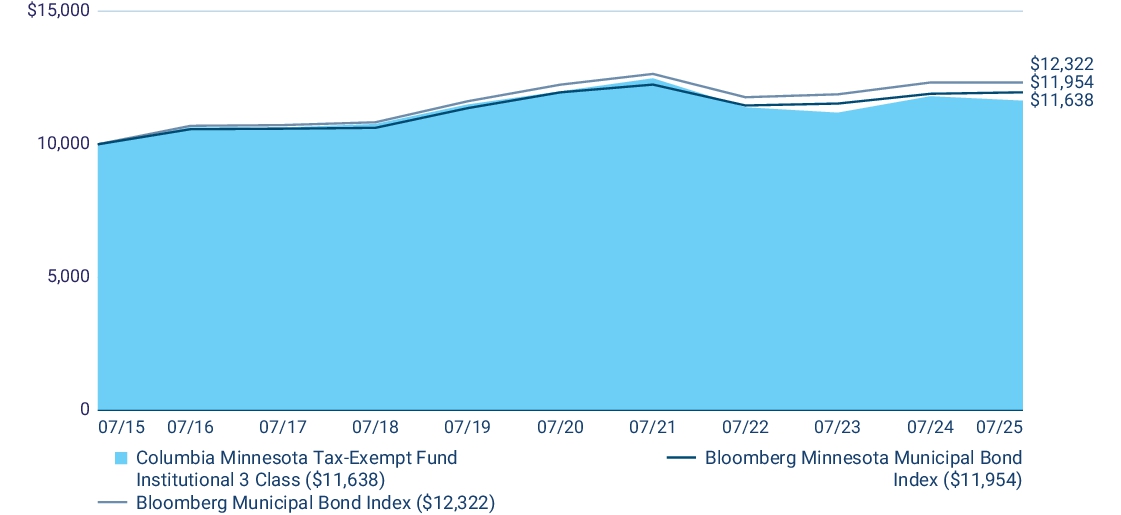
| Average Annual Total Returns (%) | 1 year | 5 years | 10 years |
| Institutional 3 Class (a) | (1.41 ) | (0.59 ) | 1.53 |
| Bloomberg Minnesota Municipal Bond Index | 0.47 | 0.00 | 1.80 |
| Bloomberg Municipal Bond Index | 0.00 | 0.13 | 2.11 |
(a) | The returns shown for periods prior to March 1, 2017 (including Since Fund Inception returns, if shown) include the returns of Class A. These returns are adjusted to reflect any higher class-related operating expenses of the newer share classes, as applicable. Please visit columbiathreadneedleus.com/investment-products/mutual-funds/appended-performance for more information. |
columbiathreadneedleus.com/investment-products/mutual-funds
for more recent performance information.
Key Fund Statistics
Fund net assets | $ 461,142,016 |
Total number of portfolio holdings | 242 |
Management services fees (represents 0.47% of Fund average net assets) | $ 2,362,545 |
Portfolio turnover for the reporting period | 13% |
Graphical Holdings
Representation
of FundThe tables below show the investment makeup of the Fund
represented
as a percentage of Fund net assets. Derivatives are excluded from the tables unless otherwise noted. The Fund's
portfolio composition is subject to change.Top Holdings
| City of Rochester 11/15/2057 5.000% | 2.8 % |
| Roseville Independent School District No. 623 02/01/2038 4.000% | 2.2 % |
| Southern Minnesota Municipal Power Agency 01/01/2026 0.000% | 2.1 % |
| Brainerd Independent School District No. 181 02/01/2037 4.000% | 2.1 % |
| City of Maple Grove 05/01/2037 4.000% | 2.1 % |
| Minnesota Higher Education Facilities Authority 10/01/2052 5.000% | 1.7 % |
| County of Chippewa 03/01/2037 4.000% | 1.5 % |
| City of Minneapolis 11/15/2037 4.000% | 1.4 % |
| Stillwater Independent School District No. 834 02/01/2042 4.000% | 1.4 % |
| State of Minnesota 08/01/2043 4.000% | 1.4 % |
Asset Categories

Top Holdings
| City of Rochester 11/15/2057 5.000% | 2.8 % |
| Roseville Independent School District No. 623 02/01/2038 4.000% | 2.2 % |
| Southern Minnesota Municipal Power Agency 01/01/2026 0.000% | 2.1 % |
| Brainerd Independent School District No. 181 02/01/2037 4.000% | 2.1 % |
| City of Maple Grove 05/01/2037 4.000% | 2.1 % |
| Minnesota Higher Education Facilities Authority 10/01/2052 5.000% | 1.7 % |
| County of Chippewa 03/01/2037 4.000% | 1.5 % |
| City of Minneapolis 11/15/2037 4.000% | 1.4 % |
| Stillwater Independent School District No. 834 02/01/2042 4.000% | 1.4 % |
| State of Minnesota 08/01/2043 4.000% | 1.4 % |