Shareholder Report
Jul. 31, 2025
USD ($)
Holding
columbiathreadneedleus.com/resources/literature
. You can also request more information by contacting us at 1-800-345-6611.
What were the Fund costs for the reporting period?
(Based on a hypothetical $10,000 investment)
| Class | Cost of a $10,000 investment | Cost paid as a percentage of a $10,000 investment |
| Class A | $ 74 |
0.75 % |
Management's Discussion of Fund Performance
The performance of Class A shares for the period presented is shown in the Average Annual Total Returns table.
Top Performance Contributors
Sector security selection
| Strong sector security selection in continuing care retirement community (CCRC), lease and airport bonds contributed to the Fund’s performance relative to its benchmark.Credit quality security selection
| Positive contribution to benchmark-relative performance was driven by security selection in AA and single-A rated bonds.Sector allocation
| An overweight to the housing sector added to the Fund’s relative performance.Yield carry
| The Fund’s attractive level of income added to performance and partially offset the negative performance from its longer-than-benchmark curve positioning.Credit quality allocation
| Overweight to not-rated bonds added to relative performance.Top Performance Detractors
Yield curve positioning
Sector security selection
| Security selection in the industrial development revenue/pollution control revenue, housing and assisted living sectors detracted from relative performance.Sector allocation
| Overweights to charter schools and CCRCs detracted from relative performanceCredit quality security selection
| Security selection in AAA and BBB rated bonds detracted from relative performance.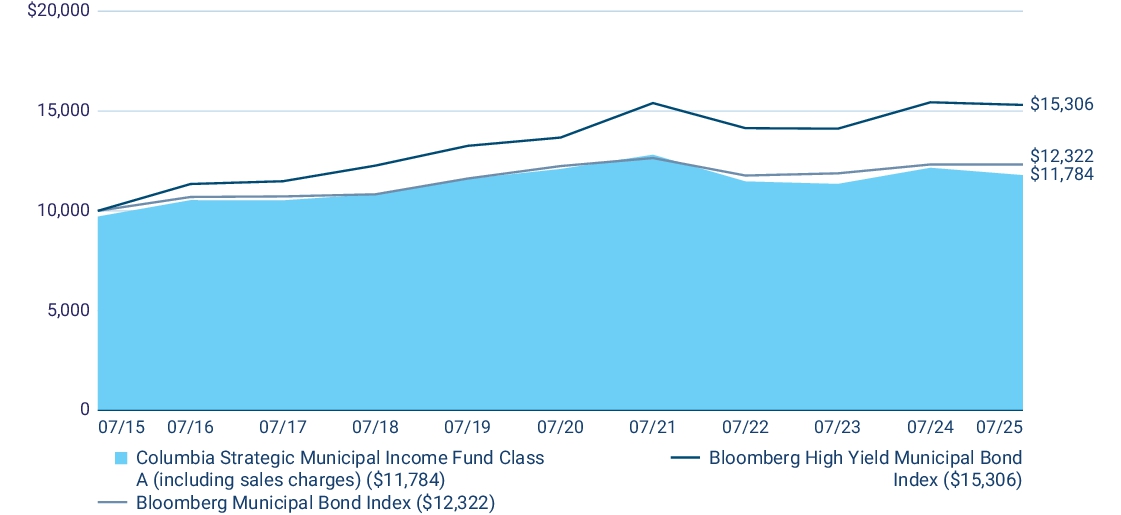
| Average Annual Total Returns (%) | 1 year | 5 years | 10 years |
| Class A (excluding sales charges) | (3.03 ) |
(0.51 ) |
1.95 |
| Class A (including sales charges) | (5.95 ) |
(1.12 ) |
1.66 |
| Bloomberg High Yield Municipal Bond Index | (0.86 ) |
2.28 | 4.35 |
| Bloomberg Municipal Bond Index | 0.00 | 0.13 | 2.11 |
columbiathreadneedleus.com/investment-products/mutual-funds
for more recent performance information.
Key Fund Statistics
Fund net assets |
$ 1,630,681,442 |
Total number of portfolio holdings |
495 |
Management services fees (represents 0.46% of Fund average net assets) |
$ 8,339,920 |
Portfolio turnover for the reporting period |
27% |
Graphical Representation of Fund Holdings
The tables below show the investment makeup of the Fund represented as a percentage of Fund net assets. Derivatives are excluded from the tables unless otherwise noted. The Fund's portfolio composition is subject to change.
Top States/Territories
| New York | 12.0 % |
| Texas | 11.2 % |
| Illinois | 9.1 % |
| California | 4.8 % |
| Puerto Rico | 4.8 % |
| New Jersey | 4.7 % |
| Pennsylvania | 4.3 % |
| Wisconsin | 4.0 % |
| Michigan | 3.4 % |
| Ohio | 3.4 % |
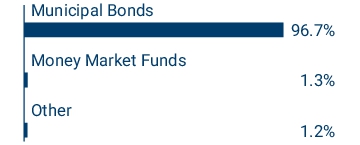
Asset Categories

columbiathreadneedleus.com/resources/literature
. You can also request more information by contacting us at 1-800-345-6611.
What were the Fund costs for the reporting period?
(Based on a hypothetical $10,000 investment)
| Class | Cost of a $10,000 investment | Cost paid as a percentage of a $10,000 investment |
| Class C | $ 147 |
1.50 % |
Management's Discussion of Fund Performance
The performance of Class C shares for the period presented is shown in the Average Annual Total Returns table.
Top Performance Contributors
Sector security selection
| Strong sector security selection in continuing care retirement community (CCRC), lease and airport bonds contributed to the Fund’s performance relative to its benchmark.Credit quality security selection
| Positive contribution to benchmark-relative performance was driven by security selection in AA and single-A rated bonds.Sector allocation
| An overweight to the housing sector added to the Fund’s relative performance.Yield carry
| The Fund’s attractive level of income added to performance and partially offset the negative performance from its longer-than-benchmark curve positioning.Credit quality allocation
| Overweight to not-rated bonds added to relative performance.Top Performance Detractors
Yield curve positioning
Sector security selection
| Security selection in the industrial development revenue/pollution control revenue, housing and assisted living sectors detracted from relative performance.Sector allocation
| Overweights to charter schools and CCRCs detracted from relative performanceCredit quality security selection
| Security selection in AAA and BBB rated bonds detracted from relative performance.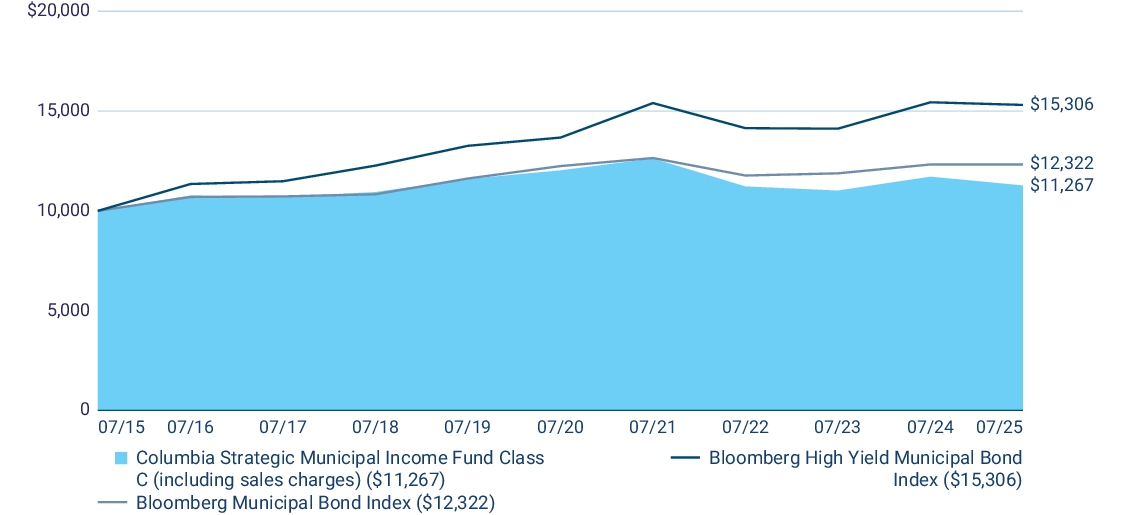
| Average Annual Total Returns (%) | 1 year | 5 years | 10 years |
| Class C (excluding sales charges) | (3.76 ) |
(1.29 ) |
1.20 |
| Class C (including sales charges) | (4.69 ) |
(1.29 ) |
1.20 |
| Bloomberg High Yield Municipal Bond Index | (0.86 ) |
2.28 | 4.35 |
| Bloomberg Municipal Bond Index | 0.00 | 0.13 | 2.11 |
columbiathreadneedleus.com/investment-products/mutual-funds
for more recent performance information.
Key Fund Statistics
Fund net assets |
$ 1,630,681,442 |
Total number of portfolio holdings |
495 |
Management services fees (represents 0.46% of Fund average net assets) |
$ 8,339,920 |
Portfolio turnover for the reporting period |
27% |
Graphical Representation of Fund Holdings
The tables below show the investment makeup of the Fund represented as a percentage of Fund net assets. Derivatives are excluded from the tables unless otherwise noted. The Fund's portfolio composition is subject to change.
Top States/Territories
| New York | 12.0 % |
| Texas | 11.2 % |
| Illinois | 9.1 % |
| California | 4.8 % |
| Puerto Rico | 4.8 % |
| New Jersey | 4.7 % |
| Pennsylvania | 4.3 % |
| Wisconsin | 4.0 % |
| Michigan | 3.4 % |
| Ohio | 3.4 % |
Asset Categories

columbiathreadneedleus.com/resources/literature
. You can also request more information by contacting us at 1-800-345-6611.
What were the Fund costs for the reporting period?
(Based on a hypothetical $10,000 investment)
| Class | Cost of a $10,000 investment | Cost paid as a percentage of a $10,000 investment |
| Institutional Class | $ 49 |
0.50 % |
Management's Discussion of Fund Performance
The performance of Institutional Class shares for the period presented is shown in the Average Annual Total Returns table.
Top Performance Contributors
Sector security selection
| Strong sector security selection in continuing care retirement community (CCRC), lease and airport bonds contributed to the Fund’s performance relative to its benchmark.Credit quality security selection
| Positive contribution to benchmark-relative performance was driven by security selection in AA and single-A rated bonds.Sector allocation
| An overweight to the housing sector added to the Fund’s relative performance.Yield carry
| The Fund’s attractive level of income added to performance and partially offset the negative performance from its longer-than-benchmark curve positioning.Credit quality allocation
| Overweight to not-rated bonds added to relative performance.Top Performance Detractors
Yield curve positioning
Sector security selection
| Security selection in the industrial development revenue/pollution control revenue, housing and assisted living sectors detracted from relative performance.Sector allocation
| Overweights to charter schools and CCRCs detracted from relative performanceCredit quality security selection
| Security selection in AAA and BBB rated bonds detracted from relative performance.
| Average Annual Total Returns (%) | 1 year | 5 years | 10 years |
| Institutional Class | (2.80 ) |
(0.31 ) |
2.21 |
| Bloomberg High Yield Municipal Bond Index | (0.86 ) |
2.28 | 4.35 |
| Bloomberg Municipal Bond Index | 0.00 | 0.13 | 2.11 |
columbiathreadneedleus.com/investment-products/mutual-funds
for more recent performance information.
Key Fund Statistics
Fund net assets |
$ 1,630,681,442 |
Total number of portfolio holdings |
495 |
Management services fees (represents 0.46% of Fund average net assets) |
$ 8,339,920 |
Portfolio turnover for the reporting period |
27% |
Graphical Representation of Fund Holdings
The tables below show the investment makeup of the Fund represented as a percentage of Fund net
assets
. Derivatives are excluded from the tables unless otherwise noted. The Fund's portfolio composition is subject to change.Top States/Territories
| New York | 12.0 % |
| Texas | 11.2 % |
| Illinois | 9.1 % |
| California | 4.8 % |
| Puerto Rico | 4.8 % |
| New Jersey | 4.7 % |
| Pennsylvania | 4.3 % |
| Wisconsin | 4.0 % |
| Michigan | 3.4 % |
| Ohio | 3.4 % |
Asset Categories

columbiathreadneedleus.com/resources/literature
. You can also request more information by contacting us at 1-800-345-6611.
What were the Fund costs for the reporting period?
(Based on a hypothetical $10,000 investment)
| Class | Cost of a $10,000 investment | Cost paid as a percentage of a $10,000 investment |
| Institutional 2 Class | $ 49 |
0.50 % |
Management's Discussion of Fund Performance
The performance of Institutional 2 Class shares for the period presented is shown in the Average Annual Total Returns table.
Top Performance Contributors
Sector security selection
| Strong sector security selection in continuing care retirement community (CCRC), lease and airport bonds contributed to the Fund’s performance relative to its benchmark.Credit quality security selection
| Positive contribution to benchmark-relative performance was driven by security selection in AA and single-A rated bonds.Sector allocation
| An overweight to the housing sector added to the Fund’s relative performance.Yield carry
| The Fund’s attractive level of income added to performance and partially offset the negative performance from its longer-than-benchmark curve positioning.Credit quality allocation
| Overweight to not-rated bonds added to relative performance.Top Performance Detractors
Yield curve positioning
Sector security selection
| Security selection in the industrial development revenue/pollution control revenue, housing and assisted living sectors detracted from relative performance.Sector allocation
| Overweights to charter schools and CCRCs detracted from relative performanceCredit quality security selection
| Security selection in AAA and BBB rated bonds detracted from relative performance.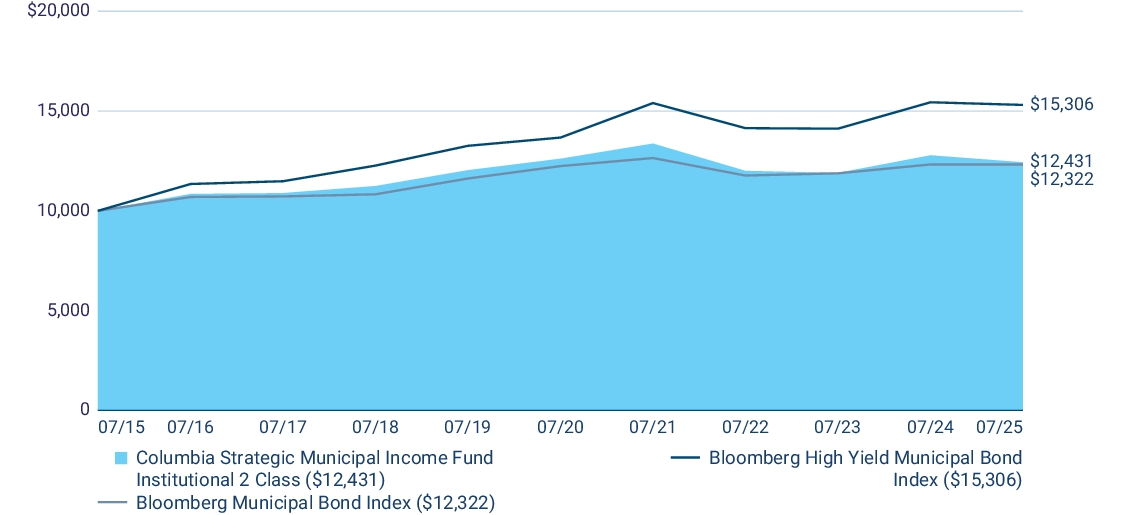
| Average Annual Total Returns (%) | 1 year | 5 years | 10 years |
| Institutional 2 Class | (2.73 ) |
(0.29 ) |
2.20 |
| Bloomberg High Yield Municipal Bond Index | (0.86 ) |
2.28 | 4.35 |
| Bloomberg Municipal Bond Index | 0.00 | 0.13 | 2.11 |
columbiathreadneedleus.com/investment-products/mutual-funds
for more recent performance information.
Key Fund Statistics
Fund net assets |
$ 1,630,681,442 |
Total number of portfolio holdings |
495 |
Management services fees (represents 0.46% of Fund average net assets) |
$ 8,339,920 |
Portfolio turnover for the reporting period |
27% |
Graphical Representation of Fund
Holdings
The tables below show the investment makeup of the Fund represented as a percentage of Fund net assets. Derivatives are excluded from the tables unless otherwise noted. The Fund's portfolio composition is subject to change.
Top States/Territories
| New York | 12.0 % |
| Texas | 11.2 % |
| Illinois | 9.1 % |
| California | 4.8 % |
| Puerto Rico | 4.8 % |
| New Jersey | 4.7 % |
| Pennsylvania | 4.3 % |
| Wisconsin | 4.0 % |
| Michigan | 3.4 % |
| Ohio | 3.4 % |
Asset Categories
columbiathreadneedleus.com/resources/literature
. You can also request more information by contacting us at 1-800-345-6611.
What were the Fund costs for the reporting period?
(Based on a hypothetical $10,000 investment)
| Class | Cost of a $10,000 investment | Cost paid as a percentage of a $10,000 investment |
| Institutional 3 Class | $ 44 |
0.45 % |
Management's Discussion of Fund Performance
The performance of Institutional 3 Class shares for the period presented is shown in the Average Annual Total Returns table.
Top Performance Contributors
Sector security selection
| Strong sector security selection in continuing care retirement community (CCRC), lease and airport bonds contributed to the Fund’s performance relative to its benchmark.Credit quality security selection
| Positive contribution to benchmark-relative performance was driven by security selection in AA and single-A rated bonds.Sector allocation
| An overweight to the housing sector added to the Fund’s relative performance.Yield carry
| The Fund’s attractive level of income added to performance and partially offset the negative performance from its longer-than-benchmark curve positioning.Credit quality allocation
| Overweight to not-rated bonds added to relative performance.Top Performance Detractors
Yield curve positioning
Sector security selection
| Security selection in the industrial development revenue/pollution control revenue, housing and assisted living sectors detracted from relative performance.Sector allocation
| Overweights to charter schools and CCRCs detracted from relative performanceCredit quality security selection
| Security selection in AAA and BBB rated bonds detracted from relative performance.
| Average Annual Total Returns (%) | 1 year | 5 years | 10 years |
| Institutional 3 Class (a) |
(2.68 ) |
(0.21 ) |
2.21 |
| Bloomberg High Yield Municipal Bond Index | (0.86 ) |
2.28 | 4.35 |
| Bloomberg Municipal Bond Index | 0.00 | 0.13 | 2.11 |
|
(a)
|
The returns shown for periods prior to March 1, 2017 (including Since Fund Inception returns, if shown) include the returns of Class A. These returns are adjusted to reflect any higher class-related operating expenses of the newer share classes, as applicable. Please visit
columbiathreadneedleus.com/investment-products/mutual-funds/appended-performance for more information. |
columbiathreadneedleus.com/investment-products/mutual-funds
for more recent performance information.
Key Fund Statistics
Fund net assets |
$ 1,630,681,442 |
Total number of portfolio holdings |
495 |
Management services fees (represents 0.46% of Fund average net assets) |
$ 8,339,920 |
Portfolio turnover for the reporting period |
27% |
Graphical Representation of Fund Holdings
The tables below show the investment makeup of the Fund represented as a percentage of Fund net assets.
Derivatives
are excluded from the tables unless otherwise noted. The Fund's portfolio composition is subject to change.Top States/Territories
| New York | 12.0 % |
| Texas | 11.2 % |
| Illinois | 9.1 % |
| California | 4.8 % |
| Puerto Rico | 4.8 % |
| New Jersey | 4.7 % |
| Pennsylvania | 4.3 % |
| Wisconsin | 4.0 % |
| Michigan | 3.4 % |
| Ohio | 3.4 % |
Asset Categories

columbiathreadneedleus.com/resources/literature
. You can also request more information by contacting us at 1-800-345-6611.
What were the Fund costs for the reporting period?
(Based on a hypothetical $10,000 investment)
| Class | Cost of a $10,000 investment | Cost paid as a percentage of a $10,000 investment |
| Class S | $ 40(a) |
0.50 % (b) |
| (a) |
Based on operations from October 2, 2024 (commencement of operations) through the stated period end. Had the class been open for the entire reporting period, expenses shown in the table above would have been higher.
|
| (b) |
Annualized.
|
Management's Discussion of Fund Performance
The performance of Class S shares for the period presented is shown in the Average Annual Total Returns table.
Top Performance Contributors
Sector security selection
| Strong sector security selection in continuing care retirement community (CCRC), lease and airport bonds contributed to the Fund’s performance relative to its benchmark.Credit quality security selection
| Positive contribution to benchmark-relative performance was driven by security selection in AA and single-A rated bonds.Sector allocation
| An overweight to the housing sector added to the Fund’s relative performance.Yield carry
| The Fund’s attractive level of income added to performance and partially offset the negative performance from its longer-than-benchmark curve positioning.Credit quality allocation
| Overweight to not-rated bonds added to relative performance.Top Performance Detractors
Yield curve positioning
Sector security selection
| Security selection in the industrial development revenue/pollution control revenue, housing and assisted living sectors detracted from relative performance.Sector allocation
| Overweights to charter schools and CCRCs detracted from relative performanceCredit quality security selection
| Security selection in AAA and BBB rated bonds detracted from relative performance.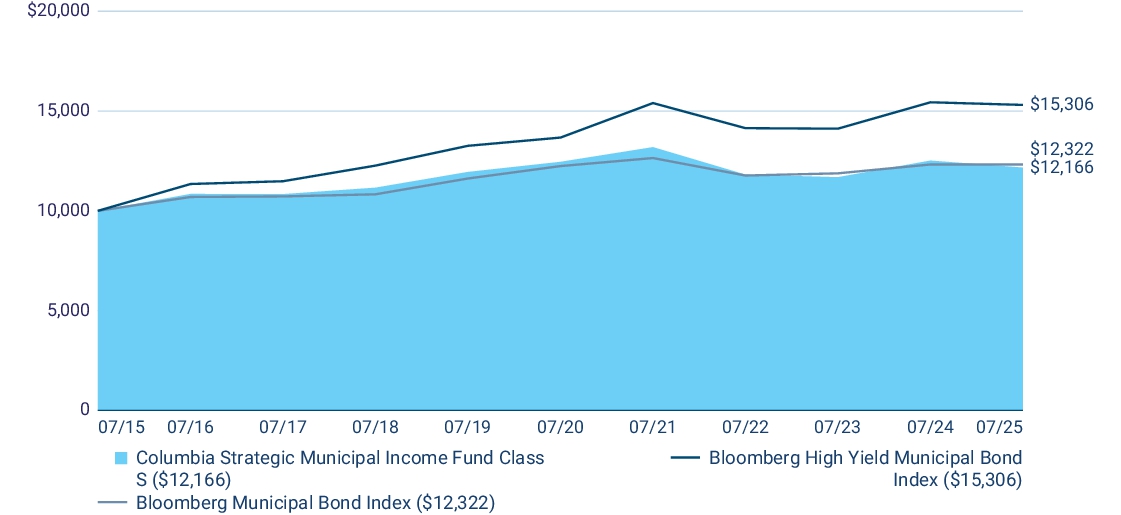
| Average Annual Total Returns (%) | 1 year | 5 years | 10 years |
| Class S ( a) |
(2.79 ) |
(0.46 ) |
1.98 |
| Bloomberg High Yield Municipal Bond Index | (0.86 ) |
2.28 | 4.35 |
| Bloomberg Municipal Bond Index | 0.00 | 0.13 | 2.11 |
|
(a)
|
The returns shown for periods prior to October 2, 2024 (including Since Fund Inception returns, if shown) include the returns of Class A. These returns are adjusted to reflect any higher class-related operating expenses of the newer share classes, as applicable. Please visit
columbiathreadneedleus.com/investment-products/mutual-funds/appended-performance for more information. |
columbiathreadneedleus.com/investment-products/mutual-funds
for more recent performance information.
Key Fund Statistics
Fund net assets |
$ 1,630,681,442 |
Total number of portfolio holdings |
495 |
Management services fees (represents 0.46% of Fund average net assets) |
$ 8,339,920 |
Portfolio turnover for the reporting period |
27% |
Graphical Representation of Fund Holdings
The tables below show the investment makeup of the Fund represented as a percentage of Fund net assets.
Derivatives
are excluded from the tables unless otherwise noted. The Fund's portfolio composition is subject to change.Top States/Territories
| New York | 12.0 % |
| Texas | 11.2 % |
| Illinois | 9.1 % |
| California | 4.8 % |
| Puerto Rico | 4.8 % |
| New Jersey | 4.7 % |
| Pennsylvania | 4.3 % |
| Wisconsin | 4.0 % |
| Michigan | 3.4 % |
| Ohio | 3.4 % |
Asset Categories

| [1] | Based on operations from October 2, 2024 (commencement of operations) through the stated period end. Had the class been open for the entire reporting period, expenses shown in the table above would have been higher. |
| [2] | Annualized. |