Shareholder Report
Jul. 31, 2025
USD ($)
Holding
columbiathreadneedleus.com/resources/literature
. You can also request more information by contacting us at 1-800-345-6611.
What were the Fund costs for the reporting period?
(Based on a hypothetical $10,000 investment)
| Class | Cost of a $10,000 investment | Cost paid as a percentage of a $10,000 investment |
| Class A | $ 93 | 0.90 % |
Management's Discussion of Fund Performance
The performance of Class A shares for the period presented is shown in the Average Annual Total Returns table.
Top Performance Contributors
Stock selection
| Selections in the health care, materials and financials sectors were the top contributors to performance relative to the benchmark.Allocations
| Sector allocation within the industrials, real estate and consumer staples sectors were the top three contributing sectors to relative performance.Individual holdings
| Top individual contributors to relative performance included UnitedHealth Group, Inc., Ralph Lauren Corp. and Entergy Corp.Top Performance Detractors
Stock selection
Allocations
| Sector allocation within the materials, financials and utilities sectors were the top three detracting sectors from relative performance.Individual holdings
| Bottom individual detractors from relative performance included FedEx Corp., Edison International and Viatris, Inc.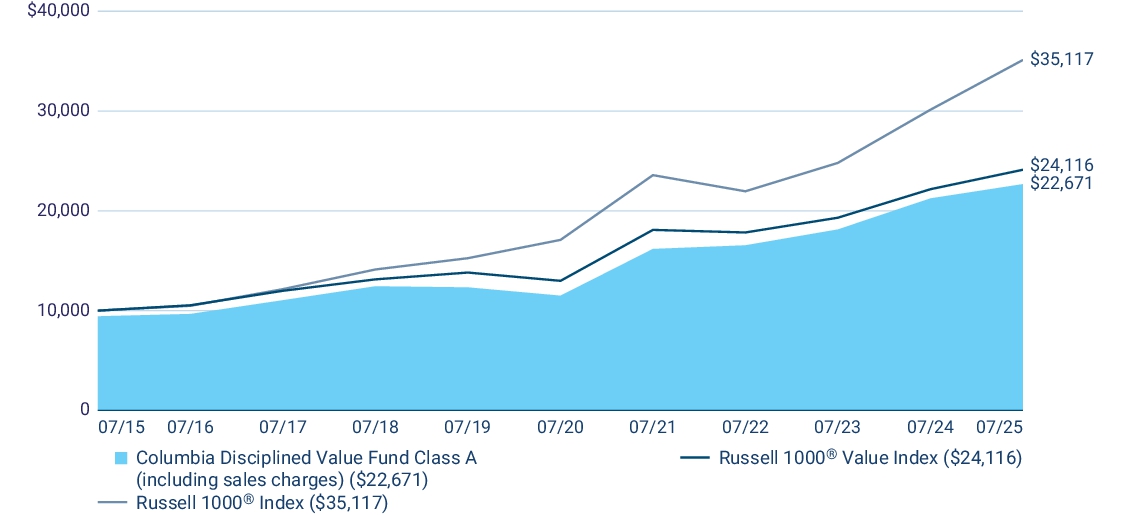
| Average Annual Total Returns (%) | 1 year | 5 years | 10 years |
| Class A (excluding sales charges) | 6.72 | 14.55 | 9.17 |
| Class A (including sales charges) | 0.57 | 13.21 | 8.53 |
| Russell 1000 ® Value Index | 8.79 | 13.18 | 9.20 |
| Russell 1000 ® Index | 16.54 | 15.49 | 13.38 |
columbiathreadneedleus.com/investment-products/mutual-funds
for more recent performance information.
Key Fund Statistics
Fund net assets | $ 172,019,575 |
Total number of portfolio holdings | 96 |
Management services fees (represents 0.75% of Fund average net assets) | $ 1,331,096 |
Portfolio turnover for the reporting period | 58% |
Graphical Representation of Fund Holdings
The tables below show the investment makeup of the Fund represented as a percentage of Fund net assets. Derivatives are excluded from the tables unless otherwise noted. The Fund's portfolio composition is subject to change.
Top Holdings
| JPMorgan Chase & Co. | 4.0 % |
| Meta Platforms, Inc., Class A | 2.9 % |
| Exxon Mobil Corp. | 2.7 % |
| Citigroup, Inc. | 2.4 % |
| Altria Group, Inc. | 2.1 % |
| CME Group, Inc. | 2.1 % |
| Salesforce, Inc. | 2.1 % |
| AT&T, Inc. | 2.0 % |
| Cisco Systems, Inc. | 2.0 % |
| Chevron Corp. | 2.0 % |
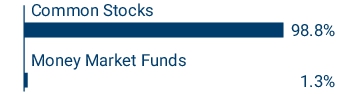
Asset Categories

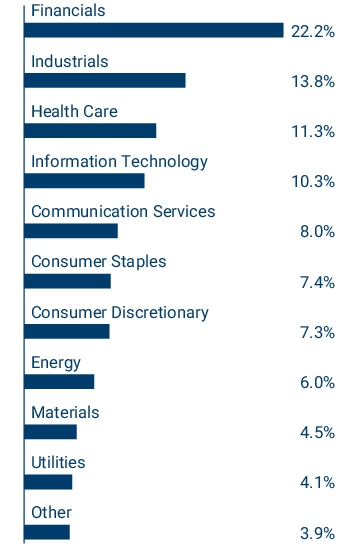
Equity Sector Allocation

Top Holdings
| JPMorgan Chase & Co. | 4.0 % |
| Meta Platforms, Inc., Class A | 2.9 % |
| Exxon Mobil Corp. | 2.7 % |
| Citigroup, Inc. | 2.4 % |
| Altria Group, Inc. | 2.1 % |
| CME Group, Inc. | 2.1 % |
| Salesforce, Inc. | 2.1 % |
| AT&T, Inc. | 2.0 % |
| Cisco Systems, Inc. | 2.0 % |
| Chevron Corp. | 2.0 % |
columbiathreadneedleus.com/resources/literature
. You can also request more information by contacting us at 1-800-345-6611.
What were the Fund costs for the reporting period?
(Based on a hypothetical $10,000 investment)
| Class | Cost of a $10,000 investment | Cost paid as a percentage of a $10,000 investment |
| Class C | $ 180 | 1.75 % |
Management's Discussion of Fund Performance
The performance of Class C shares for the period presented is shown in the Average Annual Total Returns table.
Top Performance Contributors
Stock selection
| Selections in the health care, materials and financials sectors were the top contributors to performance relative to the benchmark.Allocations
| Sector allocation within the industrials, real estate and consumer staples sectors were the top three contributing sectors to relative performance.Individual holdings
| Top individual contributors to relative performance included UnitedHealth Group, Inc., Ralph Lauren Corp. and Entergy Corp.Top Performance Detractors
Stock selection
Allocations
| Sector allocation within the materials, financials and utilities sectors were the top three detracting sectors from relative performance.Individual holdings
| Bottom individual detractors from relative performance included FedEx Corp., Edison International and Viatris, Inc.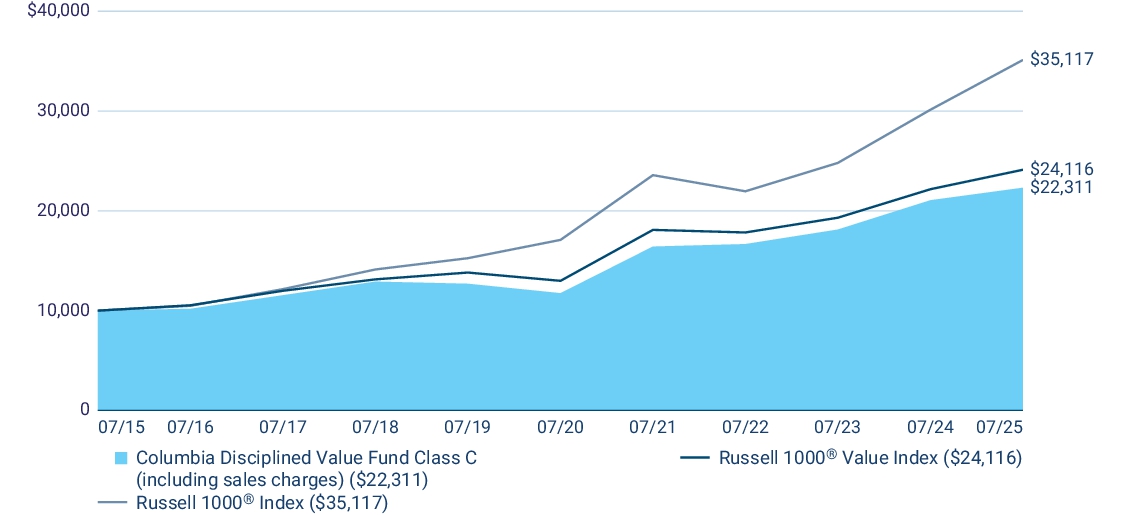
| Average Annual Total Returns (%) | 1 year | 5 years | 10 years |
| Class C (excluding sales charges) | 5.94 | 13.69 | 8.36 |
| Class C (including sales charges) | 4.99 | 13.69 | 8.36 |
| Russell 1000 ® Value Index | 8.79 | 13.18 | 9.20 |
| Russell 1000 ® Index | 16.54 | 15.49 | 13.38 |
columbiathreadneedleus.com/investment-products/mutual-funds
for more recent performance information.
Key Fund Statistics
Fund net assets | $ 172,019,575 |
Total number of portfolio holdings | 96 |
Management services fees (represents 0.75% of Fund average net assets) | $ 1,331,096 |
Portfolio turnover for the reporting period | 58% |
Graphical Representation of Fund Holdings
The tables below show the investment makeup of the Fund represented as a percentage of Fund net assets. Derivatives are excluded from the tables unless otherwise noted. The Fund's portfolio composition is subject to change.
Top Holdings
| JPMorgan Chase & Co. | 4.0 % |
| Meta Platforms, Inc., Class A | 2.9 % |
| Exxon Mobil Corp. | 2.7 % |
| Citigroup, Inc. | 2.4 % |
| Altria Group, Inc. | 2.1 % |
| CME Group, Inc. | 2.1 % |
| Salesforce, Inc. | 2.1 % |
| AT&T, Inc. | 2.0 % |
| Cisco Systems, Inc. | 2.0 % |
| Chevron Corp. | 2.0 % |
Asset Categories
Equity Sector Allocation

Top Holdings
| JPMorgan Chase & Co. | 4.0 % |
| Meta Platforms, Inc., Class A | 2.9 % |
| Exxon Mobil Corp. | 2.7 % |
| Citigroup, Inc. | 2.4 % |
| Altria Group, Inc. | 2.1 % |
| CME Group, Inc. | 2.1 % |
| Salesforce, Inc. | 2.1 % |
| AT&T, Inc. | 2.0 % |
| Cisco Systems, Inc. | 2.0 % |
| Chevron Corp. | 2.0 % |
columbiathreadneedleus.com/resources/literature
. You can also request more information by contacting us at 1-800-345-6611.
What were the Fund costs for the reporting period?
(Based on a hypothetical $10,000 investment)
| Class | Cost of a $10,000 investment | Cost paid as a percentage of a $10,000 investment |
| Institutional Class | $ 79 | 0.76 % |
Management's Discussion of Fund Performance
The performance of Institutional Class shares for the period presented is shown in the Average Annual Total Returns table.
Top Performance Contributors
Stock selection
| Selections in the health care, materials and financials sectors were the top contributors to performance relative to the benchmark.Allocations
| Sector allocation within the industrials, real estate and consumer staples sectors were the top three contributing sectors to relative performance.Individual holdings
| Top individual contributors to relative performance included UnitedHealth Group, Inc., Ralph Lauren Corp. and Entergy Corp.Top Performance Detractors
Stock selection
Allocations
| Sector allocation within the materials, financials and utilities sectors were the top three detracting sectors from relative performance.Individual holdings
| Bottom individual detractors from relative performance included FedEx Corp., Edison International and Viatris, Inc.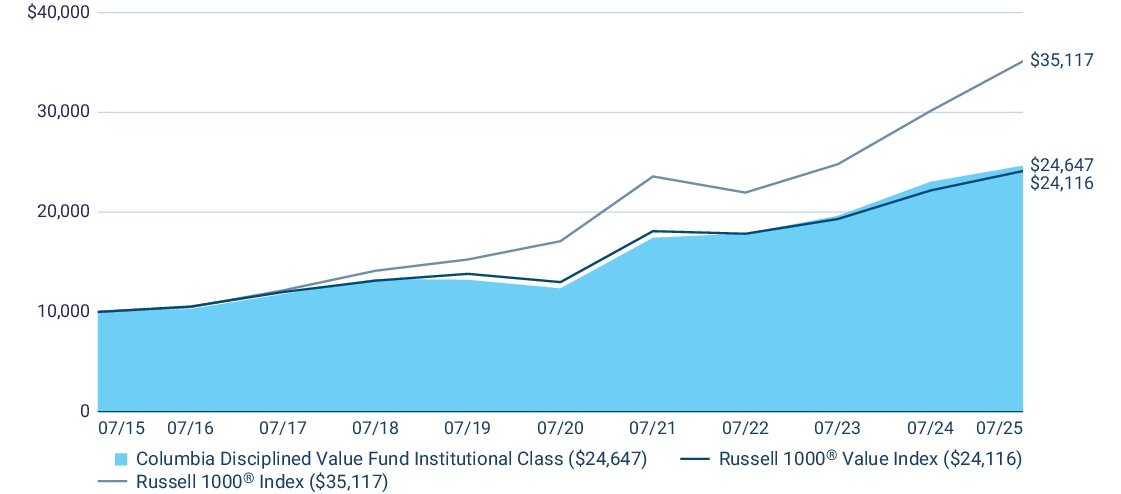
| Average Annual Total Returns (%) | 1 year | 5 years | 10 years |
| Institutional Class | 7.00 | 14.82 | 9.44 |
| Russell 1000 ® Value Index | 8.79 | 13.18 | 9.20 |
| Russell 1000 ® Index | 16.54 | 15.49 | 13.38 |
columbiathreadneedleus.com/investment-products/mutual-funds
for more recent performance information.
Key Fund Statistics
Fund net assets | $ 172,019,575 |
Total number of portfolio holdings | 96 |
Management services fees (represents 0.75% of Fund average net assets) | $ 1,331,096 |
Portfolio turnover for the reporting period | 58% |
Graphical Representation of Fund Holdings
The tables below show the investment makeup of the Fund represented as a percentage of Fund net assets. Derivatives are excluded from the tables unless otherwise noted. The Fund's portfolio composition is subject to change.
Top Holdings
| JPMorgan Chase & Co. | 4.0 % |
| Meta Platforms, Inc., Class A | 2.9 % |
| Exxon Mobil Corp. | 2.7 % |
| Citigroup, Inc. | 2.4 % |
| Altria Group, Inc. | 2.1 % |
| CME Group, Inc. | 2.1 % |
| Salesforce, Inc. | 2.1 % |
| AT&T, Inc. | 2.0 % |
| Cisco Systems, Inc. | 2.0 % |
| Chevron Corp. | 2.0 % |
Asset Categories

Equity Sector Allocation
Top Holdings
| JPMorgan Chase & Co. | 4.0 % |
| Meta Platforms, Inc., Class A | 2.9 % |
| Exxon Mobil Corp. | 2.7 % |
| Citigroup, Inc. | 2.4 % |
| Altria Group, Inc. | 2.1 % |
| CME Group, Inc. | 2.1 % |
| Salesforce, Inc. | 2.1 % |
| AT&T, Inc. | 2.0 % |
| Cisco Systems, Inc. | 2.0 % |
| Chevron Corp. | 2.0 % |