Shareholder Report
Jul. 31, 2025
USD ($)
Holding
columbiathreadneedleus.com/resources/literature
. You can also request more information by contacting us at 1-800-345-6611.
What were the Fund costs for the reporting period?
(Based on a hypothetical $10,000 investment)
| Class | Cost of a $10,000 investment | Cost paid as a percentage of a $10,000 investment |
| Class A | $ 115 | 1.06 % |
Management's Discussion of Fund Performance
The performance of Class A shares for the period presented is shown in the Average Annual Total Returns table.
Top Performance Contributors
Stock selection
| Selections in the real estate sector contributed to performance relative to the benchmark.Allocations
| Sector allocation within the consumer discretionary, consumer staples and health care sectors contributed to relative performance.Individual holdings
| Top individual contributors to relative performance included Carvana Co., Fortinet, Inc. and Apple, Inc.Top Performance Detractors
Stock selection
Allocations
| Sector allocation within the utilities, materials and communication services sectors were the top three detracting sectors from relative performance.Individual holdings
| Bottom individual detractors to relative performance included Fortrea Holdings, Inc., TopBuild Corp. and Netflix, Inc.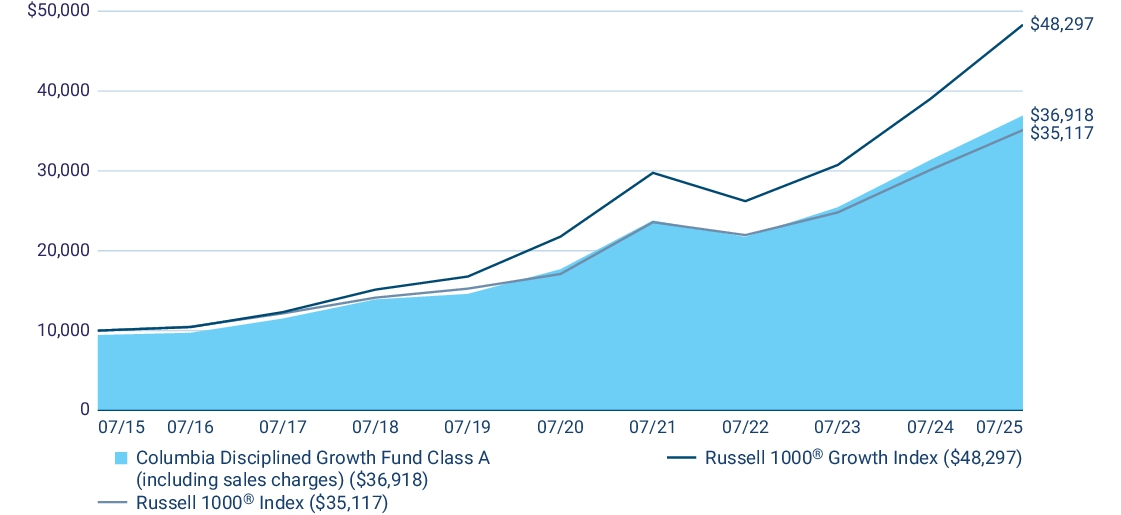
| Average Annual Total Returns (%) | 1 year | 5 years | 10 years |
| Class A (excluding sales charges) | 17.73 | 15.87 | 14.63 |
| Class A (including sales charges) | 10.99 | 14.50 | 13.95 |
| Russell 1000 ® Growth Index | 23.75 | 17.27 | 17.06 |
| Russell 1000 ® Index | 16.54 | 15.49 | 13.38 |
columbiathreadneedleus.com/investment-products/mutual-funds
for more recent performance information.
Key Fund Statistics
Fund net assets | $ 295,052,060 |
Total number of portfolio holdings | 68 |
Management services fees (represents 0.75% of Fund average net assets) | $ 2,202,678 |
Portfolio turnover for the reporting period | 58% |
Graphical Representation of Fund Holdings
The tables below show the investment makeup of the Fund represented as a percentage of Fund net assets. Derivatives are excluded from the tables unless otherwise noted. The Fund's portfolio composition is subject to change.
Top Holdings
| NVIDIA Corp. | 10.4 % |
| Microsoft Corp. | 10.3 % |
| Apple, Inc. | 7.7 % |
| Meta Platforms, Inc., Class A | 6.4 % |
| Amazon.com, Inc. | 4.8 % |
| Alphabet, Inc., Class A | 4.8 % |
| Broadcom, Inc. | 4.4 % |
| Tesla, Inc. | 2.4 % |
| Arista Networks, Inc. | 2.3 % |
| Advanced Micro Devices, Inc. | 2.2 % |
Equity Sector Allocation

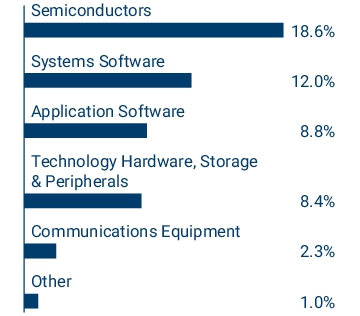
Information Technology Sub-industry Allocation

Top Holdings
| NVIDIA Corp. | 10.4 % |
| Microsoft Corp. | 10.3 % |
| Apple, Inc. | 7.7 % |
| Meta Platforms, Inc., Class A | 6.4 % |
| Amazon.com, Inc. | 4.8 % |
| Alphabet, Inc., Class A | 4.8 % |
| Broadcom, Inc. | 4.4 % |
| Tesla, Inc. | 2.4 % |
| Arista Networks, Inc. | 2.3 % |
| Advanced Micro Devices, Inc. | 2.2 % |
columbiathreadneedleus.com/resources/literature
. You can also request more information by contacting us at 1-800-345-6611.
What were the Fund costs for the reporting period?
(Based on a hypothetical $10,000 investment)
| Class | Cost of a $10,000 investment | Cost paid as a percentage of a $10,000 investment |
| Class C | $ 196 | 1.81 % |
Management's Discussion of Fund Performance
The performance of Class C shares for the period presented is shown in the Average Annual Total Returns table.
Top Performance Contributors
Stock selection
| Selections in the real estate sector contributed to performance relative to the benchmark.Allocations
| Sector allocation within the consumer discretionary, consumer staples and health care sectors contributed to relative performance.Individual holdings
| Top individual contributors to relative performance included Carvana Co., Fortinet, Inc. and Apple, Inc.Top Performance Detractors
Stock selection
Allocations
| Sector allocation within the utilities, materials and communication services sectors were the top three detracting sectors from relative performance.Individual holdings
| Bottom individual detractors to relative performance included Fortrea Holdings, Inc., TopBuild Corp. and Netflix, Inc.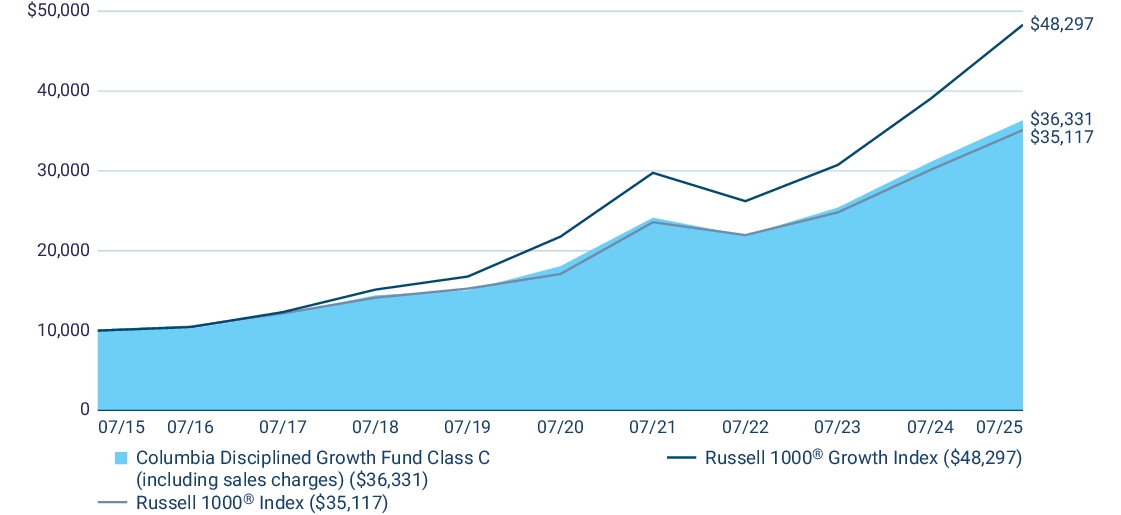
| Average Annual Total Returns (%) | 1 year | 5 years | 10 years |
| Class C (excluding sales charges) | 16.82 | 15.01 | 13.77 |
| Class C (including sales charges) | 15.82 | 15.01 | 13.77 |
| Russell 1000 ® Growth Index | 23.75 | 17.27 | 17.06 |
| Russell 1000 ® Index | 16.54 | 15.49 | 13.38 |
columbiathreadneedleus.com/investment-products/mutual-funds
for more recent performance information.
Key Fund Statistics
Fund net assets | $ 295,052,060 |
Total number of portfolio holdings | 68 |
Management services fees (represents 0.75% of Fund average net assets) | $ 2,202,678 |
Portfolio turnover for the reporting period | 58% |
Graphical Representation of Fund Holdings
The tables below show the investment makeup of the Fund represented as a percentage of Fund net assets. Derivatives are excluded from the tables unless otherwise noted. The Fund's portfolio composition is subject to change.
Top Holdings
| NVIDIA Corp. | 10.4 % |
| Microsoft Corp. | 10.3 % |
| Apple, Inc. | 7.7 % |
| Meta Platforms, Inc., Class A | 6.4 % |
| Amazon.com, Inc. | 4.8 % |
| Alphabet, Inc., Class A | 4.8 % |
| Broadcom, Inc. | 4.4 % |
| Tesla, Inc. | 2.4 % |
| Arista Networks, Inc. | 2.3 % |
| Advanced Micro Devices, Inc. | 2.2 % |
Equity Sector Allocation

Information Technology Sub-industry Allocation
Top Holdings
| NVIDIA Corp. | 10.4 % |
| Microsoft Corp. | 10.3 % |
| Apple, Inc. | 7.7 % |
| Meta Platforms, Inc., Class A | 6.4 % |
| Amazon.com, Inc. | 4.8 % |
| Alphabet, Inc., Class A | 4.8 % |
| Broadcom, Inc. | 4.4 % |
| Tesla, Inc. | 2.4 % |
| Arista Networks, Inc. | 2.3 % |
| Advanced Micro Devices, Inc. | 2.2 % |
columbiathreadneedleus.com/resources/literature
. You can also request more information by contacting us at 1-800-345-6611.
What were the Fund costs for the reporting period?
(Based on a hypothetical $10,000 investment)
| Class | Cost of a $10,000 investment | Cost paid as a percentage of a $10,000 investment |
| Institutional Class | $ 88 | 0.81 % |
Management's Discussion of Fund Performance
The performance of Institutional Class shares for the period presented is shown in the Average Annual Total Returns table.
Top Performance Contributors
Stock selection
| Selections in the real estate sector contributed to performance relative to the benchmark.Allocations
| Sector allocation within the consumer discretionary, consumer staples and health care sectors contributed to relative performance.Individual holdings
| Top individual contributors to relative performance included Carvana Co., Fortinet, Inc. and Apple, Inc.Top Performance Detractors
Stock selection
Allocations
| Sector allocation within the utilities, materials and communication services sectors were the top three detracting sectors from relative performance.Individual holdings
| Bottom individual detractors to relative performance included Fortrea Holdings, Inc., TopBuild Corp. and Netflix, Inc.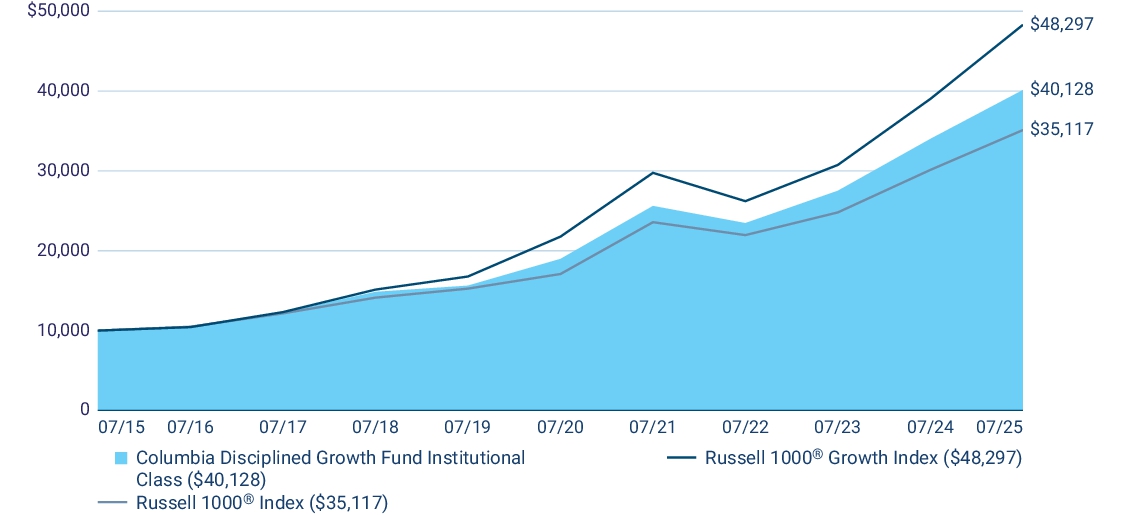
| Average Annual Total Returns (%) | 1 year | 5 years | 10 years |
| Institutional Class | 17.98 | 16.16 | 14.91 |
| Russell 1000 ® Growth Index | 23.75 | 17.27 | 17.06 |
| Russell 1000 ® Index | 16.54 | 15.49 | 13.38 |
columbiathreadneedleus.com/investment-products/mutual-funds
for more recent performance information.
Key Fund Statistics
Fund net assets | $ 295,052,060 |
Total number of portfolio holdings | 68 |
Management services fees (represents 0.75% of Fund average net assets) | $ 2,202,678 |
Portfolio turnover for the reporting period | 58% |
Graphical Representation of Fund Holdings
The tables below show the investment makeup of the Fund represented as a percentage of Fund net assets. Derivatives are excluded from the tables unless otherwise noted. The Fund's portfolio composition is subject to change.
Top Holdings
| NVIDIA Corp. | 10.4 % |
| Microsoft Corp. | 10.3 % |
| Apple, Inc. | 7.7 % |
| Meta Platforms, Inc., Class A | 6.4 % |
| Amazon.com, Inc. | 4.8 % |
| Alphabet, Inc., Class A | 4.8 % |
| Broadcom, Inc. | 4.4 % |
| Tesla, Inc. | 2.4 % |
| Arista Networks, Inc. | 2.3 % |
| Advanced Micro Devices, Inc. | 2.2 % |
Equity Sector Allocation
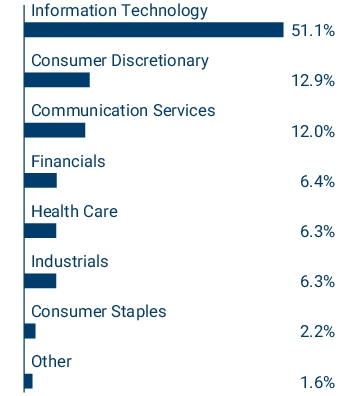
Information Technology Sub-industry Allocation

Top Holdings
| NVIDIA Corp. | 10.4 % |
| Microsoft Corp. | 10.3 % |
| Apple, Inc. | 7.7 % |
| Meta Platforms, Inc., Class A | 6.4 % |
| Amazon.com, Inc. | 4.8 % |
| Alphabet, Inc., Class A | 4.8 % |
| Broadcom, Inc. | 4.4 % |
| Tesla, Inc. | 2.4 % |
| Arista Networks, Inc. | 2.3 % |
| Advanced Micro Devices, Inc. | 2.2 % |
columbiathreadneedleus.com/resources/literature
. You can also request more information by contacting us at 1-800-345-6611.
What were the Fund costs for the reporting period?
(Based on a hypothetical $10,000 investment)
| Class | Cost of a $10,000 investment | Cost paid as a percentage of a $10,000 investment |
| Institutional 3 Class | $ 80 | 0.73 % |
Management's Discussion of Fund Performance
The performance of Institutional 3 Class shares for the period presented is shown in the Average Annual Total Returns table.
Top Performance Contributors
Stock selection
| Selections in the real estate sector contributed to performance relative to the benchmark.Allocations
| Sector allocation within the consumer discretionary, consumer staples and health care sectors contributed to relative performance.Individual holdings
| Top individual contributors to relative performance included Carvana Co., Fortinet, Inc. and Apple, Inc.Top Performance Detractors
Stock selection
Allocations
| Sector allocation within the utilities, materials and communication services sectors were the top three detracting sectors from relative performance.Individual holdings
| Bottom individual detractors to relative performance included Fortrea Holdings, Inc., TopBuild Corp. and Netflix, Inc.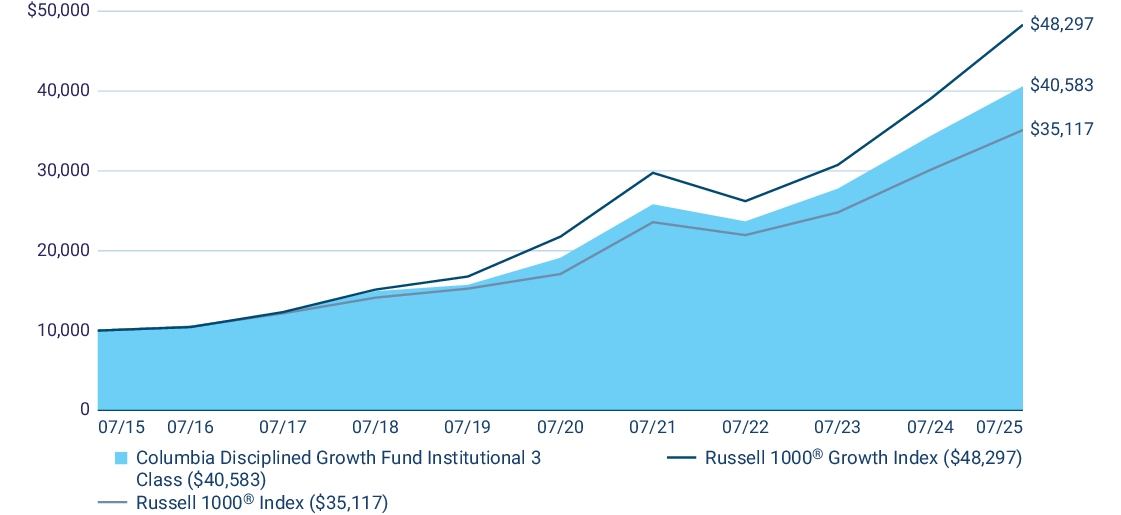
| Average Annual Total Returns (%) | 1 year | 5 years | 10 years |
| Institutional 3 Class | 18.12 | 16.26 | 15.04 |
| Russell 1000 ® Growth Index | 23.75 | 17.27 | 17.06 |
| Russell 1000 ® Index | 16.54 | 15.49 | 13.38 |
columbiathreadneedleus.com/investment-products/mutual-funds
for more recent performance information.
Key Fund Statistics
Fund net assets | $ 295,052,060 |
Total number of portfolio holdings | 68 |
Management services fees (represents 0.75% of Fund average net assets) | $ 2,202,678 |
Portfolio turnover for the reporting period | 58% |
Graphical Representation of Fund Holdings
The tables below show the investment makeup of the Fund represented as a percentage of Fund net assets. Derivatives are excluded from the tables unless otherwise noted. The Fund's portfolio composition is subject to change.
Top Holdings
| NVIDIA Corp. | 10.4 % |
| Microsoft Corp. | 10.3 % |
| Apple, Inc. | 7.7 % |
| Meta Platforms, Inc., Class A | 6.4 % |
| Amazon.com, Inc. | 4.8 % |
| Alphabet, Inc., Class A | 4.8 % |
| Broadcom, Inc. | 4.4 % |
| Tesla, Inc. | 2.4 % |
| Arista Networks, Inc. | 2.3 % |
| Advanced Micro Devices, Inc. | 2.2 % |
Equity Sector Allocation

Information Technology Sub-industry Allocation

Top Holdings
| NVIDIA Corp. | 10.4 % |
| Microsoft Corp. | 10.3 % |
| Apple, Inc. | 7.7 % |
| Meta Platforms, Inc., Class A | 6.4 % |
| Amazon.com, Inc. | 4.8 % |
| Alphabet, Inc., Class A | 4.8 % |
| Broadcom, Inc. | 4.4 % |
| Tesla, Inc. | 2.4 % |
| Arista Networks, Inc. | 2.3 % |
| Advanced Micro Devices, Inc. | 2.2 % |