Shareholder Report
Jul. 31, 2025
USD ($)
Holding
columbiathreadneedleus.com/resources/literature
. You can also request more information by contacting us at 1-800-345-6611.
What were the Fund costs for the reporting period?
(Based on a hypothetical $10,000 investment)
| Class | Cost of a $10,000 investment | Cost paid as a percentage of a $10,000 investment |
| Class A | $ 99 | 0.96 % |
Management's Discussion of Fund Performance
The performance of Class A shares for the period presented is shown in the Average Annual Total Returns table.
Top Performance Contributors
Allocation
| The Fund was positive overall relative to the benchmark for the period. Most positive relative returns were seen in the Fund’s allocation to the retail industry.Security selection
| Security selection overall was additive to Fund performance, most notably within the energy sector, as well as in the basic industry and utility sectors.Credit allocation
| Allocations to CCC rated debt, as well as small allocations to investment-grade debt, contributed to Fund performance.Top Performance Detractors
Allocation
Security selection
| Despite overall positive portfolio performance, negative security selection was most prominent in the real estate sector. Additional negative performance was seen in the consumer goods sector.Credit allocation
| Allocations to BB and B rated debt detracted from overall portfolio performance.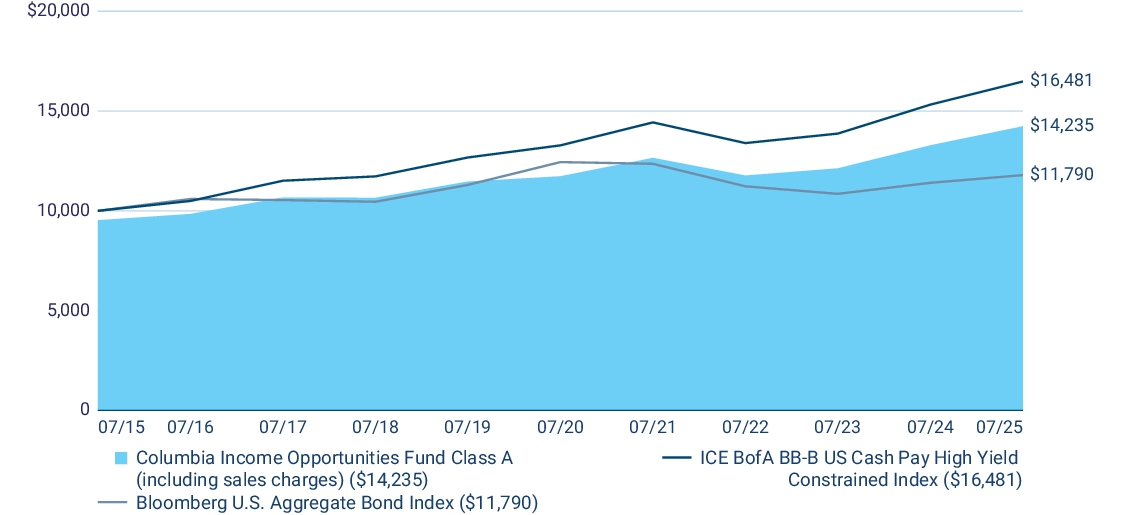
| Average Annual Total Returns (%) | 1 year | 5 years | 10 years |
| Class A (excluding sales charges) | 7.16 | 3.94 | 4.09 |
| Class A (including sales charges) | 2.03 | 2.94 | 3.59 |
| ICE BofA BB-B US Cash Pay High Yield Constrained Index | 7.56 | 4.41 | 5.12 |
| Bloomberg U.S. Aggregate Bond Index | 3.38 | (1.07 ) | 1.66 |
columbiathreadneedleus.com/investment-products/mutual-funds
for more recent performance information.
Key Fund Statistics
Fund net assets | $ 724,181,402 |
Total number of portfolio holdings | 442 |
Management services fees (represents 0.65% of Fund average net assets) | $ 4,626,181 |
Portfolio turnover for the reporting period | 43% |
Graphical Representation of Fund Holdings
The tables below show the investment makeup of the Fund represented as a percentage of Fund net assets. Derivatives are excluded from the tables unless otherwise noted. The Fund's portfolio composition is subject to change.
Top Holdings
| Columbia Short Duration High Yield ETF | 1.0 % |
| Picard Midco, Inc. 03/31/2029 6.500% | 0.8 % |
| CCO Holdings LLC/Capital Corp. 03/01/2030 4.750% | 0.8 % |
| Mozart Debt Merger Sub, Inc. 10/01/2029 5.250% | 0.7 % |
| HUB International, Ltd. 06/15/2030 7.250% | 0.6 % |
| Venture Global Plaquemines LNG LLC 01/15/2036 6.750% | 0.6 % |
| Aretec Escrow Issuer 2, Inc. 08/15/2030 10.000% | 0.6 % |
| CCO Holdings LLC/Capital Corp. 08/15/2030 4.500% | 0.6 % |
| Hudbay Minerals, Inc. 04/01/2029 6.125% | 0.6 % |
| ZoomInfo Technologies LLC/Finance Corp. 02/01/2029 3.875% | 0.6 % |
Asset Categories

Top Holdings
| Columbia Short Duration High Yield ETF | 1.0 % |
| Picard Midco, Inc. 03/31/2029 6.500% | 0.8 % |
| CCO Holdings LLC/Capital Corp. 03/01/2030 4.750% | 0.8 % |
| Mozart Debt Merger Sub, Inc. 10/01/2029 5.250% | 0.7 % |
| HUB International, Ltd. 06/15/2030 7.250% | 0.6 % |
| Venture Global Plaquemines LNG LLC 01/15/2036 6.750% | 0.6 % |
| Aretec Escrow Issuer 2, Inc. 08/15/2030 10.000% | 0.6 % |
| CCO Holdings LLC/Capital Corp. 08/15/2030 4.500% | 0.6 % |
| Hudbay Minerals, Inc. 04/01/2029 6.125% | 0.6 % |
| ZoomInfo Technologies LLC/Finance Corp. 02/01/2029 3.875% | 0.6 % |
columbiathreadneedleus.com/resources/literature
. You can also request more information by contacting us at 1-800-345-6611.
What were the Fund costs for the reporting period?
(Based on a hypothetical $10,000 investment)
| Class | Cost of a $10,000 investment | Cost paid as a percentage of a $10,000 investment |
| Class C | $ 176 | 1.71 % |
Management's Discussion of Fund Performance
The performance of Class C shares for the period presented is shown in the Average Annual Total Returns table.
Top Performance Contributors
Allocation
| The Fund was positive overall relative to the benchmark for the period. Most positive relative returns were seen in the Fund’s allocation to the retail industry.Security selection
| Security selection overall was additive to Fund performance, most notably within the energy sector, as well as in the basic industry and utility sectors.Credit allocation
| Allocations to CCC rated debt, as well as small allocations to investment-grade debt, contributed to Fund performance.Top Performance Detractors
Allocation
Security selection
| Despite overall positive portfolio performance, negative security selection was most prominent in the real estate sector. Additional negative performance was seen in the consumer goods sector.Credit allocation
| Allocations to BB and B rated debt detracted from overall portfolio performance.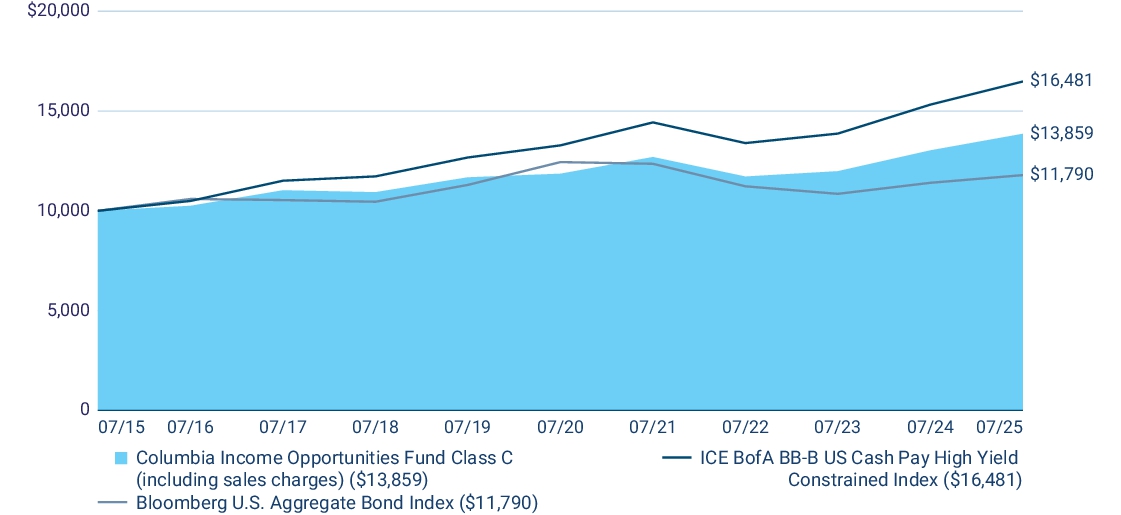
| Average Annual Total Returns (%) | 1 year | 5 years | 10 years |
| Class C (excluding sales charges) | 6.37 | 3.17 | 3.32 |
| Class C (including sales charges) | 5.37 | 3.17 | 3.32 |
| ICE BofA BB-B US Cash Pay High Yield Constrained Index | 7.56 | 4.41 | 5.12 |
| Bloomberg U.S. Aggregate Bond Index | 3.38 | (1.07 ) | 1.66 |
does
not reflect the deduction of taxes that a shareholder may pay on fund distributions or on the redemptions of fund shares.
columbiathreadneedleus.com/investment-products/mutual-funds
for more recent performance information.
Key Fund
Statistics
Fund net assets | $ 724,181,402 |
Total number of portfolio holdings | 442 |
Management services fees (represents 0.65% of Fund average net assets) | $ 4,626,181 |
Portfolio turnover for the reporting period | 43% |
Graphical Representation of Fund Holdings
The tables below show the investment makeup of the Fund represented as a percentage of Fund net assets. Derivatives are excluded from the tables unless otherwise noted. The Fund's portfolio composition is subject to change.
Top Holdings
| Columbia Short Duration High Yield ETF | 1.0 % |
| Picard Midco, Inc. 03/31/2029 6.500% | 0.8 % |
| CCO Holdings LLC/Capital Corp. 03/01/2030 4.750% | 0.8 % |
| Mozart Debt Merger Sub, Inc. 10/01/2029 5.250% | 0.7 % |
| HUB International, Ltd. 06/15/2030 7.250% | 0.6 % |
| Venture Global Plaquemines LNG LLC 01/15/2036 6.750% | 0.6 % |
| Aretec Escrow Issuer 2, Inc. 08/15/2030 10.000% | 0.6 % |
| CCO Holdings LLC/Capital Corp. 08/15/2030 4.500% | 0.6 % |
| Hudbay Minerals, Inc. 04/01/2029 6.125% | 0.6 % |
| ZoomInfo Technologies LLC/Finance Corp. 02/01/2029 3.875% | 0.6 % |
Asset Categories
Top Holdings
| Columbia Short Duration High Yield ETF | 1.0 % |
| Picard Midco, Inc. 03/31/2029 6.500% | 0.8 % |
| CCO Holdings LLC/Capital Corp. 03/01/2030 4.750% | 0.8 % |
| Mozart Debt Merger Sub, Inc. 10/01/2029 5.250% | 0.7 % |
| HUB International, Ltd. 06/15/2030 7.250% | 0.6 % |
| Venture Global Plaquemines LNG LLC 01/15/2036 6.750% | 0.6 % |
| Aretec Escrow Issuer 2, Inc. 08/15/2030 10.000% | 0.6 % |
| CCO Holdings LLC/Capital Corp. 08/15/2030 4.500% | 0.6 % |
| Hudbay Minerals, Inc. 04/01/2029 6.125% | 0.6 % |
| ZoomInfo Technologies LLC/Finance Corp. 02/01/2029 3.875% | 0.6 % |
columbiathreadneedleus.com/resources/literature
. You can also request more information by contacting us at 1-800-345-6611.
What were the Fund costs for the reporting period?
(Based on a hypothetical $10,000 investment)
| Class | Cost of a $10,000 investment | Cost paid as a percentage of a $10,000 investment |
| Institutional Class | $ 74 | 0.71 % |
Management's Discussion of Fund Performance
The performance of Institutional Class shares for the period presented is shown in the Average Annual Total Returns table.
Top Performance Contributors
Allocation
| The Fund was positive overall relative to the benchmark for the period. Most positive relative returns were seen in the Fund’s allocation to the retail industry.Security selection
| Security selection overall was additive to Fund performance, most notably within the energy sector, as well as in the basic industry and utility sectors.Credit allocation
| Allocations to CCC rated debt, as well as small allocations to investment-grade debt, contributed to Fund performance.Top Performance Detractors
Allocation
Security selection
| Despite overall positive portfolio performance, negative security selection was most prominent in the real estate sector. Additional negative performance was seen in the consumer goods sector.Credit allocation
| Allocations to BB and B rated debt detracted from overall portfolio performance.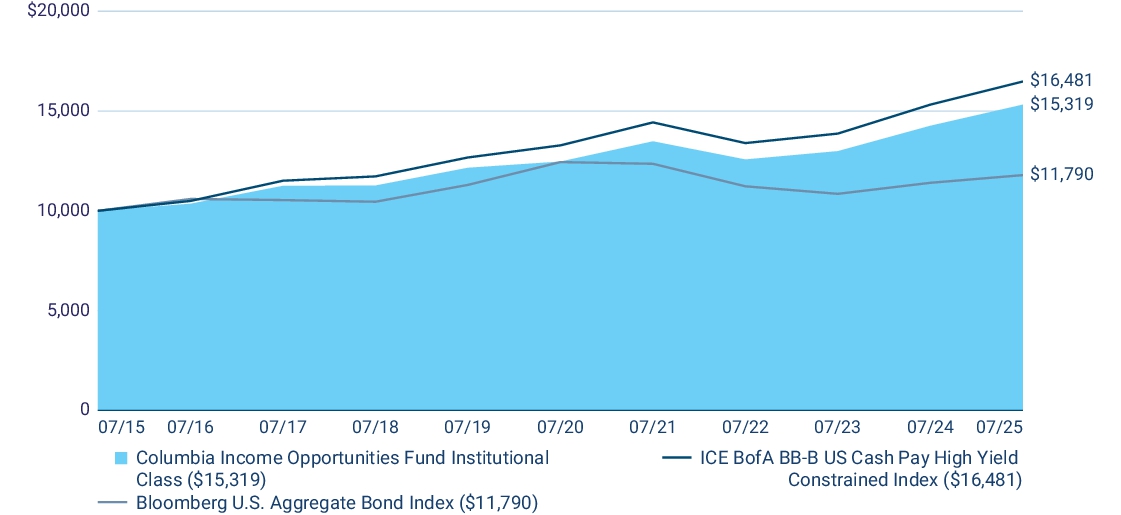
| Average Annual Total Returns (%) | 1 year | 5 years | 10 years |
| Institutional Class | 7.42 | 4.21 | 4.36 |
| ICE BofA BB-B US Cash Pay High Yield Constrained Index | 7.56 | 4.41 | 5.12 |
| Bloomberg U.S. Aggregate Bond Index | 3.38 | (1.07 ) | 1.66 |
columbiathreadneedleus.com/investment-products/mutual-funds
for more recent performance information.
Key Fund
Statistics
Fund net assets | $ 724,181,402 |
Total number of portfolio holdings | 442 |
Management services fees (represents 0.65% of Fund average net assets) | $ 4,626,181 |
Portfolio turnover for the reporting period | 43% |
Graphical Representation of Fund Holdings
The tables below show the investment makeup of the Fund represented as a percentage of Fund net assets. Derivatives are excluded from the tables unless otherwise noted. The Fund's portfolio composition is subject to change.
Top Holdings
| Columbia Short Duration High Yield ETF | 1.0 % |
| Picard Midco, Inc. 03/31/2029 6.500% | 0.8 % |
| CCO Holdings LLC/Capital Corp. 03/01/2030 4.750% | 0.8 % |
| Mozart Debt Merger Sub, Inc. 10/01/2029 5.250% | 0.7 % |
| HUB International, Ltd. 06/15/2030 7.250% | 0.6 % |
| Venture Global Plaquemines LNG LLC 01/15/2036 6.750% | 0.6 % |
| Aretec Escrow Issuer 2, Inc. 08/15/2030 10.000% | 0.6 % |
| CCO Holdings LLC/Capital Corp. 08/15/2030 4.500% | 0.6 % |
| Hudbay Minerals, Inc. 04/01/2029 6.125% | 0.6 % |
| ZoomInfo Technologies LLC/Finance Corp. 02/01/2029 3.875% | 0.6 % |
Asset Categories

Top Holdings
| Columbia Short Duration High Yield ETF | 1.0 % |
| Picard Midco, Inc. 03/31/2029 6.500% | 0.8 % |
| CCO Holdings LLC/Capital Corp. 03/01/2030 4.750% | 0.8 % |
| Mozart Debt Merger Sub, Inc. 10/01/2029 5.250% | 0.7 % |
| HUB International, Ltd. 06/15/2030 7.250% | 0.6 % |
| Venture Global Plaquemines LNG LLC 01/15/2036 6.750% | 0.6 % |
| Aretec Escrow Issuer 2, Inc. 08/15/2030 10.000% | 0.6 % |
| CCO Holdings LLC/Capital Corp. 08/15/2030 4.500% | 0.6 % |
| Hudbay Minerals, Inc. 04/01/2029 6.125% | 0.6 % |
| ZoomInfo Technologies LLC/Finance Corp. 02/01/2029 3.875% | 0.6 % |
columbiathreadneedleus.com/resources/literature
. You can also request more information by contacting us at 1-800-345-6611.
What were the Fund costs for the reporting period?
(Based on a hypothetical $10,000 investment)
| Class | Cost of a $10,000 investment | Cost paid as a percentage of a $10,000 investment |
| Institutional 2 Class | $ 66 | 0.64 % |
Management's Discussion of Fund Performance
The performance of Institutional 2 Class shares for the period presented is shown in the Average Annual Total Returns table.
Top Performance Contributors
Allocation
| The Fund was positive overall relative to the benchmark for the period. Most positive relative returns were seen in the Fund’s allocation to the retail industry.Security selection
| Security selection overall was additive to Fund performance, most notably within the energy sector, as well as in the basic industry and utility sectors.Credit allocation
| Allocations to CCC rated debt, as well as small allocations to investment-grade debt, contributed to Fund performance.Top Performance Detractors
Allocation
Security selection
| Despite overall positive portfolio performance, negative security selection was most prominent in the real estate sector. Additional negative performance was seen in the consumer goods sector.Credit allocation
| Allocations to BB and B rated debt detracted from overall portfolio performance.
| Average Annual Total Returns (%) | 1 year | 5 years | 10 years |
| Institutional 2 Class | 7.50 | 4.27 | 4.43 |
| ICE BofA BB-B US Cash Pay High Yield Constrained Index | 7.56 | 4.41 | 5.12 |
| Bloomberg U.S. Aggregate Bond Index | 3.38 | (1.07 ) | 1.66 |
columbiathreadneedleus.com/investment-products/mutual-funds
for more recent performance information
.
Key Fund
Statistics
Fund net assets | $ 724,181,402 |
Total number of portfolio holdings | 442 |
Management services fees (represents 0.65% of Fund average net assets) | $ 4,626,181 |
Portfolio turnover for the reporting period | 43% |
Graphical Representation of Fund Holdings
The tables below show the investment makeup of the Fund represented as a percentage of Fund net assets. Derivatives are excluded from the tables unless otherwise noted. The Fund's portfolio composition is subject to change.
Top Holdings
| Columbia Short Duration High Yield ETF | 1.0 % |
| Picard Midco, Inc. 03/31/2029 6.500% | 0.8 % |
| CCO Holdings LLC/Capital Corp. 03/01/2030 4.750% | 0.8 % |
| Mozart Debt Merger Sub, Inc. 10/01/2029 5.250% | 0.7 % |
| HUB International, Ltd. 06/15/2030 7.250% | 0.6 % |
| Venture Global Plaquemines LNG LLC 01/15/2036 6.750% | 0.6 % |
| Aretec Escrow Issuer 2, Inc. 08/15/2030 10.000% | 0.6 % |
| CCO Holdings LLC/Capital Corp. 08/15/2030 4.500% | 0.6 % |
| Hudbay Minerals, Inc. 04/01/2029 6.125% | 0.6 % |
| ZoomInfo Technologies LLC/Finance Corp. 02/01/2029 3.875% | 0.6 % |
Asset Categories

Top Holdings
| Columbia Short Duration High Yield ETF | 1.0 % |
| Picard Midco, Inc. 03/31/2029 6.500% | 0.8 % |
| CCO Holdings LLC/Capital Corp. 03/01/2030 4.750% | 0.8 % |
| Mozart Debt Merger Sub, Inc. 10/01/2029 5.250% | 0.7 % |
| HUB International, Ltd. 06/15/2030 7.250% | 0.6 % |
| Venture Global Plaquemines LNG LLC 01/15/2036 6.750% | 0.6 % |
| Aretec Escrow Issuer 2, Inc. 08/15/2030 10.000% | 0.6 % |
| CCO Holdings LLC/Capital Corp. 08/15/2030 4.500% | 0.6 % |
| Hudbay Minerals, Inc. 04/01/2029 6.125% | 0.6 % |
| ZoomInfo Technologies LLC/Finance Corp. 02/01/2029 3.875% | 0.6 % |
columbiathreadneedleus.com/resources/literature
. You can also request more information by contacting us at 1-800-345-6611.
What were the Fund costs for the reporting period?
(Based on a hypothetical $10,000 investment)
| Class | Cost of a $10,000 investment | Cost paid as a percentage of a $10,000 investment |
| Institutional 3 Class | $ 61 | 0.59 % |
Management's Discussion of Fund Performance
The performance of Institutional 3 Class shares for the period presented is shown in the Average Annual Total Returns table.
Top Performance Contributors
Allocation
| The Fund was positive overall relative to the benchmark for the period. Most positive relative returns were seen in the Fund’s allocation to the retail industry.Security selection
| Security selection overall was additive to Fund performance, most notably within the energy sector, as well as in the basic industry and utility sectors.Credit allocation
| Allocations to CCC rated debt, as well as small allocations to investment-grade debt, contributed to Fund performance.Top Performance Detractors
Allocation
Security selection
| Despite overall positive portfolio performance, negative security selection was most prominent in the real estate sector. Additional negative performance was seen in the consumer goods sector.Credit allocation
| Allocations to BB and B rated debt detracted from overall portfolio performance.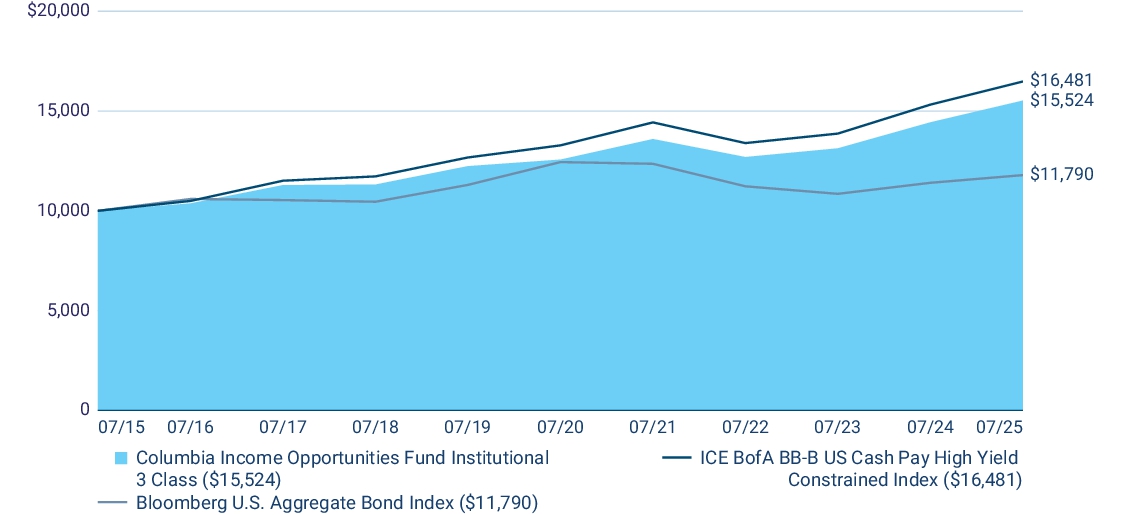
| Average Annual Total Returns (%) | 1 year | 5 years | 10 years |
| Institutional 3 Class | 7.55 | 4.32 | 4.50 |
| ICE BofA BB-B US Cash Pay High Yield Constrained Index | 7.56 | 4.41 | 5.12 |
| Bloomberg U.S. Aggregate Bond Index | 3.38 | (1.07 ) | 1.66 |
does
not reflect the deduction of taxes that a shareholder may pay on fund distributions or on the redemptions of fund shares.
columbiathreadneedleus.com/investment-products/mutual-funds
for more recent performance information.
Key Fund
Statistics
Fund net assets | $ 724,181,402 |
Total number of portfolio holdings | 442 |
Management services fees (represents 0.65% of Fund average net assets) | $ 4,626,181 |
Portfolio turnover for the reporting period | 43% |
Graphical Representation of Fund Holdings
The tables below show the investment makeup of the Fund represented as a percentage of Fund net assets. Derivatives are excluded from the tables unless otherwise noted. The Fund's portfolio composition is subject to
change
.Top Holdings
| Columbia Short Duration High Yield ETF | 1.0 % |
| Picard Midco, Inc. 03/31/2029 6.500% | 0.8 % |
| CCO Holdings LLC/Capital Corp. 03/01/2030 4.750% | 0.8 % |
| Mozart Debt Merger Sub, Inc. 10/01/2029 5.250% | 0.7 % |
| HUB International, Ltd. 06/15/2030 7.250% | 0.6 % |
| Venture Global Plaquemines LNG LLC 01/15/2036 6.750% | 0.6 % |
| Aretec Escrow Issuer 2, Inc. 08/15/2030 10.000% | 0.6 % |
| CCO Holdings LLC/Capital Corp. 08/15/2030 4.500% | 0.6 % |
| Hudbay Minerals, Inc. 04/01/2029 6.125% | 0.6 % |
| ZoomInfo Technologies LLC/Finance Corp. 02/01/2029 3.875% | 0.6 % |
Asset Categories

Top Holdings
| Columbia Short Duration High Yield ETF | 1.0 % |
| Picard Midco, Inc. 03/31/2029 6.500% | 0.8 % |
| CCO Holdings LLC/Capital Corp. 03/01/2030 4.750% | 0.8 % |
| Mozart Debt Merger Sub, Inc. 10/01/2029 5.250% | 0.7 % |
| HUB International, Ltd. 06/15/2030 7.250% | 0.6 % |
| Venture Global Plaquemines LNG LLC 01/15/2036 6.750% | 0.6 % |
| Aretec Escrow Issuer 2, Inc. 08/15/2030 10.000% | 0.6 % |
| CCO Holdings LLC/Capital Corp. 08/15/2030 4.500% | 0.6 % |
| Hudbay Minerals, Inc. 04/01/2029 6.125% | 0.6 % |
| ZoomInfo Technologies LLC/Finance Corp. 02/01/2029 3.875% | 0.6 % |
columbiathreadneedleus.com/resources/literature
. You can also request more information by contacting us at 1-800-345-6611.
What were the Fund costs for the reporting period?
(Based on a hypothetical $10,000 investment)
| Class | Cost of a $10,000 investment | Cost paid as a percentage of a $10,000 investment |
| Class S | $ 60(a) | 0.71 % (b) |
| (a) | Based on operations from October 2, 2024 (commencement of operations) through the stated period end. Had the class been open for the entire reporting period, expenses shown in the table above would have been higher. |
| (b) | Annualized. |
Management's Discussion of Fund Performance
The performance of Class S shares for the period presented is shown in the Average Annual Total Returns table.
Top Performance Contributors
Allocation
| The Fund was positive overall relative to the benchmark for the period. Most positive relative returns were seen in the Fund’s allocation to the retail industry.Security selection
| Security selection overall was additive to Fund performance, most notably within the energy sector, as well as in the basic industry and utility sectors.Credit allocation
| Allocations to CCC rated debt, as well as small allocations to investment-grade debt, contributed to Fund performance.Top Performance Detractors
Allocation
Security selection
| Despite overall positive portfolio performance, negative security selection was most prominent in the real estate sector. Additional negative performance was seen in the consumer goods sector.Credit allocation
| Allocations to BB and B rated debt detracted from overall portfolio performance.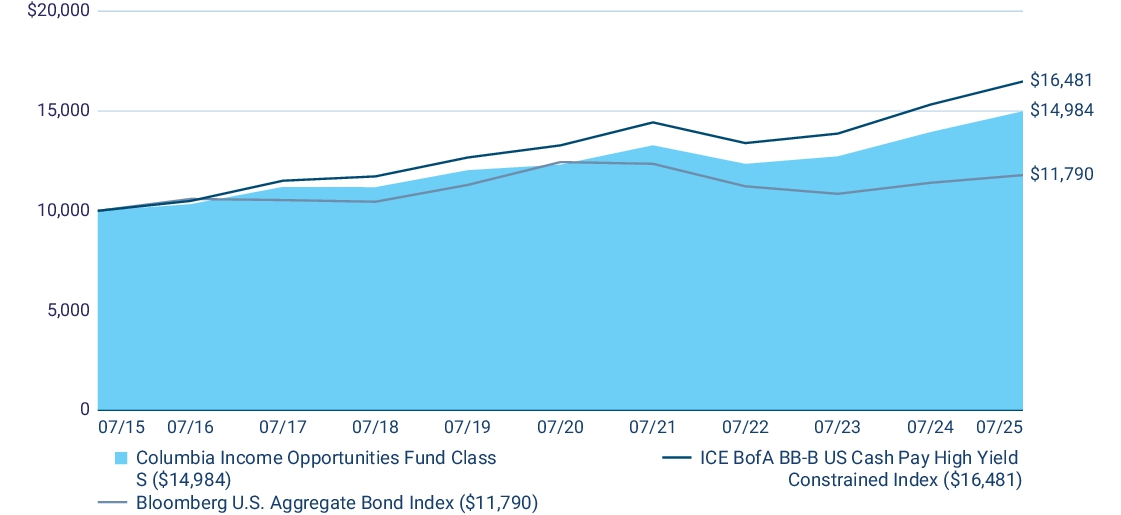
| Average Annual Total Returns (%) | 1 year | 5 years | 10 years |
| Class S (a) | 7.49 | 4.01 | 4.13 |
| ICE BofA BB-B US Cash Pay High Yield Constrained Index | 7.56 | 4.41 | 5.12 |
| Bloomberg U.S. Aggregate Bond Index | 3.38 | (1.07 ) | 1.66 |
(a) | The returns shown for periods prior to October 2, 2024 (including Since Fund Inception returns, if shown) include the returns of Class A. These returns are adjusted to reflect any higher class-related operating expenses of the newer share classes, as applicable. Please visit columbiathreadneedleus.com/investment-products/mutual-funds/appended-performance for more information. |
columbiathreadneedleus.com/investment-products/mutual-funds/appended-performance
for more information.
columbiathreadneedleus.com/investment-products/mutual-funds
for more recent performance information.
Key Fund Statistics
Fund net assets | $ 724,181,402 |
Total number of portfolio holdings | 442 |
Management services fees (represents 0.65% of Fund average net assets) | $ 4,626,181 |
Portfolio turnover for the reporting period | 43% |
Graphical Representation of Fund Holdings
The tables below show the investment makeup of the Fund represented as a percentage of
Fund
net assets. Deriva
tives are excluded from the tables unless otherwise noted. The Fund's portfolio co
mposition is subject to change.Top Holdings
| Columbia Short Duration High Yield ETF | 1.0 % |
| Picard Midco, Inc. 03/31/2029 6.500% | 0.8 % |
| CCO Holdings LLC/Capital Corp. 03/01/2030 4.750% | 0.8 % |
| Mozart Debt Merger Sub, Inc. 10/01/2029 5.250% | 0.7 % |
| HUB International, Ltd. 06/15/2030 7.250% | 0.6 % |
| Venture Global Plaquemines LNG LLC 01/15/2036 6.750% | 0.6 % |
| Aretec Escrow Issuer 2, Inc. 08/15/2030 10.000% | 0.6 % |
| CCO Holdings LLC/Capital Corp. 08/15/2030 4.500% | 0.6 % |
| Hudbay Minerals, Inc. 04/01/2029 6.125% | 0.6 % |
| ZoomInfo Technologies LLC/Finance Corp. 02/01/2029 3.875% | 0.6 % |
Asset Categories

Top Holdings
| Columbia Short Duration High Yield ETF | 1.0 % |
| Picard Midco, Inc. 03/31/2029 6.500% | 0.8 % |
| CCO Holdings LLC/Capital Corp. 03/01/2030 4.750% | 0.8 % |
| Mozart Debt Merger Sub, Inc. 10/01/2029 5.250% | 0.7 % |
| HUB International, Ltd. 06/15/2030 7.250% | 0.6 % |
| Venture Global Plaquemines LNG LLC 01/15/2036 6.750% | 0.6 % |
| Aretec Escrow Issuer 2, Inc. 08/15/2030 10.000% | 0.6 % |
| CCO Holdings LLC/Capital Corp. 08/15/2030 4.500% | 0.6 % |
| Hudbay Minerals, Inc. 04/01/2029 6.125% | 0.6 % |
| ZoomInfo Technologies LLC/Finance Corp. 02/01/2029 3.875% | 0.6 % |
| [1] | Based on operations from October 2, 2024 (commencement of operations) through the stated period end. Had the class been open for the entire reporting period, expenses shown in the table above would have been higher. |
| [2] | Annualized. |