Shareholder Report
Jul. 31, 2025
USD ($)
Holding
columbiathreadneedleus.com/resources/literature
. You can also request more information by contacting us at 1-800-345-6611.
What were the Fund costs for the reporting period?
(Based on a hypothetical $10,000 investment)
| Class | Cost of a $10,000 investment | Cost paid as a percentage of a $10,000 investment |
| Class A | $ 80 | 0.80 % |
Management's Discussion of Fund Performance
The performance of Class A shares for the period presented is shown in the Average Annual Total Returns table.
Top Performance Contributors
Sector security selection
| Strong security selection in housing, airport, utility and education bonds contributed to the Fund’s performance relative to its benchmark.Credit quality security selection
| Strong security selection in AA rated bonds was a positive contributor to benchmark-relative performance.Sector allocation
| Overweights to the pre-refunded and housing sectors added to the Fund’s relative performance.Credit quality allocation
| An underweight to AAA rated bonds added to relative performance.Top Performance Detractors
Yield curve positioning
Sector security selection
| Security selection in the transportation and pre-refunded sectors detracted from relative performance.Credit quality security selection
| Security selection in AAA and A rated bonds detracted from relative performance.Credit quality allocation
| An overweight to AA bonds and underweights to A and BBB bonds detracted from relative performance.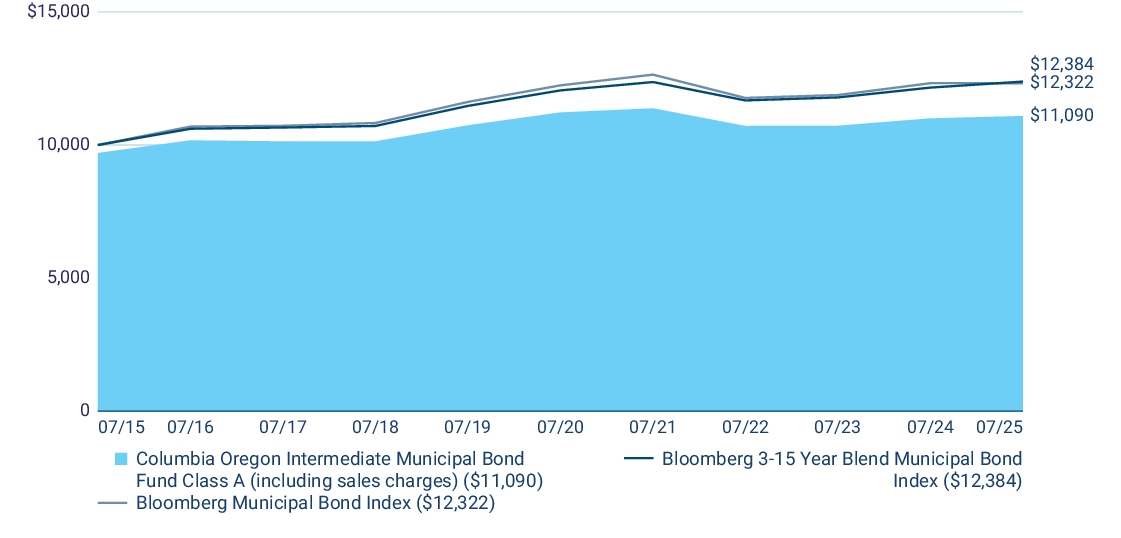
| Average Annual Total Returns (%) | 1 year | 5 years | 10 years |
| Class A (excluding sales charges) | 0.82 | (0.24 ) | 1.35 |
| Class A (including sales charges) | (2.22 ) | (0.85 ) | 1.04 |
| Bloomberg 3-15 Year Blend Municipal Bond Index | 1.86 | 0.54 | 2.16 |
| Bloomberg Municipal Bond Index | 0.00 | 0.13 | 2.11 |
columbiathreadneedleus.com/investment-products/mutual-funds
for more recent performance information.
Key Fund Statistics
Fund net assets | $ 285,046,389 |
Total number of portfolio holdings | 187 |
Management services fees (represents 0.47% of Fund average net assets) | $ 1,403,974 |
Portfolio turnover for the reporting period | 12% |
Graphical Representation of Fund Holdings
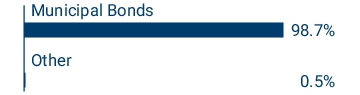
The tables below show the investment makeup of the Fund represented as a percentage of Fund net assets. Derivatives are excluded from the tables unless otherwise noted. The Fund's portfolio composition is subject to change.
Top Holdings
| Oregon Health & Science University 07/01/2034 5.000% | 2.7 % |
| City of Portland Water System 04/01/2030 4.000% | 2.6 % |
| Tri-County Metropolitan Transportation District of Oregon 10/01/2032 5.000% | 2.5 % |
| Oregon Health & Science University 07/01/2032 5.000% | 1.9 % |
| City of Portland Sewer System 12/01/2042 5.000% | 1.8 % |
| Puerto Rico Public Finance Corp. 08/01/2026 6.000% | 1.8 % |
| State of Oregon Housing & Community Services Department 01/10/2048 4.000% | 1.8 % |
| State of Oregon Department of Transportation 11/15/2037 5.000% | 1.8 % |
| Port of Portland 07/01/2039 4.000% | 1.7 % |
| Washington Clackamas & Yamhill Counties School District No. 88J 06/15/2031 5.000% | 1.6 % |
Asset Categories

Top Holdings
| Oregon Health & Science University 07/01/2034 5.000% | 2.7 % |
| City of Portland Water System 04/01/2030 4.000% | 2.6 % |
| Tri-County Metropolitan Transportation District of Oregon 10/01/2032 5.000% | 2.5 % |
| Oregon Health & Science University 07/01/2032 5.000% | 1.9 % |
| City of Portland Sewer System 12/01/2042 5.000% | 1.8 % |
| Puerto Rico Public Finance Corp. 08/01/2026 6.000% | 1.8 % |
| State of Oregon Housing & Community Services Department 01/10/2048 4.000% | 1.8 % |
| State of Oregon Department of Transportation 11/15/2037 5.000% | 1.8 % |
| Port of Portland 07/01/2039 4.000% | 1.7 % |
| Washington Clackamas & Yamhill Counties School District No. 88J 06/15/2031 5.000% | 1.6 % |
columbiathreadneedleus.com/resources/literature
. You can also request more information by contacting us at 1-800-345-6611.
What were the Fund costs for the reporting period?
(Based on a hypothetical $10,000 investment)
| Class | Cost of a $10,000 investment | Cost paid as a percentage of a $10,000 investment |
| Institutional Class | $ 55 | 0.55 % |
Management's Discussion of Fund Performance
The performance of Institutional Class shares for the period presented is shown in the Average Annual Total Returns table.
Top Performance Contributors
Sector security selection
| Strong security selection in housing, airport, utility and education bonds contributed to the Fund’s performance relative to its benchmark.Credit quality security selection
| Strong security selection in AA rated bonds was a positive contributor to benchmark-relative performance.Sector allocation
| Overweights to the pre-refunded and housing sectors added to the Fund’s relative performance.Credit quality allocation
| An underweight to AAA rated bonds added to relative performance.Top Performance Detractors
Yield curve positioning
Sector security selection
| Security selection in the transportation and pre-refunded sectors detracted from relative performance.Credit quality security selection
| Security selection in AAA and A rated bonds detracted from relative performance.Credit quality allocation
| An overweight to AA bonds and underweights to A and BBB bonds detracted from relative performance.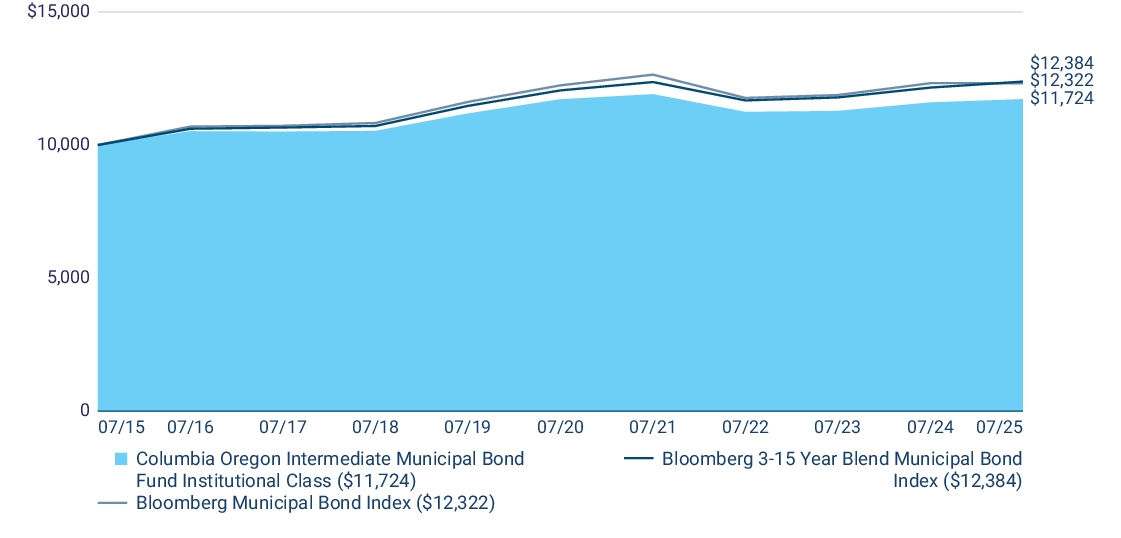
| Average Annual Total Returns (%) | 1 year | 5 years | 10 years |
| Institutional Class | 1.07 | 0.01 | 1.60 |
| Bloomberg 3-15 Year Blend Municipal Bond Index | 1.86 | 0.54 | 2.16 |
| Bloomberg Municipal Bond Index | 0.00 | 0.13 | 2.11 |
columbiathreadneedleus.com/investment-products/mutual-funds
for more recent performance information.
Key Fund Statistics
Fund net assets | $ 285,046,389 |
Total number of portfolio holdings | 187 |
Management services fees (represents 0.47% of Fund average net assets) | $ 1,403,974 |
Portfolio turnover for the reporting period | 12% |
Graphical Representation of Fund Holdings
The tables below show the investment makeup of the Fund represented as a percentage of Fund net assets. Derivatives are excluded from the tables unless otherwise noted. The Fund's portfolio composition is subject to change.
Top Holdings
| Oregon Health & Science University 07/01/2034 5.000% | 2.7 % |
| City of Portland Water System 04/01/2030 4.000% | 2.6 % |
| Tri-County Metropolitan Transportation District of Oregon 10/01/2032 5.000% | 2.5 % |
| Oregon Health & Science University 07/01/2032 5.000% | 1.9 % |
| City of Portland Sewer System 12/01/2042 5.000% | 1.8 % |
| Puerto Rico Public Finance Corp. 08/01/2026 6.000% | 1.8 % |
| State of Oregon Housing & Community Services Department 01/10/2048 4.000% | 1.8 % |
| State of Oregon Department of Transportation 11/15/2037 5.000% | 1.8 % |
| Port of Portland 07/01/2039 4.000% | 1.7 % |
| Washington Clackamas & Yamhill Counties School District No. 88J 06/15/2031 5.000% | 1.6 % |
Asset Categories

Top Holdings
| Oregon Health & Science University 07/01/2034 5.000% | 2.7 % |
| City of Portland Water System 04/01/2030 4.000% | 2.6 % |
| Tri-County Metropolitan Transportation District of Oregon 10/01/2032 5.000% | 2.5 % |
| Oregon Health & Science University 07/01/2032 5.000% | 1.9 % |
| City of Portland Sewer System 12/01/2042 5.000% | 1.8 % |
| Puerto Rico Public Finance Corp. 08/01/2026 6.000% | 1.8 % |
| State of Oregon Housing & Community Services Department 01/10/2048 4.000% | 1.8 % |
| State of Oregon Department of Transportation 11/15/2037 5.000% | 1.8 % |
| Port of Portland 07/01/2039 4.000% | 1.7 % |
| Washington Clackamas & Yamhill Counties School District No. 88J 06/15/2031 5.000% | 1.6 % |
columbiathreadneedleus.com/resources/literature
. You can also request more information by contacting us at 1-800-345-6611.
What were the Fund costs for the reporting period?
(Based on a hypothetical $10,000 investment)
| Class | Cost of a $10,000 investment | Cost paid as a percentage of a $10,000 investment |
| Institutional 2 Class | $ 53 | 0.53 % |
Management's Discussion of Fund Performance
The performance of Institutional 2 Class shares for the period presented is shown in the Average Annual Total Returns table.
Top Performance Contributors
Sector security selection
| Strong security selection in housing, airport, utility and education bonds contributed to the Fund’s performance relative to its benchmark.Credit quality security selection
| Strong security selection in AA rated bonds was a positive contributor to benchmark-relative performance.Sector allocation
| Overweights to the pre-refunded and housing sectors added to the Fund’s relative performance.Credit quality allocation
| An underweight to AAA rated bonds added to relative performance.Top Performance Detractors
Yield curve positioning
Sector security selection
| Security selection in the transportation and pre-refunded sectors detracted from relative performance.Credit quality security selection
| Security selection in AAA and A rated bonds detracted from relative performance.Credit quality allocation
| An overweight to AA bonds and underweights to A and BBB bonds detracted from relative performance.
| Average Annual Total Returns (%) | 1 year | 5 years | 10 years |
| Institutional 2 Class | 1.10 | 0.04 | 1.63 |
| Bloomberg 3-15 Year Blend Municipal Bond Index | 1.86 | 0.54 | 2.16 |
| Bloomberg Municipal Bond Index | 0.00 | 0.13 | 2.11 |
columbiathreadneedleus.com/investment-products/mutual-funds
for more recent performance information.
Key Fund Statistics
Fund net assets | $ 285,046,389 |
Total number of portfolio holdings | 187 |
Management services fees (represents 0.47% of Fund average net assets) | $ 1,403,974 |
Portfolio turnover for the reporting period | 12% |
Graphical Representation of Fund Holdings
The tables below show the investment makeup of the Fund represented as a percentage of Fund net assets. Derivatives are excluded from the tables unless otherwise noted. The Fund's portfolio composition is subject to change.
Top Holdings
| Oregon Health & Science University 07/01/2034 5.000% | 2.7 % |
| City of Portland Water System 04/01/2030 4.000% | 2.6 % |
| Tri-County Metropolitan Transportation District of Oregon 10/01/2032 5.000% | 2.5 % |
| Oregon Health & Science University 07/01/2032 5.000% | 1.9 % |
| City of Portland Sewer System 12/01/2042 5.000% | 1.8 % |
| Puerto Rico Public Finance Corp. 08/01/2026 6.000% | 1.8 % |
| State of Oregon Housing & Community Services Department 01/10/2048 4.000% | 1.8 % |
| State of Oregon Department of Transportation 11/15/2037 5.000% | 1.8 % |
| Port of Portland 07/01/2039 4.000% | 1.7 % |
| Washington Clackamas & Yamhill Counties School District No. 88J 06/15/2031 5.000% | 1.6 % |
Asset Categories

Top Holdings
| Oregon Health & Science University 07/01/2034 5.000% | 2.7 % |
| City of Portland Water System 04/01/2030 4.000% | 2.6 % |
| Tri-County Metropolitan Transportation District of Oregon 10/01/2032 5.000% | 2.5 % |
| Oregon Health & Science University 07/01/2032 5.000% | 1.9 % |
| City of Portland Sewer System 12/01/2042 5.000% | 1.8 % |
| Puerto Rico Public Finance Corp. 08/01/2026 6.000% | 1.8 % |
| State of Oregon Housing & Community Services Department 01/10/2048 4.000% | 1.8 % |
| State of Oregon Department of Transportation 11/15/2037 5.000% | 1.8 % |
| Port of Portland 07/01/2039 4.000% | 1.7 % |
| Washington Clackamas & Yamhill Counties School District No. 88J 06/15/2031 5.000% | 1.6 % |
columbiathreadneedleus.com/resources/literature
. You can also request more information by contacting us at 1-800-345-6611.
What were the Fund costs for the reporting period?
(Based on a hypothetical $10,000 investment)
| Class | Cost of a $10,000 investment | Cost paid as a percentage of a $10,000 investment |
| Institutional 3 Class | $ 48 | 0.48 % |
Management's Discussion of Fund Performance
The performance of Institutional 3 Class shares for the period presented is shown in the Average Annual Total Returns table.
Top Performance Contributors
Sector security selection
| Strong security selection in housing, airport, utility and education bonds contributed to the Fund’s performance relative to its benchmark.Credit quality security selection
| Strong security selection in AA rated bonds was a positive contributor to benchmark-relative performance.Sector allocation
| Overweights to the pre-refunded and housing sectors added to the Fund’s relative performance.Credit quality allocation
| An underweight to AAA rated bonds added to relative performance.Top Performance Detractors
Yield curve positioning
Sector security selection
| Security selection in the transportation and pre-refunded sectors detracted from relative performance.Credit quality security selection
| Security selection in AAA and A rated bonds detracted from relative performance.Credit quality allocation
| An overweight to AA bonds and underweights to A and BBB bonds detracted from relative performance.
| Average Annual Total Returns (%) | 1 year | 5 years | 10 years |
| Institutional 3 Class (a) | 1.15 | 0.09 | 1.67 |
| Bloomberg 3-15 Year Blend Municipal Bond Index | 1.86 | 0.54 | 2.16 |
| Bloomberg Municipal Bond Index | 0.00 | 0.13 | 2.11 |
(a) | The returns shown for periods prior to March 1, 2017 (including Since Fund Inception returns, if shown) include the returns of Institutional Class. These returns are adjusted to reflect any higher class-related operating expenses of the newer share classes, as applicable. Please visit columbiathreadneedleus.com/investment-products/mutual-funds/appended-performance for more information. |
columbiathreadneedleus.com/investment-products/mutual-funds
for more recent performance information.
Key Fund Statistics
Fund net assets | $ 285,046,389 |
Total number of portfolio holdings | 187 |
Management services fees (represents 0.47% of Fund average net assets) | $ 1,403,974 |
Portfolio turnover for the reporting period | 12% |
Graphical Representation of Fund Holdings
The tables below show the investment makeup of the Fund represented as a percentage of Fund net assets. Derivatives are excluded from the tables unless otherwise noted. The Fund's portfolio composition is subject to change.
Top Holdings
| Oregon Health & Science University 07/01/2034 5.000% | 2.7 % |
| City of Portland Water System 04/01/2030 4.000% | 2.6 % |
| Tri-County Metropolitan Transportation District of Oregon 10/01/2032 5.000% | 2.5 % |
| Oregon Health & Science University 07/01/2032 5.000% | 1.9 % |
| City of Portland Sewer System 12/01/2042 5.000% | 1.8 % |
| Puerto Rico Public Finance Corp. 08/01/2026 6.000% | 1.8 % |
| State of Oregon Housing & Community Services Department 01/10/2048 4.000% | 1.8 % |
| State of Oregon Department of Transportation 11/15/2037 5.000% | 1.8 % |
| Port of Portland 07/01/2039 4.000% | 1.7 % |
| Washington Clackamas & Yamhill Counties School District No. 88J 06/15/2031 5.000% | 1.6 % |
Asset Categories

Top Holdings
| Oregon Health & Science University 07/01/2034 5.000% | 2.7 % |
| City of Portland Water System 04/01/2030 4.000% | 2.6 % |
| Tri-County Metropolitan Transportation District of Oregon 10/01/2032 5.000% | 2.5 % |
| Oregon Health & Science University 07/01/2032 5.000% | 1.9 % |
| City of Portland Sewer System 12/01/2042 5.000% | 1.8 % |
| Puerto Rico Public Finance Corp. 08/01/2026 6.000% | 1.8 % |
| State of Oregon Housing & Community Services Department 01/10/2048 4.000% | 1.8 % |
| State of Oregon Department of Transportation 11/15/2037 5.000% | 1.8 % |
| Port of Portland 07/01/2039 4.000% | 1.7 % |
| Washington Clackamas & Yamhill Counties School District No. 88J 06/15/2031 5.000% | 1.6 % |
columbiathreadneedleus.com/resources/literature
. You can also request more information by contacting us at 1-800-345-6611.
What were the Fund costs for the reporting period?
(Based on a hypothetical $10,000 investment)
| Class | Cost of a $10,000 investment | Cost paid as a percentage of a $10,000 investment |
| Class S | $ 45(a) | 0.55 % (b) |
| (a) | Based on operations from October 2, 2024 (commencement of operations) through the stated period end. Had the class been open for the entire reporting period, expenses shown in the table above would have been higher. |
| (b) | Annualized. |
Management's Discussion of Fund Performance
The performance of Class S shares for the period presented is shown in the Average Annual Total Returns table.
Top Performance Contributors
Sector security selection
| Strong security selection in housing, airport, utility and education bonds contributed to the Fund’s performance relative to its benchmark.Credit quality security selection
| Strong security selection in AA rated bonds was a positive contributor to benchmark-relative performance.Sector allocation
| Overweights to the pre-refunded and housing sectors added to the Fund’s relative performance.Credit quality allocation
| An underweight to AAA rated bonds added to relative performance.Top Performance Detractors
Yield curve positioning
Sector security selection
| Security selection in the transportation and pre-refunded sectors detracted from relative performance.Credit quality security selection
| Security selection in AAA and A rated bonds detracted from relative performance.Credit quality allocation
| An overweight to AA bonds and underweights to A and BBB bonds detracted from relative performance.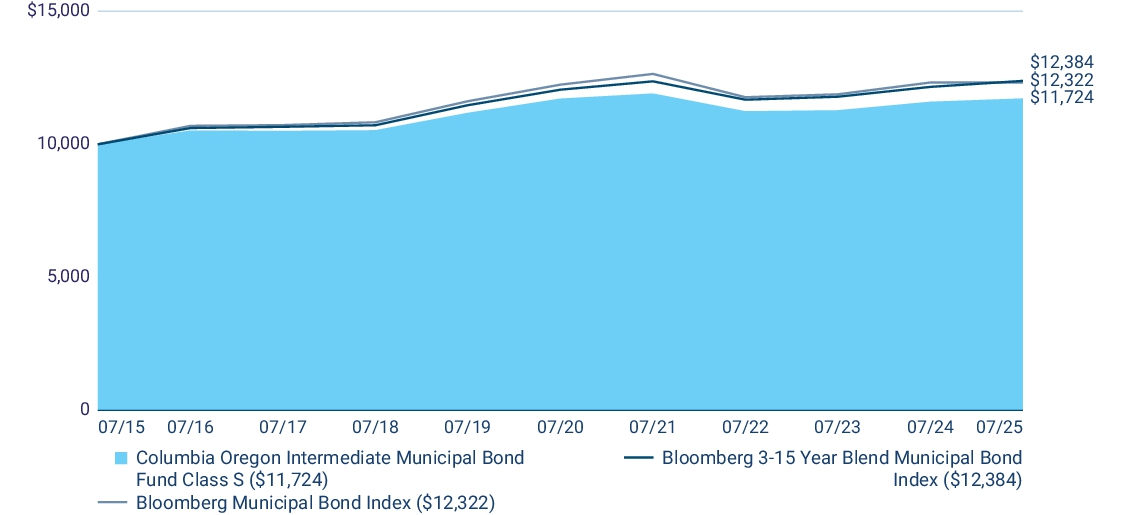
| Average Annual Total Returns (%) | 1 year | 5 years | 10 years |
| Class S (a) | 1.07 | 0.01 | 1.60 |
| Bloomberg 3-15 Year Blend Municipal Bond Index | 1.86 | 0.54 | 2.16 |
| Bloomberg Municipal Bond Index | 0.00 | 0.13 | 2.11 |
(a) | The returns shown for periods prior to October 2, 2024 (including Since Fund Inception returns, if shown) include the returns of Institutional Class. These returns are adjusted to reflect any higher class-related operating expenses of the newer share classes, as applicable. Please visit columbiathreadneedleus.com/investment-products/mutual-funds/appended-performance for more information. |
columbiathreadneedleus.com/investment-products/mutual-funds
for more recent performance information.
Key Fund Statistics
Fund net assets | $ 285,046,389 |
Total number of portfolio holdings | 187 |
Management services fees (represents 0.47% of Fund average net assets) | $ 1,403,974 |
Portfolio turnover for the reporting period | 12% |
Graphical Representation of Fund Holdings
The tables below show the investment makeup of the Fund represented as a percentage of Fund net assets. Derivatives are excluded from the tables unless otherwise noted. The Fund's portfolio composition is subject to change.
Top Holdings
| Oregon Health & Science University 07/01/2034 5.000% | 2.7 % |
| City of Portland Water System 04/01/2030 4.000% | 2.6 % |
| Tri-County Metropolitan Transportation District of Oregon 10/01/2032 5.000% | 2.5 % |
| Oregon Health & Science University 07/01/2032 5.000% | 1.9 % |
| City of Portland Sewer System 12/01/2042 5.000% | 1.8 % |
| Puerto Rico Public Finance Corp. 08/01/2026 6.000% | 1.8 % |
| State of Oregon Housing & Community Services Department 01/10/2048 4.000% | 1.8 % |
| State of Oregon Department of Transportation 11/15/2037 5.000% | 1.8 % |
| Port of Portland 07/01/2039 4.000% | 1.7 % |
| Washington Clackamas & Yamhill Counties School District No. 88J 06/15/2031 5.000% | 1.6 % |
Asset Categories
Top Holdings
| Oregon Health & Science University 07/01/2034 5.000% | 2.7 % |
| City of Portland Water System 04/01/2030 4.000% | 2.6 % |
| Tri-County Metropolitan Transportation District of Oregon 10/01/2032 5.000% | 2.5 % |
| Oregon Health & Science University 07/01/2032 5.000% | 1.9 % |
| City of Portland Sewer System 12/01/2042 5.000% | 1.8 % |
| Puerto Rico Public Finance Corp. 08/01/2026 6.000% | 1.8 % |
| State of Oregon Housing & Community Services Department 01/10/2048 4.000% | 1.8 % |
| State of Oregon Department of Transportation 11/15/2037 5.000% | 1.8 % |
| Port of Portland 07/01/2039 4.000% | 1.7 % |
| Washington Clackamas & Yamhill Counties School District No. 88J 06/15/2031 5.000% | 1.6 % |
| [1] | Based on operations from October 2, 2024 (commencement of operations) through the stated period end. Had the class been open for the entire reporting period, expenses shown in the table above would have been higher. |
| [2] | Annualized. |