This report describes changes to the Fund that occurred during the reporting period.
What were the Fund costs for the last year?
(based on a hypothetical $10,000 investment)
Fund name | Costs of a $10,000
investment | Costs paid as a percentage of a
$10,000 investment |
|---|---|---|
iShares Core 30/70 Conservative Allocation ETF | $10Footnote Reference(a) | 0.10%Footnote Reference(a) |
| Footnote | Description |
Footnote(a) | Excludes fees and expenses incurred indirectly as a result of investments in underlying funds. |
How did the Fund perform last year?
For the reporting period ended July 31, 2025, the Fund returned 7.29%.
For the same period, the Bloomberg U.S. Universal Index returned 4.00% and the MSCI All Country World Index (Net) returned 15.87%.
What contributed to performance?
U.S. large-capitalization equities were the largest contributor to the Fund’s return during the reporting period. In particular, semiconductor stocks gained amid continued demand for artificial intelligence (“AI”) and generative AI workloads in data centers, while systems software firms benefited from strong growth in their respective cloud businesses and increasing adoption of AI technologies. International developed stocks, particularly in Germany, gained amid optimism surrounding a historic fiscal stimulus plan targeting infrastructure and defense spending.
Within the bond allocation, longer-dated U.S. dollar-denominated bonds contributed.
What detracted from performance?
During the reporting period, there were no meaningful detractors from the Fund’s return.
The views expressed reflect the opinions of BlackRock as of the date of this report and are subject to change based on changes in market, economic or other conditions. These views are not intended to be a forecast of future events and are no guarantee of future results.
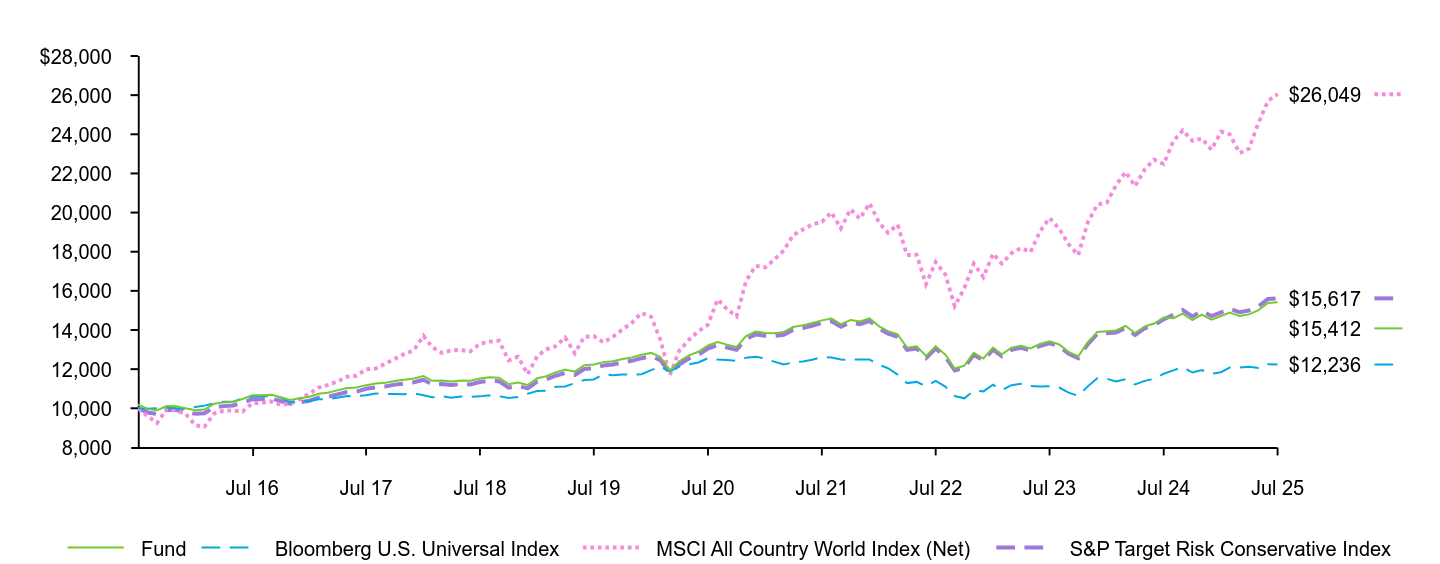
Fund | Bloomberg U.S. Universal Index | MSCI All Country World Index (Net) | S&P Target Risk Conservative Index | |
|---|---|---|---|---|
Jul 15 | $10,193 | $10,000 | $10,000 | $10,000 |
Aug 15 | $9,970 | $9,971 | $9,597 | $9,780 |
Sep 15 | $9,896 | $10,009 | $9,249 | $9,711 |
Oct 15 | $10,119 | $10,042 | $9,974 | $9,928 |
Nov 15 | $10,107 | $10,005 | $9,890 | $9,917 |
Dec 15 | $9,999 | $9,955 | $9,711 | $9,812 |
Jan 16 | $9,904 | $10,065 | $9,124 | $9,720 |
Feb 16 | $9,934 | $10,136 | $9,061 | $9,746 |
Mar 16 | $10,233 | $10,261 | $9,732 | $10,043 |
Apr 16 | $10,302 | $10,331 | $9,876 | $10,111 |
May 16 | $10,340 | $10,339 | $9,889 | $10,145 |
Jun 16 | $10,475 | $10,520 | $9,828 | $10,281 |
Jul 16 | $10,667 | $10,607 | $10,253 | $10,468 |
Aug 16 | $10,669 | $10,619 | $10,288 | $10,473 |
Sep 16 | $10,694 | $10,621 | $10,348 | $10,496 |
Oct 16 | $10,560 | $10,551 | $10,171 | $10,365 |
Nov 16 | $10,421 | $10,314 | $10,248 | $10,231 |
Dec 16 | $10,513 | $10,344 | $10,469 | $10,311 |
Jan 17 | $10,590 | $10,381 | $10,754 | $10,388 |
Feb 17 | $10,742 | $10,461 | $11,056 | $10,538 |
Mar 17 | $10,796 | $10,457 | $11,192 | $10,592 |
Apr 17 | $10,915 | $10,544 | $11,367 | $10,708 |
May 17 | $11,041 | $10,625 | $11,615 | $10,829 |
Jun 17 | $11,058 | $10,616 | $11,664 | $10,846 |
Jul 17 | $11,183 | $10,669 | $11,990 | $10,996 |
Aug 17 | $11,261 | $10,761 | $12,035 | $11,072 |
Sep 17 | $11,299 | $10,723 | $12,268 | $11,113 |
Oct 17 | $11,394 | $10,736 | $12,523 | $11,209 |
Nov 17 | $11,454 | $10,720 | $12,764 | $11,258 |
Dec 17 | $11,523 | $10,767 | $12,970 | $11,328 |
Jan 18 | $11,650 | $10,664 | $13,701 | $11,456 |
Feb 18 | $11,404 | $10,563 | $13,123 | $11,214 |
Mar 18 | $11,425 | $10,616 | $12,829 | $11,236 |
Apr 18 | $11,375 | $10,545 | $12,961 | $11,190 |
May 18 | $11,421 | $10,603 | $12,978 | $11,238 |
Jun 18 | $11,404 | $10,587 | $12,909 | $11,220 |
Jul 18 | $11,524 | $10,609 | $13,297 | $11,343 |
Aug 18 | $11,587 | $10,662 | $13,400 | $11,404 |
Sep 18 | $11,564 | $10,616 | $13,457 | $11,381 |
Oct 18 | $11,235 | $10,527 | $12,450 | $11,058 |
Nov 18 | $11,322 | $10,574 | $12,633 | $11,147 |
Dec 18 | $11,191 | $10,740 | $11,744 | $11,020 |
Jan 19 | $11,540 | $10,888 | $12,671 | $11,365 |
Feb 19 | $11,641 | $10,900 | $13,008 | $11,469 |
Mar 19 | $11,837 | $11,097 | $13,173 | $11,663 |
Apr 19 | $11,976 | $11,112 | $13,617 | $11,800 |
May 19 | $11,870 | $11,283 | $12,808 | $11,699 |
Jun 19 | $12,203 | $11,442 | $13,649 | $12,007 |
Jul 19 | $12,235 | $11,476 | $13,689 | $12,043 |
Aug 19 | $12,359 | $11,736 | $13,364 | $12,189 |
Sep 19 | $12,405 | $11,685 | $13,647 | $12,235 |
Oct 19 | $12,521 | $11,723 | $14,024 | $12,351 |
Nov 19 | $12,595 | $11,720 | $14,368 | $12,424 |
Dec 19 | $12,731 | $11,738 | $14,872 | $12,561 |
Jan 20 | $12,830 | $11,948 | $14,673 | $12,658 |
Feb 20 | $12,625 | $12,127 | $13,514 | $12,460 |
Mar 20 | $11,932 | $11,891 | $11,691 | $11,778 |
Apr 20 | $12,403 | $12,129 | $12,944 | $12,242 |
May 20 | $12,704 | $12,242 | $13,503 | $12,543 |
Jun 20 | $12,887 | $12,344 | $13,933 | $12,725 |
Jul 20 | $13,211 | $12,561 | $14,268 | $13,052 |
Aug 20 | $13,386 | $12,489 | $15,565 | $13,233 |
Sep 20 | $13,253 | $12,466 | $15,063 | $13,104 |
Oct 20 | $13,133 | $12,422 | $14,696 | $12,987 |
Nov 20 | $13,687 | $12,584 | $16,509 | $13,538 |
Dec 20 | $13,923 | $12,627 | $17,278 | $13,775 |
Jan 21 | $13,851 | $12,548 | $17,197 | $13,707 |
Feb 21 | $13,834 | $12,386 | $17,593 | $13,690 |
Mar 21 | $13,903 | $12,242 | $18,060 | $13,760 |
Apr 21 | $14,151 | $12,345 | $18,846 | $14,008 |
May 21 | $14,240 | $12,392 | $19,130 | $14,100 |
Jun 21 | $14,357 | $12,482 | $19,392 | $14,217 |
Jul 21 | $14,493 | $12,607 | $19,525 | $14,356 |
Aug 21 | $14,583 | $12,599 | $20,014 | $14,447 |
Sep 21 | $14,301 | $12,491 | $19,188 | $14,169 |
Oct 21 | $14,510 | $12,481 | $20,168 | $14,379 |
Nov 21 | $14,431 | $12,496 | $19,684 | $14,301 |
Dec 21 | $14,591 | $12,488 | $20,472 | $14,462 |
Jan 22 | $14,189 | $12,214 | $19,470 | $14,065 |
Feb 22 | $13,943 | $12,048 | $18,967 | $13,820 |
Mar 22 | $13,775 | $11,724 | $19,379 | $13,655 |
Apr 22 | $13,099 | $11,287 | $17,827 | $12,985 |
May 22 | $13,167 | $11,349 | $17,847 | $13,054 |
Jun 22 | $12,673 | $11,122 | $16,337 | $12,563 |
Jul 22 | $13,166 | $11,402 | $17,477 | $13,054 |
Aug 22 | $12,736 | $11,105 | $16,833 | $12,627 |
Sep 22 | $12,033 | $10,627 | $15,222 | $11,930 |
Oct 22 | $12,180 | $10,510 | $16,141 | $12,076 |
Nov 22 | $12,836 | $10,902 | $17,392 | $12,729 |
Dec 22 | $12,544 | $10,865 | $16,703 | $12,440 |
Jan 23 | $13,106 | $11,202 | $17,903 | $12,999 |
Feb 23 | $12,756 | $10,927 | $17,393 | $12,652 |
Mar 23 | $13,092 | $11,183 | $17,930 | $12,987 |
Apr 23 | $13,200 | $11,252 | $18,183 | $13,094 |
May 23 | $13,059 | $11,135 | $17,985 | $12,956 |
Jun 23 | $13,285 | $11,118 | $19,027 | $13,182 |
Jul 23 | $13,427 | $11,129 | $19,724 | $13,323 |
Aug 23 | $13,263 | $11,062 | $19,173 | $13,161 |
Sep 23 | $12,883 | $10,798 | $18,380 | $12,783 |
Oct 23 | $12,649 | $10,636 | $17,827 | $12,552 |
Nov 23 | $13,361 | $11,114 | $19,473 | $13,260 |
Dec 23 | $13,903 | $11,536 | $20,407 | $13,800 |
Jan 24 | $13,939 | $11,508 | $20,519 | $13,836 |
Feb 24 | $13,975 | $11,370 | $21,401 | $13,874 |
Mar 24 | $14,211 | $11,482 | $22,075 | $14,109 |
Apr 24 | $13,840 | $11,214 | $21,345 | $13,742 |
May 24 | $14,186 | $11,400 | $22,207 | $14,086 |
Jun 24 | $14,330 | $11,504 | $22,702 | $14,231 |
Jul 24 | $14,642 | $11,765 | $22,481 | $14,542 |
Aug 24 | $14,604 | $11,938 | $23,658 | $14,785 |
Sep 24 | $14,833 | $12,102 | $24,205 | $15,019 |
Oct 24 | $14,510 | $11,827 | $23,666 | $14,693 |
Nov 24 | $14,791 | $11,952 | $23,785 | $14,979 |
Dec 24 | $14,525 | $11,771 | $23,218 | $14,710 |
Jan 25 | $14,713 | $11,842 | $24,137 | $14,901 |
Feb 25 | $14,890 | $12,087 | $23,998 | $15,082 |
Mar 25 | $14,722 | $12,084 | $23,048 | $14,913 |
Apr 25 | $14,799 | $12,127 | $23,258 | $14,992 |
May 25 | $15,017 | $12,065 | $24,592 | $15,215 |
Jun 25 | $15,379 | $12,253 | $25,699 | $15,582 |
Jul 25 | $15,412 | $12,236 | $26,049 | $15,617 |
........................................................................................................................................................................................................................................................................................................................................................................................................................................................................................................................................................................................................................................................................................................................................................................................................................................................................................................................................................................................................................................ | 1 Year | 5 Years | 10 Years |
|---|---|---|---|
Fund NAV........................................................................................................................................................................................................................................................................................................................................................................................................................................................................................................................................................................................................................................................................................................................................................................................................................................................................................................................................................................................................................................ | 7.29% | 3.52% | 4.42% |
Bloomberg U.S. Universal Index........................................................................................................................................................................................................................................................................................................................................................................................................................................................................................................................................................................................................................................................................................................................................................................................................................................................................................................................................................................................................................................ | 4.00 | (0.52) | 2.04 |
MSCI All Country World Index (Net)........................................................................................................................................................................................................................................................................................................................................................................................................................................................................................................................................................................................................................................................................................................................................................................................................................................................................................................................................................................................................................................ | 15.87 | 12.79 | 10.05 |
S&P Target Risk Conservative Index........................................................................................................................................................................................................................................................................................................................................................................................................................................................................................................................................................................................................................................................................................................................................................................................................................................................................................................................................................................................................................................ | 7.39 | 3.65 | 4.56 |
Key Fund statistics
Net Assets........................................................................................................................................................................................................................................................................................................................................................................................................................................................................................................................................................................................................................................................................................................................................................................................................................................................................................................................................................................................................................................ | $629,172,274 |
|---|---|
Number of Portfolio Holdings........................................................................................................................................................................................................................................................................................................................................................................................................................................................................................................................................................................................................................................................................................................................................................................................................................................................................................................................................................................................................................................ | 9 |
Net Investment Advisory Fees........................................................................................................................................................................................................................................................................................................................................................................................................................................................................................................................................................................................................................................................................................................................................................................................................................................................................................................................................................................................................................................ | $599,708 |
Portfolio Turnover Rate........................................................................................................................................................................................................................................................................................................................................................................................................................................................................................................................................................................................................................................................................................................................................................................................................................................................................................................................................................................................................................................ | 3% |
Portfolio composition
All holdings
Asset class | Percent of Total InvestmentsFootnote Reference(a) |
|---|---|
Domestic Fixed Income........................................................................................................................................................................................................................................................................................................................................................................................................................................................................................................................................................................................................................................................................................................................................................................................................................................................................................................................................................................................................................................ | 57.3% |
Domestic Equity........................................................................................................................................................................................................................................................................................................................................................................................................................................................................................................................................................................................................................................................................................................................................................................................................................................................................................................................................................................................................................................ | 20.8 |
International Equity........................................................................................................................................................................................................................................................................................................................................................................................................................................................................................................................................................................................................................................................................................................................................................................................................................................................................................................................................................................................................................................ | 11.8 |
International Fixed Income........................................................................................................................................................................................................................................................................................................................................................................................................................................................................................................................................................................................................................................................................................................................................................................................................................................................................................................................................................................................................................................ | 10.1 |
Security | Percent of Total InvestmentsFootnote Reference(a) |
|---|---|
iShares Core Total USD Bond Market ETF........................................................................................................................................................................................................................................................................................................................................................................................................................................................................................................................................................................................................................................................................................................................................................................................................................................................................................................................................................................................................................................ | 57.3% |
iShares Core S&P 500 ETF........................................................................................................................................................................................................................................................................................................................................................................................................................................................................................................................................................................................................................................................................................................................................................................................................................................................................................................................................................................................................................................ | 19.2 |
iShares Core International Aggregate Bond ETF........................................................................................................................................................................................................................................................................................................................................................................................................................................................................................................................................................................................................................................................................................................................................................................................................................................................................................................................................................................................................................................ | 10.1 |
iShares Core MSCI International Developed Markets ETF........................................................................................................................................................................................................................................................................................................................................................................................................................................................................................................................................................................................................................................................................................................................................................................................................................................................................................................................................................................................................................................ | 8.4 |
iShares Core MSCI Emerging Markets ETF........................................................................................................................................................................................................................................................................................................................................................................................................................................................................................................................................................................................................................................................................................................................................................................................................................................................................................................................................................................................................................................ | 3.4 |
iShares Core S&P Mid-Cap ETF........................................................................................................................................................................................................................................................................................................................................................................................................................................................................................................................................................................................................................................................................................................................................................................................................................................................................................................................................................................................................................................ | 1.1 |
iShares Core S&P Small-Cap ETF........................................................................................................................................................................................................................................................................................................................................................................................................................................................................................................................................................................................................................................................................................................................................................................................................................................................................................................................................................................................................................................ | 0.5 |
| Footnote | Description |
Footnote(a) | Excludes money market funds. |
This report describes changes to the Fund that occurred during the reporting period.
What were the Fund costs for the last year?
(based on a hypothetical $10,000 investment)
Fund name | Costs of a $10,000
investment | Costs paid as a percentage of a
$10,000 investment |
|---|---|---|
iShares Core 40/60 Moderate Allocation ETF | $10Footnote Reference(a) | 0.10%Footnote Reference(a) |
| Footnote | Description |
Footnote(a) | Excludes fees and expenses incurred indirectly as a result of investments in underlying funds. |
How did the Fund perform last year?
For the reporting period ended July 31, 2025, the Fund returned 8.38%.
For the same period, the Bloomberg U.S. Universal Index returned 4.00% and the MSCI All Country World Index (Net) returned 15.87%.
What contributed to performance?
U.S. large-capitalization equities were the largest contributor to the Fund’s return during the reporting period. In particular, semiconductor stocks gained amid continued demand for artificial intelligence (“AI”) and generative AI workloads in data centers, while systems software firms benefited from strong growth in their respective cloud businesses and increasing adoption of AI technologies. International developed stocks, particularly in Germany, gained amid optimism surrounding a historic fiscal stimulus plan targeting infrastructure and defense spending.
Within the bond allocation, longer-dated U.S. dollar-denominated bonds contributed.
What detracted from performance?
During the reporting period, there were no meaningful detractors from the Fund’s return.
The views expressed reflect the opinions of BlackRock as of the date of this report and are subject to change based on changes in market, economic or other conditions. These views are not intended to be a forecast of future events and are no guarantee of future results.
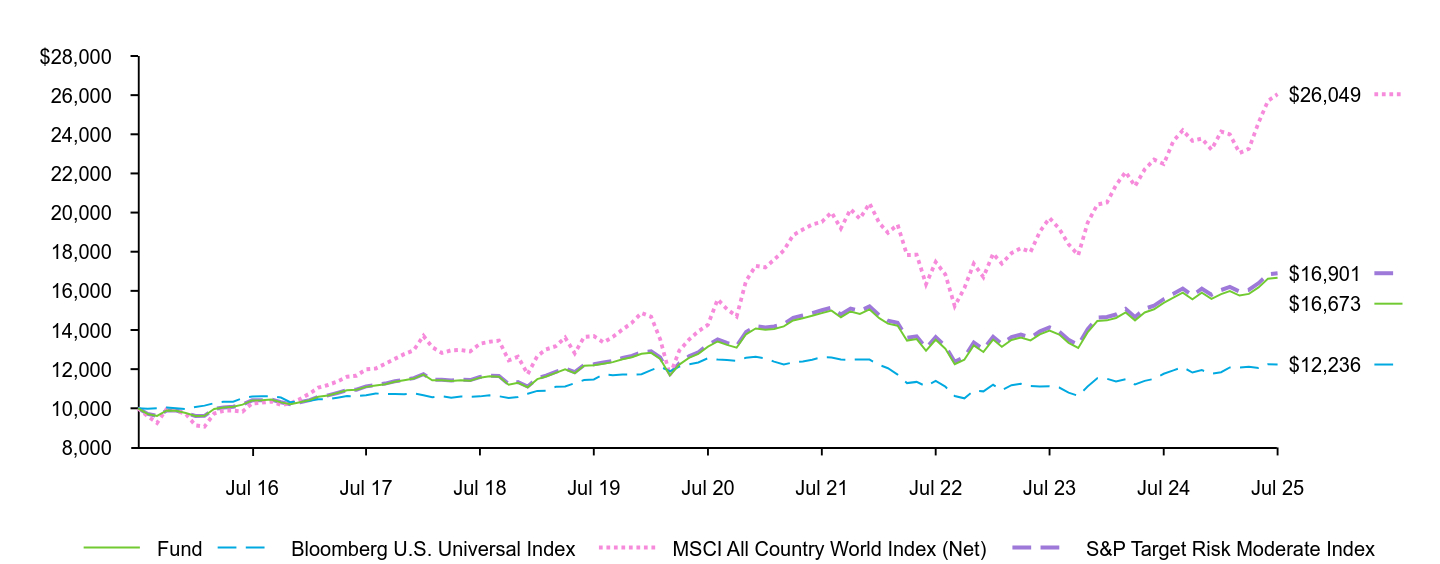
Fund | Bloomberg U.S. Universal Index | MSCI All Country World Index (Net) | S&P Target Risk Moderate Index | |
|---|---|---|---|---|
Jul 15 | $10,000 | $10,000 | $10,000 | $10,000 |
Aug 15 | $9,710 | $9,971 | $9,597 | $9,711 |
Sep 15 | $9,608 | $10,009 | $9,249 | $9,608 |
Oct 15 | $9,888 | $10,042 | $9,974 | $9,888 |
Nov 15 | $9,879 | $10,005 | $9,890 | $9,881 |
Dec 15 | $9,759 | $9,955 | $9,711 | $9,762 |
Jan 16 | $9,604 | $10,065 | $9,124 | $9,608 |
Feb 16 | $9,613 | $10,136 | $9,061 | $9,614 |
Mar 16 | $9,962 | $10,261 | $9,732 | $9,966 |
Apr 16 | $10,036 | $10,331 | $9,876 | $10,040 |
May 16 | $10,076 | $10,339 | $9,889 | $10,081 |
Jun 16 | $10,186 | $10,520 | $9,828 | $10,189 |
Jul 16 | $10,403 | $10,607 | $10,253 | $10,407 |
Aug 16 | $10,411 | $10,619 | $10,288 | $10,417 |
Sep 16 | $10,443 | $10,621 | $10,348 | $10,451 |
Oct 16 | $10,303 | $10,551 | $10,171 | $10,309 |
Nov 16 | $10,204 | $10,314 | $10,248 | $10,213 |
Dec 16 | $10,313 | $10,344 | $10,469 | $10,311 |
Jan 17 | $10,418 | $10,381 | $10,754 | $10,419 |
Feb 17 | $10,588 | $10,461 | $11,056 | $10,589 |
Mar 17 | $10,656 | $10,457 | $11,192 | $10,659 |
Apr 17 | $10,781 | $10,544 | $11,367 | $10,784 |
May 17 | $10,922 | $10,625 | $11,615 | $10,923 |
Jun 17 | $10,949 | $10,616 | $11,664 | $10,948 |
Jul 17 | $11,095 | $10,669 | $11,990 | $11,121 |
Aug 17 | $11,166 | $10,761 | $12,035 | $11,192 |
Sep 17 | $11,234 | $10,723 | $12,268 | $11,262 |
Oct 17 | $11,351 | $10,736 | $12,523 | $11,382 |
Nov 17 | $11,434 | $10,720 | $12,764 | $11,455 |
Dec 17 | $11,519 | $10,767 | $12,970 | $11,542 |
Jan 18 | $11,719 | $10,664 | $13,701 | $11,744 |
Feb 18 | $11,428 | $10,563 | $13,123 | $11,454 |
Mar 18 | $11,428 | $10,616 | $12,829 | $11,454 |
Apr 18 | $11,391 | $10,545 | $12,961 | $11,420 |
May 18 | $11,436 | $10,603 | $12,978 | $11,468 |
Jun 18 | $11,409 | $10,587 | $12,909 | $11,442 |
Jul 18 | $11,565 | $10,609 | $13,297 | $11,600 |
Aug 18 | $11,633 | $10,662 | $13,400 | $11,666 |
Sep 18 | $11,614 | $10,616 | $13,457 | $11,651 |
Oct 18 | $11,203 | $10,527 | $12,450 | $11,240 |
Nov 18 | $11,305 | $10,574 | $12,633 | $11,343 |
Dec 18 | $11,075 | $10,740 | $11,744 | $11,112 |
Jan 19 | $11,490 | $10,888 | $12,671 | $11,534 |
Feb 19 | $11,624 | $10,900 | $13,008 | $11,667 |
Mar 19 | $11,810 | $11,097 | $13,173 | $11,858 |
Apr 19 | $11,986 | $11,112 | $13,617 | $12,036 |
May 19 | $11,796 | $11,283 | $12,808 | $11,845 |
Jun 19 | $12,177 | $11,442 | $13,649 | $12,216 |
Jul 19 | $12,204 | $11,476 | $13,689 | $12,246 |
Aug 19 | $12,280 | $11,736 | $13,364 | $12,342 |
Sep 19 | $12,358 | $11,685 | $13,647 | $12,420 |
Oct 19 | $12,508 | $11,723 | $14,024 | $12,573 |
Nov 19 | $12,606 | $11,720 | $14,368 | $12,675 |
Dec 19 | $12,787 | $11,738 | $14,872 | $12,858 |
Jan 20 | $12,835 | $11,948 | $14,673 | $12,909 |
Feb 20 | $12,519 | $12,127 | $13,514 | $12,593 |
Mar 20 | $11,684 | $11,891 | $11,691 | $11,750 |
Apr 20 | $12,232 | $12,129 | $12,944 | $12,305 |
May 20 | $12,575 | $12,242 | $13,503 | $12,653 |
Jun 20 | $12,784 | $12,344 | $13,933 | $12,863 |
Jul 20 | $13,149 | $12,561 | $14,268 | $13,240 |
Aug 20 | $13,414 | $12,489 | $15,565 | $13,513 |
Sep 20 | $13,240 | $12,466 | $15,063 | $13,340 |
Oct 20 | $13,095 | $12,422 | $14,696 | $13,195 |
Nov 20 | $13,782 | $12,584 | $16,509 | $13,893 |
Dec 20 | $14,079 | $12,627 | $17,278 | $14,198 |
Jan 21 | $14,010 | $12,548 | $17,197 | $14,132 |
Feb 21 | $14,056 | $12,386 | $17,593 | $14,177 |
Mar 21 | $14,186 | $12,242 | $18,060 | $14,311 |
Apr 21 | $14,487 | $12,345 | $18,846 | $14,620 |
May 21 | $14,605 | $12,392 | $19,130 | $14,739 |
Jun 21 | $14,726 | $12,482 | $19,392 | $14,864 |
Jul 21 | $14,863 | $12,607 | $19,525 | $15,007 |
Aug 21 | $14,991 | $12,599 | $20,014 | $15,138 |
Sep 21 | $14,653 | $12,491 | $19,188 | $14,799 |
Oct 21 | $14,947 | $12,481 | $20,168 | $15,097 |
Nov 21 | $14,825 | $12,496 | $19,684 | $14,975 |
Dec 21 | $15,054 | $12,488 | $20,472 | $15,208 |
Jan 22 | $14,604 | $12,214 | $19,470 | $14,755 |
Feb 22 | $14,326 | $12,048 | $18,967 | $14,474 |
Mar 22 | $14,219 | $11,724 | $19,379 | $14,366 |
Apr 22 | $13,461 | $11,287 | $17,827 | $13,601 |
May 22 | $13,536 | $11,349 | $17,847 | $13,678 |
Jun 22 | $12,942 | $11,122 | $16,337 | $13,076 |
Jul 22 | $13,502 | $11,402 | $17,477 | $13,644 |
Aug 22 | $13,042 | $11,105 | $16,833 | $13,179 |
Sep 22 | $12,250 | $10,627 | $15,222 | $12,379 |
Oct 22 | $12,486 | $10,510 | $16,141 | $12,619 |
Nov 22 | $13,216 | $10,902 | $17,392 | $13,358 |
Dec 22 | $12,877 | $10,865 | $16,703 | $13,016 |
Jan 23 | $13,512 | $11,202 | $17,903 | $13,659 |
Feb 23 | $13,139 | $10,927 | $17,393 | $13,282 |
Mar 23 | $13,490 | $11,183 | $17,930 | $13,639 |
Apr 23 | $13,617 | $11,252 | $18,183 | $13,768 |
May 23 | $13,465 | $11,135 | $17,985 | $13,615 |
Jun 23 | $13,776 | $11,118 | $19,027 | $13,932 |
Jul 23 | $13,972 | $11,129 | $19,724 | $14,132 |
Aug 23 | $13,768 | $11,062 | $19,173 | $13,926 |
Sep 23 | $13,344 | $10,798 | $18,380 | $13,497 |
Oct 23 | $13,082 | $10,636 | $17,827 | $13,232 |
Nov 23 | $13,876 | $11,114 | $19,473 | $14,039 |
Dec 23 | $14,459 | $11,536 | $20,407 | $14,631 |
Jan 24 | $14,493 | $11,508 | $20,519 | $14,666 |
Feb 24 | $14,616 | $11,370 | $21,401 | $14,792 |
Mar 24 | $14,900 | $11,482 | $22,075 | $15,081 |
Apr 24 | $14,491 | $11,214 | $21,345 | $14,667 |
May 24 | $14,898 | $11,400 | $22,207 | $15,081 |
Jun 24 | $15,061 | $11,504 | $22,702 | $15,248 |
Jul 24 | $15,384 | $11,765 | $22,481 | $15,577 |
Aug 24 | $15,655 | $11,938 | $23,658 | $15,853 |
Sep 24 | $15,914 | $12,102 | $24,205 | $16,117 |
Oct 24 | $15,564 | $11,827 | $23,666 | $15,764 |
Nov 24 | $15,904 | $11,952 | $23,785 | $16,110 |
Dec 24 | $15,595 | $11,771 | $23,218 | $15,797 |
Jan 25 | $15,836 | $11,842 | $24,137 | $16,043 |
Feb 25 | $15,992 | $12,087 | $23,998 | $16,203 |
Mar 25 | $15,760 | $12,084 | $23,048 | $15,968 |
Apr 25 | $15,845 | $12,127 | $23,258 | $16,056 |
May 25 | $16,174 | $12,065 | $24,592 | $16,391 |
Jun 25 | $16,617 | $12,253 | $25,699 | $16,843 |
Jul 25 | $16,673 | $12,236 | $26,049 | $16,901 |
........................................................................................................................................................................................................................................................................................................................................................................................................................................................................................................................................................................................................................................................................................................................................................................................................................................................................................................................................................................................................................................ | 1 Year | 5 Years | 10 Years |
|---|---|---|---|
Fund NAV........................................................................................................................................................................................................................................................................................................................................................................................................................................................................................................................................................................................................................................................................................................................................................................................................................................................................................................................................................................................................................................ | 8.38% | 4.86% | 5.25% |
Bloomberg U.S. Universal Index........................................................................................................................................................................................................................................................................................................................................................................................................................................................................................................................................................................................................................................................................................................................................................................................................................................................................................................................................................................................................................................ | 4.00 | (0.52) | 2.04 |
MSCI All Country World Index (Net)........................................................................................................................................................................................................................................................................................................................................................................................................................................................................................................................................................................................................................................................................................................................................................................................................................................................................................................................................................................................................................................ | 15.87 | 12.79 | 10.05 |
S&P Target Risk Moderate Index........................................................................................................................................................................................................................................................................................................................................................................................................................................................................................................................................................................................................................................................................................................................................................................................................................................................................................................................................................................................................................................ | 8.50 | 5.00 | 5.39 |
Key Fund statistics
Net Assets........................................................................................................................................................................................................................................................................................................................................................................................................................................................................................................................................................................................................................................................................................................................................................................................................................................................................................................................................................................................................................................ | $1,528,715,865 |
|---|---|
Number of Portfolio Holdings........................................................................................................................................................................................................................................................................................................................................................................................................................................................................................................................................................................................................................................................................................................................................................................................................................................................................................................................................................................................................................................ | 9 |
Net Investment Advisory Fees........................................................................................................................................................................................................................................................................................................................................................................................................................................................................................................................................................................................................................................................................................................................................................................................................................................................................................................................................................................................................................................ | $1,422,633 |
Portfolio Turnover Rate........................................................................................................................................................................................................................................................................................................................................................................................................................................................................................................................................................................................................................................................................................................................................................................................................................................................................................................................................................................................................................................ | 5% |
Portfolio composition
All holdings
Asset class | Percent of Total InvestmentsFootnote Reference(a) |
|---|---|
Domestic Fixed Income........................................................................................................................................................................................................................................................................................................................................................................................................................................................................................................................................................................................................................................................................................................................................................................................................................................................................................................................................................................................................................................ | 48.5% |
Domestic Equity........................................................................................................................................................................................................................................................................................................................................................................................................................................................................................................................................................................................................................................................................................................................................................................................................................................................................................................................................................................................................................................ | 27.4 |
International Equity........................................................................................................................................................................................................................................................................................................................................................................................................................................................................................................................................................................................................................................................................................................................................................................................................................................................................................................................................................................................................................................ | 15.6 |
International Fixed Income........................................................................................................................................................................................................................................................................................................................................................................................................................................................................................................................................................................................................................................................................................................................................................................................................................................................................................................................................................................................................................................ | 8.5 |
Security | Percent of Total InvestmentsFootnote Reference(a) |
|---|---|
iShares Core Total USD Bond Market ETF........................................................................................................................................................................................................................................................................................................................................................................................................................................................................................................................................................................................................................................................................................................................................................................................................................................................................................................................................................................................................................................ | 48.5% |
iShares Core S&P 500 ETF........................................................................................................................................................................................................................................................................................................................................................................................................................................................................................................................................................................................................................................................................................................................................................................................................................................................................................................................................................................................................................................ | 25.4 |
iShares Core MSCI International Developed Markets ETF........................................................................................................................................................................................................................................................................................................................................................................................................................................................................................................................................................................................................................................................................................................................................................................................................................................................................................................................................................................................................................................ | 11.1 |
iShares Core International Aggregate Bond ETF........................................................................................................................................................................................................................................................................................................................................................................................................................................................................................................................................................................................................................................................................................................................................................................................................................................................................................................................................................................................................................................ | 8.5 |
iShares Core MSCI Emerging Markets ETF........................................................................................................................................................................................................................................................................................................................................................................................................................................................................................................................................................................................................................................................................................................................................................................................................................................................................................................................................................................................................................................ | 4.5 |
iShares Core S&P Mid-Cap ETF........................................................................................................................................................................................................................................................................................................................................................................................................................................................................................................................................................................................................................................................................................................................................................................................................................................................................................................................................................................................................................................ | 1.4 |
iShares Core S&P Small-Cap ETF........................................................................................................................................................................................................................................................................................................................................................................................................................................................................................................................................................................................................................................................................................................................................................................................................................................................................................................................................................................................................................................ | 0.6 |
| Footnote | Description |
Footnote(a) | Excludes money market funds. |
This report describes changes to the Fund that occurred during the reporting period.
What were the Fund costs for the last year?
(based on a hypothetical $10,000 investment)
Fund name | Costs of a $10,000
investment | Costs paid as a percentage of a
$10,000 investment |
|---|---|---|
iShares Core 60/40 Balanced Allocation ETF | $11Footnote Reference(a) | 0.10%Footnote Reference(a) |
| Footnote | Description |
Footnote(a) | Excludes fees and expenses incurred indirectly as a result of investments in underlying funds. |
How did the Fund perform last year?
For the reporting period ended July 31, 2025, the Fund returned 10.58%.
For the same period, the MSCI All Country World Index (Net) returned 15.87% and the Bloomberg U.S. Universal Index returned 4.00%.
What contributed to performance?
U.S. large-capitalization equities were the largest contributor to the Fund’s return during the reporting period. In particular, semiconductor stocks gained amid continued demand for artificial intelligence (“AI”) and generative AI workloads in data centers, while systems software firms benefited from strong growth in their respective cloud businesses and increasing adoption of AI technologies. International developed stocks, particularly in Germany, gained amid optimism surrounding a historic fiscal stimulus plan targeting infrastructure and defense spending.
Within the bond allocation, longer-dated U.S. dollar-denominated bonds contributed.
What detracted from performance?
During the reporting period, there were no meaningful detractors from the Fund’s return.
The views expressed reflect the opinions of BlackRock as of the date of this report and are subject to change based on changes in market, economic or other conditions. These views are not intended to be a forecast of future events and are no guarantee of future results.
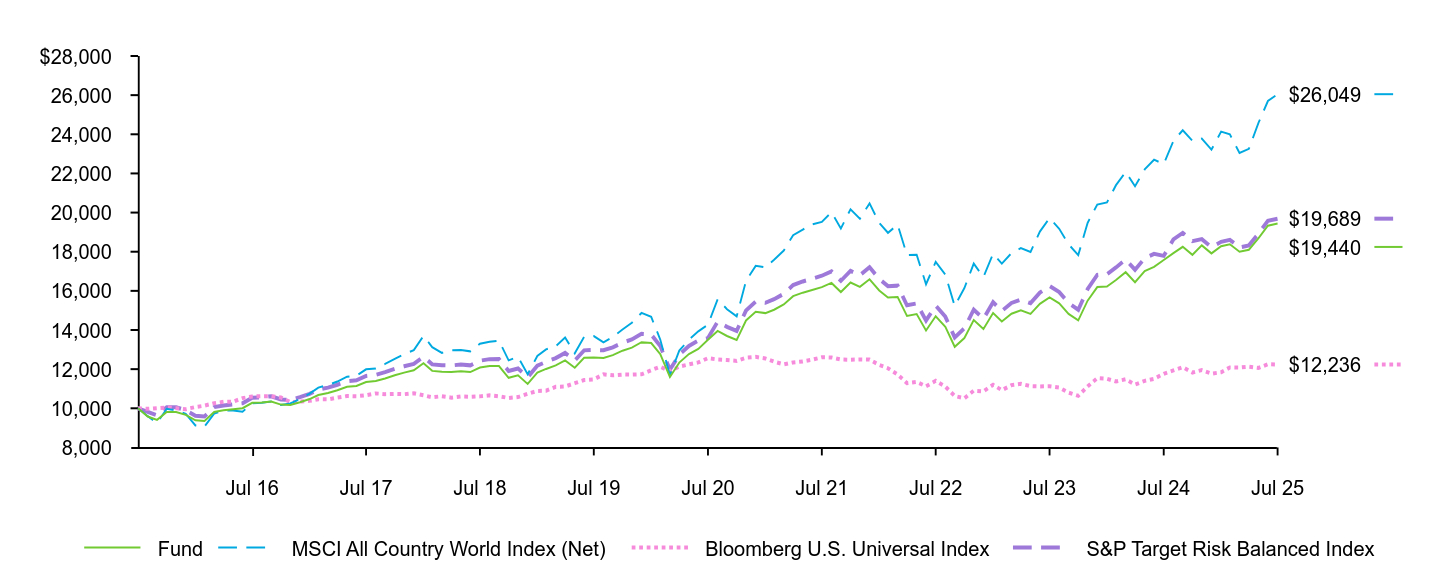
Fund | MSCI All Country World Index (Net) | Bloomberg U.S. Universal Index | S&P Target Risk Balanced Index | |
|---|---|---|---|---|
Jul 15 | $10,000 | $10,000 | $10,000 | $10,000 |
Aug 15 | $9,578 | $9,597 | $9,971 | $9,815 |
Sep 15 | $9,408 | $9,249 | $10,009 | $9,640 |
Oct 15 | $9,808 | $9,974 | $10,042 | $10,052 |
Nov 15 | $9,808 | $9,890 | $10,005 | $10,053 |
Dec 15 | $9,662 | $9,711 | $9,955 | $9,904 |
Jan 16 | $9,383 | $9,124 | $10,065 | $9,620 |
Feb 16 | $9,351 | $9,061 | $10,136 | $9,585 |
Mar 16 | $9,809 | $9,732 | $10,261 | $10,059 |
Apr 16 | $9,894 | $9,876 | $10,331 | $10,147 |
May 16 | $9,947 | $9,889 | $10,339 | $10,199 |
Jun 16 | $10,002 | $9,828 | $10,520 | $10,257 |
Jul 16 | $10,280 | $10,253 | $10,607 | $10,541 |
Aug 16 | $10,297 | $10,288 | $10,619 | $10,560 |
Sep 16 | $10,350 | $10,348 | $10,621 | $10,616 |
Oct 16 | $10,189 | $10,171 | $10,551 | $10,451 |
Nov 16 | $10,166 | $10,248 | $10,314 | $10,428 |
Dec 16 | $10,306 | $10,469 | $10,344 | $10,567 |
Jan 17 | $10,471 | $10,754 | $10,381 | $10,737 |
Feb 17 | $10,680 | $11,056 | $10,461 | $10,952 |
Mar 17 | $10,779 | $11,192 | $10,457 | $11,055 |
Apr 17 | $10,923 | $11,367 | $10,544 | $11,204 |
May 17 | $11,097 | $11,615 | $10,625 | $11,381 |
Jun 17 | $11,140 | $11,664 | $10,616 | $11,427 |
Jul 17 | $11,341 | $11,990 | $10,669 | $11,651 |
Aug 17 | $11,395 | $12,035 | $10,761 | $11,711 |
Sep 17 | $11,526 | $12,268 | $10,723 | $11,846 |
Oct 17 | $11,689 | $12,523 | $10,736 | $12,016 |
Nov 17 | $11,823 | $12,764 | $10,720 | $12,145 |
Dec 17 | $11,942 | $12,970 | $10,767 | $12,272 |
Jan 18 | $12,299 | $13,701 | $10,664 | $12,640 |
Feb 18 | $11,911 | $13,123 | $10,563 | $12,244 |
Mar 18 | $11,863 | $12,829 | $10,616 | $12,198 |
Apr 18 | $11,850 | $12,961 | $10,545 | $12,187 |
May 18 | $11,898 | $12,978 | $10,603 | $12,237 |
Jun 18 | $11,852 | $12,909 | $10,587 | $12,194 |
Jul 18 | $12,082 | $13,297 | $10,609 | $12,432 |
Aug 18 | $12,157 | $13,400 | $10,662 | $12,511 |
Sep 18 | $12,160 | $13,457 | $10,616 | $12,517 |
Oct 18 | $11,558 | $12,450 | $10,527 | $11,905 |
Nov 18 | $11,688 | $12,633 | $10,574 | $12,036 |
Dec 18 | $11,245 | $11,744 | $10,740 | $11,582 |
Jan 19 | $11,821 | $12,671 | $10,888 | $12,174 |
Feb 19 | $12,011 | $13,008 | $10,900 | $12,373 |
Mar 19 | $12,194 | $13,173 | $11,097 | $12,563 |
Apr 19 | $12,451 | $13,617 | $11,112 | $12,831 |
May 19 | $12,071 | $12,808 | $11,283 | $12,441 |
Jun 19 | $12,583 | $13,649 | $11,442 | $12,960 |
Jul 19 | $12,594 | $13,689 | $11,476 | $12,979 |
Aug 19 | $12,572 | $13,364 | $11,736 | $12,965 |
Sep 19 | $12,715 | $13,647 | $11,685 | $13,116 |
Oct 19 | $12,943 | $14,024 | $11,723 | $13,351 |
Nov 19 | $13,102 | $14,368 | $11,720 | $13,517 |
Dec 19 | $13,378 | $14,872 | $11,738 | $13,804 |
Jan 20 | $13,333 | $14,673 | $11,948 | $13,769 |
Feb 20 | $12,767 | $13,514 | $12,127 | $13,180 |
Mar 20 | $11,597 | $11,691 | $11,891 | $11,974 |
Apr 20 | $12,336 | $12,944 | $12,129 | $12,734 |
May 20 | $12,772 | $13,503 | $12,242 | $13,189 |
Jun 20 | $13,034 | $13,933 | $12,344 | $13,466 |
Jul 20 | $13,501 | $14,268 | $12,561 | $13,587 |
Aug 20 | $13,954 | $15,565 | $12,489 | $14,426 |
Sep 20 | $13,693 | $15,063 | $12,466 | $14,160 |
Oct 20 | $13,493 | $14,696 | $12,422 | $13,954 |
Nov 20 | $14,489 | $16,509 | $12,584 | $14,996 |
Dec 20 | $14,929 | $17,278 | $12,627 | $15,453 |
Jan 21 | $14,863 | $17,197 | $12,548 | $15,390 |
Feb 21 | $15,037 | $17,593 | $12,386 | $15,573 |
Mar 21 | $15,303 | $18,060 | $12,242 | $15,848 |
Apr 21 | $15,731 | $18,846 | $12,345 | $16,294 |
May 21 | $15,908 | $19,130 | $12,392 | $16,479 |
Jun 21 | $16,046 | $19,392 | $12,482 | $16,619 |
Jul 21 | $16,191 | $19,525 | $12,607 | $16,773 |
Aug 21 | $16,407 | $20,014 | $12,599 | $16,999 |
Sep 21 | $15,937 | $19,188 | $12,491 | $16,513 |
Oct 21 | $16,425 | $20,168 | $12,481 | $17,021 |
Nov 21 | $16,202 | $19,684 | $12,496 | $16,796 |
Dec 21 | $16,592 | $20,472 | $12,488 | $17,205 |
Jan 22 | $16,019 | $19,470 | $12,214 | $16,610 |
Feb 22 | $15,663 | $18,967 | $12,048 | $16,241 |
Mar 22 | $15,688 | $19,379 | $11,724 | $16,266 |
Apr 22 | $14,719 | $17,827 | $11,287 | $15,261 |
May 22 | $14,814 | $17,847 | $11,349 | $15,359 |
Jun 22 | $13,974 | $16,337 | $11,122 | $14,485 |
Jul 22 | $14,704 | $17,477 | $11,402 | $15,242 |
Aug 22 | $14,159 | $16,833 | $11,105 | $14,677 |
Sep 22 | $13,142 | $15,222 | $10,627 | $13,623 |
Oct 22 | $13,590 | $16,141 | $10,510 | $14,089 |
Nov 22 | $14,506 | $17,392 | $10,902 | $15,039 |
Dec 22 | $14,053 | $16,703 | $10,865 | $14,572 |
Jan 23 | $14,870 | $17,903 | $11,202 | $15,421 |
Feb 23 | $14,435 | $17,393 | $10,927 | $14,971 |
Mar 23 | $14,831 | $17,930 | $11,183 | $15,382 |
Apr 23 | $15,004 | $18,183 | $11,252 | $15,560 |
May 23 | $14,821 | $17,985 | $11,135 | $15,372 |
Jun 23 | $15,335 | $19,027 | $11,118 | $15,909 |
Jul 23 | $15,662 | $19,724 | $11,129 | $16,250 |
Aug 23 | $15,359 | $19,173 | $11,062 | $15,936 |
Sep 23 | $14,823 | $18,380 | $10,798 | $15,380 |
Oct 23 | $14,489 | $17,827 | $10,636 | $15,035 |
Nov 23 | $15,499 | $19,473 | $11,114 | $16,089 |
Dec 23 | $16,195 | $20,407 | $11,536 | $16,816 |
Jan 24 | $16,224 | $20,519 | $11,508 | $16,848 |
Feb 24 | $16,552 | $21,401 | $11,370 | $17,193 |
Mar 24 | $16,955 | $22,075 | $11,482 | $17,609 |
Apr 24 | $16,443 | $21,345 | $11,214 | $17,079 |
May 24 | $17,009 | $22,207 | $11,400 | $17,667 |
Jun 24 | $17,222 | $22,702 | $11,504 | $17,893 |
Jul 24 | $17,579 | $22,481 | $11,765 | $17,787 |
Aug 24 | $17,926 | $23,658 | $11,938 | $18,628 |
Sep 24 | $18,252 | $24,205 | $12,102 | $18,964 |
Oct 24 | $17,842 | $23,666 | $11,827 | $18,539 |
Nov 24 | $18,323 | $23,785 | $11,952 | $18,647 |
Dec 24 | $17,914 | $23,218 | $11,771 | $18,232 |
Jan 25 | $18,282 | $24,137 | $11,842 | $18,506 |
Feb 25 | $18,383 | $23,998 | $12,087 | $18,610 |
Mar 25 | $18,000 | $23,048 | $12,084 | $18,219 |
Apr 25 | $18,102 | $23,258 | $12,127 | $18,324 |
May 25 | $18,693 | $24,592 | $12,065 | $18,929 |
Jun 25 | $19,330 | $25,699 | $12,253 | $19,576 |
Jul 25 | $19,440 | $26,049 | $12,236 | $19,689 |
........................................................................................................................................................................................................................................................................................................................................................................................................................................................................................................................................................................................................................................................................................................................................................................................................................................................................................................................................................................................................................................ | 1 Year | 5 Years | 10 Years |
|---|---|---|---|
Fund NAV........................................................................................................................................................................................................................................................................................................................................................................................................................................................................................................................................................................................................................................................................................................................................................................................................................................................................................................................................................................................................................................ | 10.58% | 7.56% | 6.87% |
MSCI All Country World Index (Net)........................................................................................................................................................................................................................................................................................................................................................................................................................................................................................................................................................................................................................................................................................................................................................................................................................................................................................................................................................................................................................................ | 15.87 | 12.79 | 10.05 |
Bloomberg U.S. Universal Index........................................................................................................................................................................................................................................................................................................................................................................................................................................................................................................................................................................................................................................................................................................................................................................................................................................................................................................................................................................................................................................ | 4.00 | (0.52) | 2.04 |
S&P Target Risk Balanced Index........................................................................................................................................................................................................................................................................................................................................................................................................................................................................................................................................................................................................................................................................................................................................................................................................................................................................................................................................................................................................................................ | 10.69 | 7.70 | 7.01 |
Key Fund statistics
Net Assets........................................................................................................................................................................................................................................................................................................................................................................................................................................................................................................................................................................................................................................................................................................................................................................................................................................................................................................................................................................................................................................ | $2,573,687,554 |
|---|---|
Number of Portfolio Holdings........................................................................................................................................................................................................................................................................................................................................................................................................................................................................................................................................................................................................................................................................................................................................................................................................................................................................................................................................................................................................................................ | 9 |
Net Investment Advisory Fees........................................................................................................................................................................................................................................................................................................................................................................................................................................................................................................................................................................................................................................................................................................................................................................................................................................................................................................................................................................................................................................ | $2,323,358 |
Portfolio Turnover Rate........................................................................................................................................................................................................................................................................................................................................................................................................................................................................................................................................................................................................................................................................................................................................................................................................................................................................................................................................................................................................................................ | 5% |
Portfolio composition
All holdings
Asset class | Percent of Total InvestmentsFootnote Reference(a) |
|---|---|
Domestic Equity........................................................................................................................................................................................................................................................................................................................................................................................................................................................................................................................................................................................................................................................................................................................................................................................................................................................................................................................................................................................................................................ | 40.1% |
Domestic Fixed Income........................................................................................................................................................................................................................................................................................................................................................................................................................................................................................................................................................................................................................................................................................................................................................................................................................................................................................................................................................................................................................................ | 31.5 |
International Equity........................................................................................................................................................................................................................................................................................................................................................................................................................................................................................................................................................................................................................................................................................................................................................................................................................................................................................................................................................................................................................................ | 22.8 |
International Fixed Income........................................................................................................................................................................................................................................................................................................................................................................................................................................................................................................................................................................................................................................................................................................................................................................................................................................................................................................................................................................................................................................ | 5.6 |
Security | Percent of Total InvestmentsFootnote Reference(a) |
|---|---|
iShares Core S&P 500 ETF........................................................................................................................................................................................................................................................................................................................................................................................................................................................................................................................................................................................................................................................................................................................................................................................................................................................................................................................................................................................................................................ | 37.2% |
iShares Core Total USD Bond Market ETF........................................................................................................................................................................................................................................................................................................................................................................................................................................................................................................................................................................................................................................................................................................................................................................................................................................................................................................................................................................................................................................ | 31.5 |
iShares Core MSCI International Developed Markets ETF........................................................................................................................................................................................................................................................................................................................................................................................................................................................................................................................................................................................................................................................................................................................................................................................................................................................................................................................................................................................................................................ | 16.2 |
iShares Core MSCI Emerging Markets ETF........................................................................................................................................................................................................................................................................................................................................................................................................................................................................................................................................................................................................................................................................................................................................................................................................................................................................................................................................................................................................................................ | 6.6 |
iShares Core International Aggregate Bond ETF........................................................................................................................................................................................................................................................................................................................................................................................................................................................................................................................................................................................................................................................................................................................................................................................................................................................................................................................................................................................................................................ | 5.6 |
iShares Core S&P Mid-Cap ETF........................................................................................................................................................................................................................................................................................................................................................................................................................................................................................................................................................................................................................................................................................................................................................................................................................................................................................................................................................................................................................................ | 2.0 |
iShares Core S&P Small-Cap ETF........................................................................................................................................................................................................................................................................................................................................................................................................................................................................................................................................................................................................................................................................................................................................................................................................................................................................................................................................................................................................................................ | 0.9 |
| Footnote | Description |
Footnote(a) | Excludes money market funds. |
This report describes changes to the Fund that occurred during the reporting period.
What were the Fund costs for the last year?
(based on a hypothetical $10,000 investment)
Fund name | Costs of a $10,000
investment | Costs paid as a percentage of a
$10,000 investment |
|---|---|---|
iShares Core 80/20 Aggressive Allocation ETF | $12Footnote Reference(a) | 0.11%Footnote Reference(a) |
| Footnote | Description |
Footnote(a) | Excludes fees and expenses incurred indirectly as a result of investments in underlying funds. |
How did the Fund perform last year?
For the reporting period ended July 31, 2025, the Fund returned 12.74%.
For the same period, the MSCI All Country World Index (Net) returned 15.87% and the Bloomberg U.S. Universal Index returned 4.00%.
What contributed to performance?
U.S. large-capitalization equities were the largest contributor to the Fund’s return during the reporting period. In particular, semiconductor stocks gained amid continued demand for artificial intelligence (“AI”) and generative AI workloads in data centers, while systems software firms benefited from strong growth in their respective cloud businesses and increasing adoption of AI technologies. International developed stocks also contributed. German stocks were driven by strong corporate earnings and optimism surrounding a historic fiscal stimulus plan targeting infrastructure and defense, which supported firms in the industrials space. Emerging-market equities also contributed, especially Chinese stocks, which benefited from the country's historic stimulus packages; the country’s interactive media and services stocks were supported by AI powered innovation and investments.
What detracted from performance?
During the reporting period, there were no meaningful detractors from the Fund’s return.
The views expressed reflect the opinions of BlackRock as of the date of this report and are subject to change based on changes in market, economic or other conditions. These views are not intended to be a forecast of future events and are no guarantee of future results.
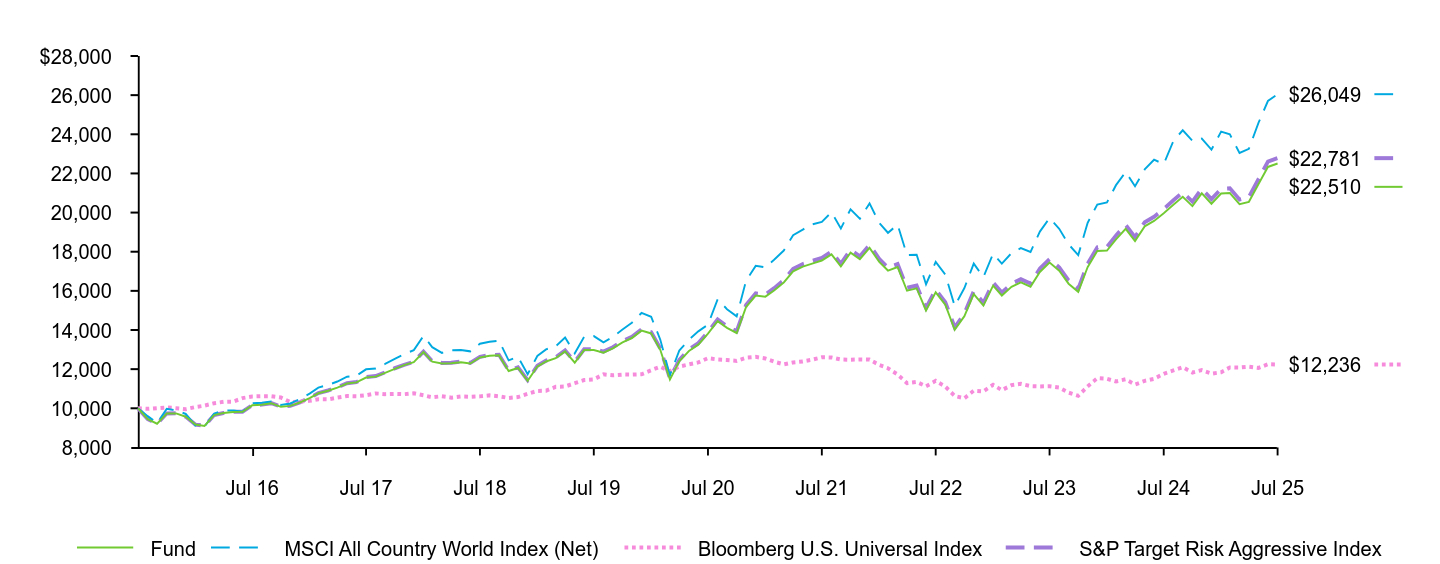
Fund | MSCI All Country World Index (Net) | Bloomberg U.S. Universal Index | S&P Target Risk Aggressive Index | |
|---|---|---|---|---|
Jul 15 | $10,000 | $10,000 | $10,000 | $10,000 |
Aug 15 | $9,449 | $9,597 | $9,971 | $9,448 |
Sep 15 | $9,212 | $9,249 | $10,009 | $9,213 |
Oct 15 | $9,735 | $9,974 | $10,042 | $9,737 |
Nov 15 | $9,740 | $9,890 | $10,005 | $9,743 |
Dec 15 | $9,567 | $9,711 | $9,955 | $9,571 |
Jan 16 | $9,168 | $9,124 | $10,065 | $9,171 |
Feb 16 | $9,098 | $9,061 | $10,136 | $9,101 |
Mar 16 | $9,654 | $9,732 | $10,261 | $9,659 |
Apr 16 | $9,754 | $9,876 | $10,331 | $9,759 |
May 16 | $9,814 | $9,889 | $10,339 | $9,821 |
Jun 16 | $9,822 | $9,828 | $10,520 | $9,828 |
Jul 16 | $10,153 | $10,253 | $10,607 | $10,162 |
Aug 16 | $10,182 | $10,288 | $10,619 | $10,189 |
Sep 16 | $10,253 | $10,348 | $10,621 | $10,262 |
Oct 16 | $10,075 | $10,171 | $10,551 | $10,084 |
Nov 16 | $10,123 | $10,248 | $10,314 | $10,131 |
Dec 16 | $10,297 | $10,469 | $10,344 | $10,304 |
Jan 17 | $10,519 | $10,754 | $10,381 | $10,530 |
Feb 17 | $10,768 | $11,056 | $10,461 | $10,779 |
Mar 17 | $10,895 | $11,192 | $10,457 | $10,909 |
Apr 17 | $11,058 | $11,367 | $10,544 | $11,073 |
May 17 | $11,264 | $11,615 | $10,625 | $11,279 |
Jun 17 | $11,323 | $11,664 | $10,616 | $11,339 |
Jul 17 | $11,574 | $11,990 | $10,669 | $11,600 |
Aug 17 | $11,618 | $12,035 | $10,761 | $11,646 |
Sep 17 | $11,808 | $12,268 | $10,723 | $11,837 |
Oct 17 | $12,013 | $12,523 | $10,736 | $12,046 |
Nov 17 | $12,205 | $12,764 | $10,720 | $12,219 |
Dec 17 | $12,360 | $12,970 | $10,767 | $12,377 |
Jan 18 | $12,879 | $13,701 | $10,664 | $12,900 |
Feb 18 | $12,385 | $13,123 | $10,563 | $12,406 |
Mar 18 | $12,291 | $12,829 | $10,616 | $12,312 |
Apr 18 | $12,305 | $12,961 | $10,545 | $12,329 |
May 18 | $12,353 | $12,978 | $10,603 | $12,381 |
Jun 18 | $12,289 | $12,909 | $10,587 | $12,317 |
Jul 18 | $12,597 | $13,297 | $10,609 | $12,629 |
Aug 18 | $12,685 | $13,400 | $10,662 | $12,714 |
Sep 18 | $12,706 | $13,457 | $10,616 | $12,736 |
Oct 18 | $11,906 | $12,450 | $10,527 | $11,935 |
Nov 18 | $12,062 | $12,633 | $10,574 | $12,095 |
Dec 18 | $11,401 | $11,744 | $10,740 | $11,431 |
Jan 19 | $12,135 | $12,671 | $10,888 | $12,173 |
Feb 19 | $12,394 | $13,008 | $10,900 | $12,432 |
Mar 19 | $12,565 | $13,173 | $11,097 | $12,608 |
Apr 19 | $12,911 | $13,617 | $11,112 | $12,956 |
May 19 | $12,329 | $12,808 | $11,283 | $12,373 |
Jun 19 | $12,977 | $13,649 | $11,442 | $13,022 |
Jul 19 | $12,973 | $13,689 | $11,476 | $13,023 |
Aug 19 | $12,840 | $13,364 | $11,736 | $12,896 |
Sep 19 | $13,058 | $13,647 | $11,685 | $13,117 |
Oct 19 | $13,365 | $14,024 | $11,723 | $13,429 |
Nov 19 | $13,590 | $14,368 | $11,720 | $13,655 |
Dec 19 | $13,968 | $14,872 | $11,738 | $14,035 |
Jan 20 | $13,823 | $14,673 | $11,948 | $13,892 |
Feb 20 | $12,992 | $13,514 | $12,127 | $13,060 |
Mar 20 | $11,469 | $11,691 | $11,891 | $11,530 |
Apr 20 | $12,404 | $12,944 | $12,129 | $12,473 |
May 20 | $12,931 | $13,503 | $12,242 | $13,004 |
Jun 20 | $13,252 | $13,933 | $12,344 | $13,327 |
Jul 20 | $13,815 | $14,268 | $12,561 | $13,896 |
Aug 20 | $14,450 | $15,565 | $12,489 | $14,537 |
Sep 20 | $14,107 | $15,063 | $12,466 | $14,194 |
Oct 20 | $13,846 | $14,696 | $12,422 | $13,934 |
Nov 20 | $15,173 | $16,509 | $12,584 | $15,275 |
Dec 20 | $15,762 | $17,278 | $12,627 | $15,872 |
Jan 21 | $15,704 | $17,197 | $12,548 | $15,816 |
Feb 21 | $16,020 | $17,593 | $12,386 | $16,136 |
Mar 21 | $16,428 | $18,060 | $12,242 | $16,549 |
Apr 21 | $16,994 | $18,846 | $12,345 | $17,121 |
May 21 | $17,241 | $19,130 | $12,392 | $17,372 |
Jun 21 | $17,393 | $19,392 | $12,482 | $17,528 |
Jul 21 | $17,547 | $19,525 | $12,607 | $17,686 |
Aug 21 | $17,863 | $20,014 | $12,599 | $18,008 |
Sep 21 | $17,245 | $19,188 | $12,491 | $17,386 |
Oct 21 | $17,952 | $20,168 | $12,481 | $18,103 |
Nov 21 | $17,618 | $19,684 | $12,496 | $17,765 |
Dec 21 | $18,195 | $20,472 | $12,488 | $18,351 |
Jan 22 | $17,478 | $19,470 | $12,214 | $17,627 |
Feb 22 | $17,035 | $18,967 | $12,048 | $17,183 |
Mar 22 | $17,219 | $19,379 | $11,724 | $17,370 |
Apr 22 | $16,011 | $17,827 | $11,287 | $16,153 |
May 22 | $16,128 | $17,847 | $11,349 | $16,271 |
Jun 22 | $14,997 | $16,337 | $11,122 | $15,131 |
Jul 22 | $15,924 | $17,477 | $11,402 | $16,066 |
Aug 22 | $15,284 | $16,833 | $11,105 | $15,421 |
Sep 22 | $14,009 | $15,222 | $10,627 | $14,136 |
Oct 22 | $14,706 | $16,141 | $10,510 | $14,840 |
Nov 22 | $15,832 | $17,392 | $10,902 | $15,979 |
Dec 22 | $15,246 | $16,703 | $10,865 | $15,390 |
Jan 23 | $16,266 | $17,903 | $11,202 | $16,421 |
Feb 23 | $15,762 | $17,393 | $10,927 | $15,913 |
Mar 23 | $16,206 | $17,930 | $11,183 | $16,363 |
Apr 23 | $16,432 | $18,183 | $11,252 | $16,592 |
May 23 | $16,214 | $17,985 | $11,135 | $16,374 |
Jun 23 | $16,969 | $19,027 | $11,118 | $17,137 |
Jul 23 | $17,449 | $19,724 | $11,129 | $17,623 |
Aug 23 | $17,031 | $19,173 | $11,062 | $17,203 |
Sep 23 | $16,367 | $18,380 | $10,798 | $16,533 |
Oct 23 | $15,950 | $17,827 | $10,636 | $16,113 |
Nov 23 | $17,207 | $19,473 | $11,114 | $17,385 |
Dec 23 | $18,033 | $20,407 | $11,536 | $18,222 |
Jan 24 | $18,057 | $20,519 | $11,508 | $18,247 |
Feb 24 | $18,629 | $21,401 | $11,370 | $18,826 |
Mar 24 | $19,171 | $22,075 | $11,482 | $19,375 |
Apr 24 | $18,543 | $21,345 | $11,214 | $18,743 |
May 24 | $19,298 | $22,207 | $11,400 | $19,507 |
Jun 24 | $19,573 | $22,702 | $11,504 | $19,785 |
Jul 24 | $19,966 | $22,481 | $11,765 | $20,185 |
Aug 24 | $20,402 | $23,658 | $11,938 | $20,627 |
Sep 24 | $20,806 | $24,205 | $12,102 | $21,038 |
Oct 24 | $20,329 | $23,666 | $11,827 | $20,557 |
Nov 24 | $20,981 | $23,785 | $11,952 | $21,217 |
Dec 24 | $20,449 | $23,218 | $11,771 | $20,681 |
Jan 25 | $20,973 | $24,137 | $11,842 | $21,213 |
Feb 25 | $20,998 | $23,998 | $12,087 | $21,242 |
Mar 25 | $20,425 | $23,048 | $12,084 | $20,664 |
Apr 25 | $20,547 | $23,258 | $12,127 | $20,789 |
May 25 | $21,463 | $24,592 | $12,065 | $21,718 |
Jun 25 | $22,332 | $25,699 | $12,253 | $22,599 |
Jul 25 | $22,510 | $26,049 | $12,236 | $22,781 |
........................................................................................................................................................................................................................................................................................................................................................................................................................................................................................................................................................................................................................................................................................................................................................................................................................................................................................................................................................................................................................................ | 1 Year | 5 Years | 10 Years |
|---|---|---|---|
Fund NAV........................................................................................................................................................................................................................................................................................................................................................................................................................................................................................................................................................................................................................................................................................................................................................................................................................................................................................................................................................................................................................................ | 12.74% | 10.26% | 8.45% |
MSCI All Country World Index (Net)........................................................................................................................................................................................................................................................................................................................................................................................................................................................................................................................................................................................................................................................................................................................................................................................................................................................................................................................................................................................................................................ | 15.87 | 12.79 | 10.05 |
Bloomberg U.S. Universal Index........................................................................................................................................................................................................................................................................................................................................................................................................................................................................................................................................................................................................................................................................................................................................................................................................................................................................................................................................................................................................................................ | 4.00 | (0.52) | 2.04 |
S&P Target Risk Aggressive Index........................................................................................................................................................................................................................................................................................................................................................................................................................................................................................................................................................................................................................................................................................................................................................................................................................................................................................................................................................................................................................................ | 12.86 | 10.39 | 8.58 |
Key Fund statistics
Net Assets........................................................................................................................................................................................................................................................................................................................................................................................................................................................................................................................................................................................................................................................................................................................................................................................................................................................................................................................................................................................................................................ | $2,430,728,622 |
|---|---|
Number of Portfolio Holdings........................................................................................................................................................................................................................................................................................................................................................................................................................................................................................................................................................................................................................................................................................................................................................................................................................................................................................................................................................................................................................................ | 9 |
Net Investment Advisory Fees........................................................................................................................................................................................................................................................................................................................................................................................................................................................................................................................................................................................................................................................................................................................................................................................................................................................................................................................................................................................................................................ | $2,300,141 |
Portfolio Turnover Rate........................................................................................................................................................................................................................................................................................................................................................................................................................................................................................................................................................................................................................................................................................................................................................................................................................................................................................................................................................................................................................................ | 5% |
Portfolio composition
All holdings
Asset class | Percent of Total InvestmentsFootnote Reference(a) |
|---|---|
Domestic Equity........................................................................................................................................................................................................................................................................................................................................................................................................................................................................................................................................................................................................................................................................................................................................................................................................................................................................................................................................................................................................................................ | 52.2% |
International Equity........................................................................................................................................................................................................................................................................................................................................................................................................................................................................................................................................................................................................................................................................................................................................................................................................................................................................................................................................................................................................................................ | 29.7 |
Domestic Fixed Income........................................................................................................................................................................................................................................................................................................................................................................................................................................................................................................................................................................................................................................................................................................................................................................................................................................................................................................................................................................................................................................ | 15.4 |
International Fixed Income........................................................................................................................................................................................................................................................................................................................................................................................................................................................................................................................................................................................................................................................................................................................................................................................................................................................................................................................................................................................................................................ | 2.7 |
Security | Percent of Total InvestmentsFootnote Reference(a) |
|---|---|
iShares Core S&P 500 ETF........................................................................................................................................................................................................................................................................................................................................................................................................................................................................................................................................................................................................................................................................................................................................................................................................................................................................................................................................................................................................................................ | 48.3% |
iShares Core MSCI International Developed Markets ETF........................................................................................................................................................................................................................................................................................................................................................................................................................................................................................................................................................................................................................................................................................................................................................................................................................................................................................................................................................................................................................................ | 21.1 |
iShares Core Total USD Bond Market ETF........................................................................................................................................................................................................................................................................................................................................................................................................................................................................................................................................................................................................................................................................................................................................................................................................................................................................................................................................................................................................................................ | 15.4 |
iShares Core MSCI Emerging Markets ETF........................................................................................................................................................................................................................................................................................................................................................................................................................................................................................................................................................................................................................................................................................................................................................................................................................................................................................................................................................................................................................................ | 8.6 |
iShares Core International Aggregate Bond ETF........................................................................................................................................................................................................................................................................................................................................................................................................................................................................................................................................................................................................................................................................................................................................................................................................................................................................................................................................................................................................................................ | 2.7 |
iShares Core S&P Mid-Cap ETF........................................................................................................................................................................................................................................................................................................................................................................................................................................................................................................................................................................................................................................................................................................................................................................................................................................................................................................................................................................................................................................ | 2.7 |
iShares Core S&P Small-Cap ETF........................................................................................................................................................................................................................................................................................................................................................................................................................................................................................................................................................................................................................................................................................................................................................................................................................................................................................................................................................................................................................................ | 1.2 |
| Footnote | Description |
Footnote(a) | Excludes money market funds. |
What were the Fund costs for the last year?
(based on a hypothetical $10,000 investment)
Fund name | Costs of a $10,000
investment | Costs paid as a percentage of a
$10,000 investment |
|---|---|---|
iShares Morningstar Multi-Asset Income ETF | $26Footnote Reference(a) | 0.25%Footnote Reference(a) |
| Footnote | Description |
Footnote(a) | Excludes fees and expenses incurred indirectly as a result of investments in underlying funds. |
How did the Fund perform last year?
For the reporting period ended July 31, 2025, the Fund returned 7.20%.
For the same period, the Bloomberg U.S. Universal Index returned 4.00% and the MSCI All Country World Index (Net) returned 15.87%.
What contributed to performance?
U.S. dollar-denominated high-yield corporate securities were the largest contributors to the Fund’s return during the reporting period, helped by healthy underlying fundamentals and the improved composition of the high yield bond market. International developed stocks also contributed, notably, value-oriented companies within the financial sector. In Germany, stocks were driven by strong corporate earnings from global-facing companies. Insurance names were supported by growth across business lines, while diversified capital markets companies benefited from strong trading volume and solid investment banking revenue.
Within the bond allocation, shorter-term, floating rate issues gained as the Federal Reserve lowered interest rates several times during the reporting period.
What detracted from performance?
During the reporting period, there were no meaningful detractors from the Fund’s return.
The views expressed reflect the opinions of BlackRock as of the date of this report and are subject to change based on changes in market, economic or other conditions. These views are not intended to be a forecast of future events and are no guarantee of future results.
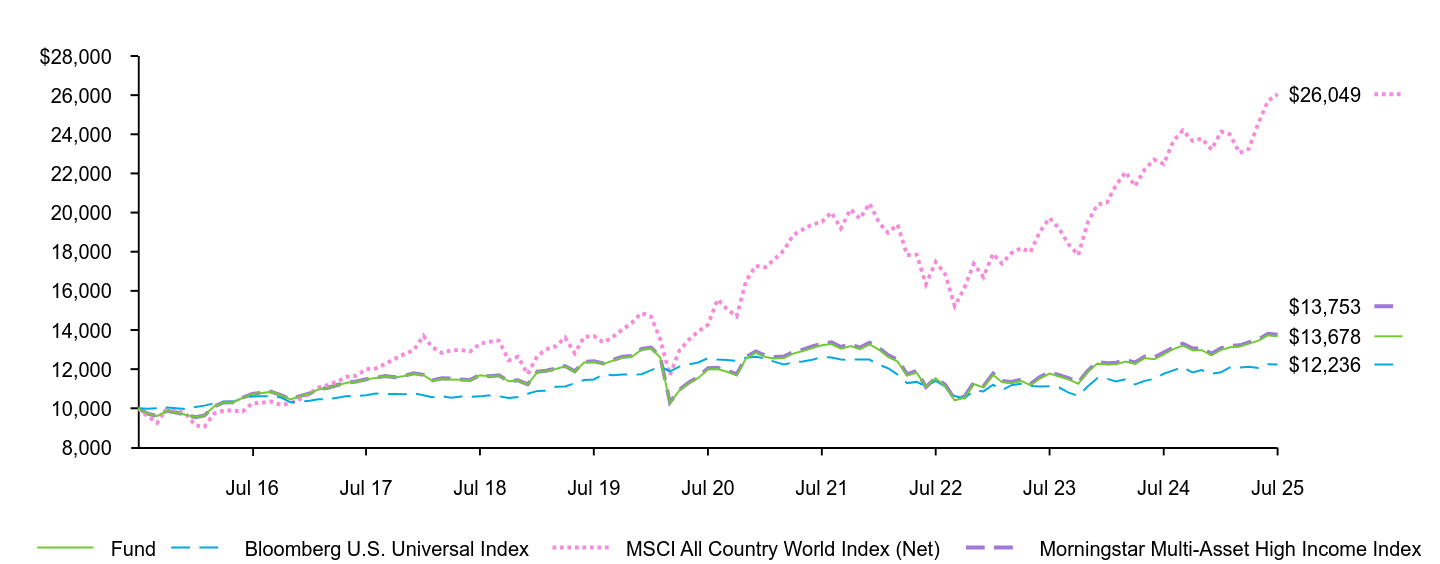
Fund | Bloomberg U.S. Universal Index | MSCI All Country World Index (Net) | Morningstar Multi-Asset High Income Index | |
|---|---|---|---|---|
Jul 15 | $10,000 | $10,000 | $10,000 | $10,000 |
Aug 15 | $9,721 | $9,971 | $9,597 | $9,724 |
Sep 15 | $9,593 | $10,009 | $9,249 | $9,591 |
Oct 15 | $9,872 | $10,042 | $9,974 | $9,872 |
Nov 15 | $9,784 | $10,005 | $9,890 | $9,784 |
Dec 15 | $9,672 | $9,955 | $9,711 | $9,672 |
Jan 16 | $9,547 | $10,065 | $9,124 | $9,546 |
Feb 16 | $9,636 | $10,136 | $9,061 | $9,635 |
Mar 16 | $10,095 | $10,261 | $9,732 | $10,097 |
Apr 16 | $10,292 | $10,331 | $9,876 | $10,296 |
May 16 | $10,298 | $10,339 | $9,889 | $10,304 |
Jun 16 | $10,533 | $10,520 | $9,828 | $10,539 |
Jul 16 | $10,726 | $10,607 | $10,253 | $10,736 |
Aug 16 | $10,787 | $10,619 | $10,288 | $10,798 |
Sep 16 | $10,838 | $10,621 | $10,348 | $10,849 |
Oct 16 | $10,664 | $10,551 | $10,171 | $10,673 |
Nov 16 | $10,456 | $10,314 | $10,248 | $10,463 |
Dec 16 | $10,619 | $10,344 | $10,469 | $10,623 |
Jan 17 | $10,751 | $10,381 | $10,754 | $10,754 |
Feb 17 | $10,963 | $10,461 | $11,056 | $10,968 |
Mar 17 | $11,046 | $10,457 | $11,192 | $11,050 |
Apr 17 | $11,183 | $10,544 | $11,367 | $11,190 |
May 17 | $11,306 | $10,625 | $11,615 | $11,315 |
Jun 17 | $11,360 | $10,616 | $11,664 | $11,367 |
Jul 17 | $11,478 | $10,669 | $11,990 | $11,482 |
Aug 17 | $11,547 | $10,761 | $12,035 | $11,557 |
Sep 17 | $11,642 | $10,723 | $12,268 | $11,650 |
Oct 17 | $11,576 | $10,736 | $12,523 | $11,582 |
Nov 17 | $11,650 | $10,720 | $12,764 | $11,659 |
Dec 17 | $11,774 | $10,767 | $12,970 | $11,786 |
Jan 18 | $11,696 | $10,664 | $13,701 | $11,711 |
Feb 18 | $11,410 | $10,563 | $13,123 | $11,421 |
Mar 18 | $11,496 | $10,616 | $12,829 | $11,538 |
Apr 18 | $11,477 | $10,545 | $12,961 | $11,519 |
May 18 | $11,455 | $10,603 | $12,978 | $11,465 |
Jun 18 | $11,438 | $10,587 | $12,909 | $11,450 |
Jul 18 | $11,691 | $10,609 | $13,297 | $11,702 |
Aug 18 | $11,634 | $10,662 | $13,400 | $11,640 |
Sep 18 | $11,678 | $10,616 | $13,457 | $11,689 |
Oct 18 | $11,379 | $10,527 | $12,450 | $11,391 |
Nov 18 | $11,419 | $10,574 | $12,633 | $11,430 |
Dec 18 | $11,214 | $10,740 | $11,744 | $11,223 |
Jan 19 | $11,860 | $10,888 | $12,671 | $11,871 |
Feb 19 | $11,910 | $10,900 | $13,008 | $11,920 |
Mar 19 | $12,009 | $11,097 | $13,173 | $12,027 |
Apr 19 | $12,141 | $11,112 | $13,617 | $12,160 |
May 19 | $11,867 | $11,283 | $12,808 | $11,889 |
Jun 19 | $12,344 | $11,442 | $13,649 | $12,367 |
Jul 19 | $12,383 | $11,476 | $13,689 | $12,404 |
Aug 19 | $12,263 | $11,736 | $13,364 | $12,287 |
Sep 19 | $12,436 | $11,685 | $13,647 | $12,468 |
Oct 19 | $12,600 | $11,723 | $14,024 | $12,632 |
Nov 19 | $12,634 | $11,720 | $14,368 | $12,667 |
Dec 19 | $12,995 | $11,738 | $14,872 | $13,029 |
Jan 20 | $13,071 | $11,948 | $14,673 | $13,106 |
Feb 20 | $12,597 | $12,127 | $13,514 | $12,632 |
Mar 20 | $10,265 | $11,891 | $11,691 | $10,301 |
Apr 20 | $10,915 | $12,129 | $12,944 | $10,948 |
May 20 | $11,292 | $12,242 | $13,503 | $11,322 |
Jun 20 | $11,553 | $12,344 | $13,933 | $11,604 |
Jul 20 | $12,000 | $12,561 | $14,268 | $12,051 |
Aug 20 | $12,011 | $12,489 | $15,565 | $12,065 |
Sep 20 | $11,867 | $12,466 | $15,063 | $11,928 |
Oct 20 | $11,682 | $12,422 | $14,696 | $11,743 |
Nov 20 | $12,549 | $12,584 | $16,509 | $12,618 |
Dec 20 | $12,832 | $12,627 | $17,278 | $12,909 |
Jan 21 | $12,623 | $12,548 | $17,197 | $12,702 |
Feb 21 | $12,545 | $12,386 | $17,593 | $12,620 |
Mar 21 | $12,566 | $12,242 | $18,060 | $12,640 |
Apr 21 | $12,793 | $12,345 | $18,846 | $12,867 |
May 21 | $12,923 | $12,392 | $19,130 | $12,998 |
Jun 21 | $13,078 | $12,482 | $19,392 | $13,156 |
Jul 21 | $13,218 | $12,607 | $19,525 | $13,297 |
Aug 21 | $13,284 | $12,599 | $20,014 | $13,369 |
Sep 21 | $13,050 | $12,491 | $19,188 | $13,132 |
Oct 21 | $13,180 | $12,481 | $20,168 | $13,266 |
Nov 21 | $13,020 | $12,496 | $19,684 | $13,102 |
Dec 21 | $13,264 | $12,488 | $20,472 | $13,351 |
Jan 22 | $12,982 | $12,214 | $19,470 | $13,071 |
Feb 22 | $12,626 | $12,048 | $18,967 | $12,713 |
Mar 22 | $12,383 | $11,724 | $19,379 | $12,491 |
Apr 22 | $11,670 | $11,287 | $17,827 | $11,747 |
May 22 | $11,825 | $11,349 | $17,847 | $11,901 |
Jun 22 | $11,093 | $11,122 | $16,337 | $11,085 |
Jul 22 | $11,533 | $11,402 | $17,477 | $11,550 |
Aug 22 | $11,121 | $11,105 | $16,833 | $11,188 |
Sep 22 | $10,410 | $10,627 | $15,222 | $10,470 |
Oct 22 | $10,539 | $10,510 | $16,141 | $10,599 |
Nov 22 | $11,241 | $10,902 | $17,392 | $11,302 |
Dec 22 | $11,069 | $10,865 | $16,703 | $11,128 |
Jan 23 | $11,712 | $11,202 | $17,903 | $11,776 |
Feb 23 | $11,337 | $10,927 | $17,393 | $11,397 |
Mar 23 | $11,288 | $11,183 | $17,930 | $11,346 |
Apr 23 | $11,399 | $11,252 | $18,183 | $11,458 |
May 23 | $11,187 | $11,135 | $17,985 | $11,244 |
Jun 23 | $11,534 | $11,118 | $19,027 | $11,595 |
Jul 23 | $11,779 | $11,129 | $19,724 | $11,842 |
Aug 23 | $11,622 | $11,062 | $19,173 | $11,692 |
Sep 23 | $11,477 | $10,798 | $18,380 | $11,544 |
Oct 23 | $11,257 | $10,636 | $17,827 | $11,319 |
Nov 23 | $11,848 | $11,114 | $19,473 | $11,913 |
Dec 23 | $12,292 | $11,536 | $20,407 | $12,362 |
Jan 24 | $12,232 | $11,508 | $20,519 | $12,304 |
Feb 24 | $12,256 | $11,370 | $21,401 | $12,330 |
Mar 24 | $12,387 | $11,482 | $22,075 | $12,463 |
Apr 24 | $12,262 | $11,214 | $21,345 | $12,339 |
May 24 | $12,563 | $11,400 | $22,207 | $12,644 |
Jun 24 | $12,503 | $11,504 | $22,702 | $12,589 |
Jul 24 | $12,759 | $11,765 | $22,481 | $12,849 |
Aug 24 | $13,023 | $11,938 | $23,658 | $13,107 |
Sep 24 | $13,208 | $12,102 | $24,205 | $13,296 |
Oct 24 | $12,970 | $11,827 | $23,666 | $13,059 |
Nov 24 | $12,967 | $11,952 | $23,785 | $13,057 |
Dec 24 | $12,705 | $11,771 | $23,218 | $12,792 |
Jan 25 | $12,983 | $11,842 | $24,137 | $13,073 |
Feb 25 | $13,115 | $12,087 | $23,998 | $13,178 |
Mar 25 | $13,153 | $12,084 | $23,048 | $13,217 |
Apr 25 | $13,306 | $12,127 | $23,258 | $13,372 |
May 25 | $13,454 | $12,065 | $24,592 | $13,523 |
Jun 25 | $13,737 | $12,253 | $25,699 | $13,811 |
Jul 25 | $13,678 | $12,236 | $26,049 | $13,753 |
........................................................................................................................................................................................................................................................................................................................................................................................................................................................................................................................................................................................................................................................................................................................................................................................................................................................................................................................................................................................................................................ | 1 Year | 5 Years | 10 Years |
|---|---|---|---|
Fund NAV........................................................................................................................................................................................................................................................................................................................................................................................................................................................................................................................................................................................................................................................................................................................................................................................................................................................................................................................................................................................................................................ | 7.20% | 2.65% | 3.18% |
Bloomberg U.S. Universal Index........................................................................................................................................................................................................................................................................................................................................................................................................................................................................................................................................................................................................................................................................................................................................................................................................................................................................................................................................................................................................................................ | 4.00 | (0.52) | 2.04 |
MSCI All Country World Index (Net)........................................................................................................................................................................................................................................................................................................................................................................................................................................................................................................................................................................................................................................................................................................................................................................................................................................................................................................................................................................................................................................ | 15.87 | 12.79 | 10.05 |
Morningstar Multi-Asset High Income Index........................................................................................................................................................................................................................................................................................................................................................................................................................................................................................................................................................................................................................................................................................................................................................................................................................................................................................................................................................................................................................................ | 7.04 | 2.68 | 3.24 |
Key Fund statistics
Net Assets........................................................................................................................................................................................................................................................................................................................................................................................................................................................................................................................................................................................................................................................................................................................................................................................................................................................................................................................................................................................................................................ | $113,880,423 |
|---|---|
Number of Portfolio Holdings........................................................................................................................................................................................................................................................................................................................................................................................................................................................................................................................................................................................................................................................................................................................................................................................................................................................................................................................................................................................................................................ | 12 |
Net Investment Advisory Fees........................................................................................................................................................................................................................................................................................................................................................................................................................................................................................................................................................................................................................................................................................................................................................................................................................................................................................................................................................................................................................................ | $289,013 |
Portfolio Turnover Rate........................................................................................................................................................................................................................................................................................................................................................................................................................................................................................................................................................................................................................................................................................................................................................................................................................................................................................................................................................................................................................................ | 35% |
Portfolio composition
All holdings
Asset class | Percent of Total InvestmentsFootnote Reference(a) |
|---|---|
Domestic Fixed Income........................................................................................................................................................................................................................................................................................................................................................................................................................................................................................................................................................................................................................................................................................................................................................................................................................................................................................................................................................................................................................................ | 35.1% |
International Fixed Income........................................................................................................................................................................................................................................................................................................................................................................................................................................................................................................................................................................................................................................................................................................................................................................................................................................................................................................................................................................................................................................ | 25.0 |
International Equity........................................................................................................................................................................................................................................................................................................................................................................................................................................................................................................................................................................................................................................................................................................................................................................................................................................................................................................................................................................................................................................ | 24.5 |
Domestic Equity........................................................................................................................................................................................................................................................................................................................................................................................................................................................................................................................................................................................................................................................................................................................................................................................................................................................................................................................................................................................................................................ | 15.4 |
Security | Percent of Total InvestmentsFootnote Reference(a) |
|---|---|
iShares Preferred and Income Securities ETF........................................................................................................................................................................................................................................................................................................................................................................................................................................................................................................................................................................................................................................................................................................................................................................................................................................................................................................................................................................................................................................ | 15.4% |
iShares Broad USD High Yield Corporate Bond ETF........................................................................................................................................................................................................................................................................................................................................................................................................................................................................................................................................................................................................................................................................................................................................................................................................................................................................................................................................................................................................................................ | 15.1 |
iShares Core 1-5 Year USD Bond ETF........................................................................................................................................................................................................................................................................................................................................................................................................................................................................................................................................................................................................................................................................................................................................................................................................................................................................................................................................................................................................................................ | 15.0 |
iShares Floating Rate Bond ETF........................................................................................................................................................................................................................................................................................................................................................................................................................................................................................................................................................................................................................................................................................................................................................................................................................................................................................................................................................................................................................................ | 14.9 |
iShares Latin America 40 ETF........................................................................................................................................................................................................................................................................................................................................................................................................................................................................................................................................................................................................................................................................................................................................................................................................................................................................................................................................................................................................................................ | 14.5 |
iShares J.P. Morgan EM Local Currency Bond ETF........................................................................................................................................................................................................................................................................................................................................................................................................................................................................................................................................................................................................................................................................................................................................................................................................................................................................................................................................................................................................................................ | 5.1 |
iShares J.P. Morgan EM Corporate Bond ETF........................................................................................................................................................................................................................................................................................................................................................................................................................................................................................................................................................................................................................................................................................................................................................................................................................................................................................................................................................................................................................................ | 5.0 |
iShares MBS ETF........................................................................................................................................................................................................................................................................................................................................................................................................................................................................................................................................................................................................................................................................................................................................................................................................................................................................................................................................................................................................................................ | 5.0 |
iShares Global REIT ETF........................................................................................................................................................................................................................................................................................................................................................................................................................................................................................................................................................................................................................................................................................................................................................................................................................................................................................................................................................................................................................................ | 5.0 |
iShares MSCI EAFE Value ETF........................................................................................................................................................................................................................................................................................................................................................................................................................................................................................................................................................................................................................................................................................................................................................................................................................................................................................................................................................................................................................................ | 5.0 |
| Footnote | Description |
Footnote(a) | Excludes money market funds. |
This report describes changes to the Fund that occurred during the reporting period.
What were the Fund costs for the last year?
(based on a hypothetical $10,000 investment)
Fund name | Costs of a $10,000
investment | Costs paid as a percentage of a
$10,000 investment |
|---|---|---|
iShares ESG Optimized MSCI USA Min Vol Factor ETF | $19 | 0.18% |
How did the Fund perform last year?
For the reporting period ended July 31, 2025, the Fund returned 6.16%.
For the same period, the MSCI USA Index returned 16.96% and the MSCI USA Minimum Volatility Extended ESG Reduced Carbon Target Index returned 6.34%.
What contributed to performance?
Stocks in the information technology sector were the leading contributors to the Fund’s return during the reporting period. Systems software firms benefited from strong growth in their respective cloud businesses and increasing adoption of artificial intelligence (“AI”) technologies. Application software companies, spanning chip designers and industrial and financial software innovators, contributed as they accelerated their AI-driven monetization through AI-native tools and platform enhancements. In the technology hardware space, communications equipment stocks gained as they leveraged artificial intelligence to automate network management, enhance product capabilities, and deliver more efficient and intelligent solutions to enterprise and consumer markets. In the industrials sector, firms in the aerospace and defense segment experienced positive momentum due to increased defense spending, while building products companies benefited from strong demand for cooling systems in data centers.
What detracted from performance?
Healthcare stocks detracted from the Fund’s return during the reporting period, as the sector was increasingly pressured by regulatory scrutiny and policy upheaval. Managed healthcare firms faced additional challenges due to rising utilization and medical costs, as well as changes in reimbursement levels.
The views expressed reflect the opinions of BlackRock as of the date of this report and are subject to change based on changes in market, economic or other conditions. These views are not intended to be a forecast of future events and are no guarantee of future results.
Fund | MSCI USA Index | MSCI USA Minimum Volatility Extended ESG Reduced Carbon Target Index | |
|---|---|---|---|
Oct 21 | $10,000 | $10,000 | $10,000 |
Nov 21 | $9,781 | $10,405 | $10,509 |
Dec 21 | $10,399 | $10,816 | $11,181 |
Jan 22 | $9,693 | $10,206 | $10,420 |
Feb 22 | $9,354 | $9,907 | $10,059 |
Mar 22 | $9,772 | $10,254 | $10,512 |
Apr 22 | $9,217 | $9,326 | $9,914 |
May 22 | $9,203 | $9,305 | $9,900 |
Jun 22 | $8,796 | $8,534 | $9,462 |
Jul 22 | $9,317 | $9,330 | $10,023 |
Aug 22 | $9,023 | $8,964 | $9,705 |
Sep 22 | $8,330 | $8,131 | $8,958 |
Oct 22 | $9,024 | $8,777 | $9,709 |
Nov 22 | $9,581 | $9,255 | $10,310 |
Dec 22 | $9,226 | $8,711 | $9,928 |
Jan 23 | $9,463 | $8,801 | $10,186 |
Feb 23 | $9,112 | $9,063 | $9,807 |
Mar 23 | $9,430 | $9,384 | $10,150 |
Apr 23 | $9,565 | $9,503 | $10,300 |
May 23 | $9,236 | $9,565 | $9,946 |
Jun 23 | $9,736 | $10,203 | $10,488 |
Jul 23 | $9,901 | $10,556 | $10,669 |
Aug 23 | $9,796 | $10,376 | $10,555 |
Sep 23 | $9,408 | $9,889 | $10,137 |
Oct 23 | $9,288 | $9,661 | $10,010 |
Nov 23 | $10,015 | $10,572 | $10,725 |
Dec 23 | $10,343 | $11,069 | $11,077 |
Jan 24 | $10,480 | $11,250 | $11,235 |
Feb 24 | $10,724 | $11,215 | $11,491 |
Mar 24 | $11,051 | $11,570 | $11,843 |
Apr 24 | $10,619 | $11,721 | $11,379 |
May 24 | $10,854 | $12,282 | $11,638 |
Jun 24 | $11,015 | $12,725 | $11,814 |
Jul 24 | $11,426 | $12,186 | $11,406 |
Aug 24 | $11,896 | $12,485 | $12,769 |
Sep 24 | $12,036 | $12,751 | $12,922 |
Oct 24 | $11,824 | $13,380 | $12,695 |
Nov 24 | $12,508 | $14,219 | $12,721 |
Dec 24 | $11,709 | $13,855 | $11,908 |
Jan 25 | $12,053 | $13,503 | $12,040 |
Feb 25 | $12,272 | $13,292 | $12,258 |
Mar 25 | $12,091 | $12,515 | $12,079 |
Apr 25 | $11,927 | $12,451 | $11,918 |
May 25 | $12,119 | $13,254 | $12,112 |
Jun 25 | $12,263 | $13,934 | $12,259 |
Jul 25 | $12,130 | $14,253 | $12,128 |
........................................................................................................................................................................................................................................................................................................................................................................................................................................................................................................................................................................................................................................................................................................................................................................................................................................................................................................................................................................................................................................ | 1 Year | Since Fund
Inception |
|---|---|---|
Fund NAV........................................................................................................................................................................................................................................................................................................................................................................................................................................................................................................................................................................................................................................................................................................................................................................................................................................................................................................................................................................................................................................ | 6.16% | 5.30% |
MSCI USA Index........................................................................................................................................................................................................................................................................................................................................................................................................................................................................................................................................................................................................................................................................................................................................................................................................................................................................................................................................................................................................................................ | 16.96 | 9.93 |
MSCI USA Minimum Volatility Extended ESG Reduced Carbon Target Index........................................................................................................................................................................................................................................................................................................................................................................................................................................................................................................................................................................................................................................................................................................................................................................................................................................................................................................................................................................................................................................ | 6.34 | 5.29 |
Key Fund statistics
Net Assets........................................................................................................................................................................................................................................................................................................................................................................................................................................................................................................................................................................................................................................................................................................................................................................................................................................................................................................................................................................................................................................ | $8,588,389 |
|---|---|
Number of Portfolio Holdings........................................................................................................................................................................................................................................................................................................................................................................................................................................................................................................................................................................................................................................................................................................................................................................................................................................................................................................................................................................................................................................ | 155 |
Net Investment Advisory Fees........................................................................................................................................................................................................................................................................................................................................................................................................................................................................................................................................................................................................................................................................................................................................................................................................................................................................................................................................................................................................................................ | $18,113 |
Portfolio Turnover Rate........................................................................................................................................................................................................................................................................................................................................................................................................................................................................................................................................................................................................................................................................................................................................................................................................................................................................................................................................................................................................................................ | 24% |
Sector allocation
Ten largest holdings
Sector | Percent of Total InvestmentsFootnote Reference(a) |
|---|---|
Information Technology........................................................................................................................................................................................................................................................................................................................................................................................................................................................................................................................................................................................................................................................................................................................................................................................................................................................................................................................................................................................................................................ | 26.6% |
Health Care........................................................................................................................................................................................................................................................................................................................................................................................................................................................................................................................................................................................................................................................................................................................................................................................................................................................................................................................................................................................................................................ | 14.2 |
Financials........................................................................................................................................................................................................................................................................................................................................................................................................................................................................................................................................................................................................................................................................................................................................................................................................................................................................................................................................................................................................................................ | 12.1 |
Industrials........................................................................................................................................................................................................................................................................................................................................................................................................................................................................................................................................................................................................................................................................................................................................................................................................................................................................................................................................................................................................................................ | 11.1 |
Consumer Staples........................................................................................................................................................................................................................................................................................................................................................................................................................................................................................................................................................................................................................................................................................................................................................................................................................................................................................................................................................................................................................................ | 10.4 |
Consumer Discretionary........................................................................................................................................................................................................................................................................................................................................................................................................................................................................................................................................................................................................................................................................................................................................................................................................................................................................................................................................................................................................................................ | 6.1 |
Utilities........................................................................................................................................................................................................................................................................................................................................................................................................................................................................................................................................................................................................................................................................................................................................................................................................................................................................................................................................................................................................................................ | 5.7 |
Communication Services........................................................................................................................................................................................................................................................................................................................................................................................................................................................................................................................................................................................................................................................................................................................................................................................................................................................................................................................................................................................................................................ | 4.9 |
Energy........................................................................................................................................................................................................................................................................................................................................................................................................................................................................................................................................................................................................................................................................................................................................................................................................................................................................................................................................................................................................................................ | 3.8 |
Real Estate........................................................................................................................................................................................................................................................................................................................................................................................................................................................................................................................................................................................................................................................................................................................................................................................................................................................................................................................................................................................................................................ | 2.6 |
Materials........................................................................................................................................................................................................................................................................................................................................................................................................................................................................................................................................................................................................................................................................................................................................................................................................................................................................................................................................................................................................................................ | 2.5 |
Security | Percent of Total InvestmentsFootnote Reference(a) |
|---|---|
Microsoft Corp......................................................................................................................................................................................................................................................................................................................................................................................................................................................................................................................................................................................................................................................................................................................................................................................................................................................................................................................................................................................................................................... | 1.8% |
Chevron Corp......................................................................................................................................................................................................................................................................................................................................................................................................................................................................................................................................................................................................................................................................................................................................................................................................................................................................................................................................................................................................................................... | 1.7 |
NVIDIA Corp......................................................................................................................................................................................................................................................................................................................................................................................................................................................................................................................................................................................................................................................................................................................................................................................................................................................................................................................................................................................................................................... | 1.7 |
Cisco Systems, Inc......................................................................................................................................................................................................................................................................................................................................................................................................................................................................................................................................................................................................................................................................................................................................................................................................................................................................................................................................................................................................................................... | 1.6 |
Public Service Enterprise Group, Inc......................................................................................................................................................................................................................................................................................................................................................................................................................................................................................................................................................................................................................................................................................................................................................................................................................................................................................................................................................................................................................................... | 1.6 |
Motorola Solutions, Inc......................................................................................................................................................................................................................................................................................................................................................................................................................................................................................................................................................................................................................................................................................................................................................................................................................................................................................................................................................................................................................................... | 1.6 |
T-Mobile U.S., Inc......................................................................................................................................................................................................................................................................................................................................................................................................................................................................................................................................................................................................................................................................................................................................................................................................................................................................................................................................................................................................................................... | 1.5 |
Cencora, Inc......................................................................................................................................................................................................................................................................................................................................................................................................................................................................................................................................................................................................................................................................................................................................................................................................................................................................................................................................................................................................................................... | 1.5 |
Mastercard, Inc., Class A........................................................................................................................................................................................................................................................................................................................................................................................................................................................................................................................................................................................................................................................................................................................................................................................................................................................................................................................................................................................................................................ | 1.5 |
Northrop Grumman Corp......................................................................................................................................................................................................................................................................................................................................................................................................................................................................................................................................................................................................................................................................................................................................................................................................................................................................................................................................................................................................................................... | 1.5 |
| Footnote | Description |
Footnote(a) | Excludes money market funds. |
What were the Fund costs for the last year?
(based on a hypothetical $10,000 investment)
Fund name | Costs of a $10,000
investment | Costs paid as a percentage of a
$10,000 investment |
|---|---|---|
iShares MSCI USA Min Vol Factor ETF | $16 | 0.15% |
How did the Fund perform last year?
For the reporting period ended July 31, 2025, the Fund returned 8.16%.
For the same period, the MSCI USA Index returned 16.96% and the MSCI USA Minimum Volatility Index returned 8.31%.
What contributed to performance?
During the reporting period, stocks in the information technology sector, especially in the technology hardware space, were the leading contributors to the Fund’s return. These companies leveraged artificial intelligence (“AI”) to automate network management, enhance product capabilities, and deliver more efficient and intelligent solutions to enterprise and consumer markets. Meanwhile, systems software firms benefited from strong growth in their respective cloud businesses and increasing adoption of AI technologies. Stocks in the financials sector were also notable contributors. Firms in the financial exchanges and data segment were supported by new product launches, as well as an increase in trading volume and volatility, while transaction and payment processing services companies gained amid a surge in cross-border transactions and the growing adoption of digital payments. Further, property and casualty insurance names benefited from premium growth and improved underwriting results.
What detracted from performance?
The largest detractors from the Fund’s return during the reporting period were in the healthcare sector, as it faced increasing pressure from regulatory scrutiny and policy upheaval. Managed healthcare firms were subject to additional challenges due to rising utilization and medical costs, as well as changes in reimbursement levels.
The views expressed reflect the opinions of BlackRock as of the date of this report and are subject to change based on changes in market, economic or other conditions. These views are not intended to be a forecast of future events and are no guarantee of future results.
Fund | MSCI USA Index | MSCI USA Minimum Volatility Index | |
|---|---|---|---|
Jul 15 | $10,000 | $10,000 | $10,000 |
Aug 15 | $9,551 | $9,393 | $9,549 |
Sep 15 | $9,497 | $9,145 | $9,495 |
Oct 15 | $10,063 | $9,899 | $10,066 |
Nov 15 | $10,041 | $9,934 | $10,043 |
Dec 15 | $10,092 | $9,767 | $10,094 |
Jan 16 | $9,950 | $9,248 | $9,954 |
Feb 16 | $10,056 | $9,228 | $10,062 |
Mar 16 | $10,660 | $9,860 | $10,667 |
Apr 16 | $10,611 | $9,909 | $10,619 |
May 16 | $10,778 | $10,090 | $10,790 |
Jun 16 | $11,270 | $10,116 | $11,284 |
Jul 16 | $11,435 | $10,500 | $11,451 |
Aug 16 | $11,211 | $10,516 | $11,227 |
Sep 16 | $11,136 | $10,527 | $11,154 |
Oct 16 | $10,825 | $10,328 | $10,841 |
Nov 16 | $10,894 | $10,701 | $10,910 |
Dec 16 | $11,151 | $10,901 | $11,171 |
Jan 17 | $11,297 | $11,126 | $11,319 |
Feb 17 | $11,808 | $11,564 | $11,834 |
Mar 17 | $11,820 | $11,580 | $11,848 |
Apr 17 | $11,991 | $11,705 | $12,020 |
May 17 | $12,236 | $11,865 | $12,269 |
Jun 17 | $12,186 | $11,939 | $12,221 |
Jul 17 | $12,430 | $12,183 | $12,467 |
Aug 17 | $12,532 | $12,222 | $12,571 |
Sep 17 | $12,597 | $12,472 | $12,638 |
Oct 17 | $12,840 | $12,757 | $12,882 |
Nov 17 | $13,240 | $13,146 | $13,286 |
Dec 17 | $13,267 | $13,288 | $13,313 |
Jan 18 | $13,730 | $14,051 | $13,781 |
Feb 18 | $13,151 | $13,535 | $13,201 |
Mar 18 | $13,118 | $13,205 | $13,171 |
Apr 18 | $13,125 | $13,258 | $13,180 |
May 18 | $13,269 | $13,581 | $13,325 |
Jun 18 | $13,492 | $13,674 | $13,549 |
Jul 18 | $13,941 | $14,164 | $14,005 |
Aug 18 | $14,370 | $14,633 | $14,436 |
Sep 18 | $14,547 | $14,700 | $14,617 |
Oct 18 | $13,960 | $13,680 | $14,029 |
Nov 18 | $14,478 | $13,946 | $14,553 |
Dec 18 | $13,447 | $12,690 | $13,520 |
Jan 19 | $14,222 | $13,734 | $14,299 |
Feb 19 | $14,758 | $14,193 | $14,840 |
Mar 19 | $15,154 | $14,456 | $15,237 |
Apr 19 | $15,484 | $15,035 | $15,573 |
May 19 | $15,231 | $14,085 | $15,323 |
Jun 19 | $15,996 | $15,074 | $16,096 |
Jul 19 | $16,257 | $15,307 | $16,360 |
Aug 19 | $16,527 | $15,041 | $16,633 |
Sep 19 | $16,674 | $15,308 | $16,784 |
Oct 19 | $16,645 | $15,642 | $16,756 |
Nov 19 | $16,864 | $16,230 | $16,978 |
Dec 19 | $17,181 | $16,705 | $17,300 |
Jan 20 | $17,579 | $16,738 | $17,703 |
Feb 20 | $16,152 | $15,373 | $16,268 |
Mar 20 | $14,225 | $13,423 | $14,333 |
Apr 20 | $15,547 | $15,189 | $15,666 |
May 20 | $16,224 | $15,979 | $16,350 |
Jun 20 | $16,054 | $16,344 | $16,177 |
Jul 20 | $16,774 | $17,314 | $16,906 |
Aug 20 | $17,256 | $18,614 | $17,391 |
Sep 20 | $16,973 | $17,919 | $17,110 |
Oct 20 | $16,388 | $17,453 | $16,522 |
Nov 20 | $17,731 | $19,472 | $17,879 |
Dec 20 | $18,144 | $20,276 | $18,296 |
Jan 21 | $17,657 | $20,087 | $17,806 |
Feb 21 | $17,588 | $20,612 | $17,739 |
Mar 21 | $18,557 | $21,388 | $18,719 |
Apr 21 | $19,308 | $22,552 | $19,478 |
May 21 | $19,464 | $22,660 | $19,640 |
Jun 21 | $19,814 | $23,291 | $19,999 |
Jul 21 | $20,503 | $23,842 | $20,697 |
Aug 21 | $20,898 | $24,545 | $21,101 |
Sep 21 | $19,859 | $23,386 | $20,052 |
Oct 21 | $20,942 | $25,017 | $21,149 |
Nov 21 | $20,526 | $24,766 | $20,731 |
Dec 21 | $21,917 | $25,744 | $22,139 |
Jan 22 | $20,621 | $24,287 | $20,834 |
Feb 22 | $19,990 | $23,575 | $20,198 |
Mar 22 | $21,085 | $24,404 | $21,307 |
Apr 22 | $19,973 | $22,192 | $20,187 |
May 22 | $19,968 | $22,143 | $20,184 |
Jun 22 | $19,146 | $20,310 | $19,358 |
Jul 22 | $20,123 | $22,205 | $20,346 |
Aug 22 | $19,505 | $21,335 | $19,725 |
Sep 22 | $18,104 | $19,356 | $18,311 |
Oct 22 | $19,516 | $20,893 | $19,742 |
Nov 22 | $20,641 | $22,029 | $20,884 |
Dec 22 | $19,868 | $20,734 | $20,105 |
Jan 23 | $20,160 | $22,098 | $20,402 |
Feb 23 | $19,466 | $21,571 | $19,701 |
Mar 23 | $20,120 | $22,337 | $20,366 |
Apr 23 | $20,420 | $22,620 | $20,672 |
May 23 | $19,757 | $22,768 | $20,001 |
Jun 23 | $20,645 | $24,286 | $20,905 |
Jul 23 | $20,923 | $25,122 | $21,189 |
Aug 23 | $20,805 | $24,698 | $21,072 |
Sep 23 | $20,215 | $23,540 | $20,478 |
Oct 23 | $20,037 | $22,998 | $20,303 |
Nov 23 | $21,320 | $25,167 | $21,491 |
Dec 23 | $21,896 | $26,353 | $22,073 |
Jan 24 | $22,387 | $26,763 | $22,571 |
Feb 24 | $22,854 | $28,199 | $23,043 |
Mar 24 | $23,572 | $29,096 | $23,771 |
Apr 24 | $22,698 | $27,895 | $22,893 |
May 24 | $23,332 | $29,228 | $23,535 |
Jun 24 | $23,749 | $30,273 | $23,958 |
Jul 24 | $24,633 | $30,653 | $24,853 |
Aug 24 | $25,847 | $31,392 | $26,082 |
Sep 24 | $25,957 | $32,068 | $26,196 |
Oct 24 | $25,579 | $31,831 | $25,817 |
Nov 24 | $26,864 | $33,823 | $27,117 |
Dec 24 | $25,362 | $32,962 | $25,603 |
Jan 25 | $26,271 | $33,966 | $26,524 |
Feb 25 | $27,002 | $33,431 | $27,267 |
Mar 25 | $26,834 | $31,475 | $27,104 |
Apr 25 | $26,514 | $31,314 | $26,783 |
May 25 | $26,809 | $33,335 | $27,083 |
Jun 25 | $26,996 | $35,050 | $27,273 |
Jul 25 | $26,643 | $35,852 | $26,918 |
........................................................................................................................................................................................................................................................................................................................................................................................................................................................................................................................................................................................................................................................................................................................................................................................................................................................................................................................................................................................................................................ | 1 Year | 5 Years | 10 Years |
|---|---|---|---|
Fund NAV........................................................................................................................................................................................................................................................................................................................................................................................................................................................................................................................................................................................................................................................................................................................................................................................................................................................................................................................................................................................................................................ | 8.16% | 9.70% | 10.30% |
MSCI USA Index........................................................................................................................................................................................................................................................................................................................................................................................................................................................................................................................................................................................................................................................................................................................................................................................................................................................................................................................................................................................................................................ | 16.96 | 15.67 | 13.62 |
MSCI USA Minimum Volatility Index........................................................................................................................................................................................................................................................................................................................................................................................................................................................................................................................................................................................................................................................................................................................................................................................................................................................................................................................................................................................................................................ | 8.31 | 9.75 | 10.41 |
Key Fund statistics
Net Assets........................................................................................................................................................................................................................................................................................................................................................................................................................................................................................................................................................................................................................................................................................................................................................................................................................................................................................................................................................................................................................................ | $23,369,665,595 |
|---|---|
Number of Portfolio Holdings........................................................................................................................................................................................................................................................................................................................................................................................................................................................................................................................................................................................................................................................................................................................................................................................................................................................................................................................................................................................................................................ | 180 |
Net Investment Advisory Fees........................................................................................................................................................................................................................................................................................................................................................................................................................................................................................................................................................................................................................................................................................................................................................................................................................................................................................................................................................................................................................................ | $35,845,072 |
Portfolio Turnover Rate........................................................................................................................................................................................................................................................................................................................................................................................................................................................................................................................................................................................................................................................................................................................................................................................................................................................................................................................................................................................................................................ | 22% |
Sector allocation
Ten largest holdings
Sector | Percent of Total InvestmentsFootnote Reference(a) |
|---|---|
Information Technology........................................................................................................................................................................................................................................................................................................................................................................................................................................................................................................................................................................................................................................................................................................................................................................................................................................................................................................................................................................................................................................ | 27.0% |
Financials........................................................................................................................................................................................................................................................................................................................................................................................................................................................................................................................................................................................................................................................................................................................................................................................................................................................................................................................................................................................................................................ | 15.0 |
Health Care........................................................................................................................................................................................................................................................................................................................................................................................................................................................................................................................................................................................................................................................................................................................................................................................................................................................................................................................................................................................................................................ | 14.4 |
Consumer Staples........................................................................................................................................................................................................................................................................................................................................................................................................................................................................................................................................................................................................................................................................................................................................................................................................................................................................................................................................................................................................................................ | 10.5 |
Industrials........................................................................................................................................................................................................................................................................................................................................................................................................................................................................................................................................................................................................................................................................................................................................................................................................................................................................................................................................................................................................................................ | 7.9 |
Utilities........................................................................................................................................................................................................................................................................................................................................................................................................................................................................................................................................................................................................................................................................................................................................................................................................................................................................................................................................................................................................................................ | 7.7 |
Consumer Discretionary........................................................................................................................................................................................................................................................................................................................................................................................................................................................................................................................................................................................................................................................................................................................................................................................................................................................................................................................................................................................................................................ | 6.3 |
Communication Services........................................................................................................................................................................................................................................................................................................................................................................................................................................................................................................................................................................................................................................................................................................................................................................................................................................................................................................................................................................................................................................ | 5.6 |
Energy........................................................................................................................................................................................................................................................................................................................................................................................................................................................................................................................................................................................................................................................................................................................................................................................................................................................................................................................................................................................................................................ | 3.7 |
Materials........................................................................................................................................................................................................................................................................................................................................................................................................................................................................................................................................................................................................................................................................................................................................................................................................................................................................................................................................................................................................................................ | 1.3 |
Real Estate........................................................................................................................................................................................................................................................................................................................................................................................................................................................................................................................................................................................................................................................................................................................................................................................................................................................................................................................................................................................................................................ | 0.6 |
Security | Percent of Total InvestmentsFootnote Reference(a) |
|---|---|
Microsoft Corp......................................................................................................................................................................................................................................................................................................................................................................................................................................................................................................................................................................................................................................................................................................................................................................................................................................................................................................................................................................................................................................... | 1.8% |
Cisco Systems, Inc......................................................................................................................................................................................................................................................................................................................................................................................................................................................................................................................................................................................................................................................................................................................................................................................................................................................................................................................................................................................................................................... | 1.7 |
Exxon Mobil Corp......................................................................................................................................................................................................................................................................................................................................................................................................................................................................................................................................................................................................................................................................................................................................................................................................................................................................................................................................................................................................................................... | 1.6 |
Southern Co. (The)........................................................................................................................................................................................................................................................................................................................................................................................................................................................................................................................................................................................................................................................................................................................................................................................................................................................................................................................................................................................................................................ | 1.6 |
Motorola Solutions, Inc......................................................................................................................................................................................................................................................................................................................................................................................................................................................................................................................................................................................................................................................................................................................................................................................................................................................................................................................................................................................................................................... | 1.6 |
Duke Energy Corp......................................................................................................................................................................................................................................................................................................................................................................................................................................................................................................................................................................................................................................................................................................................................................................................................................................................................................................................................................................................................................................... | 1.6 |
T-Mobile U.S., Inc......................................................................................................................................................................................................................................................................................................................................................................................................................................................................................................................................................................................................................................................................................................................................................................................................................................................................................................................................................................................................................................... | 1.5 |
McKesson Corp......................................................................................................................................................................................................................................................................................................................................................................................................................................................................................................................................................................................................................................................................................................................................................................................................................................................................................................................................................................................................................................... | 1.5 |
Waste Management, Inc......................................................................................................................................................................................................................................................................................................................................................................................................................................................................................................................................................................................................................................................................................................................................................................................................................................................................................................................................................................................................................................... | 1.5 |
Waste Connections, Inc......................................................................................................................................................................................................................................................................................................................................................................................................................................................................................................................................................................................................................................................................................................................................................................................................................................................................................................................................................................................................................................... | 1.5 |
| Footnote | Description |
Footnote(a) | Excludes money market funds. |
What were the Fund costs for the last year?
(based on a hypothetical $10,000 investment)
Fund name | Costs of a $10,000
investment | Costs paid as a percentage of a
$10,000 investment |
|---|---|---|
iShares MSCI USA Momentum Factor ETF | $17 | 0.15% |
How did the Fund perform last year?
For the reporting period ended July 31, 2025, the Fund returned 27.63%.
For the same period, the MSCI USA Index returned 16.96% and the MSCI USA Momentum SR Variant Index (Spliced) returned 27.85%.
What contributed to performance?
During the reporting period, stocks in the information technology sector were the leading contributors to the Fund’s return. Application software companies benefited from their exposure to artificial intelligence (“AI”) and digital transformation themes. In particular, a company specializing in data analysis and AI experienced robust growth across its government and commercial sectors. In addition, semiconductor stocks gained amid continued demand for AI and generative AI, data center expansions, and continued innovation in chips and network solutions. In the industrials sector, aerospace and defense stocks gained amid robust demand for engines and services in commercial aviation, as well as government support for defense spending. Additionally, electrical equipment manufacturers benefited as the growth of AI data centers dramatically increased electricity demand. Stocks in the financials sector were also notable contributors, benefiting from resilient equity markets, rising assets under management, strong trends in wealth management, and high trading volumes.
What detracted from performance?
There were no meaningful detractors from the Fund’s performance during the reporting period.
The views expressed reflect the opinions of BlackRock as of the date of this report and are subject to change based on changes in market, economic or other conditions. These views are not intended to be a forecast of future events and are no guarantee of future results.
Fund | MSCI USA Index | MSCI USA Momentum SR Variant Index (Spliced) | |
|---|---|---|---|
Jul 15 | $10,000 | $10,000 | $10,000 |
Aug 15 | $9,404 | $9,393 | $9,851 |
Sep 15 | $9,222 | $9,145 | $9,658 |
Oct 15 | $9,892 | $9,899 | $10,360 |
Nov 15 | $9,942 | $9,934 | $10,410 |
Dec 15 | $9,935 | $9,767 | $10,399 |
Jan 16 | $9,568 | $9,248 | $10,015 |
Feb 16 | $9,442 | $9,228 | $9,880 |
Mar 16 | $9,937 | $9,860 | $10,396 |
Apr 16 | $9,872 | $9,909 | $10,327 |
May 16 | $10,114 | $10,090 | $10,578 |
Jun 16 | $10,415 | $10,116 | $10,889 |
Jul 16 | $10,693 | $10,500 | $11,178 |
Aug 16 | $10,536 | $10,516 | $11,010 |
Sep 16 | $10,586 | $10,527 | $11,059 |
Oct 16 | $10,378 | $10,328 | $11,055 |
Nov 16 | $10,315 | $10,701 | $10,990 |
Dec 16 | $10,421 | $10,901 | $11,110 |
Jan 17 | $10,768 | $11,126 | $11,478 |
Feb 17 | $11,165 | $11,564 | $11,905 |
Mar 17 | $11,403 | $11,580 | $12,162 |
Apr 17 | $11,690 | $11,705 | $12,470 |
May 17 | $12,253 | $11,865 | $13,071 |
Jun 17 | $12,299 | $11,939 | $13,124 |
Jul 17 | $12,718 | $12,183 | $13,574 |
Aug 17 | $12,907 | $12,222 | $13,778 |
Sep 17 | $13,276 | $12,472 | $14,170 |
Oct 17 | $13,938 | $12,757 | $14,879 |
Nov 17 | $14,326 | $13,146 | $15,297 |
Dec 17 | $14,340 | $13,288 | $15,312 |
Jan 18 | $15,514 | $14,051 | $16,569 |
Feb 18 | $15,293 | $13,535 | $16,334 |
Mar 18 | $14,733 | $13,205 | $15,740 |
Apr 18 | $14,846 | $13,258 | $15,861 |
May 18 | $15,364 | $13,581 | $16,416 |
Jun 18 | $15,340 | $13,674 | $16,393 |
Jul 18 | $15,625 | $14,164 | $16,699 |
Aug 18 | $16,539 | $14,633 | $17,679 |
Sep 18 | $16,691 | $14,700 | $17,844 |
Oct 18 | $15,055 | $13,680 | $16,095 |
Nov 18 | $15,261 | $13,946 | $16,318 |
Dec 18 | $14,086 | $12,690 | $15,064 |
Jan 19 | $15,024 | $13,734 | $16,069 |
Feb 19 | $15,524 | $14,193 | $16,647 |
Mar 19 | $15,860 | $14,456 | $17,006 |
Apr 19 | $16,226 | $15,035 | $17,400 |
May 19 | $15,851 | $14,085 | $17,005 |
Jun 19 | $16,836 | $15,074 | $18,066 |
Jul 19 | $17,143 | $15,307 | $18,396 |
Aug 19 | $17,187 | $15,041 | $18,447 |
Sep 19 | $16,979 | $15,308 | $18,224 |
Oct 19 | $17,083 | $15,642 | $18,338 |
Nov 19 | $17,655 | $16,230 | $18,956 |
Dec 19 | $17,970 | $16,705 | $19,296 |
Jan 20 | $18,629 | $16,738 | $20,009 |
Feb 20 | $17,258 | $15,373 | $18,539 |
Mar 20 | $15,288 | $13,423 | $16,424 |
Apr 20 | $17,085 | $15,189 | $18,351 |
May 20 | $18,102 | $15,979 | $19,450 |
Jun 20 | $18,889 | $16,344 | $20,298 |
Jul 20 | $20,178 | $17,314 | $20,399 |
Aug 20 | $22,125 | $18,614 | $23,784 |
Sep 20 | $21,266 | $17,919 | $22,862 |
Oct 20 | $20,374 | $17,453 | $21,906 |
Nov 20 | $22,525 | $19,472 | $24,219 |
Dec 20 | $23,305 | $20,276 | $25,062 |
Jan 21 | $23,693 | $20,087 | $25,483 |
Feb 21 | $23,553 | $20,612 | $25,334 |
Mar 21 | $23,260 | $21,388 | $25,020 |
Apr 21 | $24,912 | $22,552 | $26,800 |
May 21 | $24,635 | $22,660 | $26,509 |
Jun 21 | $25,104 | $23,291 | $27,016 |
Jul 21 | $25,337 | $23,842 | $27,269 |
Aug 21 | $26,386 | $24,545 | $28,404 |
Sep 21 | $25,464 | $23,386 | $27,416 |
Oct 21 | $27,642 | $25,017 | $29,766 |
Nov 21 | $26,573 | $24,766 | $28,619 |
Dec 21 | $26,440 | $25,744 | $28,474 |
Jan 22 | $24,046 | $24,287 | $25,897 |
Feb 22 | $23,405 | $23,575 | $25,209 |
Mar 22 | $24,489 | $24,404 | $26,382 |
Apr 22 | $21,408 | $22,192 | $23,063 |
May 22 | $21,291 | $22,143 | $22,940 |
Jun 22 | $19,909 | $20,310 | $21,455 |
Jul 22 | $20,941 | $22,205 | $22,566 |
Aug 22 | $20,540 | $21,335 | $22,138 |
Sep 22 | $19,298 | $19,356 | $20,805 |
Oct 22 | $21,714 | $20,893 | $23,415 |
Nov 22 | $22,487 | $22,029 | $24,250 |
Dec 22 | $21,620 | $20,734 | $23,321 |
Jan 23 | $21,481 | $22,098 | $23,170 |
Feb 23 | $20,626 | $21,571 | $22,250 |
Mar 23 | $20,706 | $22,337 | $22,336 |
Apr 23 | $21,208 | $22,620 | $22,881 |
May 23 | $20,168 | $22,768 | $21,761 |
Jun 23 | $21,573 | $24,286 | $23,281 |
Jul 23 | $21,946 | $25,122 | $23,685 |
Aug 23 | $22,007 | $24,698 | $23,755 |
Sep 23 | $20,954 | $23,540 | $22,621 |
Oct 23 | $20,610 | $22,998 | $22,253 |
Nov 23 | $22,509 | $25,167 | $24,307 |
Dec 23 | $23,588 | $26,353 | $25,476 |
Jan 24 | $24,908 | $26,763 | $26,903 |
Feb 24 | $27,412 | $28,199 | $29,623 |
Mar 24 | $28,208 | $29,096 | $30,489 |
Apr 24 | $26,641 | $27,895 | $28,797 |
May 24 | $28,062 | $29,228 | $30,338 |
Jun 24 | $29,343 | $30,273 | $31,735 |
Jul 24 | $28,768 | $30,653 | $29,269 |
Aug 24 | $29,745 | $31,392 | $32,176 |
Sep 24 | $30,592 | $32,068 | $33,093 |
Oct 24 | $30,548 | $31,831 | $33,056 |
Nov 24 | $32,663 | $33,823 | $33,241 |
Dec 24 | $31,344 | $32,962 | $31,900 |
Jan 25 | $33,201 | $33,966 | $33,816 |
Feb 25 | $33,102 | $33,431 | $33,707 |
Mar 25 | $30,660 | $31,475 | $31,228 |
Apr 25 | $31,858 | $31,314 | $32,459 |
May 25 | $35,182 | $33,335 | $35,862 |
Jun 25 | $36,596 | $35,050 | $37,299 |
Jul 25 | $36,715 | $35,852 | $37,419 |
........................................................................................................................................................................................................................................................................................................................................................................................................................................................................................................................................................................................................................................................................................................................................................................................................................................................................................................................................................................................................................................ | 1 Year | 5 Years | 10 Years |
|---|---|---|---|
Fund NAV........................................................................................................................................................................................................................................................................................................................................................................................................................................................................................................................................................................................................................................................................................................................................................................................................................................................................................................................................................................................................................................ | 27.63% | 12.72% | 13.89% |
MSCI USA Index........................................................................................................................................................................................................................................................................................................................................................................................................................................................................................................................................................................................................................................................................................................................................................................................................................................................................................................................................................................................................................................ | 16.96 | 15.67 | 13.62 |
MSCI USA Momentum SR Variant Index (Spliced)........................................................................................................................................................................................................................................................................................................................................................................................................................................................................................................................................................................................................................................................................................................................................................................................................................................................................................................................................................................................................................................ | 27.85 | 12.90 | 14.11 |
Key Fund statistics
Net Assets........................................................................................................................................................................................................................................................................................................................................................................................................................................................................................................................................................................................................................................................................................................................................................................................................................................................................................................................................................................................................................................ | $17,576,266,699 |
|---|---|
Number of Portfolio Holdings........................................................................................................................................................................................................................................................................................................................................................................................................................................................................................................................................................................................................................................................................................................................................................................................................................................................................................................................................................................................................................................ | 128 |
Net Investment Advisory Fees........................................................................................................................................................................................................................................................................................................................................................................................................................................................................................................................................................................................................................................................................................................................................................................................................................................................................................................................................................................................................................................ | $20,554,935 |
Portfolio Turnover Rate........................................................................................................................................................................................................................................................................................................................................................................................................................................................................................................................................................................................................................................................................................................................................................................................................................................................................................................................................................................................................................................ | 116% |
Sector allocation
Ten largest holdings
Sector | Percent of Total InvestmentsFootnote Reference(a) |
|---|---|
Financials........................................................................................................................................................................................................................................................................................................................................................................................................................................................................................................................................................................................................................................................................................................................................................................................................................................................................................................................................................................................................................................ | 23.0% |
Information Technology........................................................................................................................................................................................................................................................................................................................................................................................................................................................................................................................................................................................................................................................................................................................................................................................................................................................................................................................................................................................................................................ | 18.0 |
Communication Services........................................................................................................................................................................................................................................................................................................................................................................................................................................................................................................................................................................................................................................................................................................................................................................................................................................................................................................................................................................................................................................ | 13.5 |
Consumer Staples........................................................................................................................................................................................................................................................................................................................................................................................................................................................................................................................................................................................................................................................................................................................................................................................................................................................................................................................................................................................................................................ | 12.2 |
Industrials........................................................................................................................................................................................................................................................................................................................................................................................................................................................................................................................................................................................................................................................................................................................................................................................................................................................................................................................................................................................................................................ | 11.0 |
Consumer Discretionary........................................................................................................................................................................................................................................................................................................................................................................................................................................................................................................................................................................................................................................................................................................................................................................................................................................................................................................................................................................................................................................ | 9.4 |
Health Care........................................................................................................................................................................................................................................................................................................................................................................................................................................................................................................................................................................................................................................................................................................................................................................................................................................................................................................................................................................................................................................ | 6.3 |
Utilities........................................................................................................................................................................................................................................................................................................................................................................................................................................................................................................................................................................................................................................................................................................................................................................................................................................................................................................................................................................................................................................ | 2.6 |
Energy........................................................................................................................................................................................................................................................................................................................................................................................................................................................................................................................................................................................................................................................................................................................................................................................................................................................................................................................................................................................................................................ | 2.2 |
Real Estate........................................................................................................................................................................................................................................................................................................................................................................................................................................................................................................................................................................................................................................................................................................................................................................................................................................................................................................................................................................................................................................ | 1.8 |
Security | Percent of Total InvestmentsFootnote Reference(a) |
|---|---|
Broadcom, Inc......................................................................................................................................................................................................................................................................................................................................................................................................................................................................................................................................................................................................................................................................................................................................................................................................................................................................................................................................................................................................................................... | 6.0% |
Meta Platforms, Inc., Class A........................................................................................................................................................................................................................................................................................................................................................................................................................................................................................................................................................................................................................................................................................................................................................................................................................................................................................................................................................................................................................................ | 5.5 |
JPMorgan Chase & Co......................................................................................................................................................................................................................................................................................................................................................................................................................................................................................................................................................................................................................................................................................................................................................................................................................................................................................................................................................................................................................................... | 4.8 |
Netflix, Inc......................................................................................................................................................................................................................................................................................................................................................................................................................................................................................................................................................................................................................................................................................................................................................................................................................................................................................................................................................................................................................................... | 4.4 |
Walmart, Inc......................................................................................................................................................................................................................................................................................................................................................................................................................................................................................................................................................................................................................................................................................................................................................................................................................................................................................................................................................................................................................................... | 4.3 |
Berkshire Hathaway, Inc., Class B........................................................................................................................................................................................................................................................................................................................................................................................................................................................................................................................................................................................................................................................................................................................................................................................................................................................................................................................................................................................................................................ | 4.2 |
Visa, Inc., Class A........................................................................................................................................................................................................................................................................................................................................................................................................................................................................................................................................................................................................................................................................................................................................................................................................................................................................................................................................................................................................................................ | 4.0 |
Palantir Technologies, Inc., Class A........................................................................................................................................................................................................................................................................................................................................................................................................................................................................................................................................................................................................................................................................................................................................................................................................................................................................................................................................................................................................................................ | 4.0 |
Tesla, Inc......................................................................................................................................................................................................................................................................................................................................................................................................................................................................................................................................................................................................................................................................................................................................................................................................................................................................................................................................................................................................................................... | 3.8 |
Philip Morris International, Inc......................................................................................................................................................................................................................................................................................................................................................................................................................................................................................................................................................................................................................................................................................................................................................................................................................................................................................................................................................................................................................................... | 2.8 |
| Footnote | Description |
Footnote(a) | Excludes money market funds. |
What were the Fund costs for the last year?
(based on a hypothetical $10,000 investment)
Fund name | Costs of a $10,000
investment | Costs paid as a percentage of a
$10,000 investment |
|---|---|---|
iShares MSCI USA Quality Factor ETF | $16 | 0.15% |
How did the Fund perform last year?
For the reporting period ended July 31, 2025, the Fund returned 8.31%.
For the same period, the MSCI USA Index returned 16.96% and the MSCI USA Sector Neutral Quality Index (Spliced) returned 8.47%
What contributed to performance?
Stocks in the communications sector were among the leading contributors to the Fund’s return during the reporting period. Notably, firms in the interactive media and services segment were supported by solid digital advertising revenue growth fueled by artificial intelligence (“AI”) investments that improved ad targeting and performance. In the information technology sector, systems software firms benefited from strong demand in cloud-delivered businesses, while semiconductor stocks gained amid unprecedented demand for AI and generative AI, data center expansions, and continued innovation in chips and network solutions. Further, communications equipment companies leveraged AI to automate network management, enhance product capabilities, and deliver more efficient and intelligent solutions to enterprise and consumer markets. Transaction and payment processing firms in the financials sector were supported by cross-border transactions and the growing adoption of digital payments.
What detracted from performance?
U.S. healthcare stocks were modest detractors from the Fund’s return during the reporting period, pressured by increasing regulatory scrutiny and policy upheaval. Managed healthcare firms faced additional challenges due to rising utilization and medical costs, as well as changes in reimbursement levels.
The views expressed reflect the opinions of BlackRock as of the date of this report and are subject to change based on changes in market, economic or other conditions. These views are not intended to be a forecast of future events and are no guarantee of future results.
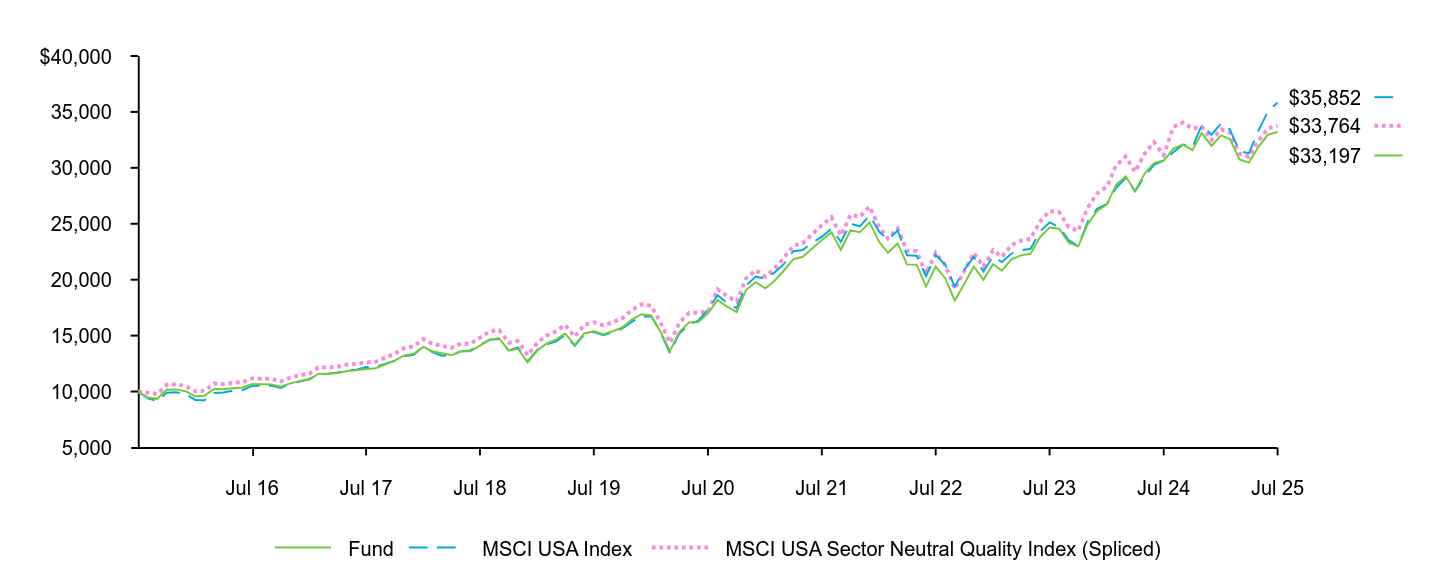
Fund | MSCI USA Index | MSCI USA Sector Neutral Quality Index (Spliced) | |
|---|---|---|---|
Jul 15 | $10,000 | $10,000 | $10,000 |
Aug 15 | $9,463 | $9,393 | $9,889 |
Sep 15 | $9,346 | $9,145 | $9,767 |
Oct 15 | $10,149 | $9,899 | $10,608 |
Nov 15 | $10,190 | $9,934 | $10,654 |
Dec 15 | $10,023 | $9,767 | $10,478 |
Jan 16 | $9,574 | $9,248 | $10,009 |
Feb 16 | $9,626 | $9,228 | $10,064 |
Mar 16 | $10,236 | $9,860 | $10,705 |
Apr 16 | $10,200 | $9,909 | $10,670 |
May 16 | $10,303 | $10,090 | $10,780 |
Jun 16 | $10,356 | $10,116 | $10,836 |
Jul 16 | $10,670 | $10,500 | $11,166 |
Aug 16 | $10,649 | $10,516 | $11,146 |
Sep 16 | $10,637 | $10,527 | $11,134 |
Oct 16 | $10,420 | $10,328 | $10,908 |
Nov 16 | $10,727 | $10,701 | $11,232 |
Dec 16 | $10,943 | $10,901 | $11,459 |
Jan 17 | $11,076 | $11,126 | $11,600 |
Feb 17 | $11,596 | $11,564 | $12,148 |
Mar 17 | $11,592 | $11,580 | $12,145 |
Apr 17 | $11,656 | $11,705 | $12,214 |
May 17 | $11,837 | $11,865 | $12,407 |
Jun 17 | $11,906 | $11,939 | $12,480 |
Jul 17 | $12,017 | $12,183 | $12,598 |
Aug 17 | $12,082 | $12,222 | $12,668 |
Sep 17 | $12,403 | $12,472 | $13,006 |
Oct 17 | $12,758 | $12,757 | $13,381 |
Nov 17 | $13,232 | $13,146 | $13,880 |
Dec 17 | $13,379 | $13,288 | $14,037 |
Jan 18 | $13,991 | $14,051 | $14,680 |
Feb 18 | $13,596 | $13,535 | $14,267 |
Mar 18 | $13,416 | $13,205 | $14,081 |
Apr 18 | $13,236 | $13,258 | $13,893 |
May 18 | $13,599 | $13,581 | $14,276 |
Jun 18 | $13,592 | $13,674 | $14,270 |
Jul 18 | $14,102 | $14,164 | $14,807 |
Aug 18 | $14,622 | $14,633 | $15,355 |
Sep 18 | $14,782 | $14,700 | $15,525 |
Oct 18 | $13,674 | $13,680 | $14,363 |
Nov 18 | $13,812 | $13,946 | $14,509 |
Dec 18 | $12,607 | $12,690 | $13,246 |
Jan 19 | $13,665 | $13,734 | $14,359 |
Feb 19 | $14,257 | $14,193 | $14,983 |
Mar 19 | $14,625 | $14,456 | $15,371 |
Apr 19 | $15,178 | $15,035 | $15,955 |
May 19 | $14,172 | $14,085 | $14,902 |
Jun 19 | $15,188 | $15,074 | $15,974 |
Jul 19 | $15,391 | $15,307 | $16,189 |
Aug 19 | $15,128 | $15,041 | $15,916 |
Sep 19 | $15,390 | $15,308 | $16,188 |
Oct 19 | $15,735 | $15,642 | $16,559 |
Nov 19 | $16,432 | $16,230 | $17,282 |
Dec 19 | $16,911 | $16,705 | $17,802 |
Jan 20 | $16,797 | $16,738 | $17,672 |
Feb 20 | $15,390 | $15,373 | $16,203 |
Mar 20 | $13,630 | $13,423 | $14,353 |
Apr 20 | $15,314 | $15,189 | $16,128 |
May 20 | $16,168 | $15,979 | $17,028 |
Jun 20 | $16,206 | $16,344 | $17,073 |
Jul 20 | $16,988 | $17,314 | $17,126 |
Aug 20 | $18,173 | $18,614 | $19,149 |
Sep 20 | $17,600 | $17,919 | $18,549 |
Oct 20 | $17,110 | $17,453 | $18,034 |
Nov 20 | $19,071 | $19,472 | $20,104 |
Dec 20 | $19,780 | $20,276 | $20,854 |
Jan 21 | $19,222 | $20,087 | $20,267 |
Feb 21 | $19,853 | $20,612 | $20,936 |
Mar 21 | $20,803 | $21,388 | $21,941 |
Apr 21 | $21,815 | $22,552 | $23,013 |
May 21 | $22,048 | $22,660 | $23,272 |
Jun 21 | $22,779 | $23,291 | $24,055 |
Jul 21 | $23,549 | $23,842 | $24,872 |
Aug 21 | $24,218 | $24,545 | $25,583 |
Sep 21 | $22,668 | $23,386 | $23,947 |
Oct 21 | $24,404 | $25,017 | $25,785 |
Nov 21 | $24,251 | $24,766 | $25,627 |
Dec 21 | $25,102 | $25,744 | $26,530 |
Jan 22 | $23,373 | $24,287 | $24,706 |
Feb 22 | $22,401 | $23,575 | $23,679 |
Mar 22 | $23,241 | $24,404 | $24,570 |
Apr 22 | $21,367 | $22,192 | $22,592 |
May 22 | $21,328 | $22,143 | $22,554 |
Jun 22 | $19,398 | $20,310 | $20,515 |
Jul 22 | $21,173 | $22,205 | $22,395 |
Aug 22 | $20,109 | $21,335 | $21,272 |
Sep 22 | $18,136 | $19,356 | $19,185 |
Oct 22 | $19,629 | $20,893 | $20,768 |
Nov 22 | $21,165 | $22,029 | $22,398 |
Dec 22 | $19,983 | $20,734 | $21,150 |
Jan 23 | $21,385 | $22,098 | $22,638 |
Feb 23 | $20,812 | $21,571 | $22,033 |
Mar 23 | $21,809 | $22,337 | $23,101 |
Apr 23 | $22,172 | $22,620 | $23,487 |
May 23 | $22,321 | $22,768 | $23,648 |
Jun 23 | $23,774 | $24,286 | $25,191 |
Jul 23 | $24,661 | $25,122 | $26,135 |
Aug 23 | $24,560 | $24,698 | $26,031 |
Sep 23 | $23,311 | $23,540 | $24,703 |
Oct 23 | $22,982 | $22,998 | $24,365 |
Nov 23 | $24,948 | $25,167 | $26,440 |
Dec 23 | $26,145 | $26,353 | $27,726 |
Jan 24 | $26,732 | $26,763 | $28,333 |
Feb 24 | $28,476 | $28,199 | $30,207 |
Mar 24 | $29,235 | $29,096 | $31,015 |
Apr 24 | $27,939 | $27,895 | $29,644 |
May 24 | $29,493 | $29,228 | $31,283 |
Jun 24 | $30,427 | $30,273 | $32,293 |
Jul 24 | $30,650 | $30,653 | $31,128 |
Aug 24 | $31,720 | $31,392 | $33,665 |
Sep 24 | $32,076 | $32,068 | $34,045 |
Oct 24 | $31,580 | $31,831 | $33,517 |
Nov 24 | $33,122 | $33,823 | $33,674 |
Dec 24 | $31,957 | $32,962 | $32,483 |
Jan 25 | $32,900 | $33,966 | $33,438 |
Feb 25 | $32,578 | $33,431 | $33,127 |
Mar 25 | $30,746 | $31,475 | $31,263 |
Apr 25 | $30,470 | $31,314 | $30,987 |
May 25 | $31,879 | $33,335 | $32,423 |
Jun 25 | $32,960 | $35,050 | $33,520 |
Jul 25 | $33,197 | $35,852 | $33,764 |
........................................................................................................................................................................................................................................................................................................................................................................................................................................................................................................................................................................................................................................................................................................................................................................................................................................................................................................................................................................................................................................ | 1 Year | 5 Years | 10 Years |
|---|---|---|---|
Fund NAV........................................................................................................................................................................................................................................................................................................................................................................................................................................................................................................................................................................................................................................................................................................................................................................................................................................................................................................................................................................................................................................ | 8.31% | 14.34% | 12.75% |
MSCI USA Index........................................................................................................................................................................................................................................................................................................................................................................................................................................................................................................................................................................................................................................................................................................................................................................................................................................................................................................................................................................................................................................ | 16.96 | 15.67 | 13.62 |
MSCI USA Sector Neutral Quality Index (Spliced)........................................................................................................................................................................................................................................................................................................................................................................................................................................................................................................................................................................................................................................................................................................................................................................................................................................................................................................................................................................................................................................ | 8.47 | 14.54 | 12.94 |
Key Fund statistics
Net Assets........................................................................................................................................................................................................................................................................................................................................................................................................................................................................................................................................................................................................................................................................................................................................................................................................................................................................................................................................................................................................................................ | $52,856,647,599 |
|---|---|
Number of Portfolio Holdings........................................................................................................................................................................................................................................................................................................................................................................................................................................................................................................................................................................................................................................................................................................................................................................................................................................................................................................................................................................................................................................ | 128 |
Net Investment Advisory Fees........................................................................................................................................................................................................................................................................................................................................................................................................................................................................................................................................................................................................................................................................................................................................................................................................................................................................................................................................................................................................................................ | $75,086,515 |
Portfolio Turnover Rate........................................................................................................................................................................................................................................................................................................................................................................................................................................................................................................................................................................................................................................................................................................................................................................................................................................................................................................................................................................................................................................ | 21% |
Sector allocation
Ten largest holdings
Sector | Percent of Total InvestmentsFootnote Reference(a) |
|---|---|
Information Technology........................................................................................................................................................................................................................................................................................................................................................................................................................................................................................................................................................................................................................................................................................................................................................................................................................................................................................................................................................................................................................................ | 33.7% |
Financials........................................................................................................................................................................................................................................................................................................................................................................................................................................................................................................................................................................................................................................................................................................................................................................................................................................................................................................................................................................................................................................ | 13.2 |
Consumer Discretionary........................................................................................................................................................................................................................................................................................................................................................................................................................................................................................................................................................................................................................................................................................................................................................................................................................................................................................................................................................................................................................................ | 10.3 |
Communication Services........................................................................................................................................................................................................................................................................................................................................................................................................................................................................................................................................................................................................................................................................................................................................................................................................................................................................................................................................................................................................................................ | 10.3 |
Health Care........................................................................................................................................................................................................................................................................................................................................................................................................................................................................................................................................................................................................................................................................................................................................................................................................................................................................................................................................................................................................................................ | 9.2 |
Industrials........................................................................................................................................................................................................................................................................................................................................................................................................................................................................................................................................................................................................................................................................................................................................................................................................................................................................................................................................................................................................................................ | 8.8 |
Consumer Staples........................................................................................................................................................................................................................................................................................................................................................................................................................................................................................................................................................................................................................................................................................................................................................................................................................................................................................................................................................................................................................................ | 5.2 |
Energy........................................................................................................................................................................................................................................................................................................................................................................................................................................................................................................................................................................................................................................................................................................................................................................................................................................................................................................................................................................................................................................ | 2.8 |
Utilities........................................................................................................................................................................................................................................................................................................................................................................................................................................................................................................................................................................................................................................................................................................................................................................................................................................................................................................................................................................................................................................ | 2.4 |
Real Estate........................................................................................................................................................................................................................................................................................................................................................................................................................................................................................................................................................................................................................................................................................................................................................................................................................................................................................................................................................................................................................................ | 2.2 |
Materials........................................................................................................................................................................................................................................................................................................................................................................................................................................................................................................................................................................................................................................................................................................................................................................................................................................................................................................................................................................................................................................ | 1.9 |
Security | Percent of Total InvestmentsFootnote Reference(a) |
|---|---|
NVIDIA Corp......................................................................................................................................................................................................................................................................................................................................................................................................................................................................................................................................................................................................................................................................................................................................................................................................................................................................................................................................................................................................................................... | 7.8% |
Microsoft Corp......................................................................................................................................................................................................................................................................................................................................................................................................................................................................................................................................................................................................................................................................................................................................................................................................................................................................................................................................................................................................................................... | 6.9 |
Apple, Inc......................................................................................................................................................................................................................................................................................................................................................................................................................................................................................................................................................................................................................................................................................................................................................................................................................................................................................................................................................................................................................................... | 5.9 |
Visa, Inc., Class A........................................................................................................................................................................................................................................................................................................................................................................................................................................................................................................................................................................................................................................................................................................................................................................................................................................................................................................................................................................................................................................ | 4.1 |
Mastercard, Inc., Class A........................................................................................................................................................................................................................................................................................................................................................................................................................................................................................................................................................................................................................................................................................................................................................................................................................................................................................................................................................................................................................................ | 3.9 |
Meta Platforms, Inc., Class A........................................................................................................................................................................................................................................................................................................................................................................................................................................................................................................................................................................................................................................................................................................................................................................................................................................................................................................................................................................................................................................ | 3.8 |
Eli Lilly & Co......................................................................................................................................................................................................................................................................................................................................................................................................................................................................................................................................................................................................................................................................................................................................................................................................................................................................................................................................................................................................................................... | 3.4 |
Netflix, Inc......................................................................................................................................................................................................................................................................................................................................................................................................................................................................................................................................................................................................................................................................................................................................................................................................................................................................................................................................................................................................................................... | 2.5 |
TJX Companies, Inc. (The)........................................................................................................................................................................................................................................................................................................................................................................................................................................................................................................................................................................................................................................................................................................................................................................................................................................................................................................................................................................................................................................ | 2.3 |
Alphabet, Inc., Class A........................................................................................................................................................................................................................................................................................................................................................................................................................................................................................................................................................................................................................................................................................................................................................................................................................................................................................................................................................................................................................................ | 2.0 |
| Footnote | Description |
Footnote(a) | Excludes money market funds. |
What were the Fund costs for the last year?
(based on a hypothetical $10,000 investment)
Fund name | Costs of a $10,000
investment | Costs paid as a percentage of a
$10,000 investment |
|---|---|---|
iShares MSCI USA Size Factor ETF | $16 | 0.15% |
How did the Fund perform last year?
For the reporting period ended July 31, 2025, the Fund returned 10.86%.
For the same period, the MSCI USA Index returned 16.96% and the MSCI USA Low Size Index (Spliced) returned 11.06%.
What contributed to performance?
Application software stocks in the information technology sector contributed to the Fund’s performance during the reporting period. Notable contributors included a company specializing in data analysis and artificial intelligence (“AI”), which experienced significant growth in its government and commercial sectors and a firm that provides solutions for in-app advertising, mobile device marketing, and connected TV advertising. Meanwhile, increased demand for consumer electronics, such as smartphones, laptops, and smart appliances, has fueled the companies that manufacture the building blocks for these products in the electronic equipment, instruments, and components firms segment. Stocks in the financials sector were also notable contributors, benefiting from resilient equity markets, rising assets under management, strong trends in wealth management, and high trading volumes. In the industrials sector, aerospace and defense stocks gained amid robust demand for engines and services in commercial aviation, as well as government support for defense spending. Electrical equipment manufacturers benefited as the growth of AI data centers dramatically increased electricity demand.
What detracted from performance?
U.S. healthcare stocks were modest detractors from the Fund’s return during the reporting period, pressured by increasing regulatory scrutiny, tariff threats, and policy upheaval.
The views expressed reflect the opinions of BlackRock as of the date of this report and are subject to change based on changes in market, economic or other conditions. These views are not intended to be a forecast of future events and are no guarantee of future results.
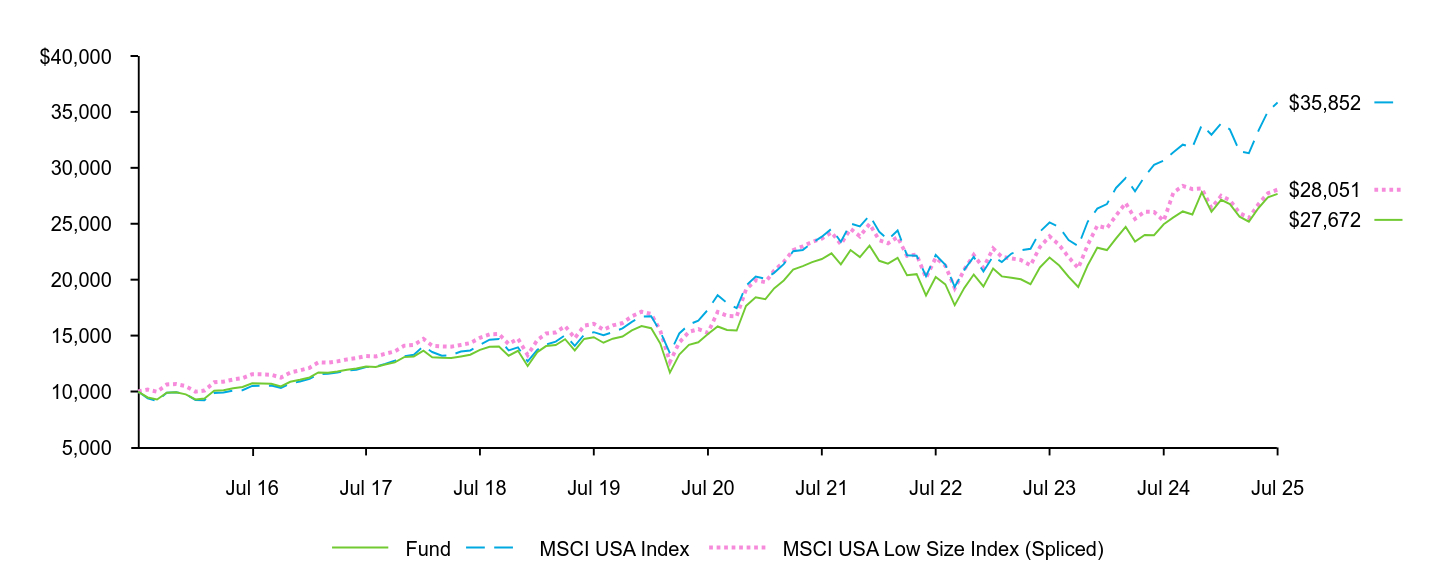
Fund | MSCI USA Index | MSCI USA Low Size Index (Spliced) | |
|---|---|---|---|
Jul 15 | $10,000 | $10,000 | $10,000 |
Aug 15 | $9,467 | $9,393 | $10,173 |
Sep 15 | $9,286 | $9,145 | $9,979 |
Oct 15 | $9,887 | $9,899 | $10,627 |
Nov 15 | $9,931 | $9,934 | $10,674 |
Dec 15 | $9,748 | $9,767 | $10,479 |
Jan 16 | $9,293 | $9,248 | $9,989 |
Feb 16 | $9,378 | $9,228 | $10,082 |
Mar 16 | $10,065 | $9,860 | $10,823 |
Apr 16 | $10,120 | $9,909 | $10,883 |
May 16 | $10,299 | $10,090 | $11,078 |
Jun 16 | $10,404 | $10,116 | $11,191 |
Jul 16 | $10,739 | $10,500 | $11,553 |
Aug 16 | $10,725 | $10,516 | $11,538 |
Sep 16 | $10,685 | $10,527 | $11,497 |
Oct 16 | $10,446 | $10,328 | $11,241 |
Nov 16 | $10,866 | $10,701 | $11,695 |
Dec 16 | $11,047 | $10,901 | $11,892 |
Jan 17 | $11,257 | $11,126 | $12,119 |
Feb 17 | $11,707 | $11,564 | $12,608 |
Mar 17 | $11,676 | $11,580 | $12,575 |
Apr 17 | $11,788 | $11,705 | $12,696 |
May 17 | $11,949 | $11,865 | $12,871 |
Jun 17 | $12,061 | $11,939 | $12,994 |
Jul 17 | $12,235 | $12,183 | $13,183 |
Aug 17 | $12,188 | $12,222 | $13,134 |
Sep 17 | $12,407 | $12,472 | $13,372 |
Oct 17 | $12,606 | $12,757 | $13,587 |
Nov 17 | $13,076 | $13,146 | $14,095 |
Dec 17 | $13,133 | $13,288 | $14,159 |
Jan 18 | $13,645 | $14,051 | $14,714 |
Feb 18 | $13,065 | $13,535 | $14,090 |
Mar 18 | $13,010 | $13,205 | $14,033 |
Apr 18 | $12,990 | $13,258 | $14,012 |
May 18 | $13,132 | $13,581 | $14,166 |
Jun 18 | $13,285 | $13,674 | $14,332 |
Jul 18 | $13,722 | $14,164 | $14,806 |
Aug 18 | $14,009 | $14,633 | $15,117 |
Sep 18 | $14,030 | $14,700 | $15,141 |
Oct 18 | $13,197 | $13,680 | $14,242 |
Nov 18 | $13,643 | $13,946 | $14,726 |
Dec 18 | $12,278 | $12,690 | $13,255 |
Jan 19 | $13,528 | $13,734 | $14,607 |
Feb 19 | $14,065 | $14,193 | $15,189 |
Mar 19 | $14,151 | $14,456 | $15,282 |
Apr 19 | $14,678 | $15,035 | $15,855 |
May 19 | $13,672 | $14,085 | $14,771 |
Jun 19 | $14,700 | $15,074 | $15,885 |
Jul 19 | $14,856 | $15,307 | $16,057 |
Aug 19 | $14,359 | $15,041 | $15,519 |
Sep 19 | $14,725 | $15,308 | $15,911 |
Oct 19 | $14,914 | $15,642 | $16,123 |
Nov 19 | $15,466 | $16,230 | $16,720 |
Dec 19 | $15,847 | $16,705 | $17,137 |
Jan 20 | $15,656 | $16,738 | $16,934 |
Feb 20 | $14,293 | $15,373 | $15,460 |
Mar 20 | $11,687 | $13,423 | $12,641 |
Apr 20 | $13,298 | $15,189 | $14,383 |
May 20 | $14,174 | $15,979 | $15,332 |
Jun 20 | $14,399 | $16,344 | $15,577 |
Jul 20 | $15,141 | $17,314 | $15,243 |
Aug 20 | $15,819 | $18,614 | $17,118 |
Sep 20 | $15,496 | $17,919 | $16,770 |
Oct 20 | $15,451 | $17,453 | $16,724 |
Nov 20 | $17,659 | $19,472 | $19,119 |
Dec 20 | $18,430 | $20,276 | $19,956 |
Jan 21 | $18,255 | $20,087 | $19,769 |
Feb 21 | $19,216 | $20,612 | $20,811 |
Mar 21 | $19,923 | $21,388 | $21,580 |
Apr 21 | $20,905 | $22,552 | $22,646 |
May 21 | $21,216 | $22,660 | $22,988 |
Jun 21 | $21,566 | $23,291 | $23,372 |
Jul 21 | $21,844 | $23,842 | $23,676 |
Aug 21 | $22,354 | $24,545 | $24,231 |
Sep 21 | $21,366 | $23,386 | $23,164 |
Oct 21 | $22,649 | $25,017 | $24,555 |
Nov 21 | $22,018 | $24,766 | $23,872 |
Dec 21 | $23,044 | $25,744 | $24,987 |
Jan 22 | $21,690 | $24,287 | $23,521 |
Feb 22 | $21,435 | $23,575 | $23,248 |
Mar 22 | $21,953 | $24,404 | $23,812 |
Apr 22 | $20,392 | $22,192 | $22,120 |
May 22 | $20,494 | $22,143 | $22,234 |
Jun 22 | $18,583 | $20,310 | $20,161 |
Jul 22 | $20,239 | $22,205 | $21,959 |
Aug 22 | $19,582 | $21,335 | $21,249 |
Sep 22 | $17,719 | $19,356 | $19,229 |
Oct 22 | $19,273 | $20,893 | $20,919 |
Nov 22 | $20,461 | $22,029 | $22,210 |
Dec 22 | $19,395 | $20,734 | $21,055 |
Jan 23 | $20,997 | $22,098 | $22,795 |
Feb 23 | $20,294 | $21,571 | $22,033 |
Mar 23 | $20,170 | $22,337 | $21,903 |
Apr 23 | $20,032 | $22,620 | $21,756 |
May 23 | $19,591 | $22,768 | $21,278 |
Jun 23 | $21,094 | $24,286 | $22,913 |
Jul 23 | $21,984 | $25,122 | $23,883 |
Aug 23 | $21,262 | $24,698 | $23,102 |
Sep 23 | $20,260 | $23,540 | $22,013 |
Oct 23 | $19,346 | $22,998 | $21,026 |
Nov 23 | $21,262 | $25,167 | $23,091 |
Dec 23 | $22,854 | $26,353 | $24,827 |
Jan 24 | $22,647 | $26,763 | $24,604 |
Feb 24 | $23,680 | $28,199 | $25,726 |
Mar 24 | $24,715 | $29,096 | $26,859 |
Apr 24 | $23,405 | $27,895 | $25,437 |
May 24 | $24,000 | $29,228 | $26,080 |
Jun 24 | $23,969 | $30,273 | $26,059 |
Jul 24 | $24,960 | $30,653 | $25,258 |
Aug 24 | $25,564 | $31,392 | $27,793 |
Sep 24 | $26,103 | $32,068 | $28,382 |
Oct 24 | $25,833 | $31,831 | $28,095 |
Nov 24 | $27,808 | $33,823 | $28,154 |
Dec 24 | $26,069 | $32,962 | $26,402 |
Jan 25 | $27,147 | $33,966 | $27,499 |
Feb 25 | $26,752 | $33,431 | $27,104 |
Mar 25 | $25,627 | $31,475 | $25,960 |
Apr 25 | $25,183 | $31,314 | $25,510 |
May 25 | $26,411 | $33,335 | $26,762 |
Jun 25 | $27,360 | $35,050 | $27,731 |
Jul 25 | $27,672 | $35,852 | $28,051 |
........................................................................................................................................................................................................................................................................................................................................................................................................................................................................................................................................................................................................................................................................................................................................................................................................................................................................................................................................................................................................................................ | 1 Year | 5 Years | 10 Years |
|---|---|---|---|
Fund NAV........................................................................................................................................................................................................................................................................................................................................................................................................................................................................................................................................................................................................................................................................................................................................................................................................................................................................................................................................................................................................................................ | 10.86% | 12.82% | 10.71% |
MSCI USA Index........................................................................................................................................................................................................................................................................................................................................................................................................................................................................................................................................................................................................................................................................................................................................................................................................................................................................................................................................................................................................................................ | 16.96 | 15.67 | 13.62 |
MSCI USA Low Size Index (Spliced)........................................................................................................................................................................................................................................................................................................................................................................................................................................................................................................................................................................................................................................................................................................................................................................................................................................................................................................................................................................................................................................ | 11.06 | 12.97 | 10.87 |
Key Fund statistics
Net Assets........................................................................................................................................................................................................................................................................................................................................................................................................................................................................................................................................................................................................................................................................................................................................................................................................................................................................................................................................................................................................................................ | $359,301,661 |
|---|---|
Number of Portfolio Holdings........................................................................................................................................................................................................................................................................................................................................................................................................................................................................................................................................................................................................................................................................................................................................................................................................................................................................................................................................................................................................................................ | 547 |
Net Investment Advisory Fees........................................................................................................................................................................................................................................................................................................................................................................................................................................................................................................................................................................................................................................................................................................................................................................................................................................................................................................................................................................................................................................ | $486,152 |
Portfolio Turnover Rate........................................................................................................................................................................................................................................................................................................................................................................................................................................................................................................................................................................................................................................................................................................................................................................................................................................................................................................................................................................................................................................ | 23% |
Sector allocation
Ten largest holdings
Sector | Percent of Total InvestmentsFootnote Reference(a) |
|---|---|
Industrials........................................................................................................................................................................................................................................................................................................................................................................................................................................................................................................................................................................................................................................................................................................................................................................................................................................................................................................................................................................................................................................ | 16.3% |
Information Technology........................................................................................................................................................................................................................................................................................................................................................................................................................................................................................................................................................................................................................................................................................................................................................................................................................................................................................................................................................................................................................................ | 16.2 |
Financials........................................................................................................................................................................................................................................................................................................................................................................................................................................................................................................................................................................................................................................................................................................................................................................................................................................................................................................................................................................................................................................ | 15.4 |
Health Care........................................................................................................................................................................................................................................................................................................................................................................................................................................................................................................................................................................................................................................................................................................................................................................................................................................................................................................................................................................................................................................ | 11.1 |
Consumer Discretionary........................................................................................................................................................................................................................................................................................................................................................................................................................................................................................................................................................................................................................................................................................................................................................................................................................................................................................................................................................................................................................................ | 9.3 |
Consumer Staples........................................................................................................................................................................................................................................................................................................................................................................................................................................................................................................................................................................................................................................................................................................................................................................................................................................................................................................................................................................................................................................ | 6.5 |
Real Estate........................................................................................................................................................................................................................................................................................................................................................................................................................................................................................................................................................................................................................................................................................................................................................................................................................................................................................................................................................................................................................................ | 6.3 |
Utilities........................................................................................................................................................................................................................................................................................................................................................................................................................................................................................................................................................................................................................................................................................................................................................................................................................................................................................................................................................................................................................................ | 5.6 |
Materials........................................................................................................................................................................................................................................................................................................................................................................................................................................................................................................................................................................................................................................................................................................................................................................................................................................................................................................................................................................................................................................ | 4.9 |
Communication Services........................................................................................................................................................................................................................................................................................................................................................................................................................................................................................................................................................................................................................................................................................................................................................................................................................................................................................................................................................................................................................................ | 4.2 |
Energy........................................................................................................................................................................................................................................................................................................................................................................................................................................................................................................................................................................................................................................................................................................................................................................................................................................................................................................................................................................................................................................ | 4.2 |
Security | Percent of Total InvestmentsFootnote Reference(a) |
|---|---|
Chevron Corp......................................................................................................................................................................................................................................................................................................................................................................................................................................................................................................................................................................................................................................................................................................................................................................................................................................................................................................................................................................................................................................... | 0.4% |
Synopsys, Inc......................................................................................................................................................................................................................................................................................................................................................................................................................................................................................................................................................................................................................................................................................................................................................................................................................................................................................................................................................................................................................................... | 0.3 |
ROBLOX Corp., Class A........................................................................................................................................................................................................................................................................................................................................................................................................................................................................................................................................................................................................................................................................................................................................................................................................................................................................................................................................................................................................................................ | 0.3 |
Western Digital Corp......................................................................................................................................................................................................................................................................................................................................................................................................................................................................................................................................................................................................................................................................................................................................................................................................................................................................................................................................................................................................................................... | 0.3 |
Reddit, Inc., Class A........................................................................................................................................................................................................................................................................................................................................................................................................................................................................................................................................................................................................................................................................................................................................................................................................................................................................................................................................................................................................................................ | 0.3 |
Robinhood Markets, Inc., Class A........................................................................................................................................................................................................................................................................................................................................................................................................................................................................................................................................................................................................................................................................................................................................................................................................................................................................................................................................................................................................................................ | 0.3 |
Seagate Technology Holdings PLC........................................................................................................................................................................................................................................................................................................................................................................................................................................................................................................................................................................................................................................................................................................................................................................................................................................................................................................................................................................................................................................ | 0.3 |
Advanced Micro Devices, Inc......................................................................................................................................................................................................................................................................................................................................................................................................................................................................................................................................................................................................................................................................................................................................................................................................................................................................................................................................................................................................................................... | 0.3 |
Warner Bros Discovery, Inc., Series A........................................................................................................................................................................................................................................................................................................................................................................................................................................................................................................................................................................................................................................................................................................................................................................................................................................................................................................................................................................................................................................ | 0.3 |
Estee Lauder Companies, Inc. (The), Class A........................................................................................................................................................................................................................................................................................................................................................................................................................................................................................................................................................................................................................................................................................................................................................................................................................................................................................................................................................................................................................................ | 0.3 |
| Footnote | Description |
Footnote(a) | Excludes money market funds. |
What were the Fund costs for the last year?
(based on a hypothetical $10,000 investment)
Fund name | Costs of a $10,000
investment | Costs paid as a percentage of a
$10,000 investment |
|---|---|---|
iShares MSCI USA Value Factor ETF | $16 | 0.15% |
How did the Fund perform last year?
For the reporting period ended July 31, 2025, the Fund returned 7.93%.
For the same period, the MSCI USA Index returned 16.96% and the MSCI USA Enhanced Value Index (Spliced) returned 8.11%.
What contributed to performance?
Stocks in the financials sector were the most significant contributors to the Fund’s performance during the reporting period, benefiting from resilient equity markets, rising assets under management, strong trends in wealth management, and high trading volumes. As diversified banks experienced improved profitability and demonstrated resilience, they raised dividends and announced share buybacks, providing an additional boost. Also contributing were companies within the communications equipment space in the information technology sector. These firms leveraged artificial intelligence (“AI”) to automate network management, enhance product capabilities, and deliver more efficient and intelligent solutions to enterprise and consumer markets. Within the IT services segment, a technology company benefited from its business shift which included strategic investments in AI, hybrid cloud, and software. Further, strong subscriber growth and fiber network expansion supported a large telecommunications company in the communication sector.
What detracted from performance?
U.S. healthcare stocks modestly detracted from the Fund’s return during the reporting period, as they faced increased regulatory scrutiny and policy upheaval. Managed healthcare firms faced additional challenges due to rising utilization and medical costs, as well as changes in reimbursement levels.
The views expressed reflect the opinions of BlackRock as of the date of this report and are subject to change based on changes in market, economic or other conditions. These views are not intended to be a forecast of future events and are no guarantee of future results.
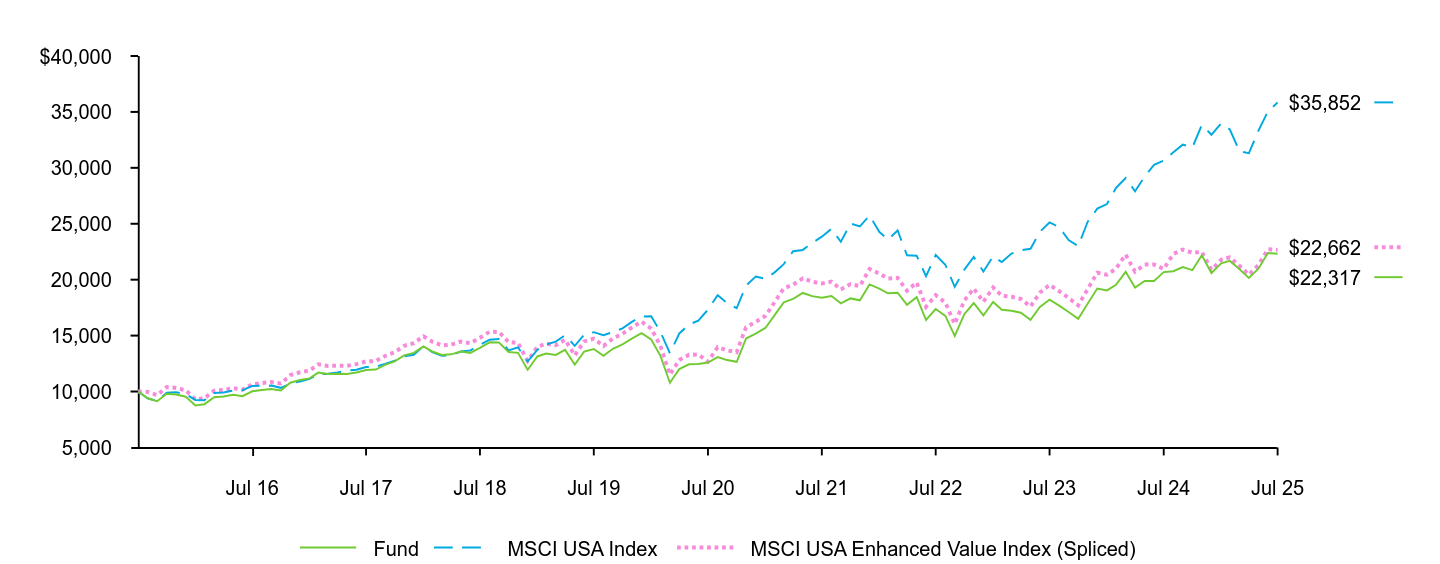
Fund | MSCI USA Index | MSCI USA Enhanced Value Index (Spliced) | |
|---|---|---|---|
Jul 15 | $10,000 | $10,000 | $10,000 |
Aug 15 | $9,400 | $9,393 | $9,961 |
Sep 15 | $9,131 | $9,145 | $9,676 |
Oct 15 | $9,805 | $9,899 | $10,393 |
Nov 15 | $9,738 | $9,934 | $10,324 |
Dec 15 | $9,533 | $9,767 | $10,108 |
Jan 16 | $8,757 | $9,248 | $9,284 |
Feb 16 | $8,866 | $9,228 | $9,402 |
Mar 16 | $9,491 | $9,860 | $10,067 |
Apr 16 | $9,562 | $9,909 | $10,144 |
May 16 | $9,703 | $10,090 | $10,296 |
Jun 16 | $9,584 | $10,116 | $10,171 |
Jul 16 | $10,018 | $10,500 | $10,634 |
Aug 16 | $10,140 | $10,516 | $10,766 |
Sep 16 | $10,214 | $10,527 | $10,846 |
Oct 16 | $10,088 | $10,328 | $10,715 |
Nov 16 | $10,792 | $10,701 | $11,465 |
Dec 16 | $11,028 | $10,901 | $11,719 |
Jan 17 | $11,176 | $11,126 | $11,877 |
Feb 17 | $11,690 | $11,564 | $12,427 |
Mar 17 | $11,556 | $11,580 | $12,286 |
Apr 17 | $11,578 | $11,705 | $12,311 |
May 17 | $11,566 | $11,865 | $12,299 |
Jun 17 | $11,706 | $11,939 | $12,451 |
Jul 17 | $11,932 | $12,183 | $12,693 |
Aug 17 | $11,961 | $12,222 | $12,725 |
Sep 17 | $12,383 | $12,472 | $13,176 |
Oct 17 | $12,698 | $12,757 | $13,515 |
Nov 17 | $13,236 | $13,146 | $14,088 |
Dec 17 | $13,450 | $13,288 | $14,318 |
Jan 18 | $14,033 | $14,051 | $14,940 |
Feb 18 | $13,579 | $13,535 | $14,460 |
Mar 18 | $13,266 | $13,205 | $14,128 |
Apr 18 | $13,323 | $13,258 | $14,190 |
May 18 | $13,585 | $13,581 | $14,470 |
Jun 18 | $13,442 | $13,674 | $14,318 |
Jul 18 | $13,897 | $14,164 | $14,805 |
Aug 18 | $14,405 | $14,633 | $15,349 |
Sep 18 | $14,379 | $14,700 | $15,323 |
Oct 18 | $13,531 | $13,680 | $14,422 |
Nov 18 | $13,457 | $13,946 | $14,344 |
Dec 18 | $11,946 | $12,690 | $12,734 |
Jan 19 | $13,136 | $13,734 | $14,006 |
Feb 19 | $13,390 | $14,193 | $14,278 |
Mar 19 | $13,264 | $14,456 | $14,143 |
Apr 19 | $13,722 | $15,035 | $14,634 |
May 19 | $12,402 | $14,085 | $13,227 |
Jun 19 | $13,575 | $15,074 | $14,479 |
Jul 19 | $13,803 | $15,307 | $14,725 |
Aug 19 | $13,191 | $15,041 | $14,073 |
Sep 19 | $13,822 | $15,308 | $14,744 |
Oct 19 | $14,209 | $15,642 | $15,166 |
Nov 19 | $14,733 | $16,230 | $15,722 |
Dec 19 | $15,227 | $16,705 | $16,257 |
Jan 20 | $14,650 | $16,738 | $15,630 |
Feb 20 | $13,231 | $15,373 | $14,127 |
Mar 20 | $10,781 | $13,423 | $11,511 |
Apr 20 | $12,002 | $15,189 | $12,814 |
May 20 | $12,436 | $15,979 | $13,278 |
Jun 20 | $12,465 | $16,344 | $13,312 |
Jul 20 | $12,584 | $17,314 | $12,676 |
Aug 20 | $13,081 | $18,614 | $13,971 |
Sep 20 | $12,809 | $17,919 | $13,683 |
Oct 20 | $12,658 | $17,453 | $13,522 |
Nov 20 | $14,740 | $19,472 | $15,750 |
Dec 20 | $15,179 | $20,276 | $16,219 |
Jan 21 | $15,680 | $20,087 | $16,757 |
Feb 21 | $16,768 | $20,612 | $17,925 |
Mar 21 | $17,974 | $21,388 | $19,219 |
Apr 21 | $18,285 | $22,552 | $19,552 |
May 21 | $18,813 | $22,660 | $20,120 |
Jun 21 | $18,529 | $23,291 | $19,817 |
Jul 21 | $18,386 | $23,842 | $19,666 |
Aug 21 | $18,538 | $24,545 | $19,829 |
Sep 21 | $17,880 | $23,386 | $19,128 |
Oct 21 | $18,325 | $25,017 | $19,605 |
Nov 21 | $18,157 | $24,766 | $19,429 |
Dec 21 | $19,577 | $25,744 | $20,955 |
Jan 22 | $19,200 | $24,287 | $20,555 |
Feb 22 | $18,779 | $23,575 | $20,107 |
Mar 22 | $18,833 | $24,404 | $20,166 |
Apr 22 | $17,748 | $22,192 | $19,009 |
May 22 | $18,437 | $22,143 | $19,751 |
Jun 22 | $16,406 | $20,310 | $17,576 |
Jul 22 | $17,378 | $22,205 | $18,618 |
Aug 22 | $16,763 | $21,335 | $17,961 |
Sep 22 | $14,963 | $19,356 | $16,035 |
Oct 22 | $16,929 | $20,893 | $18,146 |
Nov 22 | $17,914 | $22,029 | $19,205 |
Dec 22 | $16,810 | $20,734 | $18,024 |
Jan 23 | $18,006 | $22,098 | $19,309 |
Feb 23 | $17,303 | $21,571 | $18,556 |
Mar 23 | $17,228 | $22,337 | $18,478 |
Apr 23 | $17,039 | $22,620 | $18,276 |
May 23 | $16,410 | $22,768 | $17,602 |
Jun 23 | $17,560 | $24,286 | $18,838 |
Jul 23 | $18,206 | $25,122 | $19,534 |
Aug 23 | $17,678 | $24,698 | $18,971 |
Sep 23 | $17,110 | $23,540 | $18,358 |
Oct 23 | $16,498 | $22,998 | $17,710 |
Nov 23 | $17,846 | $25,167 | $19,148 |
Dec 23 | $19,207 | $26,353 | $20,623 |
Jan 24 | $19,044 | $26,763 | $20,440 |
Feb 24 | $19,541 | $28,199 | $20,985 |
Mar 24 | $20,706 | $29,096 | $22,240 |
Apr 24 | $19,293 | $27,895 | $20,724 |
May 24 | $19,880 | $29,228 | $21,346 |
Jun 24 | $19,873 | $30,273 | $21,353 |
Jul 24 | $20,677 | $30,653 | $20,962 |
Aug 24 | $20,756 | $31,392 | $22,299 |
Sep 24 | $21,123 | $32,068 | $22,696 |
Oct 24 | $20,852 | $31,831 | $22,404 |
Nov 24 | $22,182 | $33,823 | $22,491 |
Dec 24 | $20,591 | $32,962 | $20,881 |
Jan 25 | $21,463 | $33,966 | $21,784 |
Feb 25 | $21,682 | $33,431 | $21,997 |
Mar 25 | $20,928 | $31,475 | $21,235 |
Apr 25 | $20,150 | $31,314 | $20,447 |
May 25 | $21,006 | $33,335 | $21,322 |
Jun 25 | $22,381 | $35,050 | $22,726 |
Jul 25 | $22,317 | $35,852 | $22,662 |
........................................................................................................................................................................................................................................................................................................................................................................................................................................................................................................................................................................................................................................................................................................................................................................................................................................................................................................................................................................................................................................ | 1 Year | 5 Years | 10 Years |
|---|---|---|---|
Fund NAV........................................................................................................................................................................................................................................................................................................................................................................................................................................................................................................................................................................................................................................................................................................................................................................................................................................................................................................................................................................................................................................ | 7.93% | 12.14% | 8.36% |
MSCI USA Index........................................................................................................................................................................................................................................................................................................................................................................................................................................................................................................................................................................................................................................................................................................................................................................................................................................................................................................................................................................................................................................ | 16.96 | 15.67 | 13.62 |
MSCI USA Enhanced Value Index (Spliced)........................................................................................................................................................................................................................................................................................................................................................................................................................................................................................................................................................................................................................................................................................................................................................................................................................................................................................................................................................................................................................................ | 8.11 | 12.32 | 8.53 |
Key Fund statistics
Net Assets........................................................................................................................................................................................................................................................................................................................................................................................................................................................................................................................................................................................................................................................................................................................................................................................................................................................................................................................................................................................................................................ | $6,613,217,004 |
|---|---|
Number of Portfolio Holdings........................................................................................................................................................................................................................................................................................................................................................................................................................................................................................................................................................................................................................................................................................................................................................................................................................................................................................................................................................................................................................................ | 152 |
Net Investment Advisory Fees........................................................................................................................................................................................................................................................................................................................................................................................................................................................................................................................................................................................................................................................................................................................................................................................................................................................................................................................................................................................................................................ | $10,316,319 |
Portfolio Turnover Rate........................................................................................................................................................................................................................................................................................................................................................................................................................................................................................................................................................................................................................................................................................................................................................................................................................................................................................................................................................................................................................................ | 30% |
Sector allocation
Ten largest holdings
Sector | Percent of Total InvestmentsFootnote Reference(a) |
|---|---|
Information Technology........................................................................................................................................................................................................................................................................................................................................................................................................................................................................................................................................................................................................................................................................................................................................................................................................................................................................................................................................................................................................................................ | 32.5% |
Financials........................................................................................................................................................................................................................................................................................................................................................................................................................................................................................................................................................................................................................................................................................................................................................................................................................................................................................................................................................................................................................................ | 14.7 |
Consumer Discretionary........................................................................................................................................................................................................................................................................................................................................................................................................................................................................................................................................................................................................................................................................................................................................................................................................................................................................................................................................................................................................................................ | 11.1 |
Industrials........................................................................................................................................................................................................................................................................................................................................................................................................................................................................................................................................................................................................................................................................................................................................................................................................................................................................................................................................................................................................................................ | 9.2 |
Communication Services........................................................................................................................................................................................................................................................................................................................................................................................................................................................................................................................................................................................................................................................................................................................................................................................................................................................................................................................................................................................................................................ | 9.0 |
Health Care........................................................................................................................................................................................................................................................................................................................................................................................................................................................................................................................................................................................................................................................................................................................................................................................................................................................................................................................................................................................................................................ | 8.5 |
Consumer Staples........................................................................................................................................................................................................................................................................................................................................................................................................................................................................................................................................................................................................................................................................................................................................................................................................................................................................................................................................................................................................................................ | 5.4 |
Energy........................................................................................................................................................................................................................................................................................................................................................................................................................................................................................................................................................................................................................................................................................................................................................................................................................................................................................................................................................................................................................................ | 3.1 |
Utilities........................................................................................................................................................................................................................................................................................................................................................................................................................................................................................................................................................................................................................................................................................................................................................................................................................................................................................................................................................................................................................................ | 2.2 |
Real Estate........................................................................................................................................................................................................................................................................................................................................................................................................................................................................................................................................................................................................................................................................................................................................................................................................................................................................................................................................................................................................................................ | 2.2 |
Materials........................................................................................................................................................................................................................................................................................................................................................................................................................................................................................................................................................................................................................................................................................................................................................................................................................................................................................................................................................................................................................................ | 2.1 |
Security | Percent of Total InvestmentsFootnote Reference(a) |
|---|---|
Cisco Systems, Inc......................................................................................................................................................................................................................................................................................................................................................................................................................................................................................................................................................................................................................................................................................................................................................................................................................................................................................................................................................................................................................................... | 7.0% |
Intel Corp......................................................................................................................................................................................................................................................................................................................................................................................................................................................................................................................................................................................................................................................................................................................................................................................................................................................................................................................................................................................................................................... | 3.7 |
General Motors Co......................................................................................................................................................................................................................................................................................................................................................................................................................................................................................................................................................................................................................................................................................................................................................................................................................................................................................................................................................................................................................................... | 3.6 |
Micron Technology, Inc......................................................................................................................................................................................................................................................................................................................................................................................................................................................................................................................................................................................................................................................................................................................................................................................................................................................................................................................................................................................................................................... | 3.3 |
AT&T, Inc......................................................................................................................................................................................................................................................................................................................................................................................................................................................................................................................................................................................................................................................................................................................................................................................................................................................................................................................................................................................................................................... | 3.2 |
Applied Materials, Inc......................................................................................................................................................................................................................................................................................................................................................................................................................................................................................................................................................................................................................................................................................................................................................................................................................................................................................................................................................................................................................................... | 2.9 |
Bank of America Corp......................................................................................................................................................................................................................................................................................................................................................................................................................................................................................................................................................................................................................................................................................................................................................................................................................................................................................................................................................................................................................................... | 2.6 |
Verizon Communications, Inc......................................................................................................................................................................................................................................................................................................................................................................................................................................................................................................................................................................................................................................................................................................................................................................................................................................................................................................................................................................................................................................... | 2.4 |
Citigroup, Inc......................................................................................................................................................................................................................................................................................................................................................................................................................................................................................................................................................................................................................................................................................................................................................................................................................................................................................................................................................................................................................................... | 2.3 |
Ford Motor Co......................................................................................................................................................................................................................................................................................................................................................................................................................................................................................................................................................................................................................................................................................................................................................................................................................................................................................................................................................................................................................................... | 2.2 |
| Footnote | Description |
Footnote(a) | Excludes money market funds. |
What were the Fund costs for the last year?
(based on a hypothetical $10,000 investment)
Fund name | Costs of a $10,000
investment | Costs paid as a percentage of a
$10,000 investment |
|---|---|---|
iShares LifePath Retirement ETF | $0Footnote Reference(a) | 0.00%Footnote Reference(a) |
| Footnote | Description |
Footnote(a) | Excludes fees and expenses incurred indirectly as a result of investments in underlying funds. |
How did the Fund perform last year?
For the reporting period ended July 31, 2025, the Fund returned 8.25%.
For the same period, the Bloomberg U.S. Aggregate Bond Index returned 3.38% and the Russell 1000® Index returned 16.54%.
What contributed to performance?
During the reporting period, equity markets registered solid gains, outperforming the modest gains of fixed-income securities. Across the LifePath® vintages, information technology stocks in the U.S. large-capitalization space were the largest driver of returns. Semiconductor stocks gained amid unprecedented demand for artificial intelligence (“AI”) and generative AI, data center expansions, and continued innovation in chips and network solutions, while systems software firms benefited from strong growth in their respective cloud businesses and increasing adoption of AI technologies. Stocks in the financials sector were also notable contributors, benefiting from resilient equity markets, rising assets under management, strong trends in wealth management, and high trading volumes. International developed stocks also benefited performance. Optimism surrounding a historic fiscal stimulus plan targeting infrastructure and defense supported firms in the German industrials space.
The bond allocation also gained during the reporting period. For the retirement and earlier-dated vintages, inflation-protected securities rose as pricing pressures remained elevated and tariff uncertainty raised future pricing expectations.
What detracted from performance?
Given the strength of equity and bond markets during the reporting period, there were no material detractors to the performance of any of the vintages.
The views expressed reflect the opinions of BlackRock as of the date of this report and are subject to change based on changes in market, economic or other conditions. These views are not intended to be a forecast of future events and are no guarantee of future results.
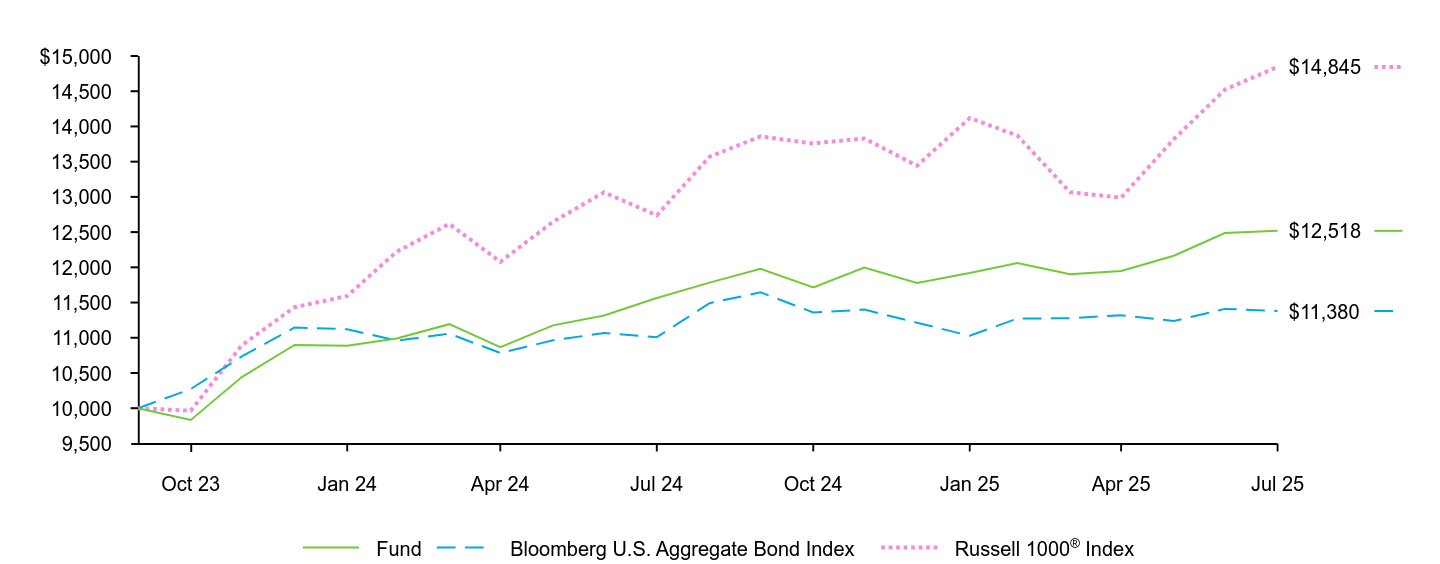
Fund | Bloomberg U.S. Aggregate Bond Index | Russell 1000® Index | |
|---|---|---|---|
Sep 23 | $10,000 | $10,000 | $10,000 |
Oct 23 | $9,833 | $10,272 | $9,964 |
Nov 23 | $10,443 | $10,735 | $10,894 |
Dec 23 | $10,899 | $11,146 | $11,434 |
Jan 24 | $10,886 | $11,121 | $11,593 |
Feb 24 | $10,989 | $10,959 | $12,221 |
Mar 24 | $11,193 | $11,060 | $12,616 |
Apr 24 | $10,868 | $10,783 | $12,078 |
May 24 | $11,176 | $10,964 | $12,647 |
Jun 24 | $11,317 | $11,067 | $13,065 |
Jul 24 | $11,565 | $11,009 | $12,738 |
Aug 24 | $11,783 | $11,491 | $13,569 |
Sep 24 | $11,979 | $11,645 | $13,859 |
Oct 24 | $11,714 | $11,359 | $13,759 |
Nov 24 | $11,996 | $11,400 | $13,830 |
Dec 24 | $11,778 | $11,214 | $13,443 |
Jan 25 | $11,919 | $11,028 | $14,120 |
Feb 25 | $12,061 | $11,273 | $13,871 |
Mar 25 | $11,901 | $11,277 | $13,066 |
Apr 25 | $11,948 | $11,321 | $12,989 |
May 25 | $12,165 | $11,237 | $13,821 |
Jun 25 | $12,487 | $11,410 | $14,522 |
Jul 25 | $12,518 | $11,380 | $14,845 |
........................................................................................................................................................................................................................................................................................................................................................................................................................................................................................................................................................................................................................................................................................................................................................................................................................................................................................................................................................................................................................................ | 1 Year | Since Fund
Inception |
|---|---|---|
Fund NAV........................................................................................................................................................................................................................................................................................................................................................................................................................................................................................................................................................................................................................................................................................................................................................................................................................................................................................................................................................................................................................................ | 8.25% | 13.38% |
Bloomberg U.S. Aggregate Bond Index........................................................................................................................................................................................................................................................................................................................................................................................................................................................................................................................................................................................................................................................................................................................................................................................................................................................................................................................................................................................................................................ | 3.38 | 7.50 |
Russell 1000® Index........................................................................................................................................................................................................................................................................................................................................................................................................................................................................................................................................................................................................................................................................................................................................................................................................................................................................................................................................................................................................................................ | 16.54 | 24.71 |
Key Fund statistics
Net Assets........................................................................................................................................................................................................................................................................................................................................................................................................................................................................................................................................................................................................................................................................................................................................................................................................................................................................................................................................................................................................................................ | $24,928,771 |
|---|---|
Number of Portfolio Holdings........................................................................................................................................................................................................................................................................................................................................................................................................................................................................................................................................................................................................................................................................................................................................................................................................................................................................................................................................................................................................................................ | 14 |
Net Investment Advisory Fees........................................................................................................................................................................................................................................................................................................................................................................................................................................................................................................................................................................................................................................................................................................................................................................................................................................................................................................................................................................................................................................ | $0 |
Portfolio Turnover Rate........................................................................................................................................................................................................................................................................................................................................................................................................................................................................................................................................................................................................................................................................................................................................................................................................................................................................................................................................................................................................................................ | 18% |
Portfolio composition
Ten largest holdings
Asset class | Percent of Total InvestmentsFootnote Reference(a) |
|---|---|
Domestic Fixed Income........................................................................................................................................................................................................................................................................................................................................................................................................................................................................................................................................................................................................................................................................................................................................................................................................................................................................................................................................................................................................................................ | 59.7% |
Domestic Equity........................................................................................................................................................................................................................................................................................................................................................................................................................................................................................................................................................................................................................................................................................................................................................................................................................................................................................................................................................................................................................................ | 25.5 |
International Equity........................................................................................................................................................................................................................................................................................................................................................................................................................................................................................................................................................................................................................................................................................................................................................................................................................................................................................................................................................................................................................................ | 14.8 |
Security | Percent of Total InvestmentsFootnote Reference(a) |
|---|---|
iShares Russell 1000 ETF........................................................................................................................................................................................................................................................................................................................................................................................................................................................................................................................................................................................................................................................................................................................................................................................................................................................................................................................................................................................................................................ | 24.2% |
iShares U.S. Treasury Bond ETF........................................................................................................................................................................................................................................................................................................................................................................................................................................................................................................................................................................................................................................................................................................................................................................................................................................................................................................................................................................................................................................ | 23.1 |
iShares MBS ETF........................................................................................................................................................................................................................................................................................................................................................................................................................................................................................................................................................................................................................................................................................................................................................................................................................................................................................................................................................................................................................................ | 13.0 |
iShares 0-5 Year TIPS Bond ETF........................................................................................................................................................................................................................................................................................................................................................................................................................................................................................................................................................................................................................................................................................................................................................................................................................................................................................................................................................................................................................................ | 10.5 |
iShares Core MSCI International Developed Markets ETF........................................................................................................................................................................................................................................................................................................................................................................................................................................................................................................................................................................................................................................................................................................................................................................................................................................................................................................................................................................................................................................ | 9.6 |
iShares 1-5 Year Investment Grade Corporate Bond ETF........................................................................................................................................................................................................................................................................................................................................................................................................................................................................................................................................................................................................................................................................................................................................................................................................................................................................................................................................................................................................................................ | 4.5 |
iShares Core MSCI Emerging Markets ETF........................................................................................................................................................................................................................................................................................................................................................................................................................................................................................................................................................................................................................................................................................................................................................................................................................................................................................................................................................................................................................................ | 3.9 |
iShares 10-20 Year Treasury Bond ETF........................................................................................................................................................................................................................................................................................................................................................................................................................................................................................................................................................................................................................................................................................................................................................................................................................................................................................................................................................................................................................................ | 3.5 |
iShares 5-10 Year Investment Grade Corporate Bond ETF........................................................................................................................................................................................................................................................................................................................................................................................................................................................................................................................................................................................................................................................................................................................................................................................................................................................................................................................................................................................................................................ | 3.0 |
iShares 10+ Year Investment Grade Corporate Bond ETF........................................................................................................................................................................................................................................................................................................................................................................................................................................................................................................................................................................................................................................................................................................................................................................................................................................................................................................................................................................................................................................ | 2.1 |
| Footnote | Description |
Footnote(a) | Excludes money market funds. |
What were the Fund costs for the last year?
(based on a hypothetical $10,000 investment)
Fund name | Costs of a $10,000
investment | Costs paid as a percentage of a
$10,000 investment |
|---|---|---|
iShares LifePath Target Date 2030 ETF | $0Footnote Reference(a) | 0.00%Footnote Reference(a) |
| Footnote | Description |
Footnote(a) | Excludes fees and expenses incurred indirectly as a result of investments in underlying funds. |
How did the Fund perform last year?
For the reporting period ended July 31, 2025, the Fund returned 9.62%.
For the same period, the Russell 1000® Index returned 16.54% and the Bloomberg U.S. Aggregate Bond Index returned 3.38%.
What contributed to performance?
During the reporting period, equity markets registered solid gains, outperforming the modest gains of fixed-income securities. Across the LifePath® vintages, information technology stocks in the U.S. large-capitalization space were the largest driver of returns. Semiconductor stocks gained amid unprecedented demand for artificial intelligence (“AI”) and generative AI, data center expansions, and continued innovation in chips and network solutions, while systems software firms benefited from strong growth in their respective cloud businesses and increasing adoption of AI technologies. Stocks in the financials sector were also notable contributors, benefiting from resilient equity markets, rising assets under management, strong trends in wealth management, and high trading volumes. International developed stocks also benefited performance. Optimism surrounding a historic fiscal stimulus plan targeting infrastructure and defense supported firms in the German industrials space.
The bond allocation also gained during the reporting period. For the retirement and earlier-dated vintages, inflation-protected securities rose as pricing pressures remained elevated and tariff uncertainty raised future pricing expectations.
What detracted from performance?
Given the strength of equity and bond markets during the reporting period, there were no material detractors to the performance of any of the vintages.
The views expressed reflect the opinions of BlackRock as of the date of this report and are subject to change based on changes in market, economic or other conditions. These views are not intended to be a forecast of future events and are no guarantee of future results.
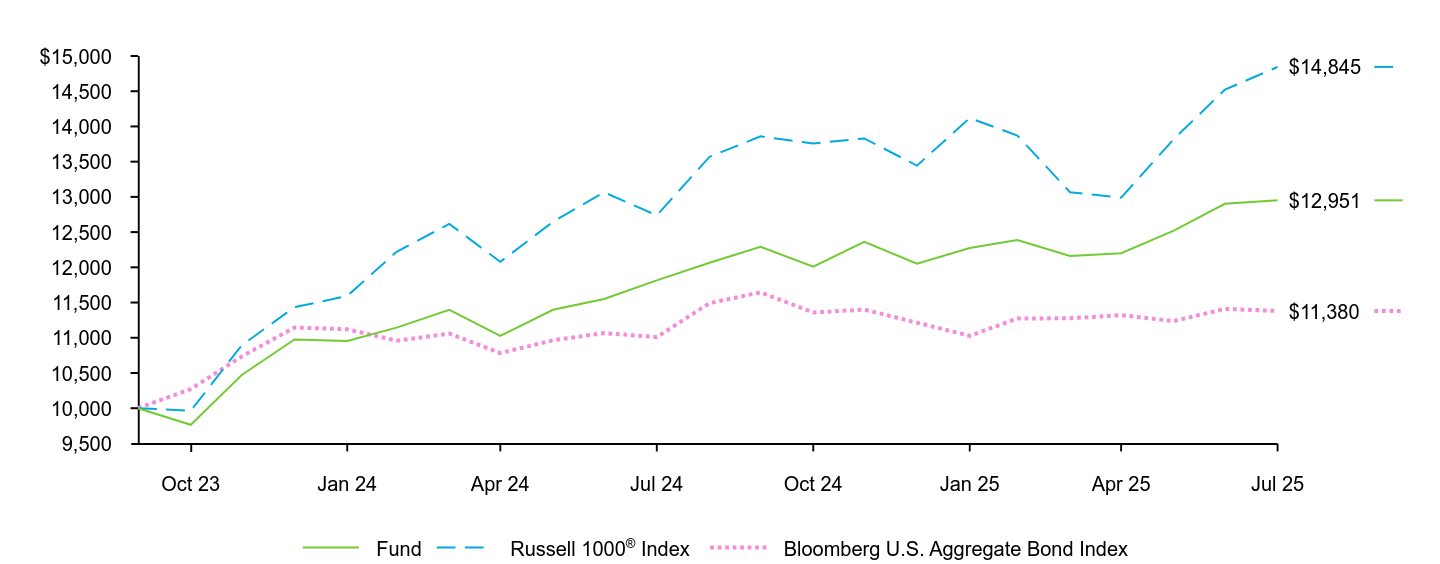
Fund | Russell 1000® Index | Bloomberg U.S. Aggregate Bond Index | |
|---|---|---|---|
Sep 23 | $10,000 | $10,000 | $10,000 |
Oct 23 | $9,765 | $9,964 | $10,272 |
Nov 23 | $10,472 | $10,894 | $10,735 |
Dec 23 | $10,976 | $11,434 | $11,146 |
Jan 24 | $10,955 | $11,593 | $11,121 |
Feb 24 | $11,144 | $12,221 | $10,959 |
Mar 24 | $11,397 | $12,616 | $11,060 |
Apr 24 | $11,028 | $12,078 | $10,783 |
May 24 | $11,398 | $12,647 | $10,964 |
Jun 24 | $11,550 | $13,065 | $11,067 |
Jul 24 | $11,815 | $12,738 | $11,009 |
Aug 24 | $12,066 | $13,569 | $11,491 |
Sep 24 | $12,290 | $13,859 | $11,645 |
Oct 24 | $12,010 | $13,759 | $11,359 |
Nov 24 | $12,361 | $13,830 | $11,400 |
Dec 24 | $12,051 | $13,443 | $11,214 |
Jan 25 | $12,273 | $14,120 | $11,028 |
Feb 25 | $12,389 | $13,871 | $11,273 |
Mar 25 | $12,161 | $13,066 | $11,277 |
Apr 25 | $12,200 | $12,989 | $11,321 |
May 25 | $12,521 | $13,821 | $11,237 |
Jun 25 | $12,901 | $14,522 | $11,410 |
Jul 25 | $12,951 | $14,845 | $11,380 |
........................................................................................................................................................................................................................................................................................................................................................................................................................................................................................................................................................................................................................................................................................................................................................................................................................................................................................................................................................................................................................................ | 1 Year | Since Fund
Inception |
|---|---|---|
Fund NAV........................................................................................................................................................................................................................................................................................................................................................................................................................................................................................................................................................................................................................................................................................................................................................................................................................................................................................................................................................................................................................................ | 9.62% | 15.55% |
Russell 1000® Index........................................................................................................................................................................................................................................................................................................................................................................................................................................................................................................................................................................................................................................................................................................................................................................................................................................................................................................................................................................................................................................ | 16.54 | 24.71 |
Bloomberg U.S. Aggregate Bond Index........................................................................................................................................................................................................................................................................................................................................................................................................................................................................................................................................................................................................................................................................................................................................................................................................................................................................................................................................................................................................................................ | 3.38 | 7.50 |
Key Fund statistics
Net Assets........................................................................................................................................................................................................................................................................................................................................................................................................................................................................................................................................................................................................................................................................................................................................................................................................................................................................................................................................................................................................................................ | $30,927,104 |
|---|---|
Number of Portfolio Holdings........................................................................................................................................................................................................................................................................................................................................................................................................................................................................................................................................................................................................................................................................................................................................................................................................................................................................................................................................................................................................................................ | 15 |
Net Investment Advisory Fees........................................................................................................................................................................................................................................................................................................................................................................................................................................................................................................................................................................................................................................................................................................................................................................................................................................................................................................................................................................................................................................ | $0 |
Portfolio Turnover Rate........................................................................................................................................................................................................................................................................................................................................................................................................................................................................................................................................................................................................................................................................................................................................................................................................................................................................................................................................................................................................................................ | 24% |
Portfolio composition
Ten largest holdings
Asset class | Percent of Total InvestmentsFootnote Reference(a) |
|---|---|
Domestic Fixed Income........................................................................................................................................................................................................................................................................................................................................................................................................................................................................................................................................................................................................................................................................................................................................................................................................................................................................................................................................................................................................................................ | 47.6% |
Domestic Equity........................................................................................................................................................................................................................................................................................................................................................................................................................................................................................................................................................................................................................................................................................................................................................................................................................................................................................................................................................................................................................................ | 32.8 |
International Equity........................................................................................................................................................................................................................................................................................................................................................................................................................................................................................................................................................................................................................................................................................................................................................................................................................................................................................................................................................................................................................................ | 19.6 |
Security | Percent of Total InvestmentsFootnote Reference(a) |
|---|---|
iShares Russell 1000 ETF........................................................................................................................................................................................................................................................................................................................................................................................................................................................................................................................................................................................................................................................................................................................................................................................................................................................................................................................................................................................................................................ | 30.5% |
iShares U.S. Treasury Bond ETF........................................................................................................................................................................................................................................................................................................................................................................................................................................................................................................................................................................................................................................................................................................................................................................................................................................................................................................................................................................................................................................ | 13.7 |
iShares Core MSCI International Developed Markets ETF........................................................................................................................................................................................................................................................................................................................................................................................................................................................................................................................................................................................................................................................................................................................................................................................................................................................................................................................................................................................................................................ | 12.8 |
iShares MBS ETF........................................................................................................................................................................................................................................................................................................................................................................................................................................................................................................................................................................................................................................................................................................................................................................................................................................................................................................................................................................................................................................ | 10.3 |
iShares 0-5 Year TIPS Bond ETF........................................................................................................................................................................................................................................................................................................................................................................................................................................................................................................................................................................................................................................................................................................................................................................................................................................................................................................................................................................................................................................ | 8.5 |
iShares Core MSCI Emerging Markets ETF........................................................................................................................................................................................................................................................................................................................................................................................................................................................................................................................................................................................................................................................................................................................................................................................................................................................................................................................................................................................................................................ | 5.2 |
iShares 1-5 Year Investment Grade Corporate Bond ETF........................................................................................................................................................................................................................................................................................................................................................................................................................................................................................................................................................................................................................................................................................................................................................................................................................................................................................................................................................................................................................................ | 5.2 |
iShares 10-20 Year Treasury Bond ETF........................................................................................................................................................................................................................................................................................................................................................................................................................................................................................................................................................................................................................................................................................................................................................................................................................................................................................................................................................................................................................................ | 3.9 |
iShares 5-10 Year Investment Grade Corporate Bond ETF........................................................................................................................................................................................................................................................................................................................................................................................................................................................................................................................................................................................................................................................................................................................................................................................................................................................................................................................................................................................................................................ | 3.4 |
iShares 10+ Year Investment Grade Corporate Bond ETF........................................................................................................................................................................................................................................................................................................................................................................................................................................................................................................................................................................................................................................................................................................................................................................................................................................................................................................................................................................................................................................ | 2.6 |
| Footnote | Description |
Footnote(a) | Excludes money market funds. |
What were the Fund costs for the last year?
(based on a hypothetical $10,000 investment)
Fund name | Costs of a $10,000
investment | Costs paid as a percentage of a
$10,000 investment |
|---|---|---|
iShares LifePath Target Date 2035 ETF | $0Footnote Reference(a) | 0.00%Footnote Reference(a) |
| Footnote | Description |
Footnote(a) | Excludes fees and expenses incurred indirectly as a result of investments in underlying funds. |
How did the Fund perform last year?
For the reporting period ended July 31, 2025, the Fund returned 10.81%.
For the same period, the Russell 1000® Index returned 16.54% and the Bloomberg U.S. Aggregate Bond Index returned 3.38%.
What contributed to performance?
During the reporting period, equity markets registered solid gains, outperforming the modest gains of fixed-income securities. Across the LifePath® vintages, information technology stocks in the U.S. large-capitalization space were the largest driver of returns. Semiconductor stocks gained amid unprecedented demand for artificial intelligence (“AI”) and generative AI, data center expansions, and continued innovation in chips and network solutions, while systems software firms benefited from strong growth in their respective cloud businesses and increasing adoption of AI technologies. Stocks in the financials sector were also notable contributors, benefiting from resilient equity markets, rising assets under management, strong trends in wealth management, and high trading volumes. International developed stocks also benefited performance. Optimism surrounding a historic fiscal stimulus plan targeting infrastructure and defense supported firms in the German industrials space.
The bond allocation also gained during the reporting period. For the retirement and earlier-dated vintages, inflation-protected securities rose as pricing pressures remained elevated and tariff uncertainty raised future pricing expectations.
What detracted from performance?
Given the strength of equity and bond markets during the reporting period, there were no material detractors to the performance of any of the vintages.
The views expressed reflect the opinions of BlackRock as of the date of this report and are subject to change based on changes in market, economic or other conditions. These views are not intended to be a forecast of future events and are no guarantee of future results.
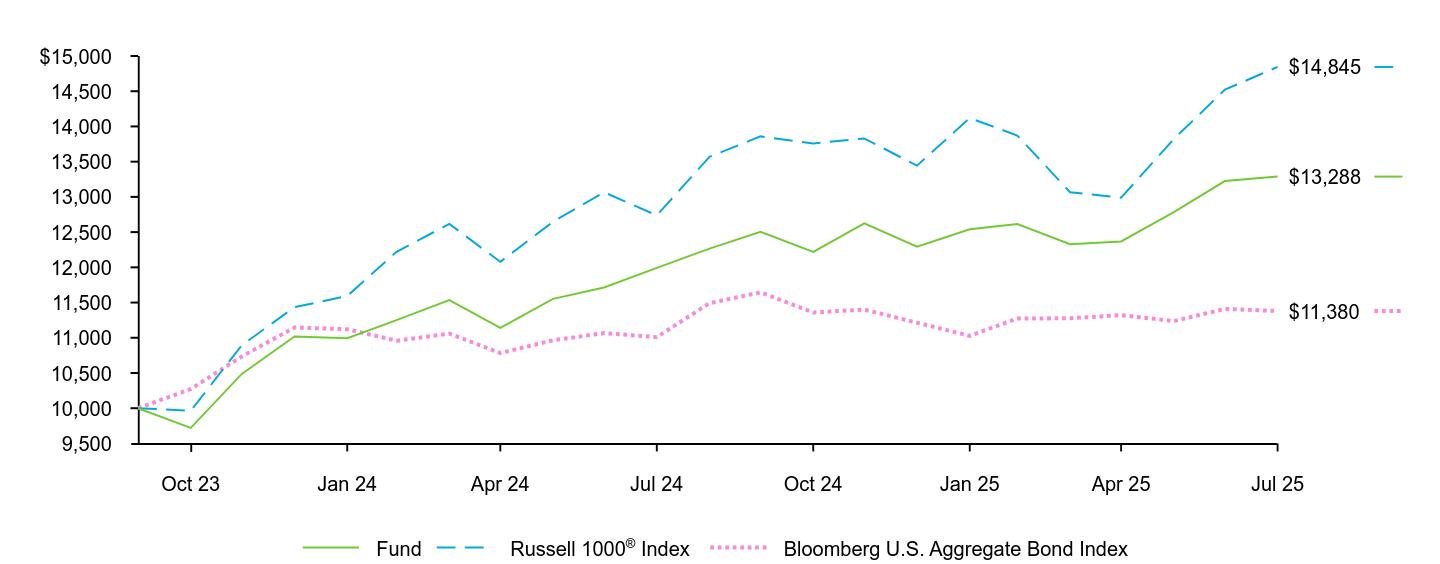
Fund | Russell 1000® Index | Bloomberg U.S. Aggregate Bond Index | |
|---|---|---|---|
Sep 23 | $10,000 | $10,000 | $10,000 |
Oct 23 | $9,720 | $9,964 | $10,272 |
Nov 23 | $10,487 | $10,894 | $10,735 |
Dec 23 | $11,018 | $11,434 | $11,146 |
Jan 24 | $10,994 | $11,593 | $11,121 |
Feb 24 | $11,250 | $12,221 | $10,959 |
Mar 24 | $11,536 | $12,616 | $11,060 |
Apr 24 | $11,141 | $12,078 | $10,783 |
May 24 | $11,552 | $12,647 | $10,964 |
Jun 24 | $11,713 | $13,065 | $11,067 |
Jul 24 | $11,992 | $12,738 | $11,009 |
Aug 24 | $12,265 | $13,569 | $11,491 |
Sep 24 | $12,504 | $13,859 | $11,645 |
Oct 24 | $12,218 | $13,759 | $11,359 |
Nov 24 | $12,625 | $13,830 | $11,400 |
Dec 24 | $12,293 | $13,443 | $11,214 |
Jan 25 | $12,540 | $14,120 | $11,028 |
Feb 25 | $12,616 | $13,871 | $11,273 |
Mar 25 | $12,327 | $13,066 | $11,277 |
Apr 25 | $12,367 | $12,989 | $11,321 |
May 25 | $12,785 | $13,821 | $11,237 |
Jun 25 | $13,225 | $14,522 | $11,410 |
Jul 25 | $13,288 | $14,845 | $11,380 |
........................................................................................................................................................................................................................................................................................................................................................................................................................................................................................................................................................................................................................................................................................................................................................................................................................................................................................................................................................................................................................................ | 1 Year | Since Fund
Inception |
|---|---|---|
Fund NAV........................................................................................................................................................................................................................................................................................................................................................................................................................................................................................................................................................................................................................................................................................................................................................................................................................................................................................................................................................................................................................................ | 10.81% | 17.22% |
Russell 1000® Index........................................................................................................................................................................................................................................................................................................................................................................................................................................................................................................................................................................................................................................................................................................................................................................................................................................................................................................................................................................................................................................ | 16.54 | 24.71 |
Bloomberg U.S. Aggregate Bond Index........................................................................................................................................................................................................................................................................................................................................................................................................................................................................................................................................................................................................................................................................................................................................................................................................................................................................................................................................................................................................................................ | 3.38 | 7.50 |
Key Fund statistics
Net Assets........................................................................................................................................................................................................................................................................................................................................................................................................................................................................................................................................................................................................................................................................................................................................................................................................................................................................................................................................................................................................................................ | $47,190,543 |
|---|---|
Number of Portfolio Holdings........................................................................................................................................................................................................................................................................................................................................................................................................................................................................................................................................................................................................................................................................................................................................................................................................................................................................................................................................................................................................................................ | 15 |
Net Investment Advisory Fees........................................................................................................................................................................................................................................................................................................................................................................................................................................................................................................................................................................................................................................................................................................................................................................................................................................................................................................................................................................................................................................ | $0 |
Portfolio Turnover Rate........................................................................................................................................................................................................................................................................................................................................................................................................................................................................................................................................................................................................................................................................................................................................................................................................................................................................................................................................................................................................................................ | 19% |
Portfolio composition
Ten largest holdings
Asset class | Percent of Total InvestmentsFootnote Reference(a) |
|---|---|
Domestic Equity........................................................................................................................................................................................................................................................................................................................................................................................................................................................................................................................................................................................................................................................................................................................................................................................................................................................................................................................................................................................................................................ | 40.3% |
Domestic Fixed Income........................................................................................................................................................................................................................................................................................................................................................................................................................................................................................................................................................................................................................................................................................................................................................................................................................................................................................................................................................................................................................................ | 35.5 |
International Equity........................................................................................................................................................................................................................................................................................................................................................................................................................................................................................................................................................................................................................................................................................................................................................................................................................................................................................................................................................................................................................................ | 24.2 |
Security | Percent of Total InvestmentsFootnote Reference(a) |
|---|---|
iShares Russell 1000 ETF........................................................................................................................................................................................................................................................................................................................................................................................................................................................................................................................................................................................................................................................................................................................................................................................................................................................................................................................................................................................................................................ | 36.5% |
iShares Core MSCI International Developed Markets ETF........................................................................................................................................................................................................................................................................................................................................................................................................................................................................................................................................................................................................................................................................................................................................................................................................................................................................................................................................................................................................................................ | 15.9 |
iShares U.S. Treasury Bond ETF........................................................................................................................................................................................................................................................................................................................................................................................................................................................................................................................................................................................................................................................................................................................................................................................................................................................................................................................................................................................................................................ | 13.7 |
iShares MBS ETF........................................................................................................................................................................................................................................................................................................................................................................................................................................................................................................................................................................................................................................................................................................................................................................................................................................................................................................................................................................................................................................ | 9.3 |
iShares Core MSCI Emerging Markets ETF........................................................................................................................................................................................................................................................................................................................................................................................................................................................................................................................................................................................................................................................................................................................................................................................................................................................................................................................................................................................................................................ | 6.5 |
iShares 1-5 Year Investment Grade Corporate Bond ETF........................................................................................................................................................................................................................................................................................................................................................................................................................................................................................................................................................................................................................................................................................................................................................................................................................................................................................................................................................................................................................................ | 4.6 |
iShares 5-10 Year Investment Grade Corporate Bond ETF........................................................................................................................................................................................................................................................................................................................................................................................................................................................................................................................................................................................................................................................................................................................................................................................................................................................................................................................................................................................................................................ | 3.0 |
iShares 10+ Year Investment Grade Corporate Bond ETF........................................................................................................................................................................................................................................................................................................................................................................................................................................................................................................................................................................................................................................................................................................................................................................................................................................................................................................................................................................................................................................ | 3.0 |
iShares Core U.S. REIT ETF........................................................................................................................................................................................................................................................................................................................................................................................................................................................................................................................................................................................................................................................................................................................................................................................................................................................................................................................................................................................................................................ | 2.7 |
iShares Global Infrastructure ETF........................................................................................................................................................................................................................................................................................................................................................................................................................................................................................................................................................................................................................................................................................................................................................................................................................................................................................................................................................................................................................................ | 1.8 |
| Footnote | Description |
Footnote(a) | Excludes money market funds. |
What were the Fund costs for the last year?
(based on a hypothetical $10,000 investment)
Fund name | Costs of a $10,000
investment | Costs paid as a percentage of a
$10,000 investment |
|---|---|---|
iShares LifePath Target Date 2040 ETF | $0Footnote Reference(a) | 0.00%Footnote Reference(a) |
| Footnote | Description |
Footnote(a) | Excludes fees and expenses incurred indirectly as a result of investments in underlying funds. |
How did the Fund perform last year?
For the reporting period ended July 31, 2025, the Fund returned 12.01%.
For the same period, the Russell 1000® Index returned 16.54% and the Bloomberg U.S. Aggregate Bond Index returned 3.38%.
What contributed to performance?
During the reporting period, equity markets registered solid gains, outperforming the modest gains of fixed-income securities. Across the LifePath® vintages, information technology stocks in the U.S. large-capitalization space were the largest driver of returns. Semiconductor stocks gained amid unprecedented demand for artificial intelligence (“AI”) and generative AI, data center expansions, and continued innovation in chips and network solutions, while systems software firms benefited from strong growth in their respective cloud businesses and increasing adoption of AI technologies. Stocks in the financials sector were also notable contributors, benefiting from resilient equity markets, rising assets under management, strong trends in wealth management, and high trading volumes. International developed stocks also benefited performance. Optimism surrounding a historic fiscal stimulus plan targeting infrastructure and defense supported firms in the German industrials space.
The bond allocation also gained during the reporting period. For the retirement and earlier-dated vintages, inflation-protected securities rose as pricing pressures remained elevated and tariff uncertainty raised future pricing expectations.
What detracted from performance?
Given the strength of equity and bond markets during the reporting period, there were no material detractors to the performance of any of the vintages.
The views expressed reflect the opinions of BlackRock as of the date of this report and are subject to change based on changes in market, economic or other conditions. These views are not intended to be a forecast of future events and are no guarantee of future results.
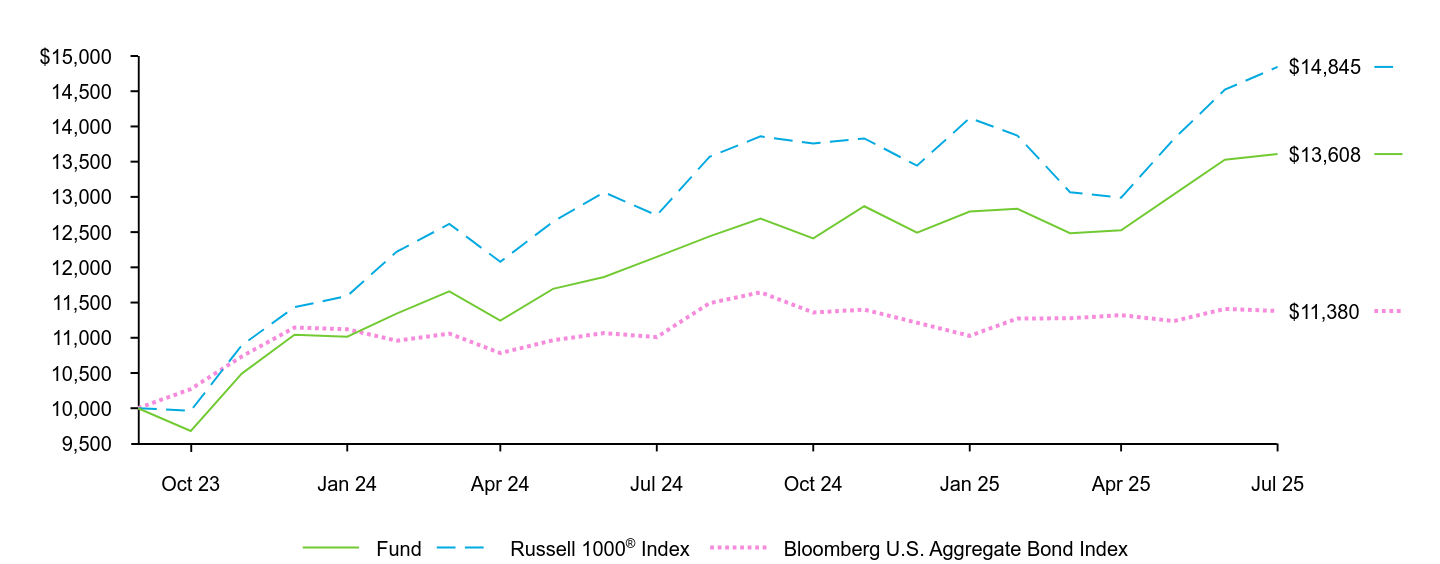
Fund | Russell 1000® Index | Bloomberg U.S. Aggregate Bond Index | |
|---|---|---|---|
Sep 23 | $10,000 | $10,000 | $10,000 |
Oct 23 | $9,677 | $9,964 | $10,272 |
Nov 23 | $10,491 | $10,894 | $10,735 |
Dec 23 | $11,044 | $11,434 | $11,146 |
Jan 24 | $11,016 | $11,593 | $11,121 |
Feb 24 | $11,342 | $12,221 | $10,959 |
Mar 24 | $11,660 | $12,616 | $11,060 |
Apr 24 | $11,244 | $12,078 | $10,783 |
May 24 | $11,694 | $12,647 | $10,964 |
Jun 24 | $11,863 | $13,065 | $11,067 |
Jul 24 | $12,149 | $12,738 | $11,009 |
Aug 24 | $12,440 | $13,569 | $11,491 |
Sep 24 | $12,694 | $13,859 | $11,645 |
Oct 24 | $12,410 | $13,759 | $11,359 |
Nov 24 | $12,867 | $13,830 | $11,400 |
Dec 24 | $12,493 | $13,443 | $11,214 |
Jan 25 | $12,791 | $14,120 | $11,028 |
Feb 25 | $12,831 | $13,871 | $11,273 |
Mar 25 | $12,485 | $13,066 | $11,277 |
Apr 25 | $12,525 | $12,989 | $11,321 |
May 25 | $13,036 | $13,821 | $11,237 |
Jun 25 | $13,527 | $14,522 | $11,410 |
Jul 25 | $13,608 | $14,845 | $11,380 |
........................................................................................................................................................................................................................................................................................................................................................................................................................................................................................................................................................................................................................................................................................................................................................................................................................................................................................................................................................................................................................................ | 1 Year | Since Fund
Inception |
|---|---|---|
Fund NAV........................................................................................................................................................................................................................................................................................................................................................................................................................................................................................................................................................................................................................................................................................................................................................................................................................................................................................................................................................................................................................................ | 12.01% | 18.79% |
Russell 1000® Index........................................................................................................................................................................................................................................................................................................................................................................................................................................................................................................................................................................................................................................................................................................................................................................................................................................................................................................................................................................................................................................ | 16.54 | 24.71 |
Bloomberg U.S. Aggregate Bond Index........................................................................................................................................................................................................................................................................................................................................................................................................................................................................................................................................................................................................................................................................................................................................................................................................................................................................................................................................................................................................................................ | 3.38 | 7.50 |
Key Fund statistics
Net Assets........................................................................................................................................................................................................................................................................................................................................................................................................................................................................................................................................................................................................................................................................................................................................................................................................................................................................................................................................................................................................................................ | $39,178,217 |
|---|---|
Number of Portfolio Holdings........................................................................................................................................................................................................................................................................................................................................................................................................................................................................................................................................................................................................................................................................................................................................................................................................................................................................................................................................................................................................................................ | 15 |
Net Investment Advisory Fees........................................................................................................................................................................................................................................................................................................................................................................................................................................................................................................................................................................................................................................................................................................................................................................................................................................................................................................................................................................................................................................ | $0 |
Portfolio Turnover Rate........................................................................................................................................................................................................................................................................................................................................................................................................................................................................................................................................................................................................................................................................................................................................................................................................................................................................................................................................................................................................................................ | 17% |
Portfolio composition
Ten largest holdings
Asset class | Percent of Total InvestmentsFootnote Reference(a) |
|---|---|
Domestic Equity........................................................................................................................................................................................................................................................................................................................................................................................................................................................................................................................................................................................................................................................................................................................................................................................................................................................................................................................................................................................................................................ | 47.3% |
International Equity........................................................................................................................................................................................................................................................................................................................................................................................................................................................................................................................................................................................................................................................................................................................................................................................................................................................................................................................................................................................................................................ | 28.6 |
Domestic Fixed Income........................................................................................................................................................................................................................................................................................................................................................................................................................................................................................................................................................................................................................................................................................................................................................................................................................................................................................................................................................................................................................................ | 24.1 |
Security | Percent of Total InvestmentsFootnote Reference(a) |
|---|---|
iShares Russell 1000 ETF........................................................................................................................................................................................................................................................................................................................................................................................................................................................................................................................................................................................................................................................................................................................................................................................................................................................................................................................................................................................................................................ | 42.2% |
iShares Core MSCI International Developed Markets ETF........................................................................................................................................................................................................................................................................................................................................................................................................................................................................................................................................................................................................................................................................................................................................................................................................................................................................................................................................................................................................................................ | 18.9 |
iShares U.S. Treasury Bond ETF........................................................................................................................................................................................................................................................................................................................................................................................................................................................................................................................................................................................................................................................................................................................................................................................................................................................................................................................................................................................................................................ | 8.5 |
iShares Core MSCI Emerging Markets ETF........................................................................................................................................................................................................................................................................................................................................................................................................................................................................................................................................................................................................................................................................................................................................................................................................................................................................................................................................................................................................................................ | 7.7 |
iShares MBS ETF........................................................................................................................................................................................................................................................................................................................................................................................................................................................................................................................................................................................................................................................................................................................................................................................................................................................................................................................................................................................................................................ | 6.2 |
iShares Core U.S. REIT ETF........................................................................................................................................................................................................................................................................................................................................................................................................................................................................................................................................................................................................................................................................................................................................................................................................................................................................................................................................................................................................................................ | 3.4 |
iShares 10+ Year Investment Grade Corporate Bond ETF........................................................................................................................................................................................................................................................................................................................................................................................................................................................................................................................................................................................................................................................................................................................................................................................................................................................................................................................................................................................................................................ | 3.2 |
iShares 1-5 Year Investment Grade Corporate Bond ETF........................................................................................................................................................................................................................................................................................................................................................................................................................................................................................................................................................................................................................................................................................................................................................................................................................................................................................................................................................................................................................................ | 2.6 |
iShares Global Infrastructure ETF........................................................................................................................................................................................................................................................................................................................................................................................................................................................................................................................................................................................................................................................................................................................................................................................................................................................................................................................................................................................................................................ | 2.0 |
iShares Russell 2000 ETF........................................................................................................................................................................................................................................................................................................................................................................................................................................................................................................................................................................................................................................................................................................................................................................................................................................................................................................................................................................................................................................ | 1.7 |
| Footnote | Description |
Footnote(a) | Excludes money market funds. |
What were the Fund costs for the last year?
(based on a hypothetical $10,000 investment)
Fund name | Costs of a $10,000
investment | Costs paid as a percentage of a
$10,000 investment |
|---|---|---|
iShares LifePath Target Date 2045 ETF | $0Footnote Reference(a) | 0.00%Footnote Reference(a) |
| Footnote | Description |
Footnote(a) | Excludes fees and expenses incurred indirectly as a result of investments in underlying funds. |
How did the Fund perform last year?
For the reporting period ended July 31, 2025, the Fund returned 12.96%.
For the same period, the Russell 1000® Index returned 16.54% and the Bloomberg U.S. Aggregate Bond Index returned 3.38%.
What contributed to performance?
During the reporting period, equity markets registered solid gains, outperforming the modest gains of fixed-income securities. Across the LifePath® vintages, information technology stocks in the U.S. large-capitalization space were the largest driver of returns. Semiconductor stocks gained amid unprecedented demand for artificial intelligence (“AI”) and generative AI, data center expansions, and continued innovation in chips and network solutions, while systems software firms benefited from strong growth in their respective cloud businesses and increasing adoption of AI technologies. Stocks in the financials sector were also notable contributors, benefiting from resilient equity markets, rising assets under management, strong trends in wealth management, and high trading volumes. International developed stocks also benefited performance. Optimism surrounding a historic fiscal stimulus plan targeting infrastructure and defense supported firms in the German industrials space.
The bond allocation also gained during the reporting period. For the retirement and earlier-dated vintages, inflation-protected securities rose as pricing pressures remained elevated and tariff uncertainty raised future pricing expectations.
What detracted from performance?
Given the strength of equity and bond markets during the reporting period, there were no material detractors to the performance of any of the vintages.
The views expressed reflect the opinions of BlackRock as of the date of this report and are subject to change based on changes in market, economic or other conditions. These views are not intended to be a forecast of future events and are no guarantee of future results.
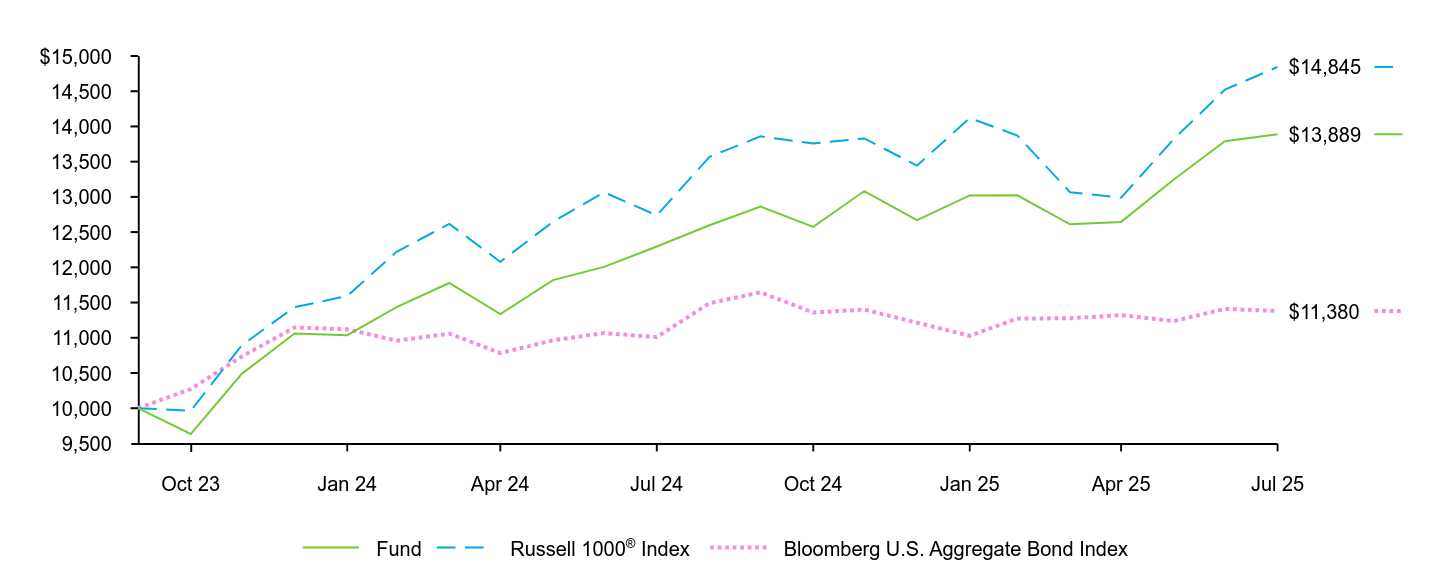
Fund | Russell 1000® Index | Bloomberg U.S. Aggregate Bond Index | |
|---|---|---|---|
Sep 23 | $10,000 | $10,000 | $10,000 |
Oct 23 | $9,634 | $9,964 | $10,272 |
Nov 23 | $10,488 | $10,894 | $10,735 |
Dec 23 | $11,060 | $11,434 | $11,146 |
Jan 24 | $11,037 | $11,593 | $11,121 |
Feb 24 | $11,435 | $12,221 | $10,959 |
Mar 24 | $11,778 | $12,616 | $11,060 |
Apr 24 | $11,336 | $12,078 | $10,783 |
May 24 | $11,818 | $12,647 | $10,964 |
Jun 24 | $12,006 | $13,065 | $11,067 |
Jul 24 | $12,296 | $12,738 | $11,009 |
Aug 24 | $12,598 | $13,569 | $11,491 |
Sep 24 | $12,862 | $13,859 | $11,645 |
Oct 24 | $12,575 | $13,759 | $11,359 |
Nov 24 | $13,083 | $13,830 | $11,400 |
Dec 24 | $12,670 | $13,443 | $11,214 |
Jan 25 | $13,021 | $14,120 | $11,028 |
Feb 25 | $13,023 | $13,871 | $11,273 |
Mar 25 | $12,611 | $13,066 | $11,277 |
Apr 25 | $12,645 | $12,989 | $11,321 |
May 25 | $13,246 | $13,821 | $11,237 |
Jun 25 | $13,789 | $14,522 | $11,410 |
Jul 25 | $13,889 | $14,845 | $11,380 |
........................................................................................................................................................................................................................................................................................................................................................................................................................................................................................................................................................................................................................................................................................................................................................................................................................................................................................................................................................................................................................................ | 1 Year | Since Fund
Inception |
|---|---|---|
Fund NAV........................................................................................................................................................................................................................................................................................................................................................................................................................................................................................................................................................................................................................................................................................................................................................................................................................................................................................................................................................................................................................................ | 12.96% | 20.16% |
Russell 1000® Index........................................................................................................................................................................................................................................................................................................................................................................................................................................................................................................................................................................................................................................................................................................................................................................................................................................................................................................................................................................................................................................ | 16.54 | 24.71 |
Bloomberg U.S. Aggregate Bond Index........................................................................................................................................................................................................................................................................................................................................................................................................................................................................................................................................................................................................................................................................................................................................................................................................................................................................................................................................................................................................................................ | 3.38 | 7.50 |
Key Fund statistics
Net Assets........................................................................................................................................................................................................................................................................................................................................................................................................................................................................................................................................................................................................................................................................................................................................................................................................................................................................................................................................................................................................................................ | $35,222,143 |
|---|---|
Number of Portfolio Holdings........................................................................................................................................................................................................................................................................................................................................................................................................................................................................................................................................................................................................................................................................................................................................................................................................................................................................................................................................................................................................................................ | 14 |
Net Investment Advisory Fees........................................................................................................................................................................................................................................................................................................................................................................................................................................................................................................................................................................................................................................................................................................................................................................................................................................................................................................................................................................................................................................ | $0 |
Portfolio Turnover Rate........................................................................................................................................................................................................................................................................................................................................................................................................................................................................................................................................................................................................................................................................................................................................................................................................................................................................................................................................................................................................................................ | 16% |
Portfolio composition
Ten largest holdings
Asset class | Percent of Total InvestmentsFootnote Reference(a) |
|---|---|
Domestic Equity........................................................................................................................................................................................................................................................................................................................................................................................................................................................................................................................................................................................................................................................................................................................................................................................................................................................................................................................................................................................................................................ | 54.6% |
International Equity........................................................................................................................................................................................................................................................................................................................................................................................................................................................................................................................................................................................................................................................................................................................................................................................................................................................................................................................................................................................................................................ | 31.8 |
Domestic Fixed Income........................................................................................................................................................................................................................................................................................................................................................................................................................................................................................................................................................................................................................................................................................................................................................................................................................................................................................................................................................................................................................................ | 13.6 |
Security | Percent of Total InvestmentsFootnote Reference(a) |
|---|---|
iShares Russell 1000 ETF........................................................................................................................................................................................................................................................................................................................................................................................................................................................................................................................................................................................................................................................................................................................................................................................................................................................................................................................................................................................................................................ | 47.9% |
iShares Core MSCI International Developed Markets ETF........................................................................................................................................................................................................................................................................................................................................................................................................................................................................................................................................................................................................................................................................................................................................................................................................................................................................................................................................................................................................................................ | 22.2 |
iShares Core MSCI Emerging Markets ETF........................................................................................................................................................................................................................................................................................................................................................................................................................................................................................................................................................................................................................................................................................................................................................................................................................................................................................................................................................................................................................................ | 9.1 |
iShares Core U.S. REIT ETF........................................................................................................................................................................................................................................................................................................................................................................................................................................................................................................................................................................................................................................................................................................................................................................................................................................................................................................................................................................................................................................ | 4.1 |
iShares U.S. Treasury Bond ETF........................................................................................................................................................................................................................................................................................................................................................................................................................................................................................................................................................................................................................................................................................................................................................................................................................................................................................................................................................................................................................................ | 3.8 |
iShares MBS ETF........................................................................................................................................................................................................................................................................................................................................................................................................................................................................................................................................................................................................................................................................................................................................................................................................................................................................................................................................................................................................................................ | 3.6 |
iShares 10+ Year Investment Grade Corporate Bond ETF........................................................................................................................................................................................................................................................................................................................................................................................................................................................................................................................................................................................................................................................................................................................................................................................................................................................................................................................................................................................................................................ | 3.2 |
iShares Russell 2000 ETF........................................................................................................................................................................................................................................................................................................................................................................................................................................................................................................................................................................................................................................................................................................................................................................................................................................................................................................................................................................................................................................ | 2.6 |
iShares 1-5 Year Investment Grade Corporate Bond ETF........................................................................................................................................................................................................................................................................................................................................................................................................................................................................................................................................................................................................................................................................................................................................................................................................................................................................................................................................................................................................................................ | 1.2 |
iShares 10-20 Year Treasury Bond ETF........................................................................................................................................................................................................................................................................................................................................................................................................................................................................................................................................................................................................................................................................................................................................................................................................................................................................................................................................................................................................................................ | 1.0 |
| Footnote | Description |
Footnote(a) | Excludes money market funds. |
What were the Fund costs for the last year?
(based on a hypothetical $10,000 investment)
Fund name | Costs of a $10,000
investment | Costs paid as a percentage of a
$10,000 investment |
|---|---|---|
iShares LifePath Target Date 2050 ETF | $0Footnote Reference(a) | 0.00%Footnote Reference(a) |
| Footnote | Description |
Footnote(a) | Excludes fees and expenses incurred indirectly as a result of investments in underlying funds. |
How did the Fund perform last year?
For the reporting period ended July 31, 2025, the Fund returned 14.08%.
For the same period, the Russell 1000® Index returned 16.54% and the Bloomberg U.S. Aggregate Bond Index returned 3.38%.
What contributed to performance?
During the reporting period, equity markets registered solid gains, outperforming the modest gains of fixed-income securities. Across the LifePath® vintages, information technology stocks in the U.S. large-capitalization space were the largest driver of returns. Semiconductor stocks gained amid unprecedented demand for artificial intelligence (“AI”) and generative AI, data center expansions, and continued innovation in chips and network solutions, while systems software firms benefited from strong growth in their respective cloud businesses and increasing adoption of AI technologies. Stocks in the financials sector were also notable contributors, benefiting from resilient equity markets, rising assets under management, strong trends in wealth management, and high trading volumes. International developed stocks also benefited performance. Optimism surrounding a historic fiscal stimulus plan targeting infrastructure and defense supported firms in the German industrials space.
The bond allocation also gained during the reporting period. For the retirement and earlier-dated vintages, inflation-protected securities rose as pricing pressures remained elevated and tariff uncertainty raised future pricing expectations.
What detracted from performance?
Given the strength of equity and bond markets during the reporting period, there were no material detractors to the performance of any of the vintages.
The views expressed reflect the opinions of BlackRock as of the date of this report and are subject to change based on changes in market, economic or other conditions. These views are not intended to be a forecast of future events and are no guarantee of future results.

Fund | Russell 1000® Index | Bloomberg U.S. Aggregate Bond Index | |
|---|---|---|---|
Sep 23 | $10,000 | $10,000 | $10,000 |
Oct 23 | $9,617 | $9,964 | $10,272 |
Nov 23 | $10,477 | $10,894 | $10,735 |
Dec 23 | $11,033 | $11,434 | $11,146 |
Jan 24 | $11,032 | $11,593 | $11,121 |
Feb 24 | $11,489 | $12,221 | $10,959 |
Mar 24 | $11,856 | $12,616 | $11,060 |
Apr 24 | $11,424 | $12,078 | $10,783 |
May 24 | $11,928 | $12,647 | $10,964 |
Jun 24 | $12,113 | $13,065 | $11,067 |
Jul 24 | $12,394 | $12,738 | $11,009 |
Aug 24 | $12,688 | $13,569 | $11,491 |
Sep 24 | $12,957 | $13,859 | $11,645 |
Oct 24 | $12,680 | $13,759 | $11,359 |
Nov 24 | $13,223 | $13,830 | $11,400 |
Dec 24 | $12,804 | $13,443 | $11,214 |
Jan 25 | $13,194 | $14,120 | $11,028 |
Feb 25 | $13,150 | $13,871 | $11,273 |
Mar 25 | $12,696 | $13,066 | $11,277 |
Apr 25 | $12,739 | $12,989 | $11,321 |
May 25 | $13,419 | $13,821 | $11,237 |
Jun 25 | $14,016 | $14,522 | $11,410 |
Jul 25 | $14,139 | $14,845 | $11,380 |
........................................................................................................................................................................................................................................................................................................................................................................................................................................................................................................................................................................................................................................................................................................................................................................................................................................................................................................................................................................................................................................ | 1 Year | Since Fund
Inception |
|---|---|---|
Fund NAV........................................................................................................................................................................................................................................................................................................................................................................................................................................................................................................................................................................................................................................................................................................................................................................................................................................................................................................................................................................................................................................ | 14.08% | 21.36% |
Russell 1000® Index........................................................................................................................................................................................................................................................................................................................................................................................................................................................................................................................................................................................................................................................................................................................................................................................................................................................................................................................................................................................................................................ | 16.54 | 24.71 |
Bloomberg U.S. Aggregate Bond Index........................................................................................................................................................................................................................................................................................................................................................................................................................................................................................................................................................................................................................................................................................................................................................................................................................................................................................................................................................................................................................................ | 3.38 | 7.50 |
Key Fund statistics
Net Assets........................................................................................................................................................................................................................................................................................................................................................................................................................................................................................................................................................................................................................................................................................................................................................................................................................................................................................................................................................................................................................................ | $31,752,360 |
|---|---|
Number of Portfolio Holdings........................................................................................................................................................................................................................................................................................................................................................................................................................................................................................................................................................................................................................................................................................................................................................................................................................................................................................................................................................................................................................................ | 12 |
Net Investment Advisory Fees........................................................................................................................................................................................................................................................................................................................................................................................................................................................................................................................................................................................................................................................................................................................................................................................................................................................................................................................................................................................................................................ | $0 |
Portfolio Turnover Rate........................................................................................................................................................................................................................................................................................................................................................................................................................................................................................................................................................................................................................................................................................................................................................................................................................................................................................................................................................................................................................................ | 17% |
Portfolio composition
All holdings
Asset class | Percent of Total InvestmentsFootnote Reference(a) |
|---|---|
Domestic Equity........................................................................................................................................................................................................................................................................................................................................................................................................................................................................................................................................................................................................................................................................................................................................................................................................................................................................................................................................................................................................................................ | 59.1% |
International Equity........................................................................................................................................................................................................................................................................................................................................................................................................................................................................................................................................................................................................................................................................................................................................................................................................................................................................................................................................................................................................................................ | 35.3 |
Domestic Fixed Income........................................................................................................................................................................................................................................................................................................................................................................................................................................................................................................................................................................................................................................................................................................................................................................................................................................................................................................................................................................................................................................ | 5.6 |
Security | Percent of Total InvestmentsFootnote Reference(a) |
|---|---|
iShares Russell 1000 ETF........................................................................................................................................................................................................................................................................................................................................................................................................................................................................................................................................................................................................................................................................................................................................................................................................................................................................................................................................................................................................................................ | 53.2% |
iShares Core MSCI International Developed Markets ETF........................................................................................................................................................................................................................................................................................................................................................................................................................................................................................................................................................................................................................................................................................................................................................................................................................................................................................................................................................................................................................................ | 25.0 |
iShares Core MSCI Emerging Markets ETF........................................................................................................................................................................................................................................................................................................................................................................................................................................................................................................................................................................................................................................................................................................................................................................................................................................................................................................................................................................................................................................ | 10.3 |
iShares 10+ Year Investment Grade Corporate Bond ETF........................................................................................................................................................................................................................................................................................................................................................................................................................................................................................................................................................................................................................................................................................................................................................................................................................................................................................................................................................................................................................................ | 3.9 |
iShares Russell 2000 ETF........................................................................................................................................................................................................................................................................................................................................................................................................................................................................................................................................................................................................................................................................................................................................................................................................................................................................................................................................................................................................................................ | 3.4 |
iShares Core U.S. REIT ETF........................................................................................................................................................................................................................................................................................................................................................................................................................................................................................................................................................................................................................................................................................................................................................................................................................................................................................................................................................................................................................................ | 2.5 |
iShares 1-5 Year Investment Grade Corporate Bond ETF........................................................................................................................................................................................................................................................................................................................................................................................................................................................................................................................................................................................................................................................................................................................................................................................................................................................................................................................................................................................................................................ | 0.6 |
iShares 10-20 Year Treasury Bond ETF........................................................................................................................................................................................................................................................................................................................................................................................................................................................................................................................................................................................................................................................................................................................................................................................................................................................................................................................................................................................................................................ | 0.5 |
iShares 5-10 Year Investment Grade Corporate Bond ETF........................................................................................................................................................................................................................................................................................................................................................................................................................................................................................................................................................................................................................................................................................................................................................................................................................................................................................................................................................................................................................................ | 0.4 |
iShares U.S. Treasury Bond ETF........................................................................................................................................................................................................................................................................................................................................................................................................................................................................................................................................................................................................................................................................................................................................................................................................................................................................................................................................................................................................................................ | 0.2 |
| Footnote | Description |
Footnote(a) | Excludes money market funds. |
What were the Fund costs for the last year?
(based on a hypothetical $10,000 investment)
Fund name | Costs of a $10,000
investment | Costs paid as a percentage of a
$10,000 investment |
|---|---|---|
iShares LifePath Target Date 2055 ETF | $0Footnote Reference(a) | 0.00%Footnote Reference(a) |
| Footnote | Description |
Footnote(a) | Excludes fees and expenses incurred indirectly as a result of investments in underlying funds. |
How did the Fund perform last year?
For the reporting period ended July 31, 2025, the Fund returned 14.71%.
For the same period, the Russell 1000® Index returned 16.54% and the Bloomberg U.S. Aggregate Bond Index returned 3.38%.
What contributed to performance?
During the reporting period, equity markets registered solid gains, outperforming the modest gains of fixed-income securities. Across the LifePath® vintages, information technology stocks in the U.S. large-capitalization space were the largest driver of returns. Semiconductor stocks gained amid unprecedented demand for artificial intelligence (“AI”) and generative AI, data center expansions, and continued innovation in chips and network solutions, while systems software firms benefited from strong growth in their respective cloud businesses and increasing adoption of AI technologies. Stocks in the financials sector were also notable contributors, benefiting from resilient equity markets, rising assets under management, strong trends in wealth management, and high trading volumes. International developed stocks also benefited performance. Optimism surrounding a historic fiscal stimulus plan targeting infrastructure and defense supported firms in the German industrials space.
The bond allocation also gained during the reporting period. For the retirement and earlier-dated vintages, inflation-protected securities rose as pricing pressures remained elevated and tariff uncertainty raised future pricing expectations.
What detracted from performance?
Given the strength of equity and bond markets during the reporting period, there were no material detractors to the performance of any of the vintages.
The views expressed reflect the opinions of BlackRock as of the date of this report and are subject to change based on changes in market, economic or other conditions. These views are not intended to be a forecast of future events and are no guarantee of future results.

Fund | Russell 1000® Index | Bloomberg U.S. Aggregate Bond Index | |
|---|---|---|---|
Sep 23 | $10,000 | $10,000 | $10,000 |
Oct 23 | $9,609 | $9,964 | $10,272 |
Nov 23 | $10,470 | $10,894 | $10,735 |
Dec 23 | $11,023 | $11,434 | $11,146 |
Jan 24 | $11,023 | $11,593 | $11,121 |
Feb 24 | $11,501 | $12,221 | $10,959 |
Mar 24 | $11,873 | $12,616 | $11,060 |
Apr 24 | $11,443 | $12,078 | $10,783 |
May 24 | $11,953 | $12,647 | $10,964 |
Jun 24 | $12,142 | $13,065 | $11,067 |
Jul 24 | $12,418 | $12,738 | $11,009 |
Aug 24 | $12,710 | $13,569 | $11,491 |
Sep 24 | $12,979 | $13,859 | $11,645 |
Oct 24 | $12,710 | $13,759 | $11,359 |
Nov 24 | $13,266 | $13,830 | $11,400 |
Dec 24 | $12,851 | $13,443 | $11,214 |
Jan 25 | $13,258 | $14,120 | $11,028 |
Feb 25 | $13,189 | $13,871 | $11,273 |
Mar 25 | $12,720 | $13,066 | $11,277 |
Apr 25 | $12,774 | $12,989 | $11,321 |
May 25 | $13,492 | $13,821 | $11,237 |
Jun 25 | $14,111 | $14,522 | $11,410 |
Jul 25 | $14,245 | $14,845 | $11,380 |
........................................................................................................................................................................................................................................................................................................................................................................................................................................................................................................................................................................................................................................................................................................................................................................................................................................................................................................................................................................................................................................ | 1 Year | Since Fund
Inception |
|---|---|---|
Fund NAV........................................................................................................................................................................................................................................................................................................................................................................................................................................................................................................................................................................................................................................................................................................................................................................................................................................................................................................................................................................................................................................ | 14.71% | 21.87% |
Russell 1000® Index........................................................................................................................................................................................................................................................................................................................................................................................................................................................................................................................................................................................................................................................................................................................................................................................................................................................................................................................................................................................................................................ | 16.54 | 24.71 |
Bloomberg U.S. Aggregate Bond Index........................................................................................................................................................................................................................................................................................................................................................................................................................................................................................................................................................................................................................................................................................................................................................................................................................................................................................................................................................................................................................................ | 3.38 | 7.50 |
Key Fund statistics
Net Assets........................................................................................................................................................................................................................................................................................................................................................................................................................................................................................................................................................................................................................................................................................................................................................................................................................................................................................................................................................................................................................................ | $22,282,484 |
|---|---|
Number of Portfolio Holdings........................................................................................................................................................................................................................................................................................................................................................................................................................................................................................................................................................................................................................................................................................................................................................................................................................................................................................................................................................................................................................................ | 8 |
Net Investment Advisory Fees........................................................................................................................................................................................................................................................................................................................................................................................................................................................................................................................................................................................................................................................................................................................................................................................................................................................................................................................................................................................................................................ | $0 |
Portfolio Turnover Rate........................................................................................................................................................................................................................................................................................................................................................................................................................................................................................................................................................................................................................................................................................................................................................................................................................................................................................................................................................................................................................................ | 12% |
Portfolio composition
All holdings
Asset class | Percent of Total InvestmentsFootnote Reference(a) |
|---|---|
Domestic Equity........................................................................................................................................................................................................................................................................................................................................................................................................................................................................................................................................................................................................................................................................................................................................................................................................................................................................................................................................................................................................................................ | 61.1% |
International Equity........................................................................................................................................................................................................................................................................................................................................................................................................................................................................................................................................................................................................................................................................................................................................................................................................................................................................................................................................................................................................................................ | 37.2 |
Domestic Fixed Income........................................................................................................................................................................................................................................................................................................................................................................................................................................................................................................................................................................................................................................................................................................................................................................................................................................................................................................................................................................................................................................ | 1.7 |
Security | Percent of Total InvestmentsFootnote Reference(a) |
|---|---|
iShares Russell 1000 ETF........................................................................................................................................................................................................................................................................................................................................................................................................................................................................................................................................................................................................................................................................................................................................................................................................................................................................................................................................................................................................................................ | 56.0% |
iShares Core MSCI International Developed Markets ETF........................................................................................................................................................................................................................................................................................................................................................................................................................................................................................................................................................................................................................................................................................................................................................................................................................................................................................................................................................................................................................................ | 26.3 |
iShares Core MSCI Emerging Markets ETF........................................................................................................................................................................................................................................................................................................................................................................................................................................................................................................................................................................................................................................................................................................................................................................................................................................................................................................................................................................................................................................ | 10.9 |
iShares Russell 2000 ETF........................................................................................................................................................................................................................................................................................................................................................................................................................................................................................................................................................................................................................................................................................................................................................................................................................................................................................................................................................................................................................................ | 3.8 |
iShares 10+ Year Investment Grade Corporate Bond ETF........................................................................................................................................................................................................................................................................................................................................................................................................................................................................................................................................................................................................................................................................................................................................................................................................................................................................................................................................................................................................................................ | 1.7 |
iShares Core U.S. REIT ETF........................................................................................................................................................................................................................................................................................................................................................................................................................................................................................................................................................................................................................................................................................................................................................................................................................................................................................................................................................................................................................................ | 1.3 |
| Footnote | Description |
Footnote(a) | Excludes money market funds. |
What were the Fund costs for the last year?
(based on a hypothetical $10,000 investment)
Fund name | Costs of a $10,000
investment | Costs paid as a percentage of a
$10,000 investment |
|---|---|---|
iShares LifePath Target Date 2060 ETF | $0Footnote Reference(a) | 0.00%Footnote Reference(a) |
| Footnote | Description |
Footnote(a) | Excludes fees and expenses incurred indirectly as a result of investments in underlying funds. |
How did the Fund perform last year?
For the reporting period ended July 31, 2025, the Fund returned 14.82%.
For the same period, the Russell 1000® Index returned 16.54% and the Bloomberg U.S. Aggregate Bond Index returned 3.38%.
What contributed to performance?
During the reporting period, equity markets registered solid gains, outperforming the modest gains of fixed-income securities. Across the LifePath® vintages, information technology stocks in the U.S. large-capitalization space were the largest driver of returns. Semiconductor stocks gained amid unprecedented demand for artificial intelligence (“AI”) and generative AI, data center expansions, and continued innovation in chips and network solutions, while systems software firms benefited from strong growth in their respective cloud businesses and increasing adoption of AI technologies. Stocks in the financials sector were also notable contributors, benefiting from resilient equity markets, rising assets under management, strong trends in wealth management, and high trading volumes. International developed stocks also benefited performance. Optimism surrounding a historic fiscal stimulus plan targeting infrastructure and defense supported firms in the German industrials space.
The bond allocation also gained during the reporting period. For the retirement and earlier-dated vintages, inflation-protected securities rose as pricing pressures remained elevated and tariff uncertainty raised future pricing expectations.
What detracted from performance?
Given the strength of equity and bond markets during the reporting period, there were no material detractors to the performance of any of the vintages.
The views expressed reflect the opinions of BlackRock as of the date of this report and are subject to change based on changes in market, economic or other conditions. These views are not intended to be a forecast of future events and are no guarantee of future results.
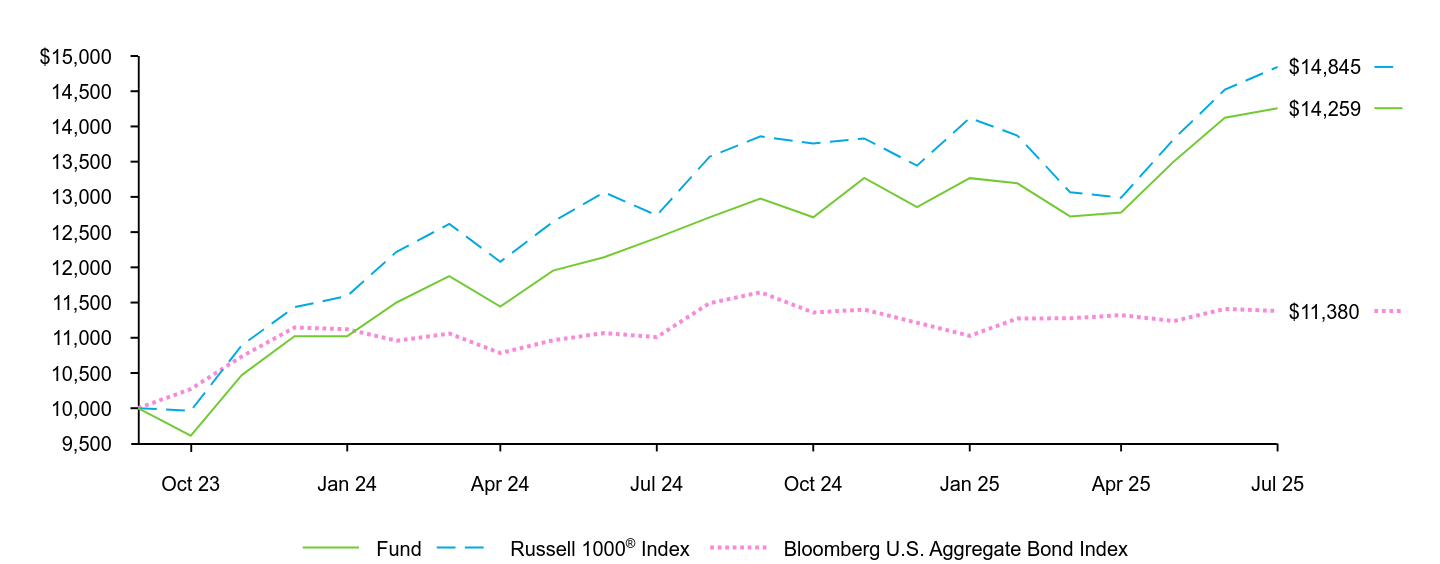
Fund | Russell 1000® Index | Bloomberg U.S. Aggregate Bond Index | |
|---|---|---|---|
Sep 23 | $10,000 | $10,000 | $10,000 |
Oct 23 | $9,609 | $9,964 | $10,272 |
Nov 23 | $10,470 | $10,894 | $10,735 |
Dec 23 | $11,023 | $11,434 | $11,146 |
Jan 24 | $11,023 | $11,593 | $11,121 |
Feb 24 | $11,501 | $12,221 | $10,959 |
Mar 24 | $11,874 | $12,616 | $11,060 |
Apr 24 | $11,443 | $12,078 | $10,783 |
May 24 | $11,954 | $12,647 | $10,964 |
Jun 24 | $12,143 | $13,065 | $11,067 |
Jul 24 | $12,418 | $12,738 | $11,009 |
Aug 24 | $12,709 | $13,569 | $11,491 |
Sep 24 | $12,978 | $13,859 | $11,645 |
Oct 24 | $12,710 | $13,759 | $11,359 |
Nov 24 | $13,269 | $13,830 | $11,400 |
Dec 24 | $12,855 | $13,443 | $11,214 |
Jan 25 | $13,266 | $14,120 | $11,028 |
Feb 25 | $13,193 | $13,871 | $11,273 |
Mar 25 | $12,723 | $13,066 | $11,277 |
Apr 25 | $12,778 | $12,989 | $11,321 |
May 25 | $13,502 | $13,821 | $11,237 |
Jun 25 | $14,123 | $14,522 | $11,410 |
Jul 25 | $14,259 | $14,845 | $11,380 |
........................................................................................................................................................................................................................................................................................................................................................................................................................................................................................................................................................................................................................................................................................................................................................................................................................................................................................................................................................................................................................................ | 1 Year | Since Fund
Inception |
|---|---|---|
Fund NAV........................................................................................................................................................................................................................................................................................................................................................................................................................................................................................................................................................................................................................................................................................................................................................................................................................................................................................................................................................................................................................................ | 14.82% | 21.94% |
Russell 1000® Index........................................................................................................................................................................................................................................................................................................................................................................................................................................................................................................................................................................................................................................................................................................................................................................................................................................................................................................................................................................................................................................ | 16.54 | 24.71 |
Bloomberg U.S. Aggregate Bond Index........................................................................................................................................................................................................................................................................................................................................................................................................................................................................................................................................................................................................................................................................................................................................................................................................................................................................................................................................................................................................................................ | 3.38 | 7.50 |
Key Fund statistics
Net Assets........................................................................................................................................................................................................................................................................................................................................................................................................................................................................................................................................................................................................................................................................................................................................................................................................................................................................................................................................................................................................................................ | $16,691,365 |
|---|---|
Number of Portfolio Holdings........................................................................................................................................................................................................................................................................................................................................................................................................................................................................................................................................................................................................................................................................................................................................................................................................................................................................................................................................................................................................................................ | 8 |
Net Investment Advisory Fees........................................................................................................................................................................................................................................................................................................................................................................................................................................................................................................................................................................................................................................................................................................................................................................................................................................................................................................................................................................................................................................ | $0 |
Portfolio Turnover Rate........................................................................................................................................................................................................................................................................................................................................................................................................................................................................................................................................................................................................................................................................................................................................................................................................................................................................................................................................................................................................................................ | 12% |
Portfolio composition
All holdings
Asset class | Percent of Total InvestmentsFootnote Reference(a) |
|---|---|
Domestic Equity........................................................................................................................................................................................................................................................................................................................................................................................................................................................................................................................................................................................................................................................................................................................................................................................................................................................................................................................................................................................................................................ | 61.6% |
International Equity........................................................................................................................................................................................................................................................................................................................................................................................................................................................................................................................................................................................................................................................................................................................................................................................................................................................................................................................................................................................................................................ | 37.4 |
Domestic Fixed Income........................................................................................................................................................................................................................................................................................................................................................................................................................................................................................................................................................................................................................................................................................................................................................................................................................................................................................................................................................................................................................................ | 1.0 |
Security | Percent of Total InvestmentsFootnote Reference(a) |
|---|---|
iShares Russell 1000 ETF........................................................................................................................................................................................................................................................................................................................................................................................................................................................................................................................................................................................................................................................................................................................................................................................................................................................................................................................................................................................................................................ | 56.6% |
iShares Core MSCI International Developed Markets ETF........................................................................................................................................................................................................................................................................................................................................................................................................................................................................................................................................................................................................................................................................................................................................................................................................................................................................................................................................................................................................................................ | 26.5 |
iShares Core MSCI Emerging Markets ETF........................................................................................................................................................................................................................................................................................................................................................................................................................................................................................................................................................................................................................................................................................................................................................................................................................................................................................................................................................................................................................................ | 10.9 |
iShares Russell 2000 ETF........................................................................................................................................................................................................................................................................................................................................................................................................................................................................................................................................................................................................................................................................................................................................................................................................................................................................................................................................................................................................................................ | 3.9 |
iShares Core U.S. REIT ETF........................................................................................................................................................................................................................................................................................................................................................................................................................................................................................................................................................................................................................................................................................................................................................................................................................................................................................................................................................................................................................................ | 1.1 |
iShares 10+ Year Investment Grade Corporate Bond ETF........................................................................................................................................................................................................................................................................................................................................................................................................................................................................................................................................................................................................................................................................................................................................................................................................................................................................................................................................................................................................................................ | 1.0 |
| Footnote | Description |
Footnote(a) | Excludes money market funds. |
What were the Fund costs for the last year?
(based on a hypothetical $10,000 investment)
Fund name | Costs of a $10,000
investment | Costs paid as a percentage of a
$10,000 investment |
|---|---|---|
iShares LifePath Target Date 2065 ETF | $0Footnote Reference(a) | 0.00%Footnote Reference(a) |
| Footnote | Description |
Footnote(a) | Excludes fees and expenses incurred indirectly as a result of investments in underlying funds. |
How did the Fund perform last year?
For the reporting period ended July 31, 2025, the Fund returned 14.82%.
For the same period, the Russell 1000® Index returned 16.54% and the Bloomberg U.S. Aggregate Bond Index returned 3.38%.
What contributed to performance?
During the reporting period, equity markets registered solid gains, outperforming the modest gains of fixed-income securities. Across the LifePath® vintages, information technology stocks in the U.S. large-capitalization space were the largest driver of returns. Semiconductor stocks gained amid unprecedented demand for artificial intelligence (“AI”) and generative AI, data center expansions, and continued innovation in chips and network solutions, while systems software firms benefited from strong growth in their respective cloud businesses and increasing adoption of AI technologies. Stocks in the financials sector were also notable contributors, benefiting from resilient equity markets, rising assets under management, strong trends in wealth management, and high trading volumes. International developed stocks also benefited performance. Optimism surrounding a historic fiscal stimulus plan targeting infrastructure and defense supported firms in the German industrials space.
The bond allocation also gained during the reporting period. For the retirement and earlier-dated vintages, inflation-protected securities rose as pricing pressures remained elevated and tariff uncertainty raised future pricing expectations.
What detracted from performance?
Given the strength of equity and bond markets during the reporting period, there were no material detractors to the performance of any of the vintages.
The views expressed reflect the opinions of BlackRock as of the date of this report and are subject to change based on changes in market, economic or other conditions. These views are not intended to be a forecast of future events and are no guarantee of future results.

Fund | Russell 1000® Index | Bloomberg U.S. Aggregate Bond Index | |
|---|---|---|---|
Sep 23 | $10,000 | $10,000 | $10,000 |
Oct 23 | $9,609 | $9,964 | $10,272 |
Nov 23 | $10,470 | $10,894 | $10,735 |
Dec 23 | $11,023 | $11,434 | $11,146 |
Jan 24 | $11,023 | $11,593 | $11,121 |
Feb 24 | $11,501 | $12,221 | $10,959 |
Mar 24 | $11,874 | $12,616 | $11,060 |
Apr 24 | $11,443 | $12,078 | $10,783 |
May 24 | $11,954 | $12,647 | $10,964 |
Jun 24 | $12,143 | $13,065 | $11,067 |
Jul 24 | $12,418 | $12,738 | $11,009 |
Aug 24 | $12,709 | $13,569 | $11,491 |
Sep 24 | $12,978 | $13,859 | $11,645 |
Oct 24 | $12,710 | $13,759 | $11,359 |
Nov 24 | $13,269 | $13,830 | $11,400 |
Dec 24 | $12,855 | $13,443 | $11,214 |
Jan 25 | $13,266 | $14,120 | $11,028 |
Feb 25 | $13,193 | $13,871 | $11,273 |
Mar 25 | $12,723 | $13,066 | $11,277 |
Apr 25 | $12,778 | $12,989 | $11,321 |
May 25 | $13,501 | $13,821 | $11,237 |
Jun 25 | $14,123 | $14,522 | $11,410 |
Jul 25 | $14,258 | $14,845 | $11,380 |
........................................................................................................................................................................................................................................................................................................................................................................................................................................................................................................................................................................................................................................................................................................................................................................................................................................................................................................................................................................................................................................ | 1 Year | Since Fund
Inception |
|---|---|---|
Fund NAV........................................................................................................................................................................................................................................................................................................................................................................................................................................................................................................................................................................................................................................................................................................................................................................................................................................................................................................................................................................................................................................ | 14.82% | 21.93% |
Russell 1000® Index........................................................................................................................................................................................................................................................................................................................................................................................................................................................................................................................................................................................................................................................................................................................................................................................................................................................................................................................................................................................................................................ | 16.54 | 24.71 |
Bloomberg U.S. Aggregate Bond Index........................................................................................................................................................................................................................................................................................................................................................................................................................................................................................................................................................................................................................................................................................................................................................................................................................................................................................................................................................................................................................................ | 3.38 | 7.50 |
Key Fund statistics
Net Assets........................................................................................................................................................................................................................................................................................................................................................................................................................................................................................................................................................................................................................................................................................................................................................................................................................................................................................................................................................................................................................................ | $12,515,691 |
|---|---|
Number of Portfolio Holdings........................................................................................................................................................................................................................................................................................................................................................................................................................................................................................................................................................................................................................................................................................................................................................................................................................................................................................................................................................................................................................................ | 8 |
Net Investment Advisory Fees........................................................................................................................................................................................................................................................................................................................................................................................................................................................................................................................................................................................................................................................................................................................................................................................................................................................................................................................................................................................................................................ | $0 |
Portfolio Turnover Rate........................................................................................................................................................................................................................................................................................................................................................................................................................................................................................................................................................................................................................................................................................................................................................................................................................................................................................................................................................................................................................................ | 12% |
Portfolio composition
All holdings
Asset class | Percent of Total InvestmentsFootnote Reference(a) |
|---|---|
Domestic Equity........................................................................................................................................................................................................................................................................................................................................................................................................................................................................................................................................................................................................................................................................................................................................................................................................................................................................................................................................................................................................................................ | 61.6% |
International Equity........................................................................................................................................................................................................................................................................................................................................................................................................................................................................................................................................................................................................................................................................................................................................................................................................................................................................................................................................................................................................................................ | 37.4 |
Domestic Fixed Income........................................................................................................................................................................................................................................................................................................................................................................................................................................................................................................................................................................................................................................................................................................................................................................................................................................................................................................................................................................................................................................ | 1.0 |
Security | Percent of Total InvestmentsFootnote Reference(a) |
|---|---|
iShares Russell 1000 ETF........................................................................................................................................................................................................................................................................................................................................................................................................................................................................................................................................................................................................................................................................................................................................................................................................................................................................................................................................................................................................................................ | 56.6% |
iShares Core MSCI International Developed Markets ETF........................................................................................................................................................................................................................................................................................................................................................................................................................................................................................................................................................................................................................................................................................................................................................................................................................................................................................................................................................................................................................................ | 26.5 |
iShares Core MSCI Emerging Markets ETF........................................................................................................................................................................................................................................................................................................................................................................................................................................................................................................................................................................................................................................................................................................................................................................................................................................................................................................................................................................................................................................ | 10.9 |
iShares Russell 2000 ETF........................................................................................................................................................................................................................................................................................................................................................................................................................................................................................................................................................................................................................................................................................................................................................................................................................................................................................................................................................................................................................................ | 3.9 |
iShares Core U.S. REIT ETF........................................................................................................................................................................................................................................................................................................................................................................................................................................................................................................................................................................................................................................................................................................................................................................................................................................................................................................................................................................................................................................ | 1.1 |
iShares 10+ Year Investment Grade Corporate Bond ETF........................................................................................................................................................................................................................................................................................................................................................................................................................................................................................................................................................................................................................................................................................................................................................................................................................................................................................................................................................................................................................................ | 1.0 |
| Footnote | Description |
Footnote(a) | Excludes money market funds. |
What were the Fund costs for the period?
(based on a hypothetical $10,000 investment)
Fund name | Costs of a $10,000
investment | Costs paid as a percentage of a
$10,000 investment |
|---|---|---|
iShares LifePath Target Date 2070 ETF | $0Footnote Reference(a)Footnote Reference(b) | 0.00%Footnote Reference(b)Footnote Reference(c) |
| Footnote | Description |
Footnote(a) | The Fund commenced operations during the reporting period. |
Footnote(b) | Excludes fees and expenses incurred indirectly as a result of investments in underlying funds. |
Footnote(c) | Annualized |
How did the Fund perform during the period?
For the reporting period ended July 31, 2025, the Fund returned 8.76%.
For the same period, the Russell 1000® Index returned 6.64% and the Bloomberg U.S. Aggregate Bond Index returned 3.52%.
What contributed to performance?
During the reporting period, equity markets registered solid gains, outperforming the modest gains of fixed-income securities. Across the LifePath® vintages, information technology stocks in the U.S. large-capitalization space were the largest driver of returns. Semiconductor stocks gained amid unprecedented demand for artificial intelligence (“AI”) and generative AI, data center expansions, and continued innovation in chips and network solutions, while systems software firms benefited from strong growth in their respective cloud businesses and increasing adoption of AI technologies. Stocks in the financials sector were also notable contributors, benefiting from resilient equity markets, rising assets under management, strong trends in wealth management, and high trading volumes. International developed stocks also benefited performance. Optimism surrounding a historic fiscal stimulus plan targeting infrastructure and defense supported firms in the German industrials space.
The bond allocation also gained during the reporting period. For the retirement and earlier-dated vintages, inflation-protected securities rose as pricing pressures remained elevated and tariff uncertainty raised future pricing expectations.
What detracted from performance?
Given the strength of equity and bond markets during the reporting period, there were no material detractors to the performance of any of the vintages.
The views expressed reflect the opinions of BlackRock as of the date of this report and are subject to change based on changes in market, economic or other conditions. These views are not intended to be a forecast of future events and are no guarantee of future results.
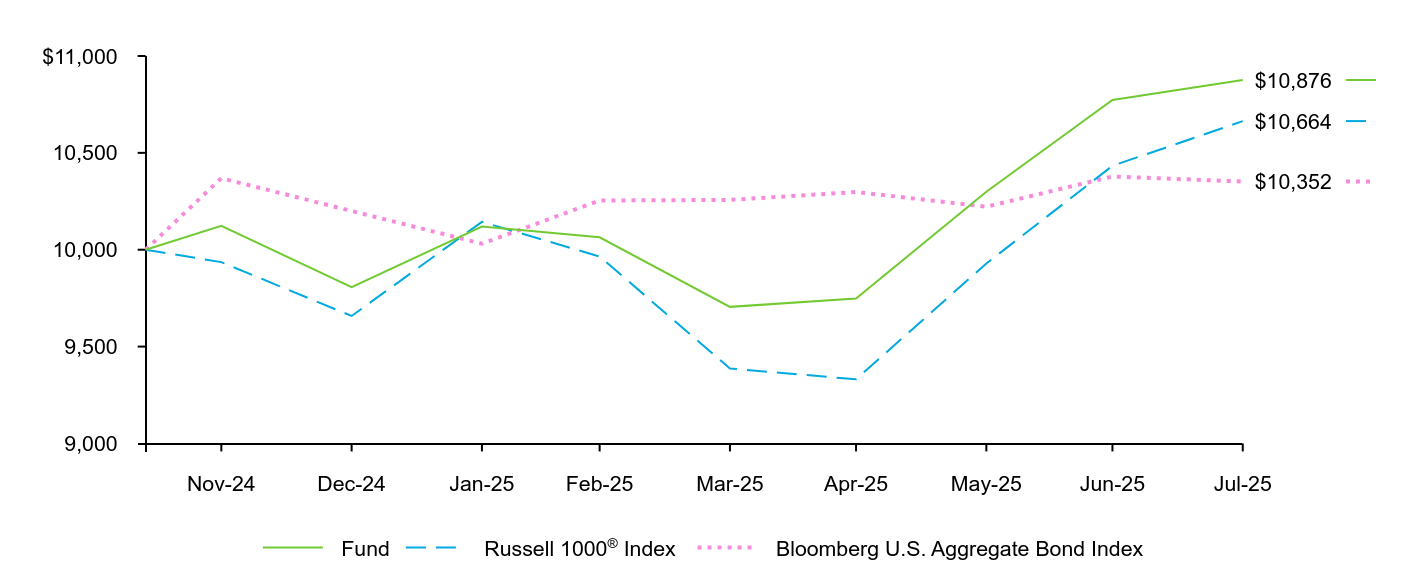
Fund | Russell 1000® Index | Bloomberg U.S. Aggregate Bond Index | |
|---|---|---|---|
Nov-24 | $10,000 | $10,000 | $10,000 |
Nov-24 | $10,123 | $9,936 | $10,369 |
Dec-24 | $9,807 | $9,658 | $10,200 |
Jan-25 | $10,120 | $10,144 | $10,031 |
Feb-25 | $10,064 | $9,965 | $10,254 |
Mar-25 | $9,705 | $9,387 | $10,257 |
Apr-25 | $9,748 | $9,331 | $10,298 |
May-25 | $10,299 | $9,929 | $10,222 |
Jun-25 | $10,773 | $10,433 | $10,378 |
Jul-25 | $10,876 | $10,664 | $10,352 |
Key Fund statistics
Net Assets........................................................................................................................................................................................................................................................................................................................................................................................................................................................................................................................................................................................................................................................................................................................................................................................................................................................................................................................................................................................................................................ | $3,776,077 |
|---|---|
Number of Portfolio Holdings........................................................................................................................................................................................................................................................................................................................................................................................................................................................................................................................................................................................................................................................................................................................................................................................................................................................................................................................................................................................................................................ | 8 |
Net Investment Advisory Fees........................................................................................................................................................................................................................................................................................................................................................................................................................................................................................................................................................................................................................................................................................................................................................................................................................................................................................................................................................................................................................................ | $0 |
Portfolio Turnover Rate........................................................................................................................................................................................................................................................................................................................................................................................................................................................................................................................................................................................................................................................................................................................................................................................................................................................................................................................................................................................................................................ | 8% |
Portfolio composition
Sector | Percent of Total InvestmentsFootnote Reference(a) |
|---|---|
Domestic Equity........................................................................................................................................................................................................................................................................................................................................................................................................................................................................................................................................................................................................................................................................................................................................................................................................................................................................................................................................................................................................................................ | 61.6% |
International Equity........................................................................................................................................................................................................................................................................................................................................................................................................................................................................................................................................................................................................................................................................................................................................................................................................................................................................................................................................................................................................................................ | 37.4 |
Domestic Fixed Income........................................................................................................................................................................................................................................................................................................................................................................................................................................................................................................................................................................................................................................................................................................................................................................................................................................................................................................................................................................................................................................ | 1.0 |
| Footnote | Description |
Footnote(a) | Excludes money market funds. |
All holdings
Security | Percent of Total InvestmentsFootnote Reference(a) |
|---|---|
iShares Russell 1000 ETF........................................................................................................................................................................................................................................................................................................................................................................................................................................................................................................................................................................................................................................................................................................................................................................................................................................................................................................................................................................................................................................ | 56.6% |
iShares Core MSCI International Developed Markets ETF........................................................................................................................................................................................................................................................................................................................................................................................................................................................................................................................................................................................................................................................................................................................................................................................................................................................................................................................................................................................................................................ | 26.5 |
iShares Core MSCI Emerging Markets ETF........................................................................................................................................................................................................................................................................................................................................................................................................................................................................................................................................................................................................................................................................................................................................................................................................................................................................................................................................................................................................................................ | 10.9 |
iShares Russell 2000 ETF........................................................................................................................................................................................................................................................................................................................................................................................................................................................................................................................................................................................................................................................................................................................................................................................................................................................................................................................................................................................................................................ | 3.9 |
iShares Core U.S. REIT ETF........................................................................................................................................................................................................................................................................................................................................................................................................................................................................................................................................................................................................................................................................................................................................................................................................................................................................................................................................................................................................................................ | 1.1 |
iShares 10+ Year Investment Grade Corporate Bond ETF........................................................................................................................................................................................................................................................................................................................................................................................................................................................................................................................................................................................................................................................................................................................................................................................................................................................................................................................................................................................................................................ | 1.0 |
| [1] | Excludes fees and expenses incurred indirectly as a result of investments in underlying funds. |
| [2] | Excludes fees and expenses incurred indirectly as a result of investments in underlying funds. |
| [3] | Excludes fees and expenses incurred indirectly as a result of investments in underlying funds. |
| [4] | Excludes fees and expenses incurred indirectly as a result of investments in underlying funds. |
| [5] | Excludes fees and expenses incurred indirectly as a result of investments in underlying funds. |
| [6] | Excludes fees and expenses incurred indirectly as a result of investments in underlying funds. |
| [7] | Excludes fees and expenses incurred indirectly as a result of investments in underlying funds. |
| [8] | Excludes fees and expenses incurred indirectly as a result of investments in underlying funds. |
| [9] | Excludes fees and expenses incurred indirectly as a result of investments in underlying funds. |
| [10] | Excludes fees and expenses incurred indirectly as a result of investments in underlying funds. |
| [11] | Excludes fees and expenses incurred indirectly as a result of investments in underlying funds. |
| [12] | Excludes fees and expenses incurred indirectly as a result of investments in underlying funds. |
| [13] | Excludes fees and expenses incurred indirectly as a result of investments in underlying funds. |
| [14] | Excludes fees and expenses incurred indirectly as a result of investments in underlying funds. |
| [15] | Excludes fees and expenses incurred indirectly as a result of investments in underlying funds. |
| [16] | The Fund commenced operations during the reporting period. |
| [17] | Annualized |