Shareholder Report
|
12 Months Ended |
|
Jul. 31, 2025
USD ($)
Holding
|
|---|
| Shareholder Report [Line Items] |
|
| Document Type |
N-CSR
|
| Amendment Flag |
false
|
| Registrant Name |
Eubel Brady & Suttman Mutual Fund Trust
|
| Entity Central Index Key |
0001606378
|
| Entity Investment Company Type |
N-1A
|
| Document Period End Date |
Jul. 31, 2025
|
| C000143294 |
|
| Shareholder Report [Line Items] |
|
| Fund Name |
Eubel Brady & Suttman Income and Appreciation Fund
|
| Trading Symbol |
EBSZX
|
| Annual or Semi-Annual Statement [Text Block] |
This annual shareholder report contains important information about Eubel Brady & Suttman Income and Appreciation Fund (the "Fund") for the period of August 1, 2024 to July 31, 2025.
|
| Shareholder Report Annual or Semi-Annual |
Annual Shareholder Report
|
| Additional Information [Text Block] |
You can find additional information about the Fund at https://funddocs.filepoint.com/ebs/. You can also request this information by contacting us at (800) 391-1223.
|
| Additional Information Phone Number |
(800) 391-1223
|
| Additional Information Website |
<span style="font-weight: 700; box-sizing: border-box; color: rgb(0, 0, 0); display: inline; flex-wrap: nowrap; font-size: 10.6667px; grid-area: auto; line-height: 16px; margin: 0px; overflow: visible; text-align: left; text-align-last: auto; white-space-collapse: preserve-breaks;"> https://funddocs.filepoint.com/ebs/</span>
|
| Expenses [Text Block] |
What were the Fund’s annualized costs for the last year?(based on a hypothetical $10,000 investment) Fund Name | Costs of a $10,000 investment | Costs paid as a percentage of a $10,000 investment |
|---|
Eubel Brady & Suttman Income and Appreciation Fund | $23 | 0.22% |
|---|
|
| Expenses Paid, Amount |
$ 23
|
| Expense Ratio, Percent |
0.22%
|
| Performance Past Does Not Indicate Future [Text] |
The Fund's past performance is not a good predictor of how the Fund will perform in the future.
|
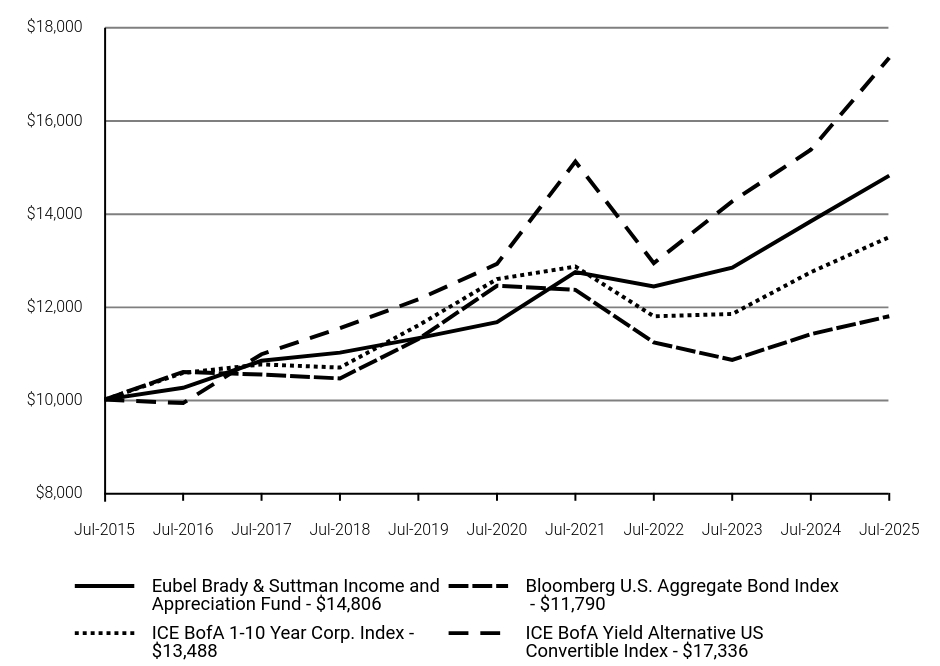
| Line Graph [Table Text Block] |
| Eubel Brady & Suttman Income and Appreciation Fund | Bloomberg U.S. Aggregate Bond Index | ICE BofA 1-10 Year Corp. Index | ICE BofA Yield Alternative US Convertible Index |
|---|
Jul-2015 | $10,000 | $10,000 | $10,000 | $10,000 |
|---|
Jul-2016 | $10,255 | $10,594 | $10,574 | $9,926 |
|---|
Jul-2017 | $10,834 | $10,539 | $10,756 | $10,975 |
|---|
Jul-2018 | $11,009 | $10,455 | $10,688 | $11,534 |
|---|
Jul-2019 | $11,319 | $11,299 | $11,594 | $12,151 |
|---|
Jul-2020 | $11,663 | $12,443 | $12,586 | $12,912 |
|---|
Jul-2021 | $12,735 | $12,356 | $12,856 | $15,107 |
|---|
Jul-2022 | $12,430 | $11,229 | $11,788 | $12,929 |
|---|
Jul-2023 | $12,832 | $10,851 | $11,838 | $14,253 |
|---|
Jul-2024 | $13,826 | $11,405 | $12,735 | $15,361 |
|---|
Jul-2025 | $14,806 | $11,790 | $13,488 | $17,336 |
|---|
|
| Average Annual Return [Table Text Block] |
Average Annual Total Returns | 1 Year | 5 Years | 10 Years |
|---|
Eubel Brady & Suttman Income and Appreciation Fund | 7.09% | 4.89% | 4.00% |
|---|
Bloomberg U.S. Aggregate Bond Index | 3.38% | -1.07% | 1.66% |
|---|
ICE BofA 1-10 Year Corp. Index | 5.91% | 1.39% | 3.04% |
|---|
ICE BofA Yield Alternative US Convertible Index | 12.85% | 6.07% | 5.66% |
|---|
|
| No Deduction of Taxes [Text Block] |
The graph and table do not reflect the deduction of taxes that a shareholder would pay on fund distributions or redemption of fund shares.
|
| AssetsNet |
$ 146,505,121
|
| Holdings Count | Holding |
35
|
| Advisory Fees Paid, Amount |
$ 0
|
| InvestmentCompanyPortfolioTurnover |
20.00%
|
| Additional Fund Statistics [Text Block] |
- Net Assets$146,505,121
- Number of Portfolio Holdings35
- Advisory Fee $0
- Portfolio Turnover20%
|
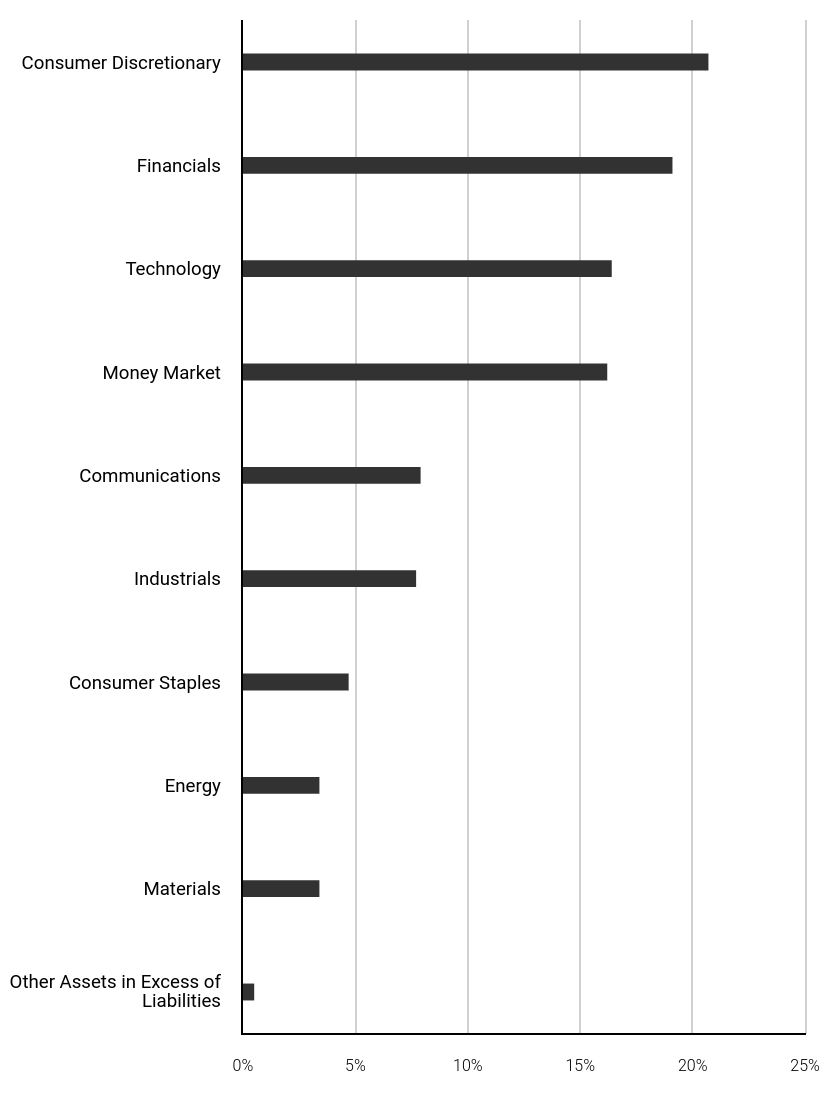
| Holdings [Text Block] |
Sector Weighting (% of net assets)Value | Value |
|---|
Other Assets in Excess of Liabilities | 0.5% | Materials | 3.4% | Energy | 3.4% | Consumer Staples | 4.7% | Industrials | 7.7% | Communications | 7.9% | Money Market | 16.2% | Technology | 16.4% | Financials | 19.1% | Consumer Discretionary | 20.7% |
Top 10 Holdings (% of net assets)Holding Name | % of Net Assets |
|---|
Patrick Industries, Inc., 1.750%, due 12/01/28 | 4.2% |
|---|
Lyft, Inc., 0.625%, due 03/01/29 | 4.2% |
|---|
Airbnb, Inc., 0.000%, due 03/15/26 | 4.0% |
|---|
TripAdvisor, Inc., 0.250%, due 04/01/26 | 3.9% |
|---|
Micron Technology, Inc., 6.750%, due 11/01/29 | 3.7% |
|---|
Winnebago Industries, Inc., 3.250%, due 01/15/30 | 3.5% |
|---|
Garrett Motion Holdings, 7.750%, due 05/31/32 144A | 3.5% |
|---|
Bentley Systems, Inc., 0.125%, due 01/15/26 | 3.5% |
|---|
JBT Marel Corporation, 0.250%, due 05/15/26 | 3.5% |
|---|
CNX Resources Corporation, 6.000%, due 01/15/29 144A | 3.4% |
|---|
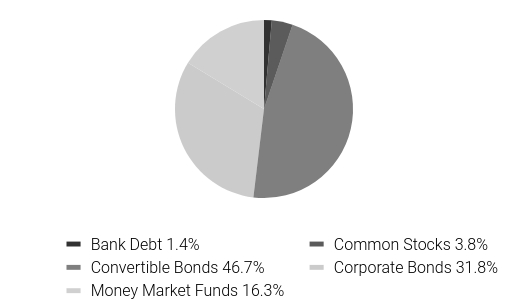
Asset Weighting (% of total investments)Value | Value |
|---|
Bank Debt | 1.4% | Common Stocks | 3.8% | Convertible Bonds | 46.7% | Corporate Bonds | 31.8% | Money Market Funds | 16.3% |
|
| Material Fund Change [Text Block] |
No material changes occurred during the year ended July 31, 2025. |
| C000143295 |
|
| Shareholder Report [Line Items] |
|
| Fund Name |
Eubel Brady & Suttman Income Fund
|
| Trading Symbol |
EBSFX
|
| Annual or Semi-Annual Statement [Text Block] |
This annual shareholder report contains important information about Eubel Brady & Suttman Income Fund (the "Fund") for the period of August 1, 2024 to July 31, 2025.
|
| Shareholder Report Annual or Semi-Annual |
Annual Shareholder Report
|
| Additional Information [Text Block] |
You can find additional information about the Fund at https://funddocs.filepoint.com/ebs/. You can also request this information by contacting us at (800) 391-1223.
|
| Additional Information Phone Number |
(800) 391-1223
|
| Additional Information Website |
<span style="font-weight: 700; box-sizing: border-box; color: rgb(0, 0, 0); display: inline; flex-wrap: nowrap; font-size: 10.6667px; grid-area: auto; line-height: 16px; margin: 0px; overflow: visible; text-align: left; text-align-last: auto; white-space-collapse: preserve-breaks;"> https://funddocs.filepoint.com/ebs/</span>
|
| Expenses [Text Block] |
What were the Fund’s annualized costs for the last year?(based on a hypothetical $10,000 investment) Fund Name | Costs of a $10,000 investment | Costs paid as a percentage of a $10,000 investment |
|---|
Eubel Brady & Suttman Income Fund | $18 | 0.17% |
|---|
|
| Expenses Paid, Amount |
$ 18
|
| Expense Ratio, Percent |
0.17%
|
| Performance Past Does Not Indicate Future [Text] |
The Fund's past performance is not a good predictor of how the Fund will perform in the future.
|
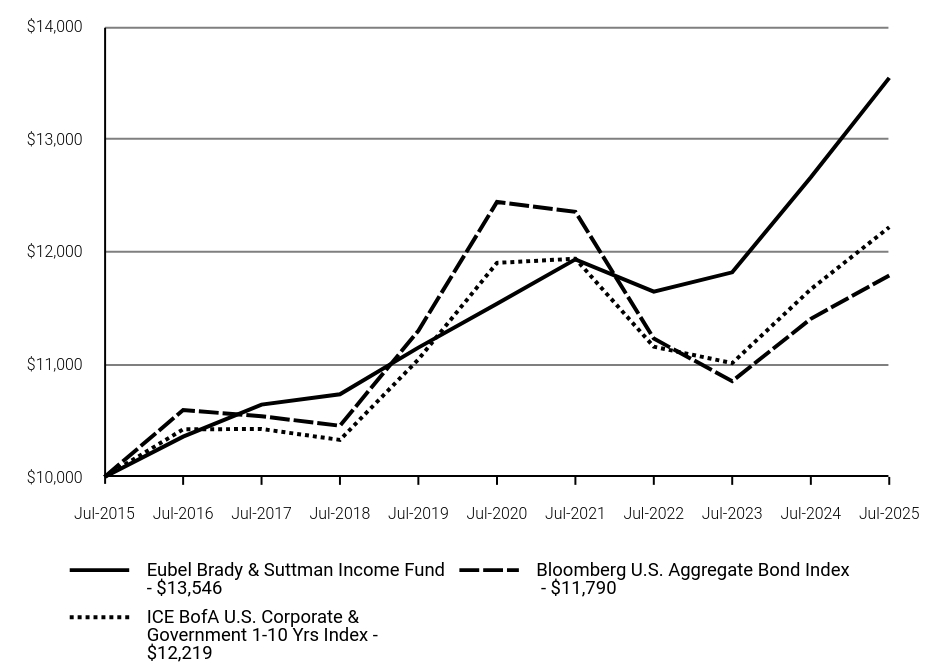
| Line Graph [Table Text Block] |
| Eubel Brady & Suttman Income Fund | Bloomberg U.S. Aggregate Bond Index | ICE BofA U.S. Corporate & Government 1-10 Yrs Index |
|---|
Jul-2015 | $10,000 | $10,000 | $10,000 |
|---|
Jul-2016 | $10,358 | $10,594 | $10,423 |
|---|
Jul-2017 | $10,643 | $10,539 | $10,426 |
|---|
Jul-2018 | $10,734 | $10,455 | $10,329 |
|---|
Jul-2019 | $11,149 | $11,299 | $11,044 |
|---|
Jul-2020 | $11,538 | $12,443 | $11,902 |
|---|
Jul-2021 | $11,933 | $12,356 | $11,939 |
|---|
Jul-2022 | $11,647 | $11,229 | $11,157 |
|---|
Jul-2023 | $11,818 | $10,851 | $11,011 |
|---|
Jul-2024 | $12,663 | $11,405 | $11,668 |
|---|
Jul-2025 | $13,546 | $11,790 | $12,219 |
|---|
|
| Average Annual Return [Table Text Block] |
Average Annual Total Returns | 1 Year | 5 Years | 10 Years |
|---|
Eubel Brady & Suttman Income Fund | 6.97% | 3.26% | 3.08% |
|---|
Bloomberg U.S. Aggregate Bond Index | 3.38% | -1.07% | 1.66% |
|---|
ICE BofA U.S. Corporate & Government 1-10 Yrs Index | 4.73% | 0.53% | 2.02% |
|---|
|
| No Deduction of Taxes [Text Block] |
The graph and table do not reflect the deduction of taxes that a shareholder would pay on fund distributions or redemption of fund shares.
|
| AssetsNet |
$ 412,395,649
|
| Holdings Count | Holding |
54
|
| Advisory Fees Paid, Amount |
$ 0
|
| InvestmentCompanyPortfolioTurnover |
38.00%
|
| Additional Fund Statistics [Text Block] |
- Net Assets$412,395,649
- Number of Portfolio Holdings54
- Advisory Fee $0
- Portfolio Turnover38%
|
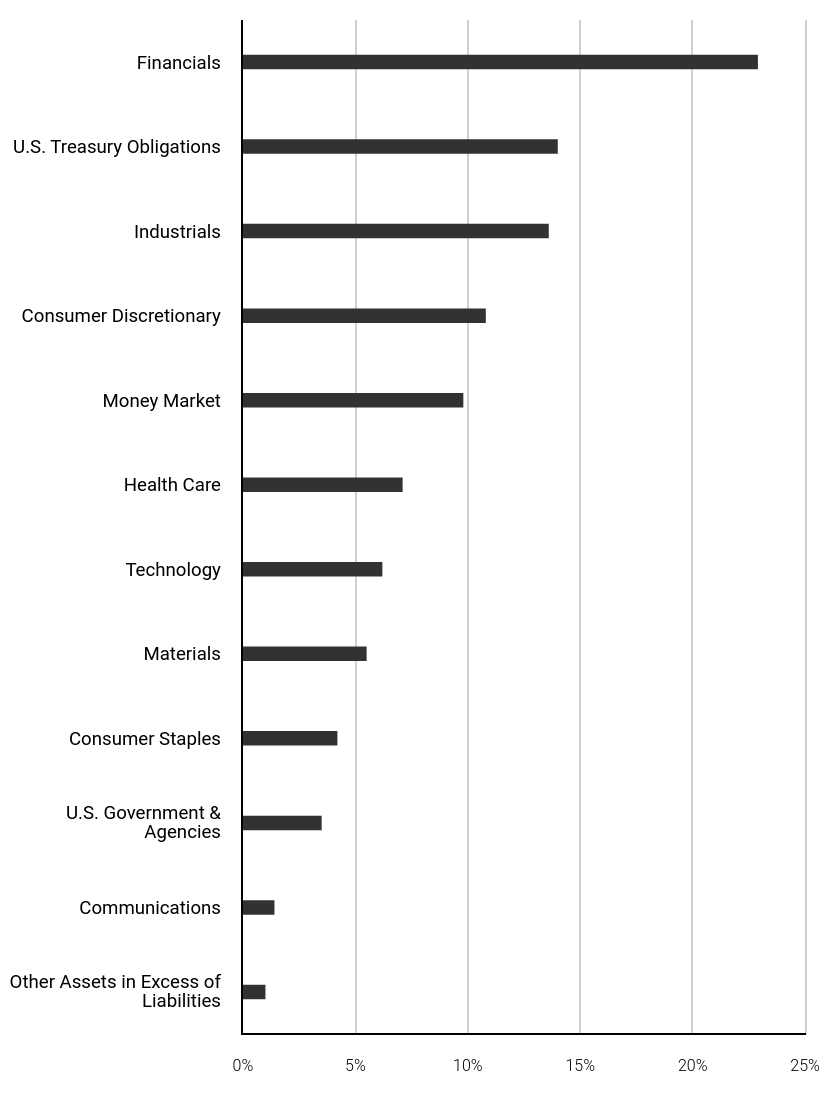
| Holdings [Text Block] |
Sector Weighting (% of net assets)Value | Value |
|---|
Other Assets in Excess of Liabilities | 1.0% | Communications | 1.4% | U.S. Government & Agencies | 3.5% | Consumer Staples | 4.2% | Materials | 5.5% | Technology | 6.2% | Health Care | 7.1% | Money Market | 9.8% | Consumer Discretionary | 10.8% | Industrials | 13.6% | U.S. Treasury Obligations | 14.0% | Financials | 22.9% |
Top 10 Holdings (% of net assets)Holding Name | % of Net Assets |
|---|
U.S. Treasury Notes, 4.375%, due 12/31/29 | 3.1% |
|---|
Timken Company (The), 4.500%, due 12/15/28 | 3.0% |
|---|
U.S. Treasury Notes, 4.625%, due 04/30/29 | 3.0% |
|---|
U.S. Treasury Notes, 4.500%, due 05/15/27 | 2.9% |
|---|
Mohawk Industries, Inc., 5.850%, due 09/18/28 | 2.8% |
|---|
Penske Truck Leasing Company, L.P., 5.700%, due 02/01/28 144A | 2.7% |
|---|
LKQ Corporation, 5.750%, due 06/15/28 | 2.7% |
|---|
HEICO Corporation, 5.250%, due 08/01/28 | 2.7% |
|---|
Bank OZK, 2.750%, due 10/01/31 | 2.6% |
|---|
U.S. Treasury Notes, 4.250%, due 01/15/28 | 2.6% |
|---|
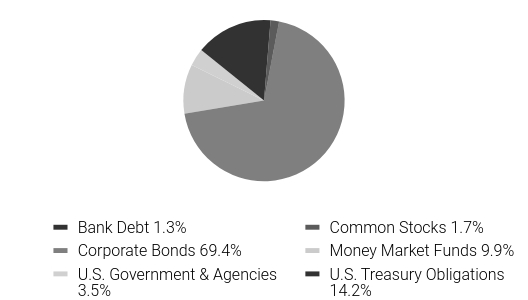
Asset Weighting (% of total investments)Value | Value |
|---|
Bank Debt | 1.3% | Common Stocks | 1.7% | Corporate Bonds | 69.4% | Money Market Funds | 9.9% | U.S. Government & Agencies | 3.5% | U.S. Treasury Obligations | 14.2% |
|
| Material Fund Change [Text Block] |
No material changes occurred during the year ended July 31, 2025. |