
First Quarter FY 2026Earnings Results October 2, 2025
Forward looking statements 2 Notice Regarding Forward-Looking Statements This
presentation contains forward-looking statements within the meaning of the Private Securities Litigation Reform Act of 1995. All statements regarding AngioDynamics’ expected future financial position, results of operations, cash flows, business
strategy, budgets, projected costs, capital expenditures, products, competitive positions, growth opportunities, plans and objectives of management for future operations, as well as statements that include the words such as “expects,”
“reaffirms,” “intends,” “anticipates,” “plans,” “projects,” “believes,” “seeks,” “estimates,” “optimistic,” or variations of such words and similar expressions, are forward-looking statements. These forward-looking statements are not guarantees
of future performance and are subject to risks and uncertainties. Investors are cautioned that actual events or results may differ materially from AngioDynamics’ expectations, expressed or implied. Factors that may affect the actual results
achieved by AngioDynamics include, without limitation, the scale and scope of the COVID-19 global pandemic, the ability of AngioDynamics to develop its existing and new products, technological advances and patents attained by competitors,
infringement of AngioDynamics’ technology or assertions that AngioDynamics’ technology infringes the technology of third parties, the ability of AngioDynamics to effectively compete against competitors that have substantially greater resources,
future actions by the FDA or other regulatory agencies, domestic and foreign health care reforms and government regulations, results of pending or future clinical trials, overall economic conditions (including inflation, tariffs, labor
shortages and supply chain challenges including the cost and availability of raw materials), the results of on-going litigation, challenges with respect to third-party distributors or joint venture partners or collaborators, the results of
sales efforts, the effects of product recalls and product liability claims, changes in key personnel, the ability of AngioDynamics to execute on strategic initiatives, the effects of economic, credit and capital market conditions, general
market conditions, market acceptance, foreign currency exchange rate fluctuations, the effects on pricing from group purchasing organizations and competition, the ability of AngioDynamics to obtain regulatory clearances or approval of its
products, or to integrate acquired businesses, as well as the risk factors listed from time to time in AngioDynamics’ SEC filings, including but not limited to its Annual Report on Form 10-K for the year ended May 31, 2025. AngioDynamics does
not assume any obligation to publicly update or revise any forward-looking statements for any reason. Notice Regarding Non-GAAP Financial Measures Management uses non-GAAP measures to establish operational goals and believes that non-GAAP
measures may assist investors in analyzing the underlying trends in AngioDynamics’ business over time. Investors should consider these non-GAAP measures in addition to, not as a substitute for or as superior to, financial reporting measures
prepared in accordance with GAAP. In this presentation, AngioDynamics has reported pro forma results, adjusted EBITDA (income before interest, taxes, depreciation and amortization and stock-based compensation); adjusted net income and adjusted
earnings per share. Management uses these measures in its internal analysis and review of operational performance. Management believes that these measures provide investors with useful information in comparing AngioDynamics’ performance over
different periods. By using these non-GAAP measures, management believes that investors get a better picture of the performance of AngioDynamics’ underlying business. Management encourages investors to review AngioDynamics’ financial results
prepared in accordance with GAAP to understand AngioDynamics’ performance taking into account all relevant factors, including those that may only occur from time to time but have a material impact on AngioDynamics’ financial results. Please see
the tables that follow for a reconciliation of non-GAAP measures to measures prepared in accordance with GAAP.
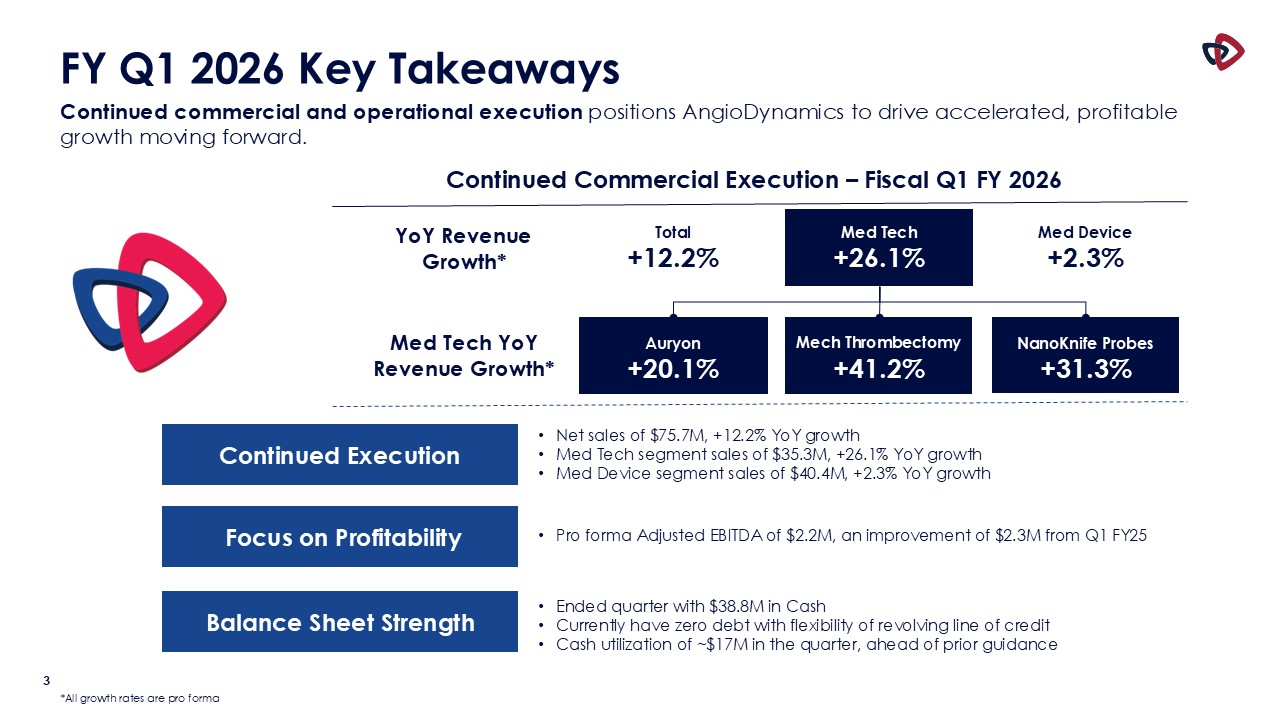
3 FY Q1 2026 Key Takeaways Continued commercial and operational execution
positions AngioDynamics to drive accelerated, profitable growth moving forward. Continued Commercial Execution – Fiscal Q1 FY 2026 Total +12.2% YoY Revenue Growth* Med Tech +26.1% Med Device +2.3% Auryon +20.1% Med Tech YoY
Revenue Growth* Mech Thrombectomy +41.2% NanoKnife Probes +31.3% Focus on Profitability Balance Sheet Strength Ended quarter with $38.8M in Cash Currently have zero debt with flexibility of revolving line of credit Cash utilization
of ~$17M in the quarter, ahead of prior guidance Pro forma Adjusted EBITDA of $2.2M, an improvement of $2.3M from Q1 FY25 Continued Execution Net sales of $75.7M, +12.2% YoY growth Med Tech segment sales of $35.3M, +26.1% YoY growth Med
Device segment sales of $40.4M, +2.3% YoY growth *All growth rates are pro forma
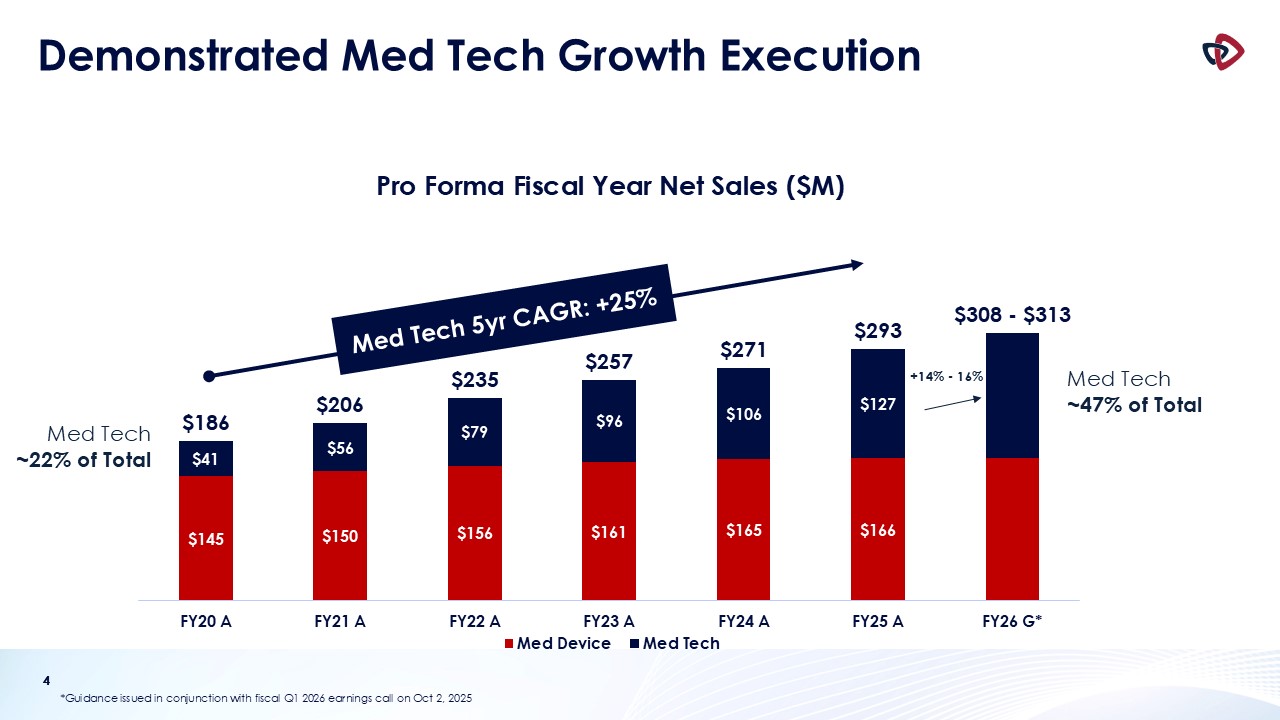
4 Demonstrated Med Tech Growth Execution 4 Med Tech ~22% of Total Med
Tech ~47% of Total +14% - 16% *Guidance issued in conjunction with fiscal Q1 2026 earnings call on Oct 2, 2025 Med Tech 5yr CAGR: +25%
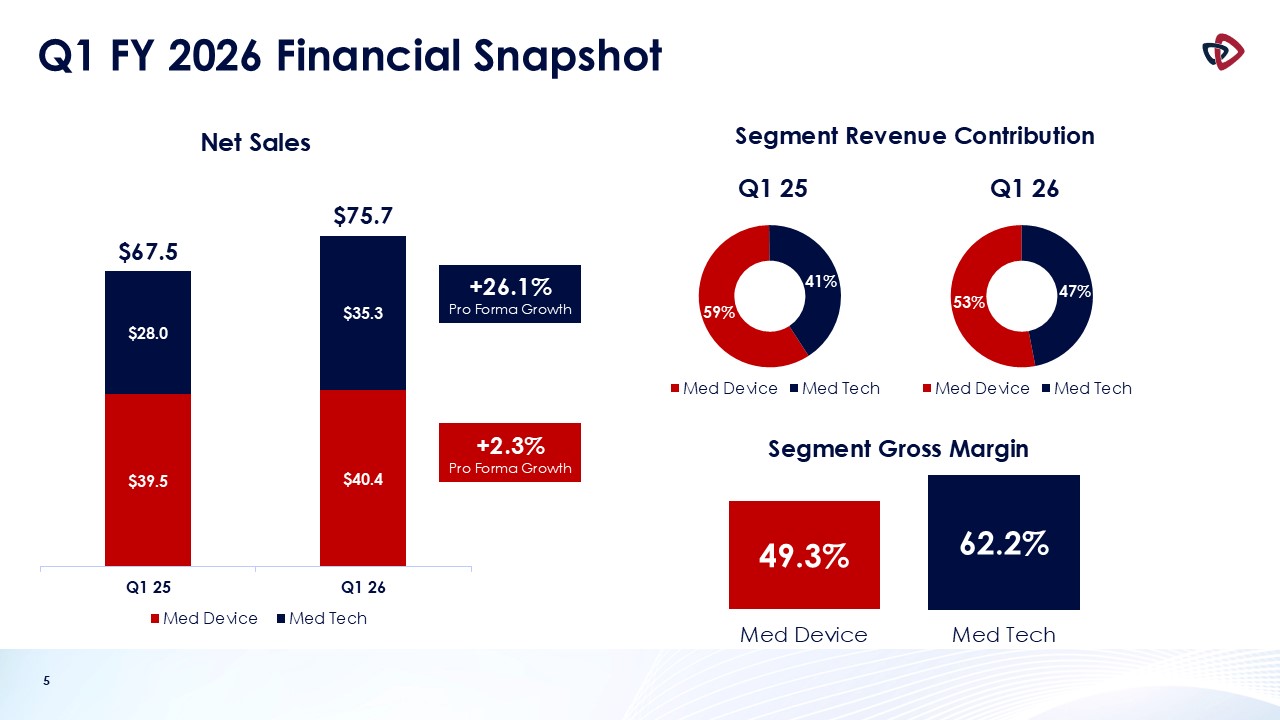
5 Q1 FY 2026 Financial Snapshot +2.3% Pro Forma Growth +26.1% Pro Forma
Growth Segment Revenue Contribution Segment Gross Margin 49.3% 62.2% Med Device Med Tech
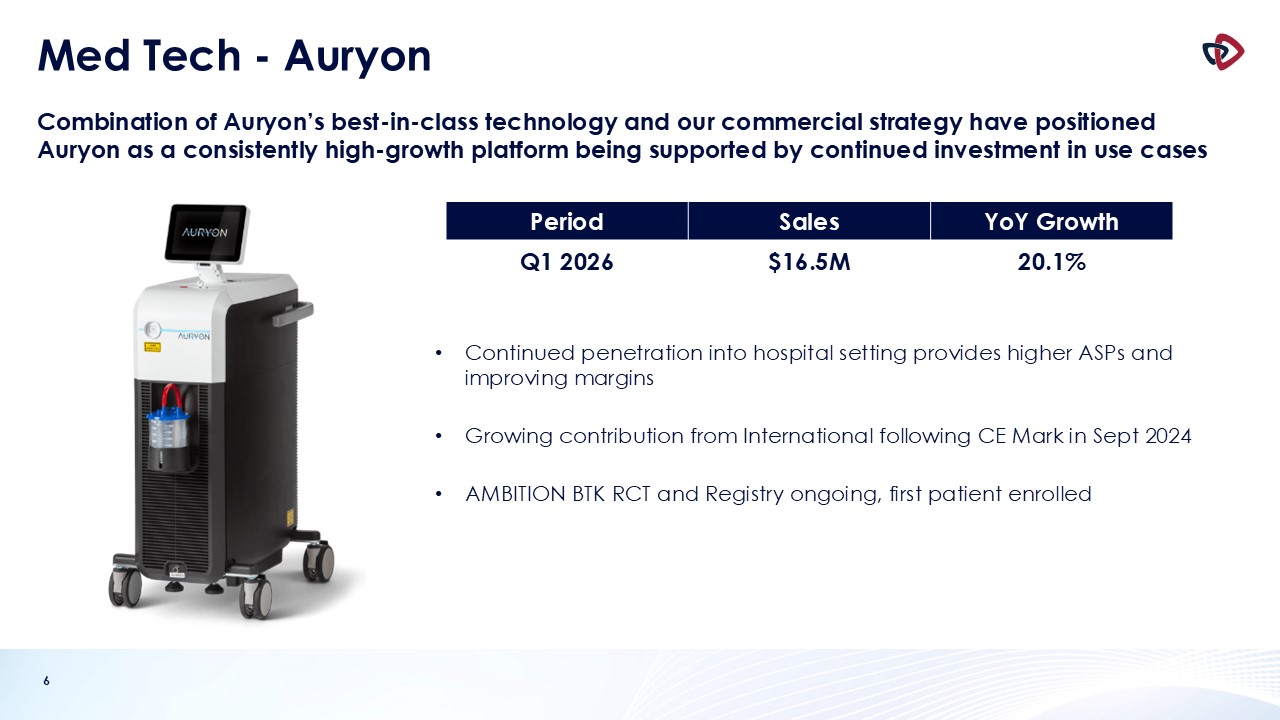
6 Med Tech - Auryon Combination of Auryon’s best-in-class technology and our
commercial strategy have positioned Auryon as a consistently high-growth platform being supported by continued investment in use cases Period Sales YoY Growth Q1 2026 $16.5M 20.1% Continued penetration into hospital setting provides
higher ASPs and improving margins Growing contribution from International following CE Mark in Sept 2024 AMBITION BTK RCT and Registry ongoing, first patient enrolled
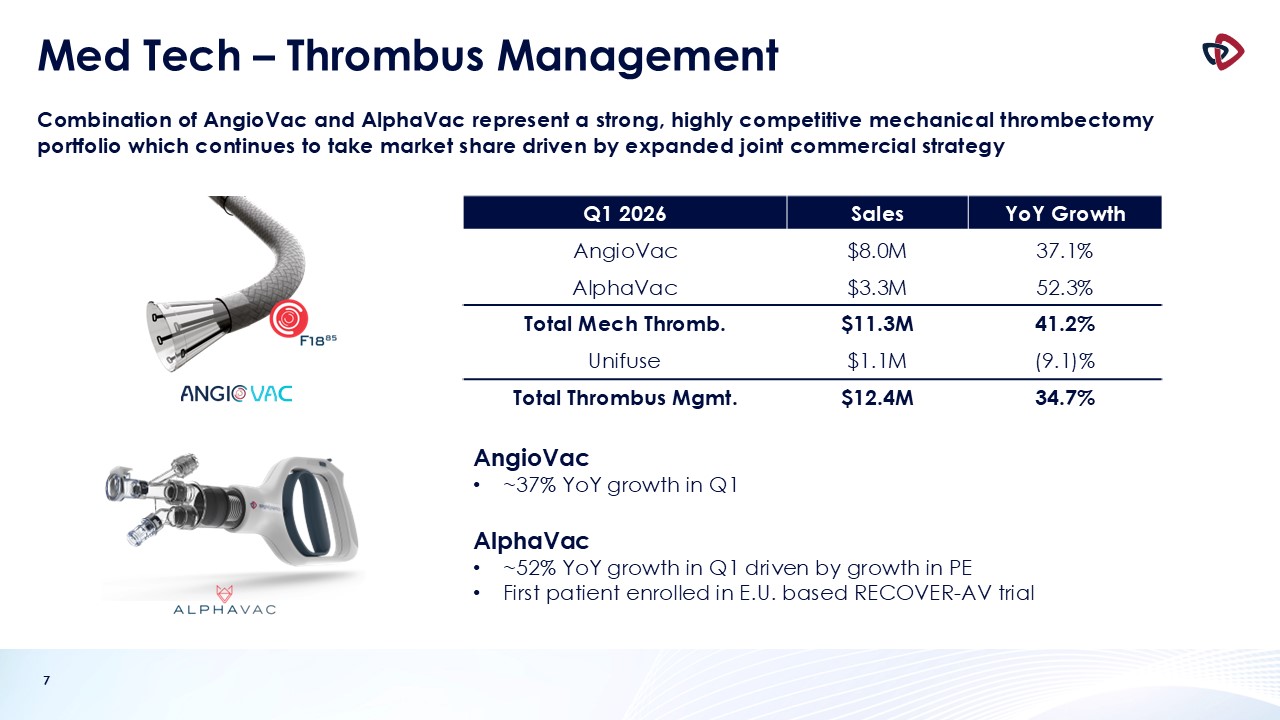
7 Med Tech – Thrombus Management Combination of AngioVac and AlphaVac represent
a strong, highly competitive mechanical thrombectomy portfolio which continues to take market share driven by expanded joint commercial strategy AngioVac ~37% YoY growth in Q1 AlphaVac ~52% YoY growth in Q1 driven by growth in PE First
patient enrolled in E.U. based RECOVER-AV trial Q1 2026 Sales YoY Growth AngioVac $8.0M 37.1% AlphaVac $3.3M 52.3% Total Mech Thromb. $11.3M 41.2% Unifuse $1.1M (9.1)% Total Thrombus Mgmt. $12.4M 34.7%
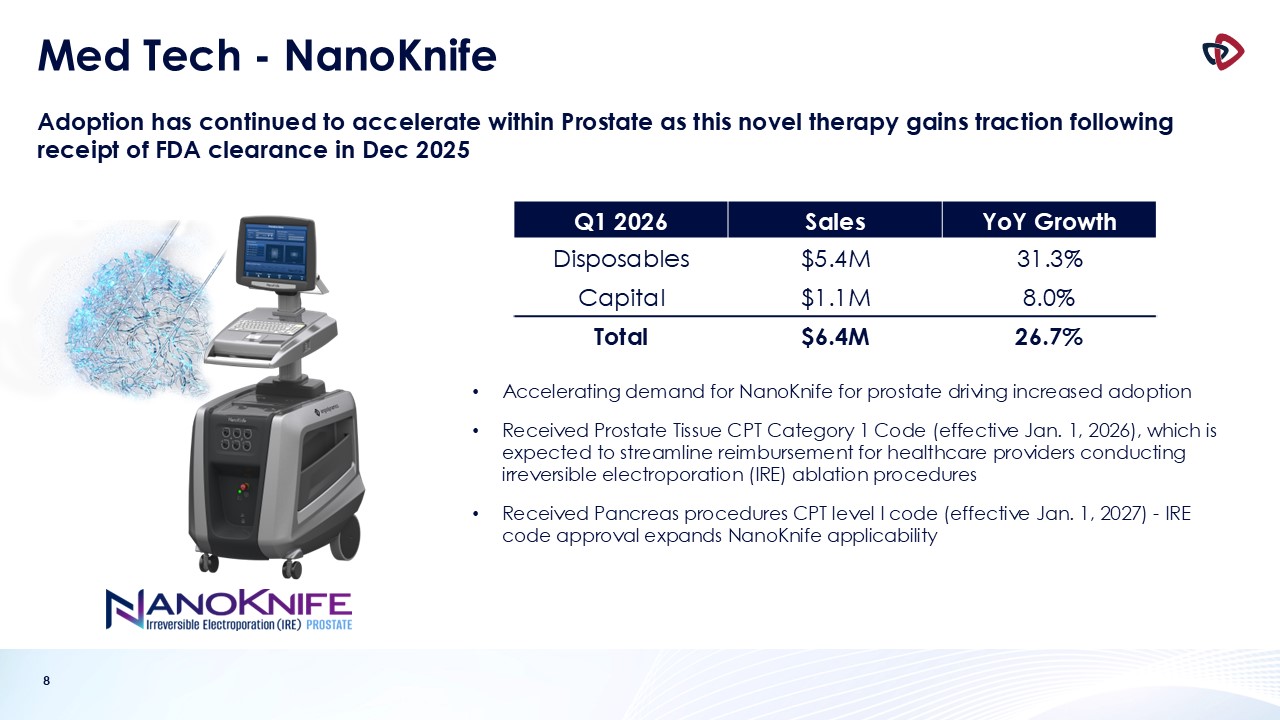
8 Med Tech - NanoKnife Adoption has continued to accelerate within Prostate as
this novel therapy gains traction following receipt of FDA clearance in Dec 2025 Accelerating demand for NanoKnife for prostate driving increased adoption Received Prostate Tissue CPT Category 1 Code (effective Jan. 1, 2026), which is
expected to streamline reimbursement for healthcare providers conducting irreversible electroporation (IRE) ablation procedures Received Pancreas procedures CPT level I code (effective Jan. 1, 2027) - IRE code approval expands NanoKnife
applicability Q1 2026 Sales YoY Growth Disposables $5.4M 31.3% Capital $1.1M 8.0% Total $6.4M 26.7%
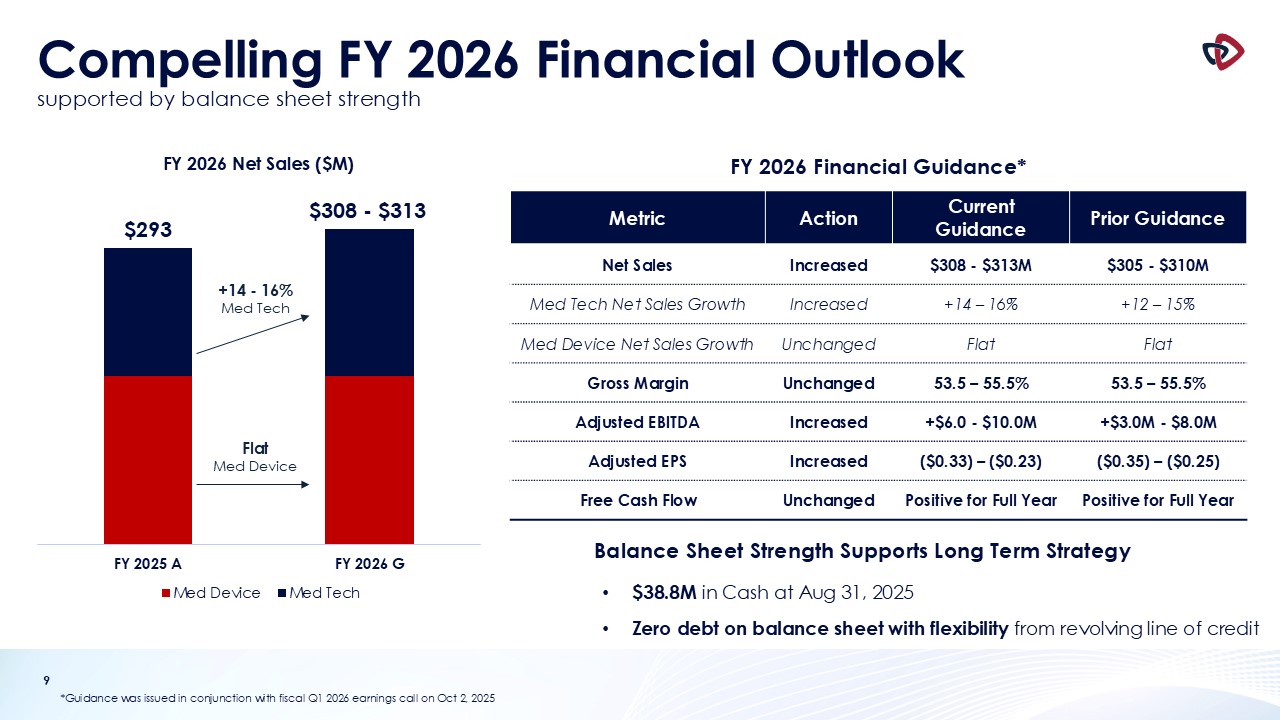
9 Compelling FY 2026 Financial Outlooksupported by balance sheet
strength *Guidance was issued in conjunction with fiscal Q1 2026 earnings call on Oct 2, 2025 +14 - 16% Med Tech Metric Action Current Guidance Prior Guidance Net Sales Increased $308 - $313M $305 - $310M Med Tech Net Sales
Growth Increased +14 – 16% +12 – 15% Med Device Net Sales Growth Unchanged Flat Flat Gross Margin Unchanged 53.5 – 55.5% 53.5 – 55.5% Adjusted EBITDA Increased +$6.0 - $10.0M +$3.0M - $8.0M Adjusted EPS Increased ($0.33) –
($0.23) ($0.35) – ($0.25) Free Cash Flow Unchanged Positive for Full Year Positive for Full Year Flat Med Device Balance Sheet Strength Supports Long Term Strategy FY 2026 Financial Guidance* $38.8M in Cash at Aug 31, 2025 Zero debt
on balance sheet with flexibility from revolving line of credit

10 Appendix
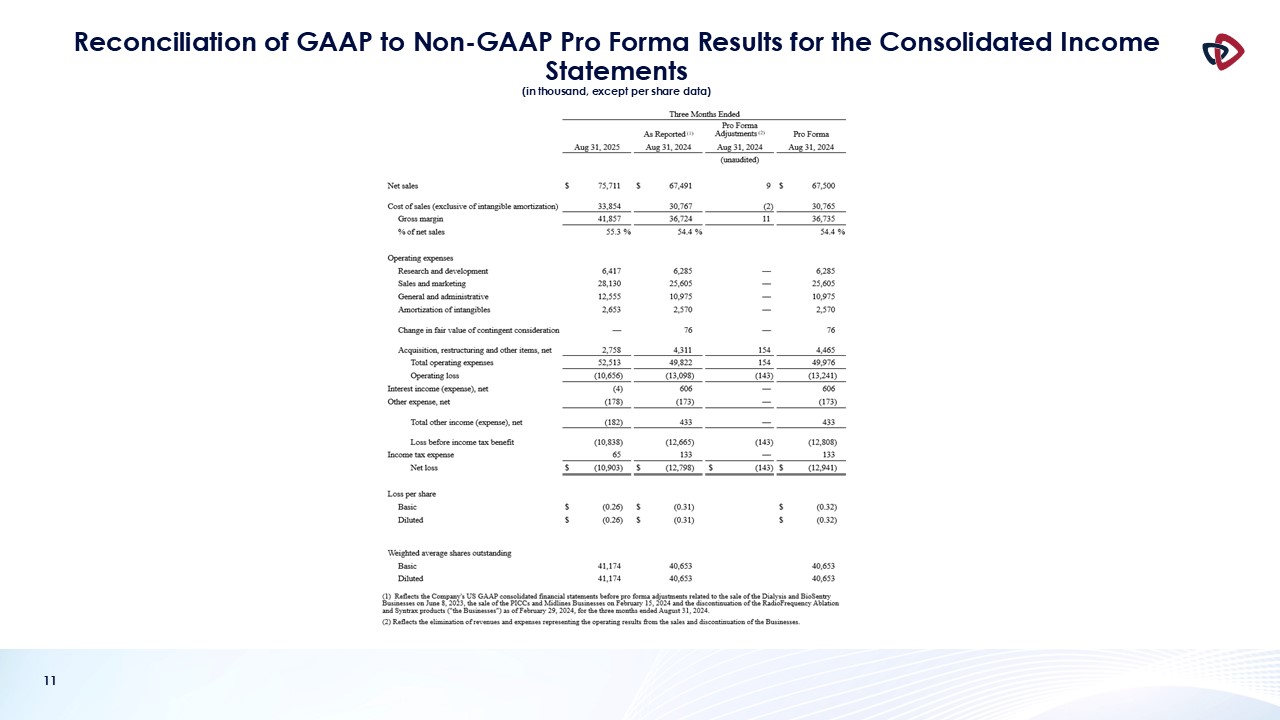
11 Reconciliation of GAAP to Non-GAAP Pro Forma Results for the Consolidated
Income Statements (in thousand, except per share data)
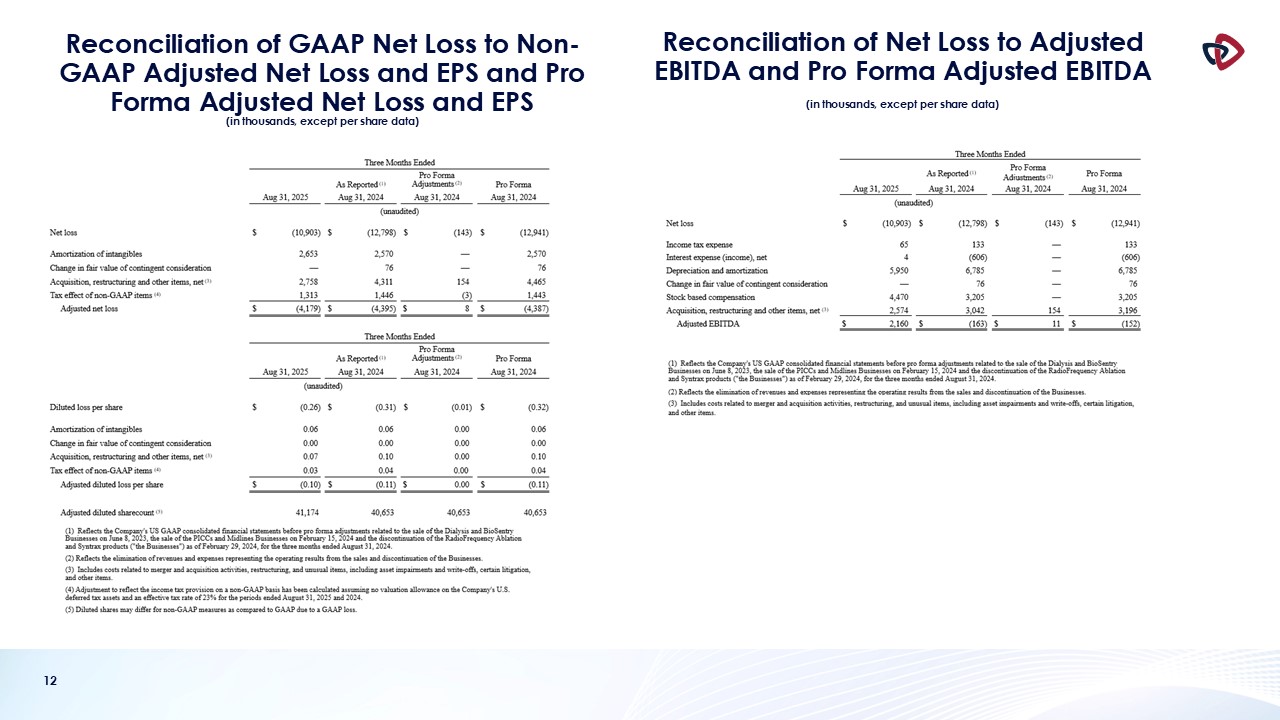
12 Reconciliation of GAAP Net Loss to Non-GAAP Adjusted Net Loss and EPS and Pro
Forma Adjusted Net Loss and EPS (in thousands, except per share data) Reconciliation of Net Loss to Adjusted EBITDA and Pro Forma Adjusted EBITDA (in thousands, except per share data)
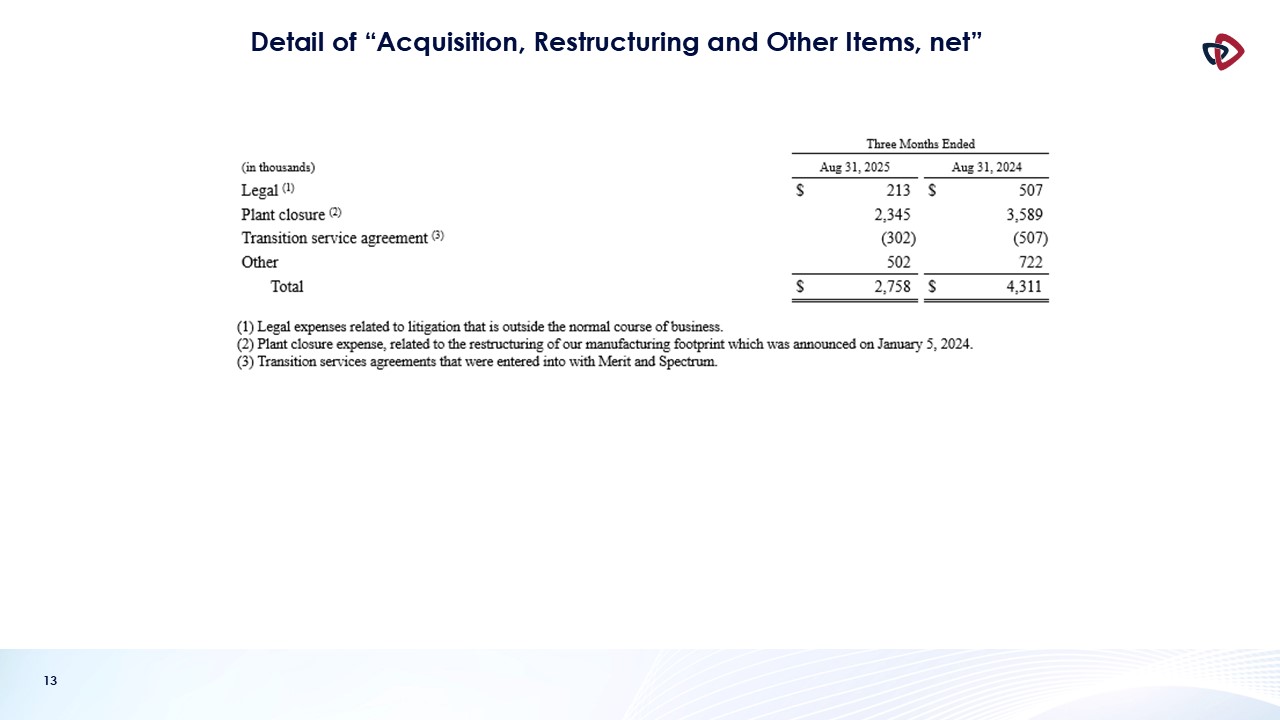
13 Detail of “Acquisition, Restructuring and Other Items, net”
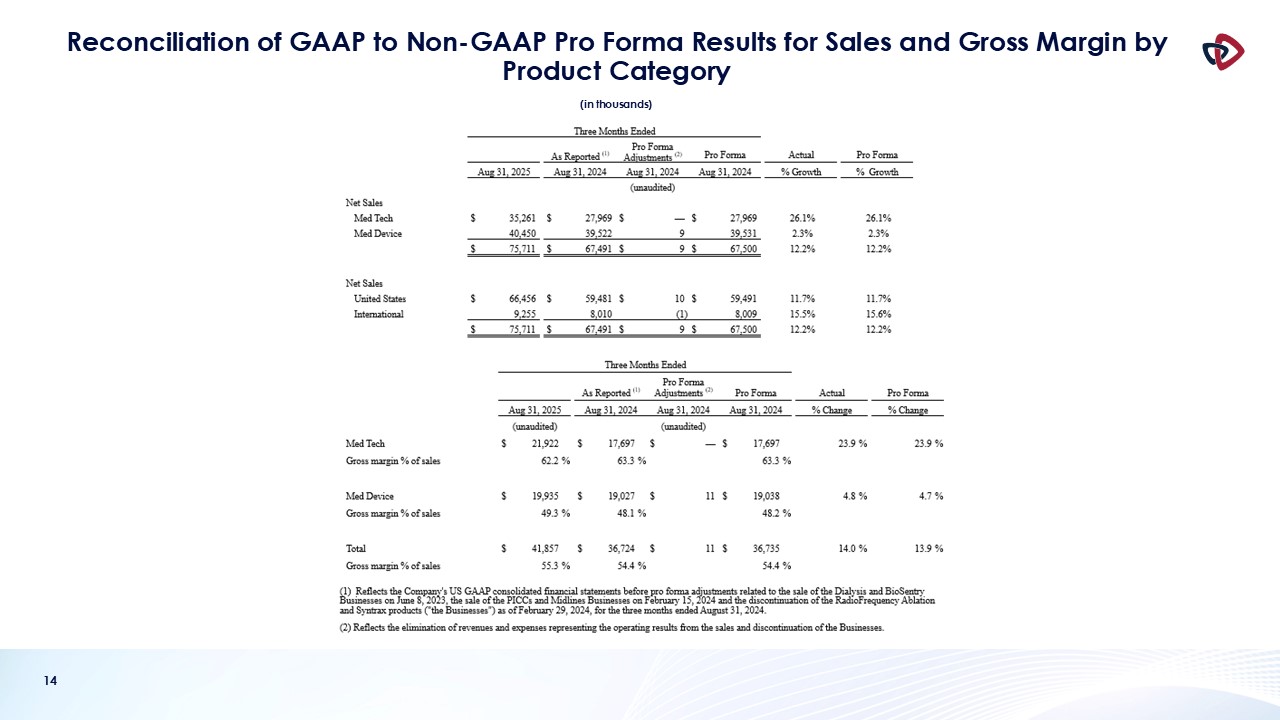
14 Reconciliation of GAAP to Non-GAAP Pro Forma Results for Sales and Gross
Margin by Product Category (in thousands)