Shareholder Report
|
6 Months Ended |
|
Jul. 31, 2025
USD ($)
Holding
|
|---|
| Shareholder Report [Line Items] |
|
|
| Document Type |
N-CSRS
|
|
| Amendment Flag |
false
|
|
| Registrant Name |
SEI DAILY INCOME TRUST
|
|
| Entity Central Index Key |
0000701939
|
|
| Entity Investment Company Type |
N-1A
|
|
| Document Period End Date |
Jul. 31, 2025
|
|
| C000018365 |
|
|
| Shareholder Report [Line Items] |
|
|
| Fund Name |
Government Fund
|
|
| Class Name |
Institutional Class Shares
|
|
| Trading Symbol |
SEOXX
|
|
| Annual or Semi-Annual Statement [Text Block] |
This semi-annual shareholder report contains important information about Institutional Class Shares of the Government Fund (the "Fund") for the period from February 1, 2025 to July 31, 2025.
|
|
| Shareholder Report Annual or Semi-Annual |
Semi-Annual Shareholder Report
|
|
| Additional Information [Text Block] |
You can find additional information about the Fund at https://www.seic.com/mutual-fund-documentation/prospectuses-and-reports. You can also request this information by contacting us at 610-676-1000.
|
|
| Additional Information Phone Number |
610-676-1000
|
|
| Additional Information Website |
https://www.seic.com/mutual-fund-documentation/prospectuses-and-reports
|
|
| Expenses [Text Block] |
What were the Fund costs for the last six months?(based on a hypothetical $10,000 investment) Fund Name | Costs of a $10,000 investment | Costs paid as a percentage of a $10,000 investment |
|---|
Government Fund, Institutional Class Shares | $11 | 0.21%Footnote Reference(1) |
|---|
| Footnote | Description | Footnote(1) | The expense ratio includes a proxy fee expense. Had this expense been excluded the ratio would have been 0.20%. |
|
|
| Expenses Paid, Amount |
$ 11
|
|
| Expense Ratio, Percent |
0.21%
|
[1] |
| AssetsNet |
$ 6,233,994,000
|
|
| Holdings Count | Holding |
116
|
|
| Advisory Fees Paid, Amount |
$ 2,178
|
|
| Additional Fund Statistics [Text Block] |
Key Fund Statistics as of July 31, 2025 | Total Net Assets (000's) | Number of Holdings | Total Advisory Fees Paid (000's) |
|---|
| $6,233,994 | 116 | $2,178 |
|---|
|
|
| Holdings [Text Block] |
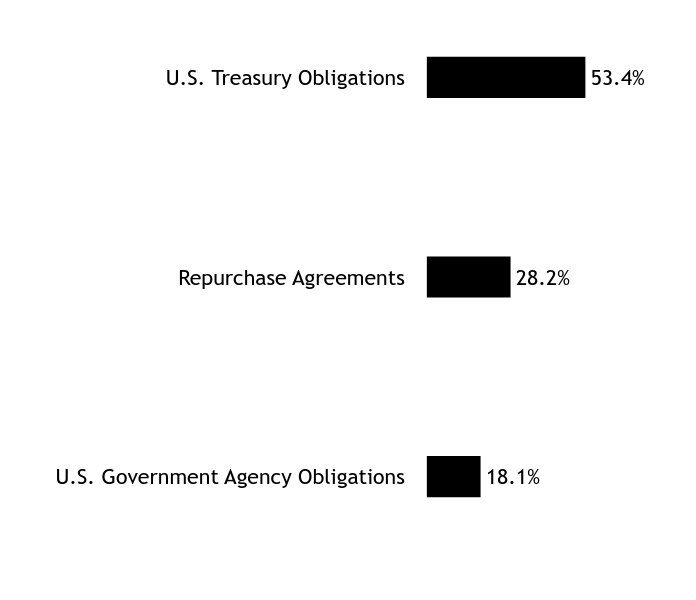
Asset WeightingsFootnote Reference*Value | Value |
|---|
U.S. Government Agency Obligations | 18.1% | Repurchase Agreements | 28.2% | U.S. Treasury Obligations | 53.4% |
| Footnote | Description | Footnote* | Percentages are calculated based on total net assets. |
|
|
| Largest Holdings [Text Block] |
Holding Name | Coupon Rate | Maturity Date | Percentage of Total
Net Assets |
|---|
Natixis S.A. | 4.360%
| 08/01/25
| 3.4% | U.S. Treasury Bills | 4.291%
| 09/11/25
| 3.4% | U.S. Treasury Bills | 4.248%
| 08/19/25
| 3.3% | U.S. Treasury Bills | 4.244%
| 08/07/25
| 3.2% | Barclays Bank | 4.360%
| 08/01/25
| 3.2% | Mizuho Securities | 4.370%
| 08/01/25
| 3.2% | MUFG Securities Americas | 4.360%
| 08/01/25
| 3.2% | Citigroup Global Markets | 4.360%
| 08/01/25
| 3.1% | U.S. Treasury Bills | 4.258%
| 09/09/25
| 3.1% | BNP Paribas | 4.360%
| 08/01/25
| 2.8% |
|
|
| C000162326 |
|
|
| Shareholder Report [Line Items] |
|
|
| Fund Name |
Government Fund
|
|
| Class Name |
Admin Class Shares
|
|
| Trading Symbol |
GFAXX
|
|
| Annual or Semi-Annual Statement [Text Block] |
This semi-annual shareholder report contains important information about Admin Class Shares of the Government Fund (the "Fund") for the period from February 1, 2025 to July 31, 2025.
|
|
| Shareholder Report Annual or Semi-Annual |
Semi-Annual Shareholder Report
|
|
| Additional Information [Text Block] |
You can find additional information about the Fund at https://www.seic.com/mutual-fund-documentation/prospectuses-and-reports. You can also request this information by contacting us at 610-676-1000.
|
|
| Additional Information Phone Number |
610-676-1000
|
|
| Additional Information Website |
https://www.seic.com/mutual-fund-documentation/prospectuses-and-reports
|
|
| Expenses [Text Block] |
What were the Fund costs for the last six months?(based on a hypothetical $10,000 investment) Fund Name | Costs of a $10,000 investment | Costs paid as a percentage of a $10,000 investment |
|---|
Government Fund, Admin Class Shares | $19 | 0.37%Footnote Reference(1) |
|---|
| Footnote | Description | Footnote(1) | The expense ratio includes a proxy fee expense. Had this expense been excluded the ratio would have been 0.35%. |
|
|
| Expenses Paid, Amount |
$ 19
|
|
| Expense Ratio, Percent |
0.37%
|
[2] |
| AssetsNet |
$ 6,233,994,000
|
|
| Holdings Count | Holding |
116
|
|
| Advisory Fees Paid, Amount |
$ 2,178
|
|
| Additional Fund Statistics [Text Block] |
Key Fund Statistics as of July 31, 2025 | Total Net Assets (000's) | Number of Holdings | Total Advisory Fees Paid (000's) |
|---|
| $6,233,994 | 116 | $2,178 |
|---|
|
|
| Holdings [Text Block] |
Asset WeightingsFootnote Reference*Value | Value |
|---|
U.S. Government Agency Obligations | 18.1% | Repurchase Agreements | 28.2% | U.S. Treasury Obligations | 53.4% |
| Footnote | Description | Footnote* | Percentages are calculated based on total net assets. |
|
|
| Largest Holdings [Text Block] |
Holding Name | Coupon Rate | Maturity Date | Percentage of Total
Net Assets |
|---|
Natixis S.A. | 4.360%
| 08/01/25
| 3.4% | U.S. Treasury Bills | 4.291%
| 09/11/25
| 3.4% | U.S. Treasury Bills | 4.248%
| 08/19/25
| 3.3% | U.S. Treasury Bills | 4.244%
| 08/07/25
| 3.2% | Barclays Bank | 4.360%
| 08/01/25
| 3.2% | Mizuho Securities | 4.370%
| 08/01/25
| 3.2% | MUFG Securities Americas | 4.360%
| 08/01/25
| 3.2% | Citigroup Global Markets | 4.360%
| 08/01/25
| 3.1% | U.S. Treasury Bills | 4.258%
| 09/09/25
| 3.1% | BNP Paribas | 4.360%
| 08/01/25
| 2.8% |
|
|
| C000240469 |
|
|
| Shareholder Report [Line Items] |
|
|
| Fund Name |
Government Fund
|
|
| Class Name |
Wealth Class Shares
|
|
| Trading Symbol |
AABXX
|
|
| Annual or Semi-Annual Statement [Text Block] |
This semi-annual shareholder report contains important information about Wealth Class Shares of the Government Fund (the "Fund") for the period from February 1, 2025 to July 31, 2025.
|
|
| Shareholder Report Annual or Semi-Annual |
Semi-Annual Shareholder Report
|
|
| Additional Information [Text Block] |
You can find additional information about the Fund at https://www.seic.com/mutual-fund-documentation/prospectuses-and-reports. You can also request this information by contacting us at 610-676-1000.
|
|
| Additional Information Phone Number |
610-676-1000
|
|
| Additional Information Website |
https://www.seic.com/mutual-fund-documentation/prospectuses-and-reports
|
|
| Expenses [Text Block] |
What were the Fund costs for the last six months?(based on a hypothetical $10,000 investment) Fund Name | Costs of a $10,000 investment | Costs paid as a percentage of a $10,000 investment |
|---|
Government Fund, Wealth Class Shares | $19 | 0.37%Footnote Reference(1) |
|---|
| Footnote | Description | Footnote(1) | The expense ratio includes a proxy fee expense. Had this expense been excluded the ratio would have been 0.35%. |
|
|
| Expenses Paid, Amount |
$ 19
|
|
| Expense Ratio, Percent |
0.37%
|
[3] |
| AssetsNet |
$ 6,233,994,000
|
|
| Holdings Count | Holding |
116
|
|
| Advisory Fees Paid, Amount |
$ 2,178
|
|
| Additional Fund Statistics [Text Block] |
Key Fund Statistics as of July 31, 2025 | Total Net Assets (000's) | Number of Holdings | Total Advisory Fees Paid (000's) |
|---|
| $6,233,994 | 116 | $2,178 |
|---|
|
|
| Holdings [Text Block] |
Asset WeightingsFootnote Reference*Value | Value |
|---|
U.S. Government Agency Obligations | 18.1% | Repurchase Agreements | 28.2% | U.S. Treasury Obligations | 53.4% |
| Footnote | Description | Footnote* | Percentages are calculated based on total net assets. |
|
|
| Largest Holdings [Text Block] |
Holding Name | Coupon Rate | Maturity Date | Percentage of Total
Net Assets |
|---|
Natixis S.A. | 4.360%
| 08/01/25
| 3.4% | U.S. Treasury Bills | 4.291%
| 09/11/25
| 3.4% | U.S. Treasury Bills | 4.248%
| 08/19/25
| 3.3% | U.S. Treasury Bills | 4.244%
| 08/07/25
| 3.2% | Barclays Bank | 4.360%
| 08/01/25
| 3.2% | Mizuho Securities | 4.370%
| 08/01/25
| 3.2% | MUFG Securities Americas | 4.360%
| 08/01/25
| 3.2% | Citigroup Global Markets | 4.360%
| 08/01/25
| 3.1% | U.S. Treasury Bills | 4.258%
| 09/09/25
| 3.1% | BNP Paribas | 4.360%
| 08/01/25
| 2.8% |
|
|
| C000018374 |
|
|
| Shareholder Report [Line Items] |
|
|
| Fund Name |
Government II Fund
|
|
| Class Name |
Class F Shares
|
|
| Trading Symbol |
TCGXX
|
|
| Annual or Semi-Annual Statement [Text Block] |
This semi-annual shareholder report contains important information about Class F Shares of the Government II Fund (the "Fund") for the period from February 1, 2025 to July 31, 2025.
|
|
| Shareholder Report Annual or Semi-Annual |
Semi-Annual Shareholder Report
|
|
| Additional Information [Text Block] |
You can find additional information about the Fund at https://www.seic.com/mutual-fund-documentation/prospectuses-and-reports. You can also request this information by contacting us at 610-676-1000.
|
|
| Additional Information Phone Number |
610-676-1000
|
|
| Additional Information Website |
https://www.seic.com/mutual-fund-documentation/prospectuses-and-reports
|
|
| Expenses [Text Block] |
What were the Fund costs for the last six months?(based on a hypothetical $10,000 investment) Fund Name | Costs of a $10,000 investment | Costs paid as a percentage of a $10,000 investment |
|---|
Government II Fund, Class F Shares | $11 | 0.21%Footnote Reference(1) |
|---|
| Footnote | Description | Footnote(1) | The expense ratio includes a proxy fee expense. Had this expense been excluded the ratio would have been 0.20%. |
|
|
| Expenses Paid, Amount |
$ 11
|
|
| Expense Ratio, Percent |
0.21%
|
[4] |
| AssetsNet |
$ 1,473,396,000
|
|
| Holdings Count | Holding |
103
|
|
| Advisory Fees Paid, Amount |
$ 342
|
|
| Additional Fund Statistics [Text Block] |
Key Fund Statistics as of July 31, 2025 | Total Net Assets (000's) | Number of Holdings | Total Advisory Fees Paid (000's) |
|---|
| $1,473,396 | 103 | $342 |
|---|
|
|
| Holdings [Text Block] |
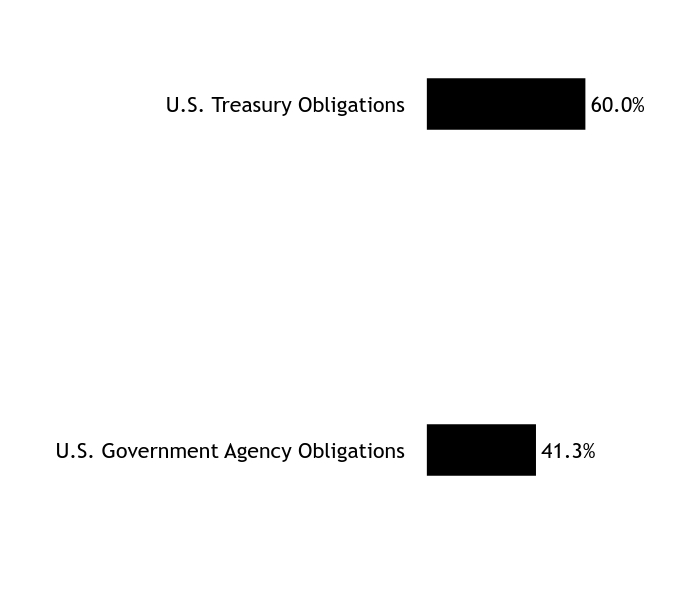
Asset WeightingsFootnote Reference*Value | Value |
|---|
U.S. Government Agency Obligations | 41.3% | U.S. Treasury Obligations | 60.0% |
| Footnote | Description | Footnote* | Percentages are calculated based on total net assets. |
|
|
| Largest Holdings [Text Block] |
Holding Name | Coupon Rate | Maturity Date | Percentage of Total
Net Assets |
|---|
FFCB | 0.040%
| 08/07/25
| 6.8% | U.S. Treasury Bills | 4.253%
| 09/04/25
| 5.7% | U.S. Treasury Bills | 4.227%
| 08/07/25
| 4.8% | U.S. Treasury Bills | 4.293%
| 08/14/25
| 4.8% | U.S. Treasury Bills | 4.273%
| 09/02/25
| 4.7% | FHLB, SOFRRATE + 0.005% | 4.345%
| 10/27/25
| 4.1% | U.S. Treasury Bills | 4.284%
| 08/12/25
| 3.6% | U.S. Treasury Notes, USBMMY3M + 0.205% | 4.414%
| 10/31/26
| 3.4% | FFCB | 0.000%
| 08/06/25
| 3.4% | FFCB | 1.021%
| 08/08/25
| 3.4% |
|
|
| C000018368 |
|
|
| Shareholder Report [Line Items] |
|
|
| Fund Name |
Treasury II Fund
|
|
| Class Name |
Class F Shares
|
|
| Trading Symbol |
SCPXX
|
|
| Annual or Semi-Annual Statement [Text Block] |
This semi-annual shareholder report contains important information about Class F Shares of the Treasury II Fund (the "Fund") for the period from February 1, 2025 to July 31, 2025.
|
|
| Shareholder Report Annual or Semi-Annual |
Semi-Annual Shareholder Report
|
|
| Additional Information [Text Block] |
You can find additional information about the Fund at https://www.seic.com/mutual-fund-documentation/prospectuses-and-reports. You can also request this information by contacting us at 610-676-1000.
|
|
| Additional Information Phone Number |
610-676-1000
|
|
| Additional Information Website |
https://www.seic.com/mutual-fund-documentation/prospectuses-and-reports
|
|
| Expenses [Text Block] |
What were the Fund costs for the last six months?(based on a hypothetical $10,000 investment) Fund Name | Costs of a $10,000 investment | Costs paid as a percentage of a $10,000 investment |
|---|
Treasury II Fund, Class F Shares | $11 | 0.21%Footnote Reference(1) |
|---|
| Footnote | Description | Footnote(1) | The expense ratio includes a proxy fee expense. Had this expense been excluded the ratio would have been 0.20%. |
|
|
| Expenses Paid, Amount |
$ 11
|
|
| Expense Ratio, Percent |
0.21%
|
[5] |
| AssetsNet |
$ 1,222,106,000
|
|
| Holdings Count | Holding |
55
|
|
| Advisory Fees Paid, Amount |
$ 281
|
|
| Additional Fund Statistics [Text Block] |
Key Fund Statistics as of July 31, 2025 | Total Net Assets (000's) | Number of Holdings | Total Advisory Fees Paid (000's) |
|---|
| $1,222,106 | 55 | $281 |
|---|
|
|
| Holdings [Text Block] |
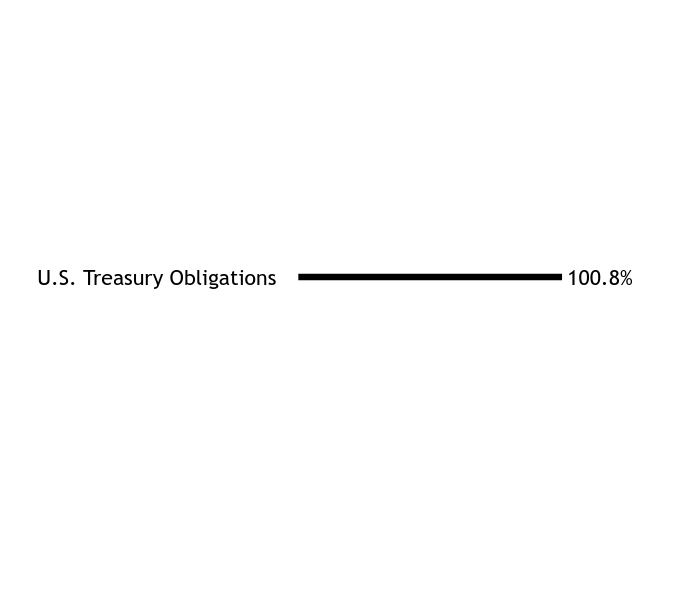
Asset WeightingsFootnote Reference*Value | Value |
|---|
U.S. Treasury Obligations | 100.8% |
| Footnote | Description | Footnote* | Percentages are calculated based on total net assets. |
|
|
| Largest Holdings [Text Block] |
Holding Name | Coupon Rate | Maturity Date | Percentage of Total
Net Assets |
|---|
U.S. Treasury Bills | 4.268%
| 09/04/25
| 12.7% | U.S. Treasury Bills | 4.276%
| 08/28/25
| 10.2% | U.S. Treasury Bills | 4.289%
| 09/16/25
| 9.6% | U.S. Treasury Bills | 4.301%
| 09/02/25
| 5.7% | U.S. Treasury Bills | 4.286%
| 08/21/25
| 5.6% | U.S. Treasury Bill - When Issued | 4.279%
| 09/18/25
| 5.2% | U.S. Treasury Bills | 4.268%
| 08/26/25
| 4.4% | U.S. Treasury Notes, USBMMY3M + 0.098% | 4.307%
| 01/31/27
| 4.4% | U.S. Treasury Bills | 4.258%
| 09/09/25
| 3.8% | U.S. Treasury Bills | 4.290%
| 11/12/25
| 3.7% |
|
|
| C000022551 |
|
|
| Shareholder Report [Line Items] |
|
|
| Fund Name |
Ultra Short Duration Bond Fund
|
|
| Class Name |
Class F Shares
|
|
| Trading Symbol |
SECPX
|
|
| Annual or Semi-Annual Statement [Text Block] |
This semi-annual shareholder report contains important information about Class F Shares of the Ultra Short Duration Bond Fund (the "Fund") for the period from February 1, 2025 to July 31, 2025.
|
|
| Shareholder Report Annual or Semi-Annual |
Semi-Annual Shareholder Report
|
|
| Additional Information [Text Block] |
You can find additional information about the Fund at https://www.seic.com/mutual-fund-documentation/prospectuses-and-reports. You can also request this information by contacting us at 610-676-1000.
|
|
| Additional Information Phone Number |
610-676-1000
|
|
| Additional Information Website |
https://www.seic.com/mutual-fund-documentation/prospectuses-and-reports
|
|
| Expenses [Text Block] |
What were the Fund costs for the last six months?(based on a hypothetical $10,000 investment) Fund Name | Costs of a $10,000 investment | Costs paid as a percentage of a $10,000 investment |
|---|
Ultra Short Duration Bond Fund, Class F Shares | $21 | 0.42%Footnote Reference(1) |
|---|
| Footnote | Description | Footnote(1) | The expense ratio includes a proxy fee expense. Had this expense been excluded the ratio would have been 0.38%. |
|
|
| Expenses Paid, Amount |
$ 21
|
|
| Expense Ratio, Percent |
0.42%
|
[6] |
| AssetsNet |
$ 199,553,000
|
|
| Holdings Count | Holding |
466
|
|
| Advisory Fees Paid, Amount |
$ 97
|
|
| InvestmentCompanyPortfolioTurnover |
45.00%
|
|
| Additional Fund Statistics [Text Block] |
Key Fund Statistics as of July 31, 2025 | Total Net Assets (000's) | Number of Holdings | Total Advisory Fees Paid (000's) | Portfolio Turnover Rate |
|---|
| $199,553 | 466 | $97 | 45% |
|---|
|
|
| Holdings [Text Block] |
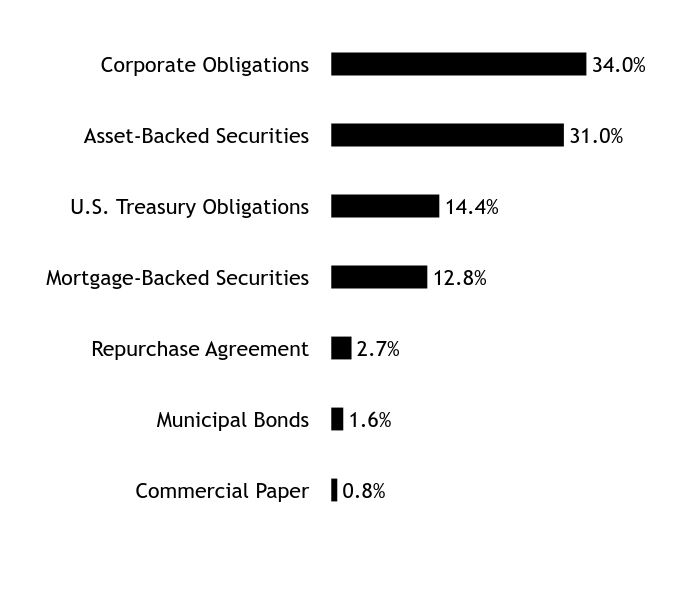
Asset WeightingsFootnote Reference*Value | Value |
|---|
Commercial Paper | 0.8% | Municipal Bonds | 1.6% | Repurchase Agreement | 2.7% | Mortgage-Backed Securities | 12.8% | U.S. Treasury Obligations | 14.4% | Asset-Backed Securities | 31.0% | Corporate Obligations | 34.0% |
| Footnote | Description | Footnote* | Percentages are calculated based on total net assets. |
|
|
| Largest Holdings [Text Block] |
Holding Name | Coupon Rate | Maturity Date | Percentage of Total
Net AssetsFootnote Reference(A) |
|---|
U.S. Treasury Notes | 3.250%
| 06/30/27
| 3.7% | U.S. Treasury Notes | 1.625%
| 11/30/26
| 2.4% | U.S. Treasury Bill - When Issued | 4.227%
| 09/18/25
| 2.3% | U.S. Treasury Notes | 1.250%
| 12/31/26
| 2.1% | U.S. Treasury Notes | 2.500%
| 02/28/26
| 1.5% | U.S. Treasury Notes | 3.750%
| 08/31/26
| 1.0% | Truist Bank, SOFRRATE + 0.590% | 4.671%
| 05/20/27
| 0.9% | Golden Credit Card Trust, Ser 2021-1A, Cl A | 1.140%
| 08/15/28
| 0.8% | JPMorgan Chase, SOFRRATE + 0.765% | 1.470%
| 09/22/27
| 0.8% | Morgan Stanley, SOFRRATE + 0.858% | 1.512%
| 07/20/27
| 0.8% |
| Footnote | Description | Footnote(A) | Repurchase Agreements and Short-Term Investments are not shown in the top ten chart. |
|
|
| C000158211 |
|
|
| Shareholder Report [Line Items] |
|
|
| Fund Name |
Ultra Short Duration Bond Fund
|
|
| Class Name |
Class Y Shares
|
|
| Trading Symbol |
SECYX
|
|
| Annual or Semi-Annual Statement [Text Block] |
This semi-annual shareholder report contains important information about Class Y Shares of the Ultra Short Duration Bond Fund (the "Fund") for the period from February 1, 2025 to July 31, 2025.
|
|
| Shareholder Report Annual or Semi-Annual |
Semi-Annual Shareholder Report
|
|
| Additional Information [Text Block] |
You can find additional information about the Fund at https://www.seic.com/mutual-fund-documentation/prospectuses-and-reports. You can also request this information by contacting us at 610-676-1000.
|
|
| Additional Information Phone Number |
610-676-1000
|
|
| Additional Information Website |
https://www.seic.com/mutual-fund-documentation/prospectuses-and-reports
|
|
| Expenses [Text Block] |
What were the Fund costs for the last six months?(based on a hypothetical $10,000 investment) Fund Name | Costs of a $10,000 investment | Costs paid as a percentage of a $10,000 investment |
|---|
Ultra Short Duration Bond Fund, Class Y Shares | $17 | 0.34%Footnote Reference(1) |
|---|
| Footnote | Description | Footnote(1) | The expense ratio includes a proxy fee expense. Had this expense been excluded the ratio would have been 0.30%. |
|
|
| Expenses Paid, Amount |
$ 17
|
|
| Expense Ratio, Percent |
0.34%
|
[7] |
| AssetsNet |
$ 199,553,000
|
|
| Holdings Count | Holding |
466
|
|
| Advisory Fees Paid, Amount |
$ 97
|
|
| InvestmentCompanyPortfolioTurnover |
45.00%
|
|
| Additional Fund Statistics [Text Block] |
Key Fund Statistics as of July 31, 2025 | Total Net Assets (000's) | Number of Holdings | Total Advisory Fees Paid (000's) | Portfolio Turnover Rate |
|---|
| $199,553 | 466 | $97 | 45% |
|---|
|
|
| Holdings [Text Block] |
Asset WeightingsFootnote Reference*Value | Value |
|---|
Commercial Paper | 0.8% | Municipal Bonds | 1.6% | Repurchase Agreement | 2.7% | Mortgage-Backed Securities | 12.8% | U.S. Treasury Obligations | 14.4% | Asset-Backed Securities | 31.0% | Corporate Obligations | 34.0% |
| Footnote | Description | Footnote* | Percentages are calculated based on total net assets. |
|
|
| Largest Holdings [Text Block] |
Holding Name | Coupon Rate | Maturity Date | Percentage of Total
Net AssetsFootnote Reference(A) |
|---|
U.S. Treasury Notes | 3.250%
| 06/30/27
| 3.7% | U.S. Treasury Notes | 1.625%
| 11/30/26
| 2.4% | U.S. Treasury Bill - When Issued | 4.227%
| 09/18/25
| 2.3% | U.S. Treasury Notes | 1.250%
| 12/31/26
| 2.1% | U.S. Treasury Notes | 2.500%
| 02/28/26
| 1.5% | U.S. Treasury Notes | 3.750%
| 08/31/26
| 1.0% | Truist Bank, SOFRRATE + 0.590% | 4.671%
| 05/20/27
| 0.9% | Golden Credit Card Trust, Ser 2021-1A, Cl A | 1.140%
| 08/15/28
| 0.8% | JPMorgan Chase, SOFRRATE + 0.765% | 1.470%
| 09/22/27
| 0.8% | Morgan Stanley, SOFRRATE + 0.858% | 1.512%
| 07/20/27
| 0.8% |
| Footnote | Description | Footnote(A) | Repurchase Agreements and Short-Term Investments are not shown in the top ten chart. |
|
|
| C000022552 |
|
|
| Shareholder Report [Line Items] |
|
|
| Fund Name |
Short-Duration Government Fund
|
|
| Class Name |
Class F Shares
|
|
| Trading Symbol |
TCSGX
|
|
| Annual or Semi-Annual Statement [Text Block] |
This semi-annual shareholder report contains important information about Class F Shares of the Short-Duration Government Fund (the "Fund") for the period from February 1, 2025 to July 31, 2025.
|
|
| Shareholder Report Annual or Semi-Annual |
Semi-Annual Shareholder Report
|
|
| Additional Information [Text Block] |
You can find additional information about the Fund at https://www.seic.com/mutual-fund-documentation/prospectuses-and-reports. You can also request this information by contacting us at 610-676-1000.
|
|
| Additional Information Phone Number |
610-676-1000
|
|
| Additional Information Website |
https://www.seic.com/mutual-fund-documentation/prospectuses-and-reports
|
|
| Expenses [Text Block] |
What were the Fund costs for the last six months?(based on a hypothetical $10,000 investment) Fund Name | Costs of a $10,000 investment | Costs paid as a percentage of a $10,000 investment |
|---|
Short-Duration Government Fund, Class F Shares | $24 | 0.48%Footnote Reference(1) |
|---|
| Footnote | Description | Footnote(1) | The expense ratio includes a proxy fee expense. Had this expense been excluded the ratio would have been 0.47%. |
|
|
| Expenses Paid, Amount |
$ 24
|
|
| Expense Ratio, Percent |
0.48%
|
[8] |
| AssetsNet |
$ 591,405,000
|
|
| Holdings Count | Holding |
401
|
|
| Advisory Fees Paid, Amount |
$ 286
|
|
| InvestmentCompanyPortfolioTurnover |
2.00%
|
|
| Additional Fund Statistics [Text Block] |
Key Fund Statistics as of July 31, 2025 | Total Net Assets (000's) | Number of Holdings | Total Advisory Fees Paid (000's) | Portfolio Turnover Rate |
|---|
| $591,405 | 401 | $286 | 2% |
|---|
|
|
| Holdings [Text Block] |
Asset WeightingsFootnote Reference*Value | Value |
|---|
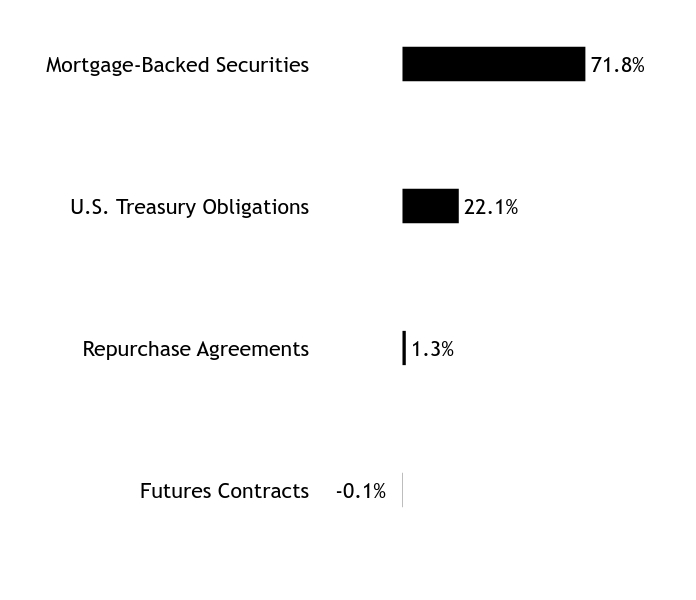
Futures Contracts | -0.1% | Repurchase Agreements | 1.3% | U.S. Treasury Obligations | 22.1% | Mortgage-Backed Securities | 71.8% |
| Footnote | Description | Footnote* | Percentages are calculated based on total net assets. |
|
|
| Largest Holdings [Text Block] |
Holding Name | Coupon Rate | Maturity Date | Percentage of Total
Net AssetsFootnote Reference(A) |
|---|
U.S. Treasury Notes | 1.125%
| 10/31/26
| 10.1% | U.S. Treasury Notes | 4.375%
| 12/15/26
| 8.1% | U.S. Treasury Notes | 3.750%
| 04/15/28
| 4.0% | FHLMC Multifamily Structured Pass-Through Certificates, Ser K516, Cl A2 | 5.477%
| 01/25/29
| 2.4% | FNMA REMIC, Ser 2024-41, Cl DA | 5.500%
| 12/25/51
| 1.7% | GNMA, Ser 2022-87, Cl CA | 2.500%
| 09/20/36
| 1.4% | FNMA REMIC, Ser 2013-121, Cl FA, SOFR30A + 0.514% | 4.865%
| 12/25/43
| 1.3% | FHLMC REMIC, Ser 2011-3930, Cl KE | 4.000%
| 09/15/41
| 1.2% | FHLMC REMIC, Ser 2025-5538, Cl AV | 5.000%
| 04/25/36
| 1.2% | FNMA REMIC, Ser 2018-55, Cl PA | 3.500%
| 01/25/47
| 1.2% |
| Footnote | Description | Footnote(A) | Repurchase Agreements are not shown in the top ten chart. |
|
|
| C000147419 |
|
|
| Shareholder Report [Line Items] |
|
|
| Fund Name |
Short-Duration Government Fund
|
|
| Class Name |
Class Y Shares
|
|
| Trading Symbol |
SDGFX
|
|
| Annual or Semi-Annual Statement [Text Block] |
This semi-annual shareholder report contains important information about Class Y Shares of the Short-Duration Government Fund (the "Fund") for the period from February 1, 2025 to July 31, 2025.
|
|
| Shareholder Report Annual or Semi-Annual |
Semi-Annual Shareholder Report
|
|
| Additional Information [Text Block] |
You can find additional information about the Fund at https://www.seic.com/mutual-fund-documentation/prospectuses-and-reports. You can also request this information by contacting us at 610-676-1000.
|
|
| Additional Information Phone Number |
610-676-1000
|
|
| Additional Information Website |
https://www.seic.com/mutual-fund-documentation/prospectuses-and-reports
|
|
| Expenses [Text Block] |
What were the Fund costs for the last six months?(based on a hypothetical $10,000 investment) Fund Name | Costs of a $10,000 investment | Costs paid as a percentage of a $10,000 investment |
|---|
Short-Duration Government Fund, Class Y Shares | $17 | 0.34%Footnote Reference(1) |
|---|
| Footnote | Description | Footnote(1) | The expense ratio includes a proxy fee expense. Had this expense been excluded the ratio would have been 0.33%. |
|
|
| Expenses Paid, Amount |
$ 17
|
|
| Expense Ratio, Percent |
0.34%
|
[9] |
| AssetsNet |
$ 591,405,000
|
|
| Holdings Count | Holding |
401
|
|
| Advisory Fees Paid, Amount |
$ 286
|
|
| InvestmentCompanyPortfolioTurnover |
2.00%
|
|
| Additional Fund Statistics [Text Block] |
Key Fund Statistics as of July 31, 2025 | Total Net Assets (000's) | Number of Holdings | Total Advisory Fees Paid (000's) | Portfolio Turnover Rate |
|---|
| $591,405 | 401 | $286 | 2% |
|---|
|
|
| Holdings [Text Block] |
Asset WeightingsFootnote Reference*Value | Value |
|---|
Futures Contracts | -0.1% | Repurchase Agreements | 1.3% | U.S. Treasury Obligations | 22.1% | Mortgage-Backed Securities | 71.8% |
| Footnote | Description | Footnote* | Percentages are calculated based on total net assets. |
|
|
| Largest Holdings [Text Block] |
Holding Name | Coupon Rate | Maturity Date | Percentage of Total
Net AssetsFootnote Reference(A) |
|---|
U.S. Treasury Notes | 1.125%
| 10/31/26
| 10.1% | U.S. Treasury Notes | 4.375%
| 12/15/26
| 8.1% | U.S. Treasury Notes | 3.750%
| 04/15/28
| 4.0% | FHLMC Multifamily Structured Pass-Through Certificates, Ser K516, Cl A2 | 5.477%
| 01/25/29
| 2.4% | FNMA REMIC, Ser 2024-41, Cl DA | 5.500%
| 12/25/51
| 1.7% | GNMA, Ser 2022-87, Cl CA | 2.500%
| 09/20/36
| 1.4% | FNMA REMIC, Ser 2013-121, Cl FA, SOFR30A + 0.514% | 4.865%
| 12/25/43
| 1.3% | FHLMC REMIC, Ser 2011-3930, Cl KE | 4.000%
| 09/15/41
| 1.2% | FHLMC REMIC, Ser 2025-5538, Cl AV | 5.000%
| 04/25/36
| 1.2% | FNMA REMIC, Ser 2018-55, Cl PA | 3.500%
| 01/25/47
| 1.2% |
| Footnote | Description | Footnote(A) | Repurchase Agreements are not shown in the top ten chart. |
|
|
| C000022554 |
|
|
| Shareholder Report [Line Items] |
|
|
| Fund Name |
GNMA Fund
|
|
| Class Name |
Class F Shares
|
|
| Trading Symbol |
SEGMX
|
|
| Annual or Semi-Annual Statement [Text Block] |
This semi-annual shareholder report contains important information about Class F Shares of the GNMA Fund (the "Fund") for the period from February 1, 2025 to July 31, 2025.
|
|
| Shareholder Report Annual or Semi-Annual |
Semi-Annual Shareholder Report
|
|
| Additional Information [Text Block] |
You can find additional information about the Fund at https://www.seic.com/mutual-fund-documentation/prospectuses-and-reports. You can also request this information by contacting us at 610-676-1000.
|
|
| Additional Information Phone Number |
610-676-1000
|
|
| Additional Information Website |
https://www.seic.com/mutual-fund-documentation/prospectuses-and-reports
|
|
| Expenses [Text Block] |
What were the Fund costs for the last six months?(based on a hypothetical $10,000 investment) Fund Name | Costs of a $10,000 investment | Costs paid as a percentage of a $10,000 investment |
|---|
GNMA Fund, Class F Shares | $33 | 0.66% |
|---|
|
|
| Expenses Paid, Amount |
$ 33
|
|
| Expense Ratio, Percent |
0.66%
|
|
| AssetsNet |
$ 13,969,000
|
|
| Holdings Count | Holding |
269
|
|
| Advisory Fees Paid, Amount |
$ 7
|
|
| InvestmentCompanyPortfolioTurnover |
51.00%
|
|
| Additional Fund Statistics [Text Block] |
Key Fund Statistics as of July 31, 2025 | Total Net Assets (000's) | Number of Holdings | Total Advisory Fees Paid (000's) | Portfolio Turnover Rate |
|---|
| $13,969 | 269 | $7 | 51% |
|---|
|
|
| Holdings [Text Block] |
Sector WeightingsFootnote Reference*Value | Value |
|---|
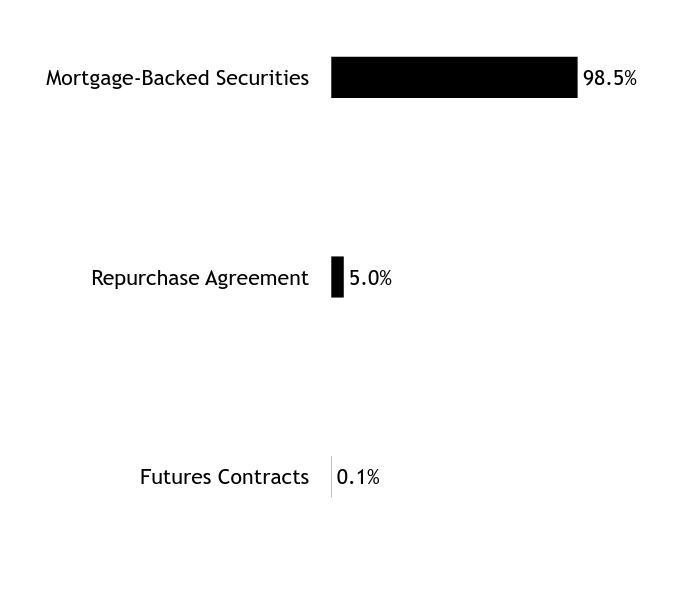
Futures Contracts | 0.1% | Repurchase Agreement | 5.0% | Mortgage-Backed Securities | 98.5% |
| Footnote | Description | Footnote* | Percentages are calculated based on total net assets. |
|
|
| Largest Holdings [Text Block] |
Holding Name | Coupon Rate | Maturity Date | Percentage of Total
Net AssetsFootnote Reference(A) |
|---|
GNMA | 2.500%
| 08/15/55
| 7.9% | GNMA | 2.000%
| 12/20/50
| 7.0% | GNMA | 2.000%
| 08/20/50
| 5.1% | GNMA | 2.500%
| 08/20/50
| 4.6% | GNMA | 3.500%
| 07/20/47
| 4.4% | GNMA | 4.000%
| 09/20/42
| 3.8% | GNMA | 3.000%
| 12/20/50
| 3.7% | GNMA | 3.500%
| 06/20/47
| 2.9% | GNMA | 4.500%
| 01/20/46
| 2.5% | GNMA, Ser 2016-136, Cl PJ | 3.500%
| 01/20/46
| 2.1% |
| Footnote | Description | Footnote(A) | Repurchase Agreements are not shown in the top ten chart. |
|
|
| C000147421 |
|
|
| Shareholder Report [Line Items] |
|
|
| Fund Name |
GNMA Fund
|
|
| Class Name |
Class Y Shares
|
|
| Trading Symbol |
SGMYX
|
|
| Annual or Semi-Annual Statement [Text Block] |
This semi-annual shareholder report contains important information about Class Y Shares of the GNMA Fund (the "Fund") for the period from February 1, 2025 to July 31, 2025.
|
|
| Shareholder Report Annual or Semi-Annual |
Semi-Annual Shareholder Report
|
|
| Additional Information [Text Block] |
You can find additional information about the Fund at https://www.seic.com/mutual-fund-documentation/prospectuses-and-reports. You can also request this information by contacting us at 610-676-1000.
|
|
| Additional Information Phone Number |
610-676-1000
|
|
| Additional Information Website |
https://www.seic.com/mutual-fund-documentation/prospectuses-and-reports
|
|
| Expenses [Text Block] |
What were the Fund costs for the last six months?(based on a hypothetical $10,000 investment) Fund Name | Costs of a $10,000 investment | Costs paid as a percentage of a $10,000 investment |
|---|
GNMA Fund, Class Y Shares | $20 | 0.40% |
|---|
|
|
| Expenses Paid, Amount |
$ 20
|
|
| Expense Ratio, Percent |
0.40%
|
|
| AssetsNet |
$ 13,969,000
|
|
| Holdings Count | Holding |
269
|
|
| Advisory Fees Paid, Amount |
$ 7
|
|
| InvestmentCompanyPortfolioTurnover |
51.00%
|
|
| Additional Fund Statistics [Text Block] |
Key Fund Statistics as of July 31, 2025 | Total Net Assets (000's) | Number of Holdings | Total Advisory Fees Paid (000's) | Portfolio Turnover Rate |
|---|
| $13,969 | 269 | $7 | 51% |
|---|
|
|
| Holdings [Text Block] |
Sector WeightingsFootnote Reference*Value | Value |
|---|
Futures Contracts | 0.1% | Repurchase Agreement | 5.0% | Mortgage-Backed Securities | 98.5% |
| Footnote | Description | Footnote* | Percentages are calculated based on total net assets. |
|
|
| Largest Holdings [Text Block] |
Holding Name | Coupon Rate | Maturity Date | Percentage of Total
Net AssetsFootnote Reference(A) |
|---|
GNMA | 2.500%
| 08/15/55
| 7.9% | GNMA | 2.000%
| 12/20/50
| 7.0% | GNMA | 2.000%
| 08/20/50
| 5.1% | GNMA | 2.500%
| 08/20/50
| 4.6% | GNMA | 3.500%
| 07/20/47
| 4.4% | GNMA | 4.000%
| 09/20/42
| 3.8% | GNMA | 3.000%
| 12/20/50
| 3.7% | GNMA | 3.500%
| 06/20/47
| 2.9% | GNMA | 4.500%
| 01/20/46
| 2.5% | GNMA, Ser 2016-136, Cl PJ | 3.500%
| 01/20/46
| 2.1% |
| Footnote | Description | Footnote(A) | Repurchase Agreements are not shown in the top ten chart. |
|
|
|
|