Shareholder Report
|
12 Months Ended |
|
Jul. 31, 2025
USD ($)
Holding
|
|---|
| Shareholder Report [Line Items] |
|
|
| Document Type |
N-CSR
|
|
| Amendment Flag |
false
|
|
| Registrant Name |
ADVISER MANAGED TRUST
|
|
| Entity Central Index Key |
0001502608
|
|
| Entity Investment Company Type |
N-1A
|
|
| Document Period End Date |
Jul. 31, 2025
|
|
| C000230413 |
|
|
| Shareholder Report [Line Items] |
|
|
| Fund Name |
Diversified Equity Fund
|
|
| Trading Symbol |
DAACX
|
|
| Annual or Semi-Annual Statement [Text Block] |
This annual shareholder report contains important information about Diversified Equity Fund (the "Fund") for the period from August 1, 2024 to July 31, 2025.
|
|
| Shareholder Report Annual or Semi-Annual |
Annual Shareholder Report
|
|
| Additional Information [Text Block] |
You can find additional information about the Fund at https://holdings.seic.com/amt_holdings/. You can also request this information by contacting us at 610-676-1000.
|
|
| Additional Information Phone Number |
610-676-1000
|
|
| Additional Information Website |
https://holdings.seic.com/amt_holdings/
|
|
| Expenses [Text Block] |
What were the Fund costs for the last year?(based on a hypothetical $10,000 investment) Fund Name | Costs of a $10,000 investment | Costs paid as a percentage of a $10,000 investment |
|---|
Diversified Equity Fund | $55 | 0.53%Footnote Reference(1) |
|---|
| Footnote | Description | Footnote(1) | The expense ratio includes a proxy fee expense. Had this expense been excluded the ratio would have been 0.52%. |
|
|
| Expenses Paid, Amount |
$ 55
|
|
| Expense Ratio, Percent |
0.53%
|
[1] |
| Factors Affecting Performance [Text Block] |
How did the Fund perform in the last year?The Fund underperformed its benchmark, the S&P 500 Index (TR) (S&P 500) - a market-weighted index that tracks the performance of the 500 largest publicly traded U.S. companies and is considered representative of the broad U.S. stock market—for the 12-month period ending July 31, 2025. While the Fund produced a positive return in the rising equity markets over the reporting period, each of the indexes that its five equity components seek to replicate underperformed relative to the Fund’s benchmark. The S&P 500 Index (TR), Russell 1000, Russell 2000, MSCI EAFE, and MSCI Emerging Markets indexes returned 16.3%, 16.5%, -0.6%, 12.8%, and 17.2%, respectively, for the period. The Fund’s strategy is implemented by SSGA Funds Management, Inc., as sub-adviser under the general supervision of SEI Investments Management Corporation (SIMC). Global equity markets posted notable gains over the reporting period. Emerging markets significantly outperformed developed markets. In the U.S., large-cap stocks, as represented by the broad-market S&P 500 Index (TR), significantly outperformed their small-cap counterparts, as measured by the Russell 2000 Index. Communication services and utilities were the strongest-performing sectors within the S&P 500 Index (TR) for the period, while the healthcare sector recorded a loss and was the primary market laggard. During the reporting period, the Fund’s assets were effectively completely liquidated via outflows, resulting in sales of nearly all of the Fund’s holdings. Later in the period, fund inflows made it possible to repurchase the desired securities. Consequently, the Fund’s benchmark-relative performance for the reporting period was attributable mainly to the underlying cash-flow activity by the Fund’s shareholders. This activity resulted in implementation costs (the expenses incurred during the process of buying and selling securities within the Fund, which can have a significant impact on the Fund’s return), and cash drag (holding a portion of the portfolio in cash rather than investing it in a strong-performing market) that influenced the Fund’s performance relative to the benchmark. |
|
| Performance Past Does Not Indicate Future [Text] |
Past performance is not indicative of future performance.
|
|
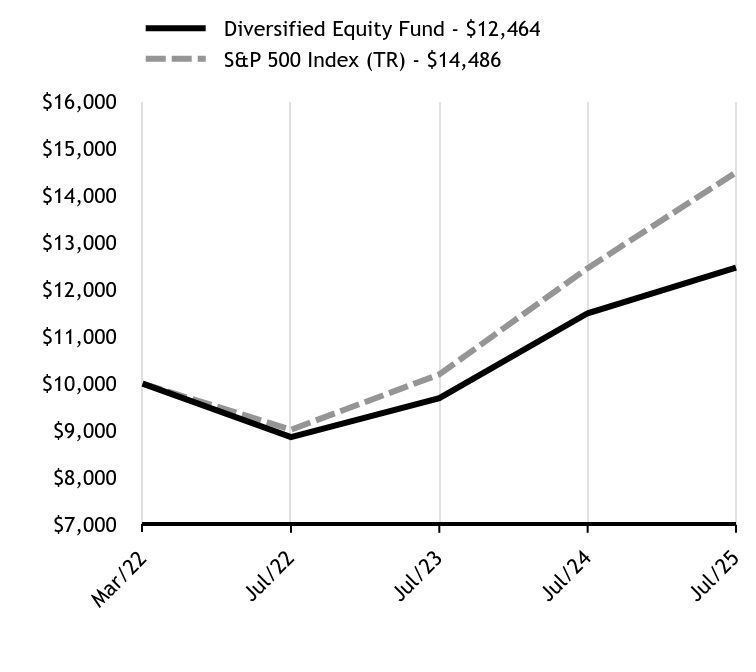
| Line Graph [Table Text Block] |
| Diversified Equity Fund - $12464 | S&P 500 Index (TR) - $14486 |
|---|
Mar/22 | $10000 | $10000 |
|---|
Jul/22 | $8862 | $9021 |
|---|
Jul/23 | $9692 | $10195 |
|---|
Jul/24 | $11494 | $12453 |
|---|
Jul/25 | $12464 | $14486 |
|---|
|
|
| Average Annual Return [Table Text Block] |
Average Annual Total Returns as of July 31, 2025Fund/Index Name | 1 Year | Annualized
Since
Inception |
|---|
Diversified Equity Fund | 8.44% | 6.82% |
|---|
S&P 500 Index (TR) | 16.33% | 11.74% |
|---|
|
|
| Performance Inception Date |
Mar. 30, 2022
|
|
| No Deduction of Taxes [Text Block] |
The table and graph presented above do not reflect the deduction of taxes a shareholder would pay on Fund distributions or the redemption of Fund Shares.
|
|
| AssetsNet |
$ 264,562,000
|
|
| Holdings Count | Holding |
1,710
|
|
| Advisory Fees Paid, Amount |
$ 112
|
|
| InvestmentCompanyPortfolioTurnover |
92.00%
|
|
| Additional Fund Statistics [Text Block] |
Key Fund Statistics as of July 31, 2025 | Total Net Assets (000's) | Number of Holdings | Total Advisory Fees Paid (000's) | Portfolio Turnover Rate |
|---|
| $264,562 | 1,710 | $112 | 92% |
|---|
|
|
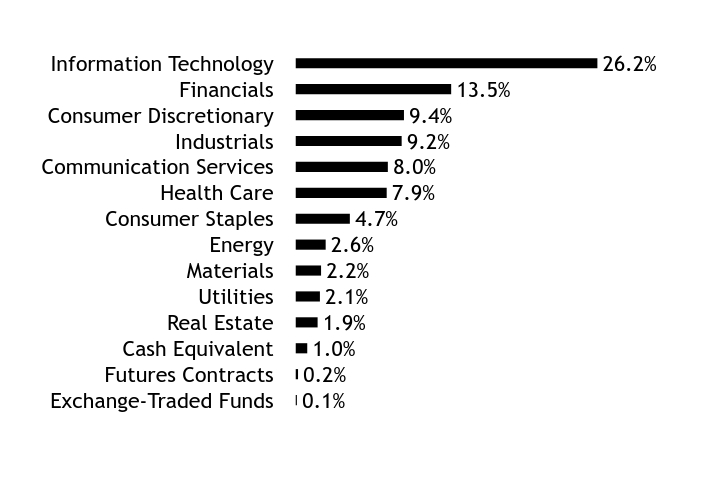
| Holdings [Text Block] |
Asset WeightingsFootnote Reference*Value | Value |
|---|
Exchange-Traded Funds | 0.1% | Futures Contracts | 0.2% | Cash Equivalent | 1.0% | Real Estate | 1.9% | Utilities | 2.1% | Materials | 2.2% | Energy | 2.6% | Consumer Staples | 4.7% | Health Care | 7.9% | Communication Services | 8.0% | Industrials | 9.2% | Consumer Discretionary | 9.4% | Financials | 13.5% | Information Technology | 26.2% |
| Footnote | Description | Footnote* | Percentages are calculated based on total net assets. |
|
|
| Largest Holdings [Text Block] |
Holding Name | | | Percentage of
Total Net AssetsFootnote Reference(A) |
|---|
NVIDIA Corp | | | 5.6% | Microsoft Corp | | | 5.3% | Apple | | | 4.1% | Amazon.com Inc | | | 3.0% | Meta Platforms, Cl A | | | 2.3% | Broadcom Inc | | | 1.8% | Alphabet Inc, Cl A | | | 1.5% | Alphabet Inc, Cl C | | | 1.2% | Berkshire Hathaway Inc, Cl B | | | 1.2% | Tesla Inc | | | 1.2% |
| Footnote | Description | Footnote(A) | Cash Equivalents are not shown in the top ten chart. |
|
|
| Material Fund Change [Text Block] |
There were no material changes during the reporting period. |
|
| C000230414 |
|
|
| Shareholder Report [Line Items] |
|
|
| Fund Name |
Core Fixed Income Fund
|
|
| Trading Symbol |
AAEYX
|
|
| Annual or Semi-Annual Statement [Text Block] |
This annual shareholder report contains important information about Core Fixed Income Fund (the "Fund") for the period from August 1, 2024 to July 31, 2025.
|
|
| Shareholder Report Annual or Semi-Annual |
Annual Shareholder Report
|
|
| Additional Information [Text Block] |
You can find additional information about the Fund at https://holdings.seic.com/amt_holdings/. You can also request this information by contacting us at 610-676-1000.
|
|
| Additional Information Phone Number |
610-676-1000
|
|
| Additional Information Website |
https://holdings.seic.com/amt_holdings/
|
|
| Expenses [Text Block] |
What were the Fund costs for the last year?(based on a hypothetical $10,000 investment) Fund Name | Costs of a $10,000 investment | Costs paid as a percentage of a $10,000 investment |
|---|
Core Fixed Income Fund | $34 | 0.34%Footnote Reference(1) |
|---|
| Footnote | Description | Footnote(1) | The expense ratio includes a proxy fee expense. Had this expense been excluded the ratio would have been 0.33%. |
|
|
| Expenses Paid, Amount |
$ 34
|
|
| Expense Ratio, Percent |
0.34%
|
[2] |
| Factors Affecting Performance [Text Block] |
How did the Fund perform in the last year?The Fund, which is managed using a passive approach, modestly underperformed its benchmark, the Bloomberg U.S. Aggregate Bond Index (TR) (USD) - which tracks the performance of fixed-rate, publicly issued, non-investment-grade bonds— for the 12-month period ending July 31, 2025. The Federal Reserve (Fed) implemented a larger-than-expected 50-basis-point (0.50%) reduction in the federal-funds rate in September 2024, after being on pause since July of 2023, following an aggressive rate-hiking cycle in which the central bank raised the benchmark rate by a cumulative 525 basis points in 18 months. In addition to the 0.50% cut in September, the Fed also announced rate reductions of 0.25% at its meetings in November and December 2024. Through the first seven months of 2025, the Fed held the benchmark rate steady as macroeconomic uncertainty increased during the year. Evolving trade policy has the potential to put upward pressure on prices, and it appears that the effective tariff rate will settle in the 15%-20% range. The U.S. labor market remained on solid footing during the period with unemployment spending much of the second half of the reporting period around 4.1%; however, cracks did begin to appear late in the period as hiring slowed and continuing unemployment insurance claims ticked higher. The U.S. Treasury yield curve steepened during the reporting period, with front end rates moving lower and long rates rising. The 10-year Treasury note yield ultimately ended the reporting period up 0.35% closing the period at 4.38%, and spread sectors generated excess returns. Spreads on investment-grade corporate bonds remained tight as high all-in yields supported demand with the economy remaining on solid footing. Asset-backed securities (ABS) outperformed comparable-duration Treasurys as well, with relatively strong U.S. consumer spending fundamentally supporting the sector, albeit cracks in subprime loans have begun to surface. Agency mortgage-backed securities (MBS) also modestly outperformed despite the continued reduction in size of the Fed’s balance sheet. As the Fund is passively managed, its sub-adviser, SSGA Funds Management Inc., performed in line with the benchmark Bloomberg U.S. Aggregate Bond Index (TR) (USD), after expenses, for the reporting period. |
|
| Performance Past Does Not Indicate Future [Text] |
Past performance is not indicative of future performance.
|
|
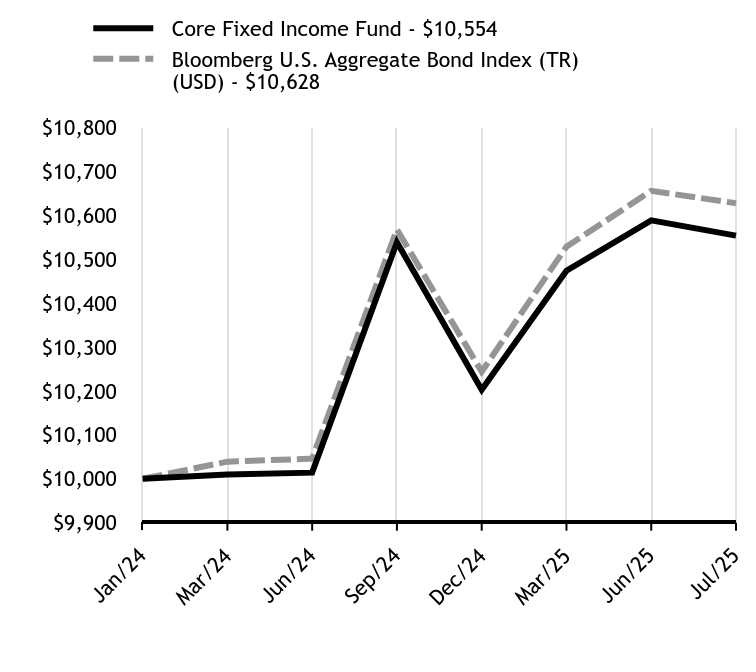
| Line Graph [Table Text Block] |
| Core Fixed Income Fund - $10554 | Bloomberg U.S. Aggregate Bond Index (TR) (USD) - $10628 |
|---|
Jan/24 | $10000 | $10000 |
|---|
Mar/24 | $10010 | $10039 |
|---|
Jun/24 | $10014 | $10046 |
|---|
Sep/24 | $10539 | $10568 |
|---|
Dec/24 | $10203 | $10244 |
|---|
Mar/25 | $10474 | $10529 |
|---|
Jun/25 | $10589 | $10656 |
|---|
Jul/25 | $10554 | $10628 |
|---|
|
|
| Average Annual Return [Table Text Block] |
Average Annual Total Returns as of July 31, 2025Fund/Index Name | 1 Year | Annualized
Since
Inception |
|---|
Core Fixed Income Fund | 2.94% | 3.61% |
|---|
Bloomberg U.S. Aggregate Bond Index (TR) (USD) | 3.38% | 4.08% |
|---|
|
|
| Performance Inception Date |
Jan. 22, 2024
|
|
| No Deduction of Taxes [Text Block] |
The table and graph presented above do not reflect the deduction of taxes a shareholder would pay on Fund distributions or the redemption of Fund Shares.
|
|
| AssetsNet |
$ 172,870,000
|
|
| Holdings Count | Holding |
489
|
|
| Advisory Fees Paid, Amount |
$ 105
|
|
| InvestmentCompanyPortfolioTurnover |
52.00%
|
|
| Additional Fund Statistics [Text Block] |
Key Fund Statistics as of July 31, 2025 | Total Net Assets (000's) | Number of Holdings | Total Advisory Fees Paid (000's) | Portfolio Turnover Rate |
|---|
| $172,870 | 489 | $105 | 52% |
|---|
|
|
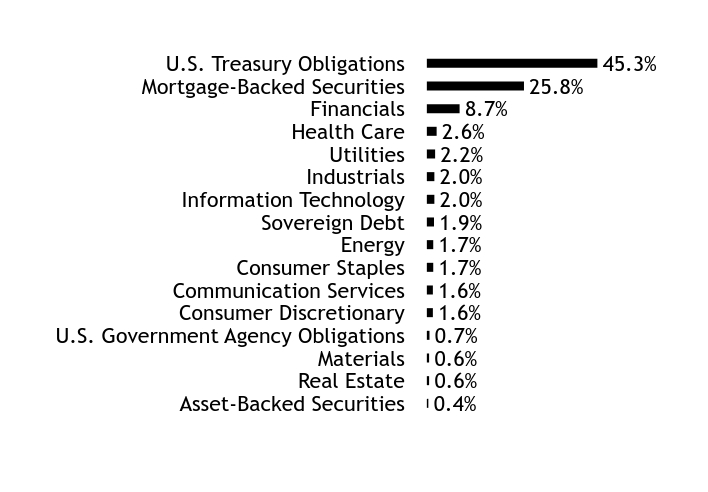
| Holdings [Text Block] |
Asset WeightingsFootnote Reference*Value | Value |
|---|
Asset-Backed Securities | 0.4% | Real Estate | 0.6% | Materials | 0.6% | U.S. Government Agency Obligations | 0.7% | Consumer Discretionary | 1.6% | Communication Services | 1.6% | Consumer Staples | 1.7% | Energy | 1.7% | Sovereign Debt | 1.9% | Information Technology | 2.0% | Industrials | 2.0% | Utilities | 2.2% | Health Care | 2.6% | Financials | 8.7% | Mortgage-Backed Securities | 25.8% | U.S. Treasury Obligations | 45.3% |
| Footnote | Description | Footnote* | Percentages are calculated based on total net assets. |
|
|
| Largest Holdings [Text Block] |
Holding Name | Coupon Rate | Maturity Date | Percentage of Total
Net Assets |
|---|
U.S. Treasury Notes | 4.000%
| 01/15/27
| 3.5% | U.S. Treasury Notes | 4.000%
| 01/31/29
| 3.2% | U.S. Treasury Notes | 4.375%
| 12/15/26
| 2.9% | U.S. Treasury Notes | 4.000%
| 01/31/31
| 2.9% | U.S. Treasury Bonds | 4.750%
| 11/15/43
| 2.6% | U.S. Treasury Notes | 3.750%
| 12/31/28
| 2.0% | U.S. Treasury Bonds | 4.750%
| 11/15/53
| 1.9% | U.S. Treasury Notes | 3.750%
| 12/31/30
| 1.9% | U.S. Treasury Notes | 3.750%
| 04/15/28
| 1.7% | FNMA | 2.500%
| 06/01/52
| 1.3% |
|
|
| Material Fund Change [Text Block] |
There were no material changes during the reporting period. |
|
| C000230415 |
|
|
| Shareholder Report [Line Items] |
|
|
| Fund Name |
Enhanced Fixed Income Fund
|
|
| Trading Symbol |
AAEZX
|
|
| Annual or Semi-Annual Statement [Text Block] |
This annual shareholder report contains important information about Enhanced Fixed Income Fund (the "Fund") for the period from August 1, 2024 to July 31, 2025.
|
|
| Shareholder Report Annual or Semi-Annual |
Annual Shareholder Report
|
|
| Additional Information [Text Block] |
You can find additional information about the Fund at https://holdings.seic.com/amt_holdings/. You can also request this information by contacting us at 610-676-1000.
|
|
| Additional Information Phone Number |
610-676-1000
|
|
| Additional Information Website |
https://holdings.seic.com/amt_holdings/
|
|
| Expenses [Text Block] |
What were the Fund costs for the last year?(based on a hypothetical $10,000 investment) Fund Name | Costs of a $10,000 investment | Costs paid as a percentage of a $10,000 investment |
|---|
Enhanced Fixed Income Fund | $43 | 0.42%Footnote Reference(1) |
|---|
| Footnote | Description | Footnote(1) | The expense ratio includes a proxy fee expense. Had this expense been excluded the ratio would have been 0.41%. |
|
|
| Expenses Paid, Amount |
$ 43
|
|
| Expense Ratio, Percent |
0.42%
|
[3] |
| Factors Affecting Performance [Text Block] |
How did the Fund perform in the last year?The Fund, which is managed using a passive approach, underperformed its benchmark, a 50/50 US High Yield Constrained Index/JPM EMBI Global Diversified Index — for the 12-month period ending July 31, 2025. The Federal Reserve (Fed) implemented a larger-than-expected 50-basis-point (0.50%) reduction in the federal-funds rate in September 2024, after being on pause since July of 2023, following an aggressive rate-hiking cycle in which the central bank raised the benchmark rate by a cumulative 525 basis points in 18 months. In addition to the 0.50% cut in September, the Fed also announced rate reductions of 0.25% at its meetings in November and December 2024. Through the first seven months of 2025, the Fed held the benchmark rate steady as macroeconomic uncertainty increased during the year. Evolving trade policy has the potential to put upward pressure on prices, and it appears that the effective tariff rate will settle in the 15%-20% range. The U.S. labor market remained on solid footing during the period with unemployment spending much of the second half of the reporting period around 4.1%; however, cracks did begin to appear late in the period as hiring slowed and continuing unemployment insurance claims ticked higher. The U.S. Treasury yield curve steepened during the reporting period, with front end yields moving lower and long-end yields rising. The 10-year Treasury note yield ultimately ended the reporting period up 0.35% closing the period at 4.38%. High-yield bonds, as measured by the ICE BofA U.S. High Yield Constrained Index (USD), gained 8.6% for the 12-month reporting period. High-yield spreads tightened by 39 basis points to 286 basis points during the period, and the yield to worst (a measure of the lowest possible yield that can be received on a bond with an early redemption provision) on the index fell to 7.08%. Hard-currency emerging-market (EM) debt, as measured by the J.P. Morgan EMBI Global Diversified Index, climbed 9.3% during the reporting period and outperformed high-yield bonds. EM debt returns were boosted by a generally strong global economy and attractive all-in yields. Local-currency issues outperformed their hard-currency counterparts during the reporting period as the U.S. dollar generally weakened due to evolving trade policy. |
|
| Performance Past Does Not Indicate Future [Text] |
Past performance is not indicative of future performance.
|
|
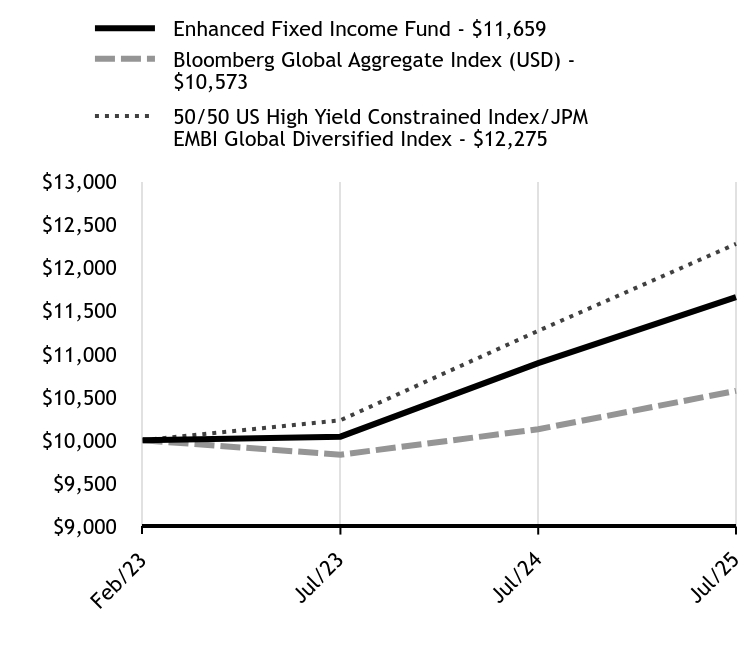
| Line Graph [Table Text Block] |
| Enhanced Fixed Income Fund - $11659 | Bloomberg Global Aggregate Index (USD) - $10573 | 50/50 US High Yield Constrained Index/JPM EMBI Global Diversified Index - $12275 |
|---|
Feb/23 | $10000 | $10000 | $10000 |
|---|
Jul/23 | $10042 | $9833 | $10232 |
|---|
Jul/24 | $10893 | $10128 | $11268 |
|---|
Jul/25 | $11659 | $10573 | $12275 |
|---|
|
|
| Average Annual Return [Table Text Block] |
Average Annual Total Returns as of July 31, 2025Fund/Index Name | 1 Year | Annualized
Since
Inception |
|---|
Enhanced Fixed Income Fund | 7.03% | 6.34% |
|---|
Bloomberg Global Aggregate Index (USD) | 4.40% | 2.26% |
|---|
50/50 US High Yield Constrained Index/JPM EMBI Global Diversified Index | 8.94% | 8.56% |
|---|
|
|
| Performance Inception Date |
Feb. 01, 2023
|
|
| No Deduction of Taxes [Text Block] |
The table and graph presented above do not reflect the deduction of taxes a shareholder would pay on Fund distributions or the redemption of Fund Shares.
|
|
| AssetsNet |
$ 33,400,000
|
|
| Holdings Count | Holding |
3
|
|
| Advisory Fees Paid, Amount |
$ 28
|
|
| InvestmentCompanyPortfolioTurnover |
99.00%
|
|
| Additional Fund Statistics [Text Block] |
Key Fund Statistics as of July 31, 2025 | Total Net Assets (000's) | Number of Holdings | Total Advisory Fees Paid (000's) | Portfolio Turnover Rate |
|---|
| $33,400 | 3 | $28 | 99% |
|---|
|
|
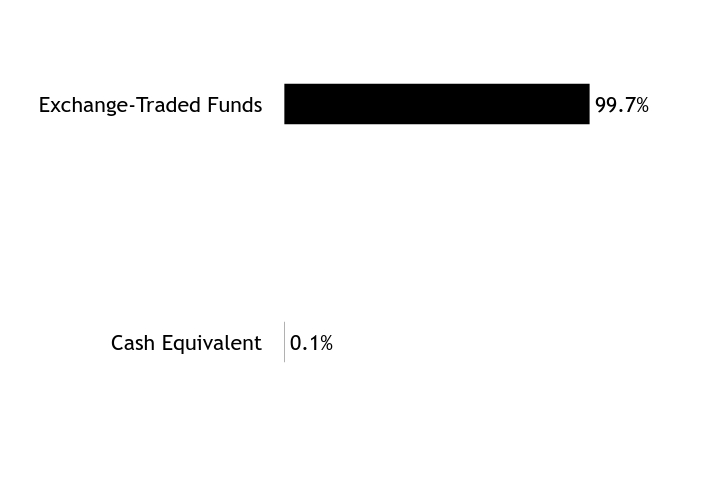
| Holdings [Text Block] |
Asset WeightingsFootnote Reference*Value | Value |
|---|
Cash Equivalent | 0.1% | Exchange-Traded Funds | 99.7% |
| Footnote | Description | Footnote* | Percentages are calculated based on total net assets. |
|
|
| Largest Holdings [Text Block] |
Holding Name | | | Percentage of
Total Net AssetsFootnote Reference(A) |
|---|
SPDR Bloomberg Emerging Markets USD Bond ETF | | | 50.1% | SPDR Portfolio High Yield Bond ETF | | | 49.6% |
| Footnote | Description | Footnote(A) | Cash Equivalents are not shown in the top ten chart. |
|
|
| Material Fund Change [Text Block] |
There were no material changes during the reporting period. |
|
|
|