This annual shareholder report contains important information about the Integrity Dividend Harvest Fund.
Period covered: August 1, 2024 through July 31, 2025
(Based on a hypothetical $10,000 investment)
| Class Name | Cost of a $10,000 investment | Costs paid as a percentage of a $10,000 investment |
| Class A | $100 | 0.95% |
| How did the Fund perform last year? | ||
| • | For the 12 month period ended July 31, 2025, the Fund’s Class A shares returned 10.81%. | |
| • | In comparison, the S&P High Yield Dividend Aristocrats Index (the "Benchmark") returned 4.55% for the same period. | |
| What affected the Fund’s performance? | ||
| • | The Federal Reserve (“the Fed”) reduced rates by 0.50% in September 2024, 0.25% in November 2024, and 0.25% in December 2024 to bring the Federal Funds Rate to 4.25-4.50%. | |
| • | U.S. stocks rose sharply over the period, despite having a correction in April due to tariff announcements. Performance was driven by optimism on artificial intelligence and on hopes that the Fed would cut rates in the latter half of 2025. | |
| • | Technology and communication services were the best performing sectors, while health care and energy performed the worst. | |
| • | The Fund outperformed the Benchmark, primarily driven by stock selection in technology, financials, and consumer staples. | |
| • | Detracting from relative performance was stock selection in health care. | |
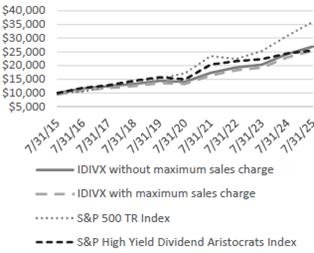
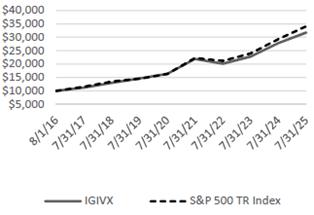
How did the Fund perform over the past 10 years?*
The chart below reflects a hypothetical $10,000 investment in the class of shares noted with and without sales charges.
CUMULATIVE PERFORMANCE
AVERAGE ANNUAL TOTAL RETURN (%)
For the Periods Ended July 31, 2025
| 1 Year | 5 Years | 10 Years | |
| Class A without sales charge | 10.81 | 13.82 | 10.40 |
| Class A with sales charge | 5.27 | 12.65 | 9.84 |
S&P 500 TR Index | 16.33 | 15.88 | 13.66 |
| S&P High Yield Dividend Aristocrats Index | 4.55 | 11.29 | 9.85 |
What are some key Fund statistics?
(as of July 31, 2025)
| Total Net Assets (Millions) | $520 |
| Number of Holdings | 57 |
| Net Advisory Fee Paid | $1.37M |
| Annual Portfolio Turnover | 28% |
| Distribution Rate @ NAV | 2.74% |
| Beta | 0.69 |
| 30-Day SEC Yield (IDIVX) | 2.29% |
Additional Fund Statistics Information
Distribution Rate is an annualized rate of dividend distributions for shareholders taking dividends in cash based on actual dividend
distributions and actual
number of days in the distribution period.
Beta is a volatility measure of the percentage price change of the Fund given a one percent change in a representative market index.
The Beta value is
determined by comparing the weekly price movements of the Fund and the S&P 500 Index over the last five years.
SEC yield of a fund is a standardized calculation of the fund's yield. This allows investors to compare funds from different issuers.
The SEC yield listed is subsidized, which means it reflects income earned during a 30-day period after the deduction of the fund's net
expenses. The yield is net of expense waivers and reimbursements.
What did the Fund invest in?
(as of July 31, 2025)
| Sectors | % Net Assets | ||
| Financials | 16.9 | ||
| Information Technology | 16.4 | ||
| Consumer Staples | 14.3 | ||
| Utilities | 13.8 | ||
| Energy | 12.5 | ||
| Health Care | 7.9 | ||
| Consumer Discretionary | 4.6 | ||
| Industrials | 4.1 | ||
| Communication Services | 4.1 | ||
| Cash Equivalents and Other | 3.7 | ||
| Materials | 1.7 |
| Top 10 Holdings | % Net Assets | |
| Broadcom Inc | 5.54 | |
| NextEra Energy Inc | 4.92 | |
| TransCanada Corp | 3.96 | |
| Chevron Corp | 3.50 | |
| Corning Inc | 3.16 | |
| PepsiCo Inc | 3.02 | |
| AbbVie Inc | 2.80 | |
| Morgan Stanley | 2.79 | |
| Citigroup Inc | 2.61 | |
| Bristol Myers Squibb Co | 2.58 | |
This annual shareholder report contains important information about the Integrity Dividend Harvest Fund.
Period covered: August 1, 2024 through July 31, 2025
(Based on a hypothetical $10,000 investment)
| Class Name | Cost of a $10,000 investment | Costs paid as a percentage of a $10,000 investment |
| Class C | $178 | 1.70% |
| How did the Fund perform last year? | ||
| • | For the 12 month period ended July 31, 2025, the Fund’s Class C shares returned 9.99%. | |
| • | In comparison, the S&P High Yield Dividend Aristocrats Index (the "Benchmark") returned 4.55% for the same period. | |
| What affected the Fund’s performance? | ||
| • | The Federal Reserve (“the Fed”) reduced rates by 0.50% in September 2024, 0.25% in November 2024, and 0.25% in December 2024 to bring the Federal Funds Rate to 4.25-4.50%. | |
| • | U.S. stocks rose sharply over the period, despite having a correction in April due to tariff announcements. Performance was driven by optimism on artificial intelligence and on hopes that the Fed would cut rates in the latter half of 2025. | |
| • | Technology and communication services were the best performing sectors, while health care and energy performed the worst. | |
| • | The Fund outperformed the Benchmark, primarily driven by stock selection in technology, financials, and consumer staples. | |
| • | Detracting from relative performance was stock selection in health care. | |
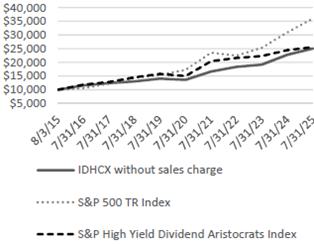
How did the Fund perform since inception?*
The chart below reflects a hypothetical $10,000 investment in the class of shares noted without sales charges. There is a 1% contingent deferred sales charge on any Class C shares you sell within 12 months of purchase. This would not apply to the chart below as the investment is held for over 12 months.
CUMULATIVE PERFORMANCE
AVERAGE ANNUAL TOTAL RETURN (%)
For the Periods Ended July 31, 2025
| 1 Year | 5 Years | Inception^ | |
| Class C without sales charge | 9.99 | 12.97 | 9.62 |
| Class C with sales charge | 8.99 | 12.97 | 9.62 |
S&P 500 TR Index | 16.33 | 15.88 | 13.69 |
| S&P High Yield Dividend Aristocrats Index | 4.55 | 11.29 | 9.85 |
| ^Inception Date of 8/3/2015 | |||
What are some key Fund statistics?
(as of July 31, 2025)
| Total Net Assets (Millions) | $520 |
| Number of Holdings | 57 |
| Net Advisory Fee Paid | $1.37M |
| Annual Portfolio Turnover | 28% |
| Distribution Rate | 2.04% |
| Beta | 0.69 |
| 30-Day SEC Yield (IDHCX) | 1.66% |
Additional Fund Statistics Information
Distribution Rate is an annualized rate of dividend distributions for shareholders taking dividends in cash based on actual dividend
distributions and actual
number of days in the distribution period.
Beta is a volatility measure of the percentage price change of the Fund given a one percent change in a representative market index.
The Beta value is
determined by comparing the weekly price movements of the Fund and the S&P 500 Index over the last five years.
SEC yield of a fund is a standardized calculation of the fund's yield. This allows investors to compare funds from different issuers.
The SEC yield listed is subsidized, which means it reflects income earned during a 30-day period after the deduction of the fund's net
expenses. The yield is net of expense waivers and reimbursements.
What did the Fund invest in?
(as of July 31, 2025)
| Sectors | % Net Assets | ||
| Financials | 16.9 | ||
| Information Technology | 16.4 | ||
| Consumer Staples | 14.3 | ||
| Utilities | 13.8 | ||
| Energy | 12.5 | ||
| Health Care | 7.9 | ||
| Consumer Discretionary | 4.6 | ||
| Industrials | 4.1 | ||
| Communication Services | 4.1 | ||
| Cash Equivalents and Other | 3.7 | ||
| Materials | 1.7 |
| Top 10 Holdings | % Net Assets | |
| Broadcom Inc | 5.54 | |
| NextEra Energy Inc | 4.92 | |
| TransCanada Corp | 3.96 | |
| Chevron Corp | 3.50 | |
| Corning Inc | 3.16 | |
| PepsiCo Inc | 3.02 | |
| AbbVie Inc | 2.80 | |
| Morgan Stanley | 2.79 | |
| Citigroup Inc | 2.61 | |
| Bristol Myers Squibb Co | 2.58 | |
This annual shareholder report contains important information about the Integrity Dividend Harvest Fund.
Period covered: August 1, 2024 through July 31, 2025
(Based on a hypothetical $10,000 investment)
| Class Name | Cost of a $10,000 investment | Costs paid as a percentage of a $10,000 investment |
| Class I | $74 | 0.70% |
| How did the Fund perform last year? | ||
| • | For the 12 month period ended July 31, 2025, the Fund’s Class I shares returned 11.07%. | |
| • | In comparison, the S&P High Yield Dividend Aristocrats Index (the "Benchmark") returned 4.55% for the same period. | |
| What affected the Fund’s performance? | ||
| • | The Federal Reserve (“the Fed”) reduced rates by 0.50% in September 2024, 0.25% in November 2024, and 0.25% in December 2024 to bring the Federal Funds Rate to 4.25-4.50%. | |
| • | U.S. stocks rose sharply over the period, despite having a correction in April due to tariff announcements. Performance was driven by optimism on artificial intelligence and on hopes that the Fed would cut rates in the latter half of 2025. | |
| • | Technology and communication services were the best performing sectors, while health care and energy performed the worst. | |
| • | The Fund outperformed the Benchmark, primarily driven by stock selection in technology, financials, and consumer staples. | |
| • | Detracting from relative performance was stock selection in health care. | |
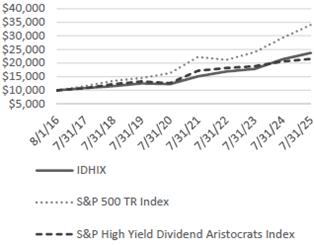
How did the Fund perform since inception?*
The chart below reflects a hypothetical $10,000 investment in the class of shares noted.
CUMULATIVE PERFORMANCE
AVERAGE ANNUAL TOTAL RETURN (%)
For the Periods Ended July 31, 2025
| 1 Year | 5 Years | Inception^ | |
| Class I | 11.07 | 14.10 | 10.09 |
| S&P 500 TR Index | 16.33 | 15.88 | 14.61 |
| S&P High Yield Dividend Aristocrats Index | 4.55 | 11.29 | 8.92 |
| ^Inception Date of 8/1/2016 | |||
What are some key Fund statistics?
(as of July 31, 2025)
| Total Net Assets (Millions) | $520 |
| Number of Holdings | 57 |
| Net Advisory Fee Paid | $1.37M |
| Annual Portfolio Turnover | 28% |
| Distribution Rate | 2.98% |
| Beta | 0.69 |
| 30-Day SEC Yield (IDHIX) | 2.66% |
Additional Fund Statistics Information
Distribution Rate is an annualized rate of dividend distributions for shareholders taking dividends in cash based on actual dividend
distributions and actual
number of days in the distribution period.
Beta is a volatility measure of the percentage price change of the Fund given a one percent change in a representative market index.
The Beta value is
determined by comparing the weekly price movements of the Fund and the S&P 500 Index over the last five years.
SEC yield of a fund is a standardized calculation of the fund's yield. This allows investors to compare funds from different issuers.
The SEC yield listed is subsidized, which means it reflects income earned during a 30-day period after the deduction of the fund's net
expenses. The yield is net of expense waivers and reimbursements.
What did the Fund invest in?
(as of July 31, 2025)
| Sectors | % Net Assets | ||
| Financials | 16.9 | ||
| Information Technology | 16.4 | ||
| Consumer Staples | 14.3 | ||
| Utilities | 13.8 | ||
| Energy | 12.5 | ||
| Health Care | 7.9 | ||
| Consumer Discretionary | 4.6 | ||
| Industrials | 4.1 | ||
| Communication Services | 4.1 | ||
| Cash Equivalents and Other | 3.7 | ||
| Materials | 1.7 |
| Top 10 Holdings | % Net Assets | |
| Broadcom Inc | 5.54 | |
| NextEra Energy Inc | 4.92 | |
| TransCanada Corp | 3.96 | |
| Chevron Corp | 3.50 | |
| Corning Inc | 3.16 | |
| PepsiCo Inc | 3.02 | |
| AbbVie Inc | 2.80 | |
| Morgan Stanley | 2.79 | |
| Citigroup Inc | 2.61 | |
| Bristol Myers Squibb Co | 2.58 | |
This annual shareholder report contains important information about the Integrity Dividend Summit Fund.
Period covered: August 1, 2024 through July 31, 2025
(Based on a hypothetical $10,000 investment)
| Class Name | Cost of a $10,000 investment | Costs paid as a percentage of a $10,000 investment |
| Class A | $83 | 0.81% |
| How did the Fund perform last year? | ||
| • | For the 12 month period ended July 31, 2025, the Fund’s Class A shares returned 4.88%. | |
| • | In comparison, the Dow Jones U.S. Select Dividend Index (the "Benchmark") returned 8.26% for the same period. | |
| What affected the Fund’s performance? | ||
| • | The Federal Reserve (“the Fed”) reduced rates by 0.50% in September 2024, 0.25% in November 2024, and 0.25% in December 2024 to bring the Federal Funds Rate to 4.25-4.50%. | |
| • | U.S. stocks rose sharply over the period, despite having a correction in April 2025 due to tariff announcements. Performance was driven by optimism on artificial intelligence and on hopes that the Fed would cut rates in the latter half of 2025. | |
| • | Technology and communication services were the best performing sectors, while health care and energy performed the worst. | |
| • | The Fund underperformed the Benchmark, primarily driven by as stock selection in health care and materials. | |
| • | Aiding relative performance over the period was stock selection in consumer staples and energy. | |
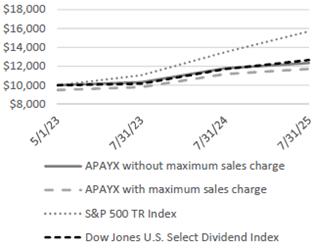
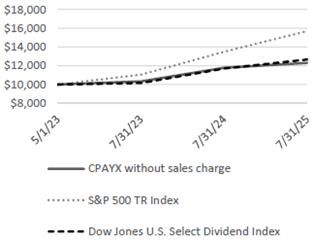
How did the Fund perform since inception?*
The chart below reflects a hypothetical $10,000 investment in the class of shares noted with and without sales charges.
CUMULATIVE PERFORMANCE
AVERAGE ANNUAL TOTAL RETURN (%)
For the Periods Ended July 31, 2025
| 1 Year | Inception^ | |
| Class A without sales charge | 4.88 | 9.83 |
| Class A with sales charge | -0.33 | 7.35 |
S&P 500 TR Index | 16.33 | 22.21 |
| Dow Jones U.S. Select Dividend Index | 8.26 | 11.08 |
| ^Inception Date of 5/1/2023 | ||
What are some key Fund statistics?
(as of July 31, 2025)
| Total Net Assets (Millions) | $10 |
| Number of Holdings | 38 |
| Net Advisory Fee Paid | $0 |
| Annual Portfolio Turnover | 43% |
What did the Fund invest in?
(as of July 31, 2025)
| Sectors | % Net Assets | ||
| Energy | 21.7 | ||
| Communication Services | 14.3 | ||
| Consumer Staples | 11.6 | ||
| Utilities | 11.6 | ||
| Financials | 11.2 | ||
| Materials | 8.8 | ||
| Health Care | 7.3 | ||
| Consumer Discretionary | 6.6 | ||
| Cash Equivalents and Other | 3.3 | ||
| Industrials | 2.8 | ||
Information Technology | 0.8 |
| Top 10 Holdings | % Net Assets | |
| Verizon Communications Inc | 7.11 | |
| TransCanada Corp | 5.97 | |
| AT&T Inc | 5.70 | |
| Rio Tinto PLC ADR | 4.35 | |
| AES Corp/The | 4.10 | |
| Bristol Myers Squibb Co | 3.92 | |
| British American Tobacco PLC ADR | 3.63 | |
| Cal Maine Foods Inc | 3.47 | |
| Pfizer Inc | 3.39 | |
| Best Buy Co Inc | 3.38 | |
This annual shareholder report contains important information about the Integrity Dividend Summit Fund.
Period covered: August 1, 2024 through July 31, 2025
(Based on a hypothetical $10,000 investment)
| Class Name | Cost of a $10,000 investment | Costs paid as a percentage of a $10,000 investment |
| Class C | $122 | 1.19% |
| How did the Fund perform last year? | ||
| • | For the 12 month period ended July 31, 2025, the Fund’s Class C shares returned 4.40%. | |
| • | In comparison, the Dow Jones U.S. Select Dividend Index (the "Benchmark") returned 8.26% for the same period. | |
| What affected the Fund’s performance? | ||
| • | The Federal Reserve (“the Fed”) reduced rates by 0.50% in September 2024, 0.25% in November 2024, and 0.25% in December 2024 to bring the Federal Funds Rate to 4.25-4.50%. | |
| • | U.S. stocks rose sharply over the period, despite having a correction in April 2025 due to tariff announcements. Performance was driven by optimism on artificial intelligence and on hopes that the Fed would cut rates in the latter half of 2025. | |
| • | Technology and communication services were the best performing sectors, while health care and energy performed the worst. | |
| • | The Fund underperformed the Benchmark, primarily driven by as stock selection in health care and materials. | |
| • | Aiding relative performance over the period was stock selection in consumer staples and energy. | |
How did the Fund perform since inception?*
The chart below reflects a hypothetical $10,000 investment in the class of shares noted without sales charges. There is a 1% contingent deferred sales charge on any Class C shares you sell within 12 months of purchase. This would not apply to the chart below as the investment is held for over 12 months.
CUMULATIVE PERFORMANCE
AVERAGE ANNUAL TOTAL RETURN (%)
For the Periods Ended July 31, 2025
| 1 Year | Inception^ | |
| Class C without sales charge | 4.40 | 9.61 |
| Class C with sales charge | 3.41 | 9.61 |
| S&P 500 TR Index | 16.33 | 22.21 |
| Dow Jones U.S. Select Dividend Index | 8.26 | 11.08 |
| ^Inception Date of 5/1/2023 |
What are some key Fund statistics?
(as of July 31, 2025)
| Total Net Assets (Millions) | $10 |
| Number of Holdings | 38 |
| Net Advisory Fee Paid | $0 |
| Annual Portfolio Turnover | 43% |
What did the Fund invest in?
(as of July 31, 2025)
| Sectors | % Net Assets | ||
| Energy | 21.7 | ||
| Communication Services | 14.3 | ||
| Consumer Staples | 11.6 | ||
| Utilities | 11.6 | ||
| Financials | 11.2 | ||
| Materials | 8.8 | ||
| Health Care | 7.3 | ||
| Consumer Discretionary | 6.6 | ||
| Cash Equivalents and Other | 3.3 | ||
| Industrials | 2.8 | ||
| Information Technology | 0.8 |
| Top 10 Holdings | % Net Assets | |
| Verizon Communications Inc | 7.11 | |
| TransCanada Corp | 5.97 | |
| AT&T Inc | 5.70 | |
| Rio Tinto PLC ADR | 4.35 | |
| AES Corp/The | 4.10 | |
| Bristol Myers Squibb Co | 3.92 | |
| British American Tobacco PLC ADR | 3.63 | |
| Cal Maine Foods Inc | 3.47 | |
| Pfizer Inc | 3.39 | |
| Best Buy Co Inc | 3.38 |
This annual shareholder report contains important information about the Integrity Dividend Summit Fund.
Period covered: August 1, 2024 through July 31, 2025
(Based on a hypothetical $10,000 investment)
| Class Name | Cost of a $10,000 investment | Costs paid as a percentage of a $10,000 investment |
| Class I | $67 | 0.65% |
| How did the Fund perform last year? | ||
| • | For the 12 month period ended July 31, 2025, the Fund’s Class I shares returned 5.06%. | |
| • | In comparison, the Dow Jones U.S. Select Dividend Index (the "Benchmark") returned 8.26% for the same period. | |
| What affected the Fund’s performance? | ||
| • | The Federal Reserve (“the Fed”) reduced rates by 0.50% in September 2024, 0.25% in November 2024, and 0.25% in December 2024 to bring the Federal Funds Rate to 4.25-4.50%. | |
| • | U.S. stocks rose sharply over the period, despite having a correction in April 2025 due to tariff announcements. Performance was driven by optimism on artificial intelligence and on hopes that the Fed would cut rates in the latter half of 2025. | |
| • | Technology and communication services were the best performing sectors, while health care and energy performed the worst. | |
| • | The Fund underperformed the Benchmark, primarily driven by as stock selection in health care and materials. | |
| • | Aiding relative performance over the period was stock selection in consumer staples and energy. | |
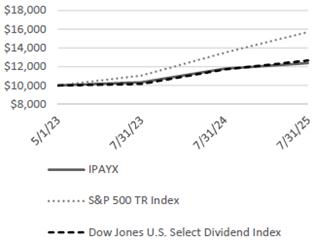
How did the Fund perform since inception?*
The chart below reflects a hypothetical $10,000 investment in the class of shares noted.
CUMULATIVE PERFORMANCE
AVERAGE ANNUAL TOTAL RETURN (%)
For the Periods Ended July 31, 2025
| 1 Year | Inception^ | |
| Class I | 5.06 | 9.93 |
S&P 500 TR Index | 16.33 | 22.21 |
| Dow Jones U.S. Select Dividend Index | 8.26 | 11.08 |
| ^Inception Date of 5/1/2023 | ||
What are some key Fund statistics?
(as of July 31, 2025)
| Total Net Assets (Millions) | $10 |
| Number of Holdings | 38 |
| Net Advisory Fee Paid | $0 |
| Annual Portfolio Turnover | 43% |
What did the Fund invest in?
(as of July 31, 2025)
| Sectors | % Net Assets | ||
| Energy | 21.7 | ||
| Communication Services | 14.3 | ||
| Consumer Staples | 11.6 | ||
| Utilities | 11.6 | ||
| Financials | 11.2 | ||
| Materials | 8.8 | ||
| Health Care | 7.3 | ||
| Consumer Discretionary | 6.6 | ||
| Cash Equivalents and Other | 3.3 | ||
| Industrials | 2.8 | ||
Information Technology | 0.8 |
| Top 10 Holdings | % Net Assets | |
| Verizon Communications Inc | 7.11 | |
| TransCanada Corp | 5.97 | |
| AT&T Inc | 5.70 | |
| Rio Tinto PLC ADR | 4.35 | |
| AES Corp/The | 4.10 | |
| Bristol Myers Squibb Co | 3.92 | |
| British American Tobacco PLC ADR | 3.63 | |
| Cal Maine Foods Inc | 3.47 | |
| Pfizer Inc | 3.39 | |
| Best Buy Co Inc | 3.38 | |
This annual shareholder report contains important information about the Integrity Growth & Income Fund.
Period covered: August 1, 2024 through July 31, 2025
during the reporting period.
(Based on a hypothetical $10,000 investment)
| Class Name | Cost of a $10,000 investment | Costs paid as a percentage of a $10,000 investment |
| Class A | $133 | 1.24% |
| How did the Fund perform last year? | ||
| • | For the 12 month period ended July 31, 2025, the Fund’s Class A shares returned 13.80%. | |
| • | In comparison, the S&P 500 Total Return Index (the "Benchmark") returned 16.33% for the same period. | |
| What affected the Fund’s performance? | ||
| • | The Federal Reserve (“the Fed”) reduced rates by 0.50% in September 2024, 0.25% in November 2024, and 0.25% in December 2024 to bring the Federal Funds Rate to 4.25-4.50%. | |
| • | U.S. stocks rose sharply over the period, despite having a correction in April 2025 due to tariff announcements. Performance was driven by optimism on artificial intelligence and on hopes that the Fed would cut rates in the latter half of 2025. | |
| • | Technology and communication services were the best performing sectors, while health care and energy performed the worst. | |
| • | The Fund underperformed the Benchmark, primarily driven by stock selection in consumer staples and health care. | |
| • | Aiding relative performance over the period was an underweight allocation to health care and an overweight allocation to technology. | |
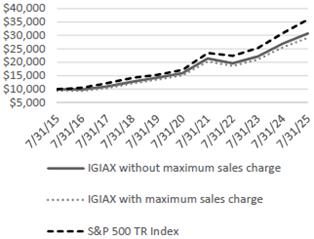
How did the Fund perform over the past 10 years?*
The chart below reflects a hypothetical $10,000 investment in the class of shares noted with and without sales charges.
CUMULATIVE PERFORMANCE
AVERAGE ANNUAL TOTAL RETURN (%)
For the Periods Ended July 31, 2025
| 1 Year | 5 Years | 10 Years | |
| Class A without sales charge | 13.80 | 13.96 | 11.87 |
| Class A with sales charge | 8.10 | 12.79 | 11.30 |
| S&P 500 TR Index | 16.33 | 15.88 | 13.66 |
What are some key Fund statistics?
(as of July 31, 2025)
| Total Net Assets (Millions) | $114 |
| Number of Holdings | 38 |
| Net Advisory Fee Paid | $477K |
| Annual Portfolio Turnover | 9% |
What did the Fund invest in?
(as of July 31, 2025)
| Sectors | % Net Assets | ||
| Information Technology | 44.7 | ||
| Financials | 16.5 | ||
| Industrials | 12.0 | ||
| Consumer Staples | 5.2 | ||
| Health Care | 4.8 | ||
| Utilities | 4.5 | ||
| Consumer Discretionary | 3.9 | ||
| Materials | 2.8 | ||
| Cash Equivalents and Other | 2.2 | ||
| Energy | 1.8 | ||
| Communication Services | 1.6 |
| Top 10 Holdings | % Net Assets | |
| NVIDIA Corp | 10.14 | |
| KLA Tencor Corp | 4.63 | |
| Visa Inc | 4.55 | |
| Trane Technologies PLC | 4.23 | |
| Cloudflare Inc | 3.83 | |
| Apple Inc | 3.82 | |
| Mastercard Inc | 3.48 | |
| Intuit Inc | 3.44 | |
| Lam Research Corp | 3.33 | |
| JPMorgan Chase & Co | 3.12 | |
Changes to the Fund
This is a summary of certain changes to the Fund since August 1, 2024. For more complete information, you may review the Fund's next prospectus,
which we expect to be available by November 28, 2025 at www.integrityvikingfunds.com/documents or upon request at (800) 276-1262.
The Fund's investment strategy is supplemented with the following sentence: while the Fund does not concentrate in any one industry, it
may make significant investments in certain sectors, based on economic conditions.
Accordingly, the Fund is subject to the risks of the information technology sector.
This annual shareholder report contains important information about the Integrity Growth & Income Fund.
Period covered: August 1, 2024 through July 31, 2025
during the reporting period.
(Based on a hypothetical $10,000 investment)
| Class Name | Cost of a $10,000 investment | Costs paid as a percentage of a $10,000 investment |
| Class C | $212 | 1.99% |
| How did the Fund perform last year? | ||
| • | For the 12 month period ended July 31, 2025, the Fund’s Class C shares returned 12.94%. | |
| • | In comparison, the S&P 500 Total Return Index (the "Benchmark") returned 16.33% for the same period. | |
| What affected the Fund’s performance? | ||
| • | The Federal Reserve (“the Fed”) reduced rates by 0.50% in September 2024, 0.25% in November 2024, and 0.25% in December 2024 to bring the Federal Funds Rate to 4.25-4.50%. | |
| • | U.S. stocks rose sharply over the period, despite having a correction in April 2025 due to tariff announcements. Performance was driven by optimism on artificial intelligence and on hopes that the Fed would cut rates in the latter half of 2025. | |
| • | Technology and communication services were the best performing sectors, while health care and energy performed the worst. | |
| • | The Fund underperformed the Benchmark, primarily driven by stock selection in consumer staples and health care. | |
| • | Aiding relative performance over the period was an underweight allocation to health care and an overweight allocation to technology. | |
How did the Fund perform since inception?*
The chart below reflects a hypothetical $10,000 investment in the class of shares noted without sales charges. There is a 1% contingent deferred sales charge on any Class C shares you sell within 12 months of purchase. This would not apply to the chart below as the investment is held for over 12 months.
CUMULATIVE PERFORMANCE
AVERAGE ANNUAL TOTAL RETURN (%)
For the Periods Ended July 31, 2025
| 1 Year | 5 Years | Inception^ | |
| Class C without sales charge | 12.94 | 13.16 | 11.23 |
| Class C with sales charge | 11.94 | 13.16 | 11.23 |
S&P 500 TR Index | 16.33 | 15.88 | 13.69 |
| ^Inception Date of 8/3/2015 | |||
What are some key Fund statistics?
(as of July 31, 2025)
| Total Net Assets (Millions) | $114 |
| Number of Holdings | 38 |
| Net Advisory Fee Paid | $477K |
| Annual Portfolio Turnover | 9% |
What did the Fund invest in?
(as of July 31, 2025)
| Sectors | % Net Assets | ||
| Information Technology | 44.7 | ||
| Financials | 16.5 | ||
| Industrials | 12.0 | ||
| Consumer Staples | 5.2 | ||
| Health Care | 4.8 | ||
| Utilities | 4.5 | ||
| Consumer Discretionary | 3.9 | ||
| Materials | 2.8 | ||
| Cash Equivalents and Other | 2.2 | ||
| Energy | 1.8 | ||
| Communication Services | 1.6 |
| Top 10 Holdings | % Net Assets | |
| NVIDIA Corp | 10.14 | |
| KLA Tencor Corp | 4.63 | |
| Visa Inc | 4.55 | |
| Trane Technologies PLC | 4.23 | |
| Cloudflare Inc | 3.83 | |
| Apple Inc | 3.82 | |
| Mastercard Inc | 3.48 | |
| Intuit Inc | 3.44 | |
| Lam Research Corp | 3.33 | |
| JPMorgan Chase & Co | 3.12 | |
Changes to the Fund
This is a summary of certain changes to the Fund since August 1, 2024. For more complete information, you may review the Fund's next
prospectus, which we expect to be available by November 28, 2025 at www.integrityvikingfunds.com/documents or upon request at (800) 276-1262.
The Fund's investment strategy is supplemented with the following sentence: while the Fund does not concentrate in any one industry,
it may make significant investments in certain sectors, based on economic conditions.
Accordingly, the Fund is subject to the risks of the information technology sector.
This annual shareholder report contains important information about the Integrity Growth & Income Fund.
Period covered: August 1, 2024 through July 31, 2025
during the reporting period.
(Based on a hypothetical $10,000 investment)
| Class Name | Cost of a $10,000 investment | Costs paid as a percentage of a $10,000 investment |
| Class I | $106 | 0.99% |
| How did the Fund perform last year? | ||
| • | For the 12 month period ended July 31, 2025, the Fund’s Class I shares returned 14.09%. | |
| • | In comparison, the S&P 500 Total Return Index (the "Benchmark") returned 16.33% for the same period. | |
| What affected the Fund’s performance? | ||
| • | The Federal Reserve (“the Fed”) reduced rates by 0.50% in September 2024, 0.25% in November 2024, and 0.25% in December 2024 to bring the Federal Funds Rate to 4.25-4.50%. | |
| • | U.S. stocks rose sharply over the period, despite having a correction in April 2025 due to tariff announcements. Performance was driven by optimism on artificial intelligence and on hopes that the Fed would cut rates in the latter half of 2025. | |
| • | Technology and communication services were the best performing sectors, while health care and energy performed the worst. | |
| • | The Fund underperformed the Benchmark, primarily driven by stock selection in consumer staples and health care. | |
| • | Aiding relative performance over the period was an underweight allocation to health care and an overweight allocation to technology. | |
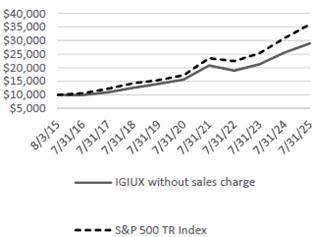
How did the Fund perform since inception?*
The chart below reflects a hypothetical $10,000 investment in the class of shares noted.
CUMULATIVE PERFORMANCE
AVERAGE ANNUAL TOTAL RETURN (%)
For the Periods Ended July 31, 2025
| 1 Year | 5 Years | Inception^ | |
| Class I | 14.09 | 14.24 | 13.71 |
S&P 500 TR Index | 16.33 | 15.88 | 14.61 |
| ^Inception Date of 8/1/2016 | |||
What are some key Fund statistics?
(as of July 31, 2025)
| Total Net Assets (Millions) | $114 |
| Number of Holdings | 38 |
| Net Advisory Fee Paid | $477K |
| Annual Portfolio Turnover | 9% |
What did the Fund invest in?
(as of July 31, 2025)
| Sectors | % Net Assets | ||
| Information Technology | 44.7 | ||
| Financials | 16.5 | ||
| Industrials | 12.0 | ||
| Consumer Staples | 5.2 | ||
| Health Care | 4.8 | ||
| Utilities | 4.5 | ||
| Consumer Discretionary | 3.9 | ||
| Materials | 2.8 | ||
| Cash Equivalents and Other | 2.2 | ||
| Energy | 1.8 | ||
| Communication Services | 1.6 |
| Top 10 Holdings | % Net Assets | |
| NVIDIA Corp | 10.14 | |
| KLA Tencor Corp | 4.63 | |
| Visa Inc | 4.55 | |
| Trane Technologies PLC | 4.23 | |
| Cloudflare Inc | 3.83 | |
| Apple Inc | 3.82 | |
| Mastercard Inc | 3.48 | |
| Intuit Inc | 3.44 | |
| Lam Research Corp | 3.33 | |
| JPMorgan Chase & Co | 3.12 | |
Changes to the Fund
This is a summary of certain changes to the Fund since August 1, 2024. For more complete information, you may review the Fund's next
prospectus, which we expect to be available by November 28, 2025 at www.integrityvikingfunds.com/documents or upon request at (800) 276-1262.
The Fund's investment strategy is supplemented with the following sentence: while the Fund does not concentrate in any one industry,
it may make significant investments in certain sectors, based on economic conditions.
Accordingly, the Fund is subject to the risks of the information technology sector.
This annual shareholder report contains important information about the Integrity High Income Fund.
Period covered: August 1, 2024 through July 31, 2025
during the reporting period.
(Based on a hypothetical $10,000 investment)
| Class Name | Cost of a $10,000 investment | Costs paid as a percentage of a $10,000 investment |
| Class A | $108 | 1.04% |
| How did the Fund perform last year? | ||
| • | For the 12 month period ended July 31, 2025, the Fund's Class A shares returned 8.42%. | |
| • | In comparison, the Bloomberg U.S. Corporate High Yield Bond Index (the "Benchmark") returned 8.67% for the same period. | |
| What affected the Fund’s performance? | ||
| • | During the period, the Fund's overweight position in the Cable Satellite sector, along with the Fund's security selection in Pharmaceuticals and Midstream, contributed to relative performance. Conversely, the Fund's security selection in Retailers, overweight position in Automotive and underweight position in Wireless detracted from relative performance. | |
| • | Compared to the Benchmark on July 31, 2025, the Fund was overweight in the Cable Satellite, Automotive and Independent Energy sectors due to the relative value opportunities within those sectors. The Fund was underweight in Finance Companies, P&C and Retailers because the portfolio managers did not find these sectors attractive due to challenging fundamental outlooks or rich valuations. Relative to the Benchmark on July 31, 2025, the Fund’s yield, spread and duration were lower than those of the Benchmark. | |
| • | Specifically, the Fund's overweight positions in Lumen Technologies, Bausch Health, DISH Network and Intelsat paired with lack of exposure to New Fortress Energy contributed to relative performance. Overweight positions in Claires, Rite Aid and Ford Motor Company, lack of exposure to Uniti Group and the Fund's underweight position in CSC Holdings were the top detractors in the period. | |
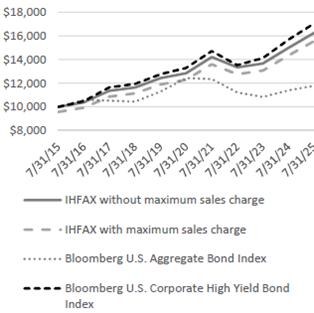
How did the Fund perform over the past 10 years?*
The chart below reflects a hypothetical $10,000 investment in the class of shares noted with and without sales charges.
CUMULATIVE PERFORMANCE
AVERAGE ANNUAL TOTAL RETURN (%)
For the Periods Ended July 31, 2025
| 1 Year | 5 Years | 10 Years | |
| Class A without sales charge | 8.42 | 4.82 | 4.98 |
| Class A with sales charge | 3.80 | 3.91 | 4.52 |
| Bloomberg U.S. Aggregate Bond Index | 3.38 | -1.07 | 1.66 |
| Bloomberg U.S. Corporate High Yield Bond Index | 8.67 | 5.09 | 5.49 |
What are some key Fund statistics?
(as of July 31, 2025)
| Total Net Assets (Millions) | $47 |
| Number of Holdings | 644 |
| Net Advisory Fee Paid | $111K |
| Annual Portfolio Turnover | 28% |
What did the Fund invest in?
(as of July 31, 2025)
| Sectors | % Net Assets | ||
| Consumer Discretionary | 19.5 | ||
| Communication Services | 19.0 | ||
| Industrials | 12.7 | ||
| Energy | 11.5 | ||
| Health Care | 9.5 | ||
| Materials | 7.9 | ||
| Information Technology | 6.2 | ||
| Consumer Staples | 3.6 | ||
| Cash Equivalents and Other | 3.5 | ||
| Real Estate | 3.1 | ||
| Utilities | 1.9 | ||
| Financials | 1.6 |
| Credit Rating Breakdown* | % Net Assets | |
| BBB | 6.75 | |
| BB | 54.01 | |
| B | 23.77 | |
| CCC | 10.18 | |
| CC | 0.02 | |
| NR | 5.27 | |
* The ratings agencies that provided the ratings are Standard & Poor’s and Moody’s. When ratings vary, the higher rating is used. Credit quality ratings are measured on a scale that generally ranges from AAA (highest) to D (lowest). “NR” is used to classify securities for which a rating is not available. Ratings apply to the holdings in the Fund portfolio and not to the Fund or its shares. Ratings are subject to change.
| Credit Rating Breakdown* | % Net Assets | |
| BBB | 6.75 | |
| BB | 54.01 | |
| B | 23.77 | |
| CCC | 10.18 | |
| CC | 0.02 | |
| NR | 5.27 | |
Changes to the Fund
This is a summary of certain changes to the Fund since August 1, 2024. For more complete information, you may review the Fund's current prospectus dated November 30, 2024 or the next prospectus, which we expect to be available by November 28, 2025 at www.integrityvikingfunds.com/documents or upon request at (800) 276-1262.
Effective November 30, 2024, Class A's expense limitation was increased from 0.99% of the Fund's average daily net assets to 1.09% of the Fund's average daily net assets.
Effective November 30, 2024, Class A's expense limitation was increased from 0.99% of the Fund's average daily net assets to 1.09% of the Fund's average daily net assets.
This annual shareholder report contains important information about the Integrity High Income Fund.
Period covered: August 1, 2024 through July 31, 2025
during the reporting period.
(Based on a hypothetical $10,000 investment)
| Class Name | Cost of a $10,000 investment | Costs paid as a percentage of a $10,000 investment |
| Class C | $187 | 1.80% |
| How did the Fund perform last year? | ||
| • | For the 12 month period ended July 31, 2025, the Fund's Class C shares returned 7.32%. | |
| • | In comparison, the Bloomberg U.S. Corporate High Yield Bond Index (the "Benchmark") returned 8.67% for the same period. | |
| What affected the Fund’s performance? | ||
| • | During the period, the Fund's overweight position in the Cable Satellite sector, along with the Fund's security selection in Pharmaceuticals and Midstream, contributed to relative performance. Conversely, the Fund's security selection in Retailers, overweight position in Automotive and underweight position in Wireless detracted from relative performance. | |
| • | Compared to the Benchmark on July 31, 2025, the Fund was overweight in the Cable Satellite, Automotive and Independent Energy sectors due to the relative value opportunities within those sectors. The Fund was underweight in Finance Companies, P&C and Retailers because the portfolio managers did not find these sectors attractive due to challenging fundamental outlooks or rich valuations. Relative to the Benchmark on July 31, 2025, the Fund’s yield, spread and duration were lower than those of the Benchmark. | |
| • | Specifically, the Fund's overweight positions in Lumen Technologies, Bausch Health, DISH Network and Intelsat paired with lack of exposure to New Fortress Energy contributed to relative performance. Overweight positions in Claires, Rite Aid and Ford Motor Company, lack of exposure to Uniti Group and the Fund's underweight position in CSC Holdings were the top detractors in the period. | |
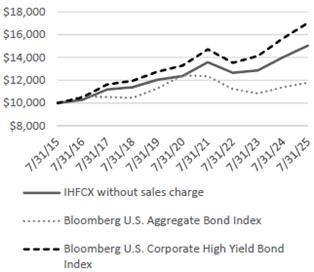
How did the Fund perform over the past 10 years?*
The chart below reflects a hypothetical $10,000 investment in the class of shares noted without sales charges. There is a 1% contingent deferred sales charge on any Class C shares you sell within 12 months of purchase. This would not apply to the chart below as the investment is held for over 12 months.
CUMULATIVE PERFORMANCE
AVERAGE ANNUAL TOTAL RETURN (%)
For the Periods Ended July 31, 2025
| 1 Year | 5 Years | 10 Years | |
| Class C without sales charge | 7.32 | 3.98 | 4.17 |
| Class C with sales charge | 6.32 | 3.98 | 4.17 |
| Bloomberg U.S. Aggregate Bond Index | 3.38 | -1.07 | 1.66 |
| Bloomberg U.S. Corporate High Yield Bond Index | 8.67 | 5.09 | 5.49 |
What are some key Fund statistics?
(as of July 31, 2025)
| Total Net Assets (Millions) | $47 |
| Number of Holdings | 644 |
| Net Advisory Fee Paid | $111K |
| Annual Portfolio Turnover | 28% |
What did the Fund invest in?
(as of July 31, 2025)
| Sectors | % Net Assets | ||
| Consumer Discretionary | 19.5 | ||
| Communication Services | 19.0 | ||
| Industrials | 12.7 | ||
| Energy | 11.5 | ||
| Health Care | 9.5 | ||
| Materials | 7.9 | ||
| Information Technology | 6.2 | ||
| Consumer Staples | 3.6 | ||
| Cash Equivalents and Other | 3.5 | ||
| Real Estate | 3.1 | ||
| Utilities | 1.9 | ||
| Financials | 1.6 |
| Credit Rating Breakdown* | % Net Assets | |
| BBB | 6.75 | |
| BB | 54.01 | |
| B | 23.77 | |
| CCC | 10.18 | |
| CC | 0.02 | |
| NR | 5.27 | |
* The ratings agencies that provided the ratings are Standard & Poor’s and Moody’s. When ratings vary, the higher rating is used. Credit quality ratings are measured on a scale that generally ranges from AAA (highest) to D (lowest). “NR” is used to classify securities for which a rating is not available. Ratings apply to the holdings in the Fund portfolio and not to the Fund or its shares. Ratings are subject to change.
| Credit Rating Breakdown* | % Net Assets | |
| BBB | 6.75 | |
| BB | 54.01 | |
| B | 23.77 | |
| CCC | 10.18 | |
| CC | 0.02 | |
| NR | 5.27 | |
* The ratings agencies that provided the ratings are Standard & Poor’s and Moody’s. When ratings vary, the higher rating is used. Credit quality ratings are measured on a scale that generally ranges from AAA (highest) to D (lowest). “NR” is used to classify securities for which a rating is not available. Ratings apply to the holdings in the Fund portfolio and not to the Fund or its shares. Ratings are subject to change.
Changes to the Fund
This is a summary of certain changes to the Fund since August 1, 2024. For more complete information, you may review the Fund's current prospectus dated November 30, 2024 or the next prospectus, which we expect to be available by November 28, 2025 at www.integrityvikingfunds.com/documents or upon request at (800) 276-1262.
Effective November 30, 2024, Class C's expense limitation was increased from 1.74% of the Fund's average daily net assets to 1.84% of the Fund's average daily net assets.
Effective November 30, 2024, Class C's expense limitation was increased from 1.74% of the Fund's average daily net assets to 1.84% of the Fund's average daily net assets.
This annual shareholder report contains important information about the Integrity High Income Fund.
Period covered: August 1, 2024 through July 31, 2025
during the reporting period.
(Based on a hypothetical $10,000 investment)
| Class Name | Cost of a $10,000 investment | Costs paid as a percentage of a $10,000 investment |
| Class I | $82 | 0.79% |
| How did the Fund perform last year? | ||
| • | For the 12 month period ended July 31, 2025, the Fund's Class I shares returned 8.84%. | |
| • | In comparison, the Bloomberg U.S. Corporate High Yield Bond Index (the "Benchmark") returned 8.67% for the same period. | |
| What affected the Fund’s performance? | ||
| • | During the period, the Fund's overweight position in the Cable Satellite sector, along with the Fund's security selection in Pharmaceuticals and Midstream, contributed to relative performance. Conversely, the Fund's security selection in Retailers, overweight position in Automotive and underweight position in Wireless detracted from relative performance. | |
| • | Compared to the Benchmark on July 31, 2025, the Fund was overweight in the Cable Satellite, Automotive and Independent Energy sectors due to the relative value opportunities within those sectors. The Fund was underweight in Finance Companies, P&C and Retailers because the portfolio managers did not find these sectors attractive due to challenging fundamental outlooks or rich valuations. Relative to the Benchmark on July 31, 2025, the Fund’s yield, spread and duration were lower than those of the Benchmark. | |
| • | Specifically, the Fund's overweight positions in Lumen Technologies, Bausch Health, DISH Network and Intelsat paired with lack of exposure to New Fortress Energy contributed to relative performance. Overweight positions in Claires, Rite Aid and Ford Motor Company, lack of exposure to Uniti Group and the Fund's underweight position in CSC Holdings were the top detractors in the period. | |
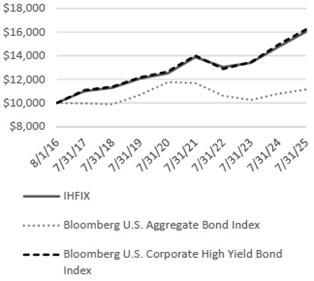
How did the Fund perform since inception?*
The chart below reflects a hypothetical $10,000 investment in the class of shares noted.
CUMULATIVE PERFORMANCE
AVERAGE ANNUAL TOTAL RETURN (%)
For the Periods Ended July 31, 2025
| 1 Year | 5 Years | Inception^ | |
| Class I | 8.84 | 5.11 | 5.40 |
| Bloomberg U.S. Aggregate Bond Index | 3.38 | -1.07 | 1.22 |
| Bloomberg U.S. Corporate High Yield Bond Index | 8.67 | 5.09 | 5.54 |
| ^Inception Date of 8/1/2016 | |||
What are some key Fund statistics?
(as of July 31, 2025)
| Total Net Assets (Millions) | $47 |
| Number of Holdings | 644 |
| Net Advisory Fee Paid | $111K |
| Annual Portfolio Turnover | 28% |
What did the Fund invest in?
(as of July 31, 2025)
| Sectors | % Net Assets | ||
| Consumer Discretionary | 19.5 | ||
| Communication Services | 19.0 | ||
| Industrials | 12.7 | ||
| Energy | 11.5 | ||
| Health Care | 9.5 | ||
| Materials | 7.9 | ||
| Information Technology | 6.2 | ||
| Consumer Staples | 3.6 | ||
| Cash Equivalents and Other | 3.5 | ||
| Real Estate | 3.1 | ||
| Utilities | 1.9 | ||
| Financials | 1.6 |
| Credit Rating Breakdown* | % Net Assets | |
| BBB | 6.75 | |
| BB | 54.01 | |
| B | 23.77 | |
| CCC | 10.18 | |
| CC | 0.02 | |
| NR | 5.27 | |
* The ratings agencies that provided the ratings are Standard & Poor’s and Moody’s. When ratings vary, the higher rating is used. Credit quality ratings are measured on a scale that generally ranges from AAA (highest) to D (lowest). “NR” is used to classify securities for which a rating is not available. Ratings apply to the holdings in the Fund portfolio and not to the Fund or its shares. Ratings are subject to change.
| Credit Rating Breakdown* | % Net Assets | |
| BBB | 6.75 | |
| BB | 54.01 | |
| B | 23.77 | |
| CCC | 10.18 | |
| CC | 0.02 | |
| NR | 5.27 | |
Changes to the Fund
This is a summary of certain changes to the Fund since August 1, 2024. For more complete information, you may review the Fund's current prospectus dated November 30, 2024 or the next prospectus, which we expect to be available by November 30, 2025 at www.integrityvikingfunds.com/documents or upon request at (800) 276-1262.
Effective November 30, 2024, Class I's expense limitation was increased from 0.74% of the Fund's average daily net assets to 0.84% of the Fund's average daily net assets.
Effective November 30, 2024, Class I's expense limitation was increased from 0.74% of the Fund's average daily net assets to 0.84% of the Fund's average daily net assets.
This annual shareholder report contains important information about the Integrity Mid-North American Resources Fund.
Period covered: August 1, 2024 through July 31, 2025
(Based on a hypothetical $10,000 investment)
| Class Name | Cost of a $10,000 investment | Costs paid as a percentage of a $10,000 investment |
| Class A | $160 | 1.50% |
| How did the Fund perform last year? | ||
| • | For the 12 month period ended July 31, 2025, the Fund’s Class A shares returned 13.89%. | |
| • | In comparison, the S&P 1500 Energy Total Return Index (the "Benchmark") returned -3.84% for the same period. | |
| What affected the Fund’s performance? | ||
| • | The Federal Reserve (“the Fed”) reduced rates by 0.50% in September 2024, 0.25% in November 2024, and 0.25% in December 2024 to bring the Federal Funds Rate to 4.25-4.50%. | |
| • | U.S. stocks rose sharply over the period, despite having a correction in April 2025 due to tariff announcements. Performance was driven by optimism on artificial intelligence and on hopes that the Fed would cut rates in the latter half of 2025. | |
| • | Crude oil prices experienced elevated volatility over the period as geopolitical tensions were offset by an oversupplied market. Crude oil traded modestly lower for the period. | |
| • | Aiding relative performance versus the Benchmark over the period was an overweight allocation to utilities, independent power producer and midstream, as well as stock selection in exploration & production. | |
| • | Detracting from relative performance was an overweight allocation to oilfield service. | |
| Return of Capital Distribution | ||
| As of July 31, 2025 distributable earnings was increased and paid in capital was decreased in the amount of $0.01 per share due to distributions paid in excess of earnings for class A. | ||
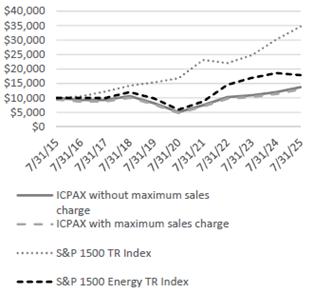
How did the Fund perform over the past 10 years?*
The chart below reflects a hypothetical $10,000 investment in the class of shares noted with and without sales charges.
CUMULATIVE PERFORMANCE
AVERAGE ANNUAL TOTAL RETURN (%)
For the Periods Ended July 31, 2025
| 1 Year | 5 Years | 10 Years | |
| Class A without sales charge | 13.89 | 21.82 | 3.21 |
| Class A with sales charge | 8.26 | 20.55 | 2.69 |
S&P 1500 TR Index | 15.03 | 15.60 | 13.27 |
| S&P 1500 Energy TR Index | -3.84 | 24.47 | 6.01 |
What are some key Fund statistics?
(as of July 31, 2025)
| Total Net Assets (Millions) | $135 |
| Number of Holdings | 48 |
| Net Advisory Fee Paid | $611K |
| Annual Portfolio Turnover | 63% |
What did the Fund invest in?
(as of July 31, 2025)
| Sectors | % Net Assets | ||
| Energy | 66.8 | ||
| Utilities | 13.5 | ||
| Industrials | 12.3 | ||
| Information Technologies | 3.0 | ||
| Cash Equivalents and Other | 2.2 | ||
| Consumer Discretionary | 2.2 |
| Top 10 Holdings | % Net Assets | |
| Cheniere Energy Inc | 5.06 | |
| Exxon Mobil Corp | 4.54 | |
| Baker Hughes a GE Co | 4.40 | |
| Permian Resources Corp | 4.08 | |
| Entergy Corp | 4.01 | |
| Vertiv Holdings Co | 3.77 | |
| Vistra Corp | 3.70 | |
| Phillips 66 | 3.56 | |
| TransCanada Corp | 3.54 | |
| Antero Resources Corp | 3.49 |
This annual shareholder report contains important information about the Integrity Mid-North American Resources Fund.
Period covered: August 1, 2024 through July 31, 2025
(Based on a hypothetical $10,000 investment)
| Class Name | Cost of a $10,000 investment | Costs paid as a percentage of a $10,000 investment |
| Class C | $213 | 2.00% |
| How did the Fund perform last year? | ||
| • | For the 12 month period ended July 31, 2025, the Fund’s Class C shares returned 13.20%. | |
| • | In comparison, the S&P 1500 Energy Total Return Index (the "Benchmark") returned -3.84% for the same period. | |
| What affected the Fund’s performance? | ||
| • | The Federal Reserve (“the Fed”) reduced rates by 0.50% in September 2024, 0.25% in November 2024, and 0.25% in December 2024 to bring the Federal Funds Rate to 4.25-4.50%. | |
| • | U.S. stocks rose sharply over the period, despite having a correction in April 2025 due to tariff announcements. Performance was driven by optimism on artificial intelligence and on hopes that the Fed would cut rates in the latter half of 2025. | |
| • | Crude oil prices experienced elevated volatility over the period as geopolitical tensions were offset by an oversupplied market. Crude oil traded modestly lower for the period. | |
| • | Aiding relative performance versus the Benchmark over the period was an overweight allocation to utilities, independent power producer and midstream, as well as stock selection in exploration & production. | |
| • | Detracting from relative performance was an overweight allocation to oilfield service. | |
| Return of Capital Distribution | ||
| As of July 31, 2025 distributable earnings was increased and paid in capital was decreased in the amount of less than $0.005 per share due to distributions paid in excess of earnings for class C. | ||
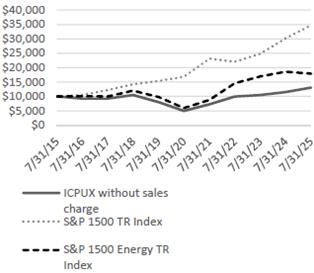
How did the Fund perform over the past 10 years?*
The chart below reflects a hypothetical $10,000 investment in the class of shares noted without sales charges. There is a 1% contingent deferred sales charge on any Class C shares you sell within 12 months of purchase. This would not apply to the chart below as the investment is held for over 12 months.
CUMULATIVE PERFORMANCE
AVERAGE ANNUAL TOTAL RETURN (%)
For the Periods Ended July 31, 2025
| 1 Year | 5 Years | 10 Years | |
| Class C without sales charge | 13.20 | 21.19 | 2.70 |
| Class C with sales charge | 12.20 | 21.19 | 2.70 |
S&P 1500 TR Index | 15.03 | 15.60 | 13.27 |
| S&P 1500 Energy TR Index | -3.84 | 24.47 | 6.01 |
What are some key Fund statistics?
(as of July 31, 2025)
| Total Net Assets (Millions) | $135 |
| Number of Holdings | 48 |
| Net Advisory Fee Paid | $611K |
| Annual Portfolio Turnover | 63% |
What did the Fund invest in?
(as of July 31, 2025)
| Sectors | % Net Assets | ||
| Energy | 66.8 | ||
| Utilities | 13.5 | ||
| Industrials | 12.3 | ||
| Information Technologies | 3.0 | ||
| Cash Equivalents and Other | 2.2 | ||
| Consumer Discretionary | 2.2 |
| Top 10 Holdings | % Net Assets | |
| Cheniere Energy Inc | 5.06 | |
| Exxon Mobil Corp | 4.54 | |
| Baker Hughes a GE Co | 4.40 | |
| Permian Resources Corp | 4.08 | |
| Entergy Corp | 4.01 | |
| Vertiv Holdings Co | 3.77 | |
| Vistra Corp | 3.70 | |
| Phillips 66 | 3.56 | |
| TransCanada Corp | 3.54 | |
| Antero Resources Corp | 3.49 |
This annual shareholder report contains important information about the Integrity Mid-North American Resources Fund.
Period covered: August 1, 2024 through July 31, 2025
(Based on a hypothetical $10,000 investment)
| Class Name | Cost of a $10,000 investment | Costs paid as a percentage of a $10,000 investment |
| Class I | $107 | 1.00% |
| How did the Fund perform last year? | ||
| • | For the 12 month period ended July 31, 2025, the Fund’s Class I shares returned 14.42%. | |
| • | In comparison, the S&P 1500 Energy Total Return Index (the "Benchmark") returned -3.84% for the same period. | |
| What affected the Fund’s performance? | ||
| • | The Federal Reserve (“the Fed”) reduced rates by 0.50% in September 2024, 0.25% in November 2024, and 0.25% in December 2024 to bring the Federal Funds Rate to 4.25-4.50%. | |
| • | U.S. stocks rose sharply over the period, despite having a correction in April 2025 due to tariff announcements. Performance was driven by optimism on artificial intelligence and on hopes that the Fed would cut rates in the latter half of 2025. | |
| • | Crude oil prices experienced elevated volatility over the period as geopolitical tensions were offset by an oversupplied market. Crude oil traded modestly lower for the period. | |
| • | Aiding relative performance versus the Benchmark over the period was an overweight allocation to utilities, independent power producer and midstream, as well as stock selection in exploration & production. | |
| • | Detracting from relative performance was an overweight allocation to oilfield service. | |
| Return of Capital Distribution | ||
| As of July 31, 2025 distributable earnings was increased and paid in capital was decreased in the amount of $0.01 per share due to distributions paid in excess of earnings for class I. | ||
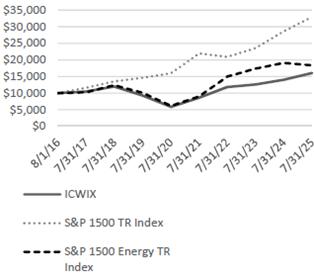
How did the Fund perform since inception?*
The chart below reflects a hypothetical $10,000 investment in the class of shares noted.
CUMULATIVE PERFORMANCE
AVERAGE ANNUAL TOTAL RETURN (%)
For the Periods Ended July 31, 2025
| 1 Year | 5 Years | Inception^ | |
| Class I | 14.42 | 22.44 | 5.37 |
S&P 1500 TR Index | 15.03 | 15.60 | 14.17 |
| S&P 1500 Energy TR Index | -3.84 | 24.47 | 6.99 |
| ^Inception Date of 8/1/2016 | |||
What are some key Fund statistics?
(as of July 31, 2025)
| Total Net Assets (Millions) | $135 |
| Number of Holdings | 48 |
| Net Advisory Fee Paid | $611K |
| Annual Portfolio Turnover | 63% |
What did the Fund invest in?
(as of July 31, 2025)
| Sectors | % Net Assets | ||
| Energy | 66.8 | ||
| Utilities | 13.5 | ||
| Industrials | 12.3 | ||
| Information Technologies | 3.0 | ||
| Cash Equivalents and Other | 2.2 | ||
| Consumer Discretionary | 2.2 |
| Top 10 Holdings | % Net Assets | |
| Cheniere Energy Inc | 5.06 | |
| Exxon Mobil Corp | 4.54 | |
| Baker Hughes a GE Co | 4.40 | |
| Permian Resources Corp | 4.08 | |
| Entergy Corp | 4.01 | |
| Vertiv Holdings Co | 3.77 | |
| Vistra Corp | 3.70 | |
| Phillips 66 | 3.56 | |
| TransCanada Corp | 3.54 | |
| Antero Resources Corp | 3.49 |
This annual shareholder report contains important information about the Integrity Short Term Government Fund.
Period covered: August 1, 2024 through July 31, 2025
(Based on a hypothetical $10,000 investment)
| Class Name | Cost of a $10,000 investment | Costs paid as a percentage of a $10,000 investment |
| Class A | $83 | 0.80% |
| How did the Fund perform last year? | ||
| • | For the 12 month period ended July 31, 2025, the Fund’s Class A shares returned 6.55%. | |
| • | In comparison, the ICE BofA 1-3 Year US Treasury Index (the "Benchmark") returned 4.43% for the same period. | |
| What affected the Fund’s performance? | ||
| • | Fixed income sectors in general benefited from the regime change in the Federal Reserve ("the Fed") policy, as the Federal Open Market Committee reduced the fed funds rates by 1% to 4.375%. The Treasury yield curve steepened significantly with short and intermediate-maturity Treasury yields declining given market uncertainty over the economic drag from trade policy under the new administration, while debt sustainability concerns raised longer maturity Treasury yields. As a result, the Fund’s short duration contributed to the outperformance. In addition, the portfolio’s weighting in certain Ginnie Mae mortgage-backed securities sectors and security selection further contributed to performance. | |
| • | The spread of agency mortgage-backed securities over Treasuries tightened moderately during the 12 month period. A higher overall yield relative to that of the pre-COVID era also improved the income return of the Fund. In addition, steady cashflow patterns of short duration Agency mortgage-backed securities backed by seasoned loans with historically low mortgage rates contributed meaningfully to performance. Lastly, yield curve reshaping positively impacted returns as 2-year Treasury yields decreased by 30 basis points over the 12 month period, while the 10-year Treasury yields was higher by 34bps. | |
| • | The fund continues to be overweight in Agency mortgage-backed securities relative to Treasuries and, more specifically, Ginnie Mae Project Loan mortgage-backed securities. Also, the Fund has a moderately longer duration than the Benchmark which should be a benefit if short maturity Treasury yields decline. | |
| • | Income and positive price return contributed about two-thirds and one-third, respectively, of the total return over the 12 month period. The Fund yield also exceeded that of the Benchmark over the 12 month period. | |
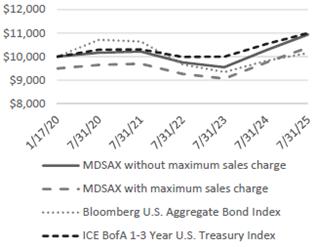
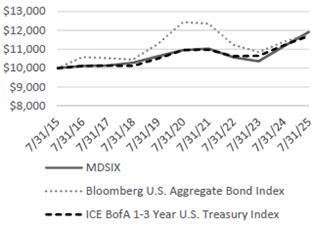
How did the Fund perform since inception?*
The chart below reflects a hypothetical $10,000 investment in the class of shares noted with and without sales charges.
CUMULATIVE PERFORMANCE
AVERAGE ANNUAL TOTAL RETURN (%)
For the Periods Ended July 31, 2025
| 1 Year | 5 Years | Inception^ | |
| Class A without sales charge | 6.55 | 1.48 | 1.64 |
| Class A with sales charge | 4.47 | 1.07 | 1.26 |
| Bloomberg U.S. Aggregate Bond Index | 3.38 | -1.07 | 0.28 |
| ICE BofA 1-3 Year U.S. Treasury Index | 4.43 | 1.34 | 1.74 |
| ^Inception Date of 1/17/2020 | |||
What are some key Fund statistics?
(as of July 31, 2025)
| Total Net Assets (Millions) | $32 |
| Number of Holdings | 166 |
| Net Advisory Fee Paid | $3K |
| Annual Portfolio Turnover | 113% |
What did the Fund invest in?
(as of July 31, 2025)
| Assets | % Net Assets | ||
| Mortgage Backed Securities | 95.9 | ||
| U.S. Government Notes/Bonds | 2.6 | ||
| Cash Equivalents and Other | 1.5 |
| Top 10 Holdings | % Net Assets | |
| United States Treasury 2-Year Note 4.6250% 06/30/2026 | 2.60 | |
| Ginnie Mae II Pool, 6.5000% 02/20/2055 | 2.03 | |
| Government National Mortgage Association, 1.20178% 08/16/2063 | 1.99 | |
| Freddie Mac Pool, 6.0000% 07/01/2053 | 1.62 | |
| Freddie Mac REMICS, 6.0000% 04/25/2050 | 1.59 | |
| Ginnie Mae II Pool, 7.0000% 02/20/2055 | 1.57 | |
| Fannie Mae Pool, 5.5000% 03/01/2053 | 1.46 | |
| Government National Mortgage Association, 0.97965% 12/16/2062 | 1.40 | |
| Freddie Mac Pool, 6.0000% 09/01/2053 | 1.40 | |
| Fannie Mae Pool, 6.0000% 12/01/2053 | 1.39 | |
This annual shareholder report contains important information about the Integrity Short Term Government Fund.
Period covered: August 1, 2024 through July 31, 2025
(Based on a hypothetical $10,000 investment)
| Class Name | Cost of a $10,000 investment | Costs paid as a percentage of a $10,000 investment |
| Class I | $57 | 0.55% |
| How did the Fund perform last year? | ||
| • | For the 12 month period ended July 31, 2025, the Fund’s Class I shares returned 6.81%. | |
| • | In comparison, the ICE BofA 1-3 Year US Treasury Index (the "Benchmark") returned 4.43% for the same period. | |
| What affected the Fund’s performance? | ||
| • | Fixed income sectors in general benefited from the regime change in the Federal Reserve ("the Fed") policy, as the Federal Open Market Committee reduced the fed funds rates by 1% to 4.375%. The Treasury yield curve steepened significantly with short and intermediate-maturity Treasury yields declining given market uncertainty over the economic drag from trade policy under the new administration, while debt sustainability concerns raised longer maturity Treasury yields. As a result, the Fund’s short duration contributed to the outperformance. In addition, the portfolio’s weighting in certain Ginnie Mae mortgage-backed securities sectors and security selection further contributed to performance. | |
| • | The spread of agency mortgage-backed securities over Treasuries tightened moderately during the 12 month period. A higher overall yield relative to that of the pre-COVID era also improved the income return of the Fund. In addition, steady cashflow patterns of short duration Agency mortgage-backed securities backed by seasoned loans with historically low mortgage rates contributed meaningfully to performance. Lastly, yield curve reshaping positively impacted returns as 2-year Treasury yields decreased by 30 basis points over the 12 month period, while the 10-year Treasury yields was higher by 34bps. | |
| • | The fund continues to be overweight in Agency mortgage-backed securities relative to Treasuries and, more specifically, Ginnie Mae Project Loan mortgage-backed securities. Also, the Fund has a moderately longer duration than the Benchmark which should be a benefit if short maturity Treasury yields decline. | |
| • | Income and positive price return contributed about two-thirds and one-third, respectively, of the total return over the 12 month period. The Fund yield also exceeded that of the Benchmark over the 12 month period. | |
How did the Fund perform over the past 10 years?*
The chart below reflects a hypothetical $10,000 investment in the class of shares noted.
CUMULATIVE PERFORMANCE
AVERAGE ANNUAL TOTAL RETURN (%)
For the Periods Ended July 31, 2025
| 1 Year | 5 Years | 10 Years | |
| Class I | 6.81 | 1.72 | 1.77 |
| Bloomberg U.S. Aggregate Bond Index | 3.38 | -1.07 | 1.66 |
| ICE BofA 1-3 Year U.S. Treasury Index | 4.43 | 1.34 | 1.60 |
What are some key Fund statistics?
(as of July 31, 2025)
| Total Net Assets (Millions) | $32 |
| Number of Holdings | 166 |
| Net Advisory Fee Paid | $3K |
| Annual Portfolio Turnover | 113% |
What did the Fund invest in?
(as of July 31, 2025)
| Assets | % Net Assets | ||
| Mortgage Backed Securities | 95.9 | ||
| U.S. Government Notes/Bonds | 2.6 | ||
| Cash Equivalents and Other | 1.5 |
| Top 10 Holdings | % Net Assets | |
| United States Treasury 2-Year Note 4.6250% 06/30/2026 | 2.60 | |
| Ginnie Mae II Pool, 6.5000% 02/20/2055 | 2.03 | |
| Government National Mortgage Association, 1.20178% 08/16/2063 | 1.99 | |
| Freddie Mac Pool, 6.0000% 07/01/2053 | 1.62 | |
| Freddie Mac REMICS, 6.0000% 04/25/2050 | 1.59 | |
| Ginnie Mae II Pool, 7.0000% 02/20/2055 | 1.57 | |
| Fannie Mae Pool, 5.5000% 03/01/2053 | 1.46 | |
| Government National Mortgage Association, 0.97965% 12/16/2062 | 1.40 | |
| Freddie Mac Pool, 6.0000% 09/01/2053 | 1.40 | |
| Fannie Mae Pool, 6.0000% 12/01/2053 | 1.39 | |
| [1] | The Fund’s past performance is not a good predictor of the Fund’s future performance. The graph and table do not reflect the deduction of taxes that a shareholder would pay on Fund distributions or redemptions of Fund shares. |
| [2] | The Fund’s past performance is not a good predictor of the Fund’s future performance. The graph and table do not reflect the deduction of taxes that a shareholder would pay on Fund distributions or redemptions of Fund shares. |
| [3] | The Fund’s past performance is not a good predictor of the Fund’s future performance. The graph and table do not reflect the deduction of taxes that a shareholder would pay on Fund distributions or redemptions of Fund shares. |
| [4] | The Fund’s past performance is not a good predictor of the Fund’s future performance. The graph and table do not reflect the deduction of taxes that a shareholder would pay on Fund distributions or redemptions of Fund shares. |
| [5] | The Fund’s past performance is not a good predictor of the Fund’s future performance. The graph and table do not reflect the deduction of taxes that a shareholder would pay on Fund distributions or redemptions of Fund shares. |
| [6] | The Fund’s past performance is not a good predictor of the Fund’s future performance. The graph and table do not reflect the deduction of taxes that a shareholder would pay on Fund distributions or redemptions of Fund shares. |
| [7] | The Fund’s past performance is not a good predictor of the Fund’s future performance. The graph and table do not reflect the deduction of taxes that a shareholder would pay on Fund distributions or redemptions of Fund shares. |
| [8] | The Fund’s past performance is not a good predictor of the Fund’s future performance. The graph and table do not reflect the deduction of taxes that a shareholder would pay on Fund distributions or redemptions of Fund shares. |
| [9] | The Fund’s past performance is not a good predictor of the Fund’s future performance. The graph and table do not reflect the deduction of taxes that a shareholder would pay on Fund distributions or redemptions of Fund shares. |
| [10] | The Fund’s past performance is not a good predictor of the Fund’s future performance. The graph and table do not reflect the deduction of taxes that a shareholder would pay on Fund distributions or redemptions of Fund shares. |
| [11] | The ratings agencies that provided the ratings are Standard & Poor’s and Moody’s. When ratings vary, the higher rating is used. Credit quality ratings are measured on a scale that generally ranges from AAA (highest) to D (lowest). “NR” is used to classify securities for which a rating is not available. Ratings apply to the holdings in the Fund portfolio and not to the Fund or its shares. Ratings are subject to change. |
| [12] | The Fund’s past performance is not a good predictor of the Fund’s future performance. The graph and table do not reflect the deduction of taxes that a shareholder would pay on Fund distributions or redemptions of Fund shares. |
| [13] | The ratings agencies that provided the ratings are Standard & Poor’s and Moody’s. When ratings vary, the higher rating is used. Credit quality ratings are measured on a scale that generally ranges from AAA (highest) to D (lowest). “NR” is used to classify securities for which a rating is not available. Ratings apply to the holdings in the Fund portfolio and not to the Fund or its shares. Ratings are subject to change. |
| [14] | The Fund’s past performance is not a good predictor of the Fund’s future performance. The graph and table do not reflect the deduction of taxes that a shareholder would pay on Fund distributions or redemptions of Fund shares. |
| [15] | The ratings agencies that provided the ratings are Standard & Poor’s and Moody’s. When ratings vary, the higher rating is used. Credit quality ratings are measured on a scale that generally ranges from AAA (highest) to D (lowest). “NR” is used to classify securities for which a rating is not available. Ratings apply to the holdings in the Fund portfolio and not to the Fund or its shares. Ratings are subject to change. |
| [16] | The Fund’s past performance is not a good predictor of the Fund’s future performance. The graph and table do not reflect the deduction of taxes that a shareholder would pay on Fund distributions or redemptions of Fund shares. |
| [17] | The Fund’s past performance is not a good predictor of the Fund’s future performance. The graph and table do not reflect the deduction of taxes that a shareholder would pay on Fund distributions or redemptions of Fund shares. |
| [18] | The Fund’s past performance is not a good predictor of the Fund’s future performance. The graph and table do not reflect the deduction of taxes that a shareholder would pay on Fund distributions or redemptions of Fund shares. |
| [19] | The Fund’s past performance is not a good predictor of the Fund’s future performance. The graph and table do not reflect the deduction of taxes that a shareholder would pay on Fund distributions or redemptions of Fund shares. |
| [20] | The Fund’s past performance is not a good predictor of the Fund’s future performance. The graph and table do not reflect the deduction of taxes that a shareholder would pay on Fund distributions or redemptions of Fund shares. |