| Smart Share Global Limited Private and Confidential The information contained herein is of a confidential nature and is intended for the exclusive use of the persons or firm to whom it is furnished by us. Reproduction, publication, or dissemination of portions hereof may not be made without prior approval of Kroll, LLC. Prepared by: Duff & Phelps Opinions Practice of Kroll August 1, 2025 Fairness Analysis Presented to the Special Committee of Independent Directors |
| 2 Duff & Phelps Disclaimer • The following pages contain materials that are being provided by Kroll, LLC (“Duff & Phelps”), operating through its Duff & Phelps Opinions Practice, to the special committee (the “Special Committee”) of the board of directors (the “Board of Directors”) (solely in their capacity as members of the Special Committee) of Smart Share Global Limited (the “Company”) in the context of a meeting of the Special Committee held to consider the Proposed Transaction (as defined herein). • The accompanying materials are, and any Opinion (as defined herein) will be, compiled and presented on a confidential basis, solely for the use and benefit of the Special Committee in connection with its evaluation of the Proposed Transaction and may not be, in whole or in part, distributed to any other party, publicly disclosed, or relied upon for any other purpose without the prior written consent of Duff & Phelps or as otherwise provided in the engagement letter among Duff & Phelps, the Company, and the Special Committee dated January 21, 2025. • Because these materials were prepared for use in the context of an oral presentation to the Special Committee, whose members are familiar with the business and affairs of the Company, neither Duff & Phelps nor any of its respective legal or financial advisors or accountants, take any responsibility for the accuracy or completeness of any of the accompanying materials if used by persons other than the Special Committee. • These materials are not intended to represent an Opinion and shall not be treated, construed, used or relied upon in any way as an Opinion. These materials are intended to serve as discussion materials for the Special Committee and as a summary of the basis upon which Duff & Phelps may render an Opinion, and are incomplete without reference to, and should be viewed solely in conjunction with, the discussion between Duff & Phelps and the Special Committee. • The accompanying material does not, and any Opinion provided by Duff & Phelps would not: (i) address the merits of the underlying business decision to enter into the Proposed Transaction versus any alternative strategy or transaction; (ii) constitute a recommendation as to how the Special Committee, the Board of Directors or any other person (including security holders of the Company) should vote or act with respect to any matters relating to the Proposed Transaction, or whether to proceed with the Proposed Transaction or any related transaction; or (iii) create any fiduciary duty on the part of Duff & Phelps to any party. • The information utilized in preparing this presentation was obtained from the Company and from public sources under the assumption that they are complete and accurate as of the date of provision. Duff & Phelps has relied on the information provided to it and has not independently verified the accuracy or completeness of such information. Any estimates, projections and forecasts contained herein have been prepared by or are based on discussions with the senior management of the Company and involve numerous and significant subjective determinations, which may or may not prove to be correct. No representation or warranty, express or implied, is made as to the accuracy or completeness of such information and nothing contained herein is, or shall be relied upon as, a representation or warranty, whether as to the past or the future. • No selected company or selected transaction used in our analysis is directly comparable to the Company or the Proposed Transaction. |
| Table of Contents 3 1. Introduction and Transaction Overview 2. Valuation Analysis Appendix: New Business Analysis |
| 1. Introduction and Transaction Overview |

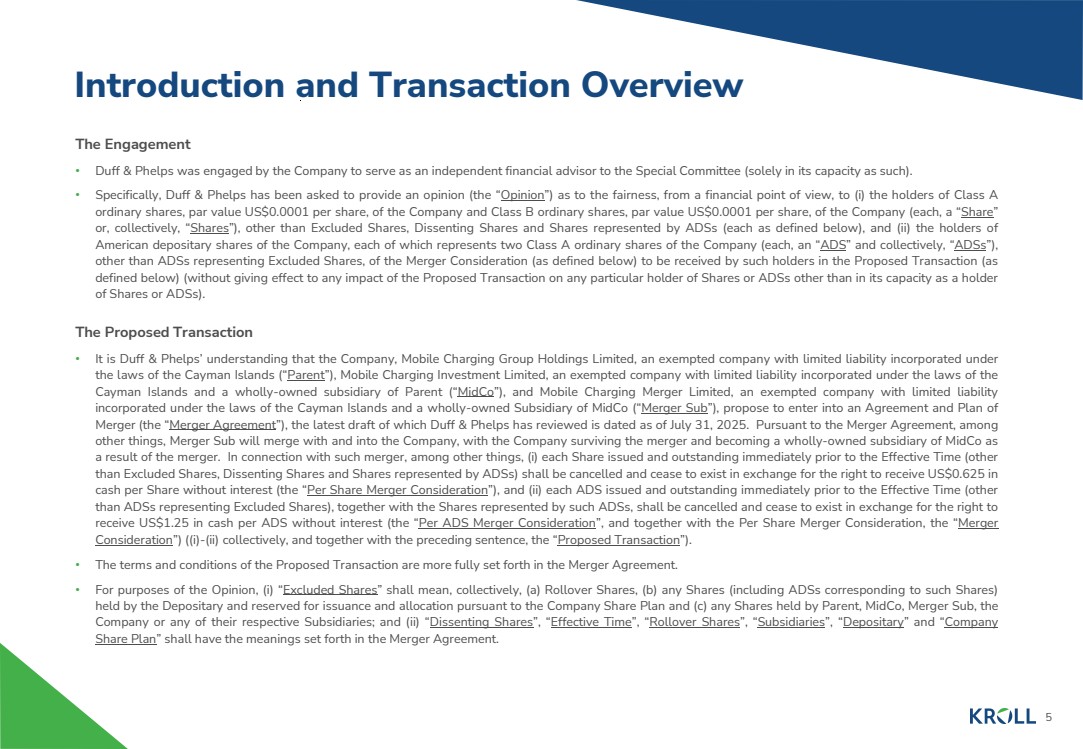
| 5 Introduction and Transaction Overview The Engagement • Duff & Phelps was engaged by the Company to serve as an independent financial advisor to the Special Committee (solely in its capacity as such). • Specifically, Duff & Phelps has been asked to provide an opinion (the “Opinion”) as to the fairness, from a financial point of view, to (i) the holders of Class A ordinary shares, par value US$0.0001 per share, of the Company and Class B ordinary shares, par value US$0.0001 per share, of the Company (each, a “Share” or, collectively, “Shares”), other than Excluded Shares, Dissenting Shares and Shares represented by ADSs (each as defined below), and (ii) the holders of American depositary shares of the Company, each of which represents two Class A ordinary shares of the Company (each, an “ADS” and collectively, “ADSs”), other than ADSs representing Excluded Shares, of the Merger Consideration (as defined below) to be received by such holders in the Proposed Transaction (as defined below) (without giving effect to any impact of the Proposed Transaction on any particular holder of Shares or ADSs other than in its capacity as a holder of Shares or ADSs). The Proposed Transaction • It is Duff & Phelps’ understanding that the Company, Mobile Charging Group Holdings Limited, an exempted company with limited liability incorporated under the laws of the Cayman Islands (“Parent”), Mobile Charging Investment Limited, an exempted company with limited liability incorporated under the laws of the Cayman Islands and a wholly-owned subsidiary of Parent (“MidCo”), and Mobile Charging Merger Limited, an exempted company with limited liability incorporated under the laws of the Cayman Islands and a wholly-owned Subsidiary of MidCo (“Merger Sub”), propose to enter into an Agreement and Plan of Merger (the “Merger Agreement”), the latest draft of which Duff & Phelps has reviewed is dated as of July 31, 2025. Pursuant to the Merger Agreement, among other things, Merger Sub will merge with and into the Company, with the Company surviving the merger and becoming a wholly-owned subsidiary of MidCo as a result of the merger. In connection with such merger, among other things, (i) each Share issued and outstanding immediately prior to the Effective Time (other than Excluded Shares, Dissenting Shares and Shares represented by ADSs) shall be cancelled and cease to exist in exchange for the right to receive US$0.625 in cash per Share without interest (the “Per Share Merger Consideration”), and (ii) each ADS issued and outstanding immediately prior to the Effective Time (other than ADSs representing Excluded Shares), together with the Shares represented by such ADSs, shall be cancelled and cease to exist in exchange for the right to receive US$1.25 in cash per ADS without interest (the “Per ADS Merger Consideration”, and together with the Per Share Merger Consideration, the “Merger Consideration”) ((i)-(ii) collectively, and together with the preceding sentence, the “Proposed Transaction”). • The terms and conditions of the Proposed Transaction are more fully set forth in the Merger Agreement. • For purposes of the Opinion, (i) “Excluded Shares” shall mean, collectively, (a) Rollover Shares, (b) any Shares (including ADSs corresponding to such Shares) held by the Depositary and reserved for issuance and allocation pursuant to the Company Share Plan and (c) any Shares held by Parent, MidCo, Merger Sub, the Company or any of their respective Subsidiaries; and (ii) “Dissenting Shares”, “Effective Time”, “Rollover Shares”, “Subsidiaries”, “Depositary” and “Company Share Plan” shall have the meanings set forth in the Merger Agreement. |
| 6 Scope of Analysis Introduction and Transaction Overview Duff & Phelps has made such reviews, analyses and inquiries as it has deemed necessary and appropriate under the circumstances. Duff & Phelps also took into account its assessment of general economic, market and financial conditions, as well as its experience in securities and business valuation, in general, and with respect to similar transactions, in particular. Duff & Phelps’ procedures, investigations, and financial analysis with respect to the preparation of its analysis included, but were not limited to, the items summarized below: • Reviewed the following documents: – The Company’s audited consolidated financial statements as at and for the years ended December 31, 2019 through December 31, 2024 included in the Company’s annual reports on Form 20-F filed with the Securities and Exchange Commission (“SEC”); – Certain unaudited and segment financial information for the Company as at and for the years ended December 31, 2020 through December 31, 2024, provided by the management of the Company; – A detailed consolidated financial projection model for the Company for the years ending December 31, 2025 through December 31, 2029, including segment financial information, prepared and provided to Duff & Phelps by the management of the Company, upon which Duff & Phelps has relied, with the Company’s and the Special Committee’s consent, in performing its analysis (the “Management Projections”); – Other internal documents relating to the history, current operations and probable future outlook of the Company, provided to Duff & Phelps by the management of the Company; – Letters dated July 26, 2025 from the management of the Company, which made certain representations as to historical financial statements, the Management Projections and the underlying assumptions of such projections (the “Management Representation Letters”); – A draft of the Merger Agreement dated July 31, 2025; and – A draft of the Support Agreement by and among Parent and certain shareholders of the Company listed in Schedule A thereto dated July 31, 2025. • Discussed the information referred to above and the background and other elements of the Proposed Transaction with the management of the Company; • Discussed with the management of the Company its plans and intentions with respect to the management and operation of the Company’s business; • Reviewed the historical trading price and trading volume of the ADSs and the publicly traded securities of certain other companies that Duff & Phelps deemed relevant; • Performed certain valuation and comparative analyses using generally accepted valuation and analytical techniques including a discounted cash flow analysis and an analysis of selected public companies that Duff & Phelps deemed relevant; and • Conducted such other analyses and considered such other factors as Duff & Phelps deemed appropriate. |
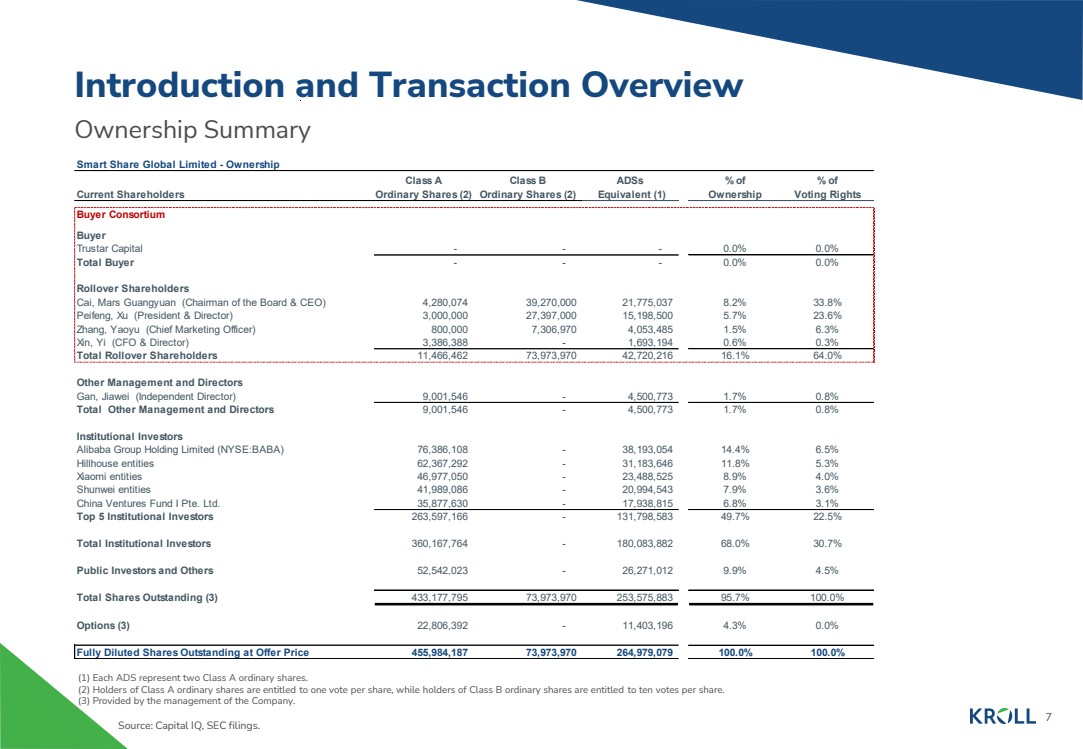
| 7 Ownership Summary Introduction and Transaction Overview (1) Each ADS represent two Class A ordinary shares. (2) Holders of Class A ordinary shares are entitled to one vote per share, while holders of Class B ordinary shares are entitled to ten votes per share. (3) Provided by the management of the Company. Source: Capital IQ, SEC filings. Smart Share Global Limited - Ownership Class A Class B ADSs % of % of Current Shareholders Ordinary Shares (2) Ordinary Shares (2) Equivalent (1) Ownership Voting Rights Buyer Consortium Buyer Trustar Capital - - - 0.0% 0.0% Total Buyer - - - 0.0% 0.0% Rollover Shareholders Cai, Mars Guangyuan (Chairman of the Board & CEO) 4,280,074 39,270,000 21,775,037 8.2% 33.8% Peifeng, Xu (President & Director) 3,000,000 27,397,000 15,198,500 5.7% 23.6% Zhang, Yaoyu (Chief Marketing Officer) 800,000 7,306,970 4,053,485 1.5% 6.3% Xin, Yi (CFO & Director) 3,386,388 - 1,693,194 0.6% 0.3% Total Rollover Shareholders 11,466,462 73,973,970 42,720,216 16.1% 64.0% Other Management and Directors Gan, Jiawei (Independent Director) 9,001,546 - 4,500,773 1.7% 0.8% Total Other Management and Directors 9,001,546 - 4,500,773 1.7% 0.8% Institutional Investors Alibaba Group Holding Limited (NYSE:BABA) 76,386,108 - 38,193,054 14.4% 6.5% Hillhouse entities 62,367,292 - 31,183,646 11.8% 5.3% Xiaomi entities 46,977,050 - 23,488,525 8.9% 4.0% Shunwei entities 41,989,086 - 20,994,543 7.9% 3.6% China Ventures Fund I Pte. Ltd. 35,877,630 - 17,938,815 6.8% 3.1% Top 5 Institutional Investors 263,597,166 - 131,798,583 49.7% 22.5% Total Institutional Investors 360,167,764 - 180,083,882 68.0% 30.7% Public Investors and Others 52,542,023 - 26,271,012 9.9% 4.5% Total Shares Outstanding (3) 433,177,795 73,973,970 253,575,883 95.7% 100.0% Options (3) 22,806,392 - 11,403,196 4.3% 0.0% Fully Diluted Shares Outstanding at Offer Price 455,984,187 73,973,970 264,979,079 100.0% 100.0% |
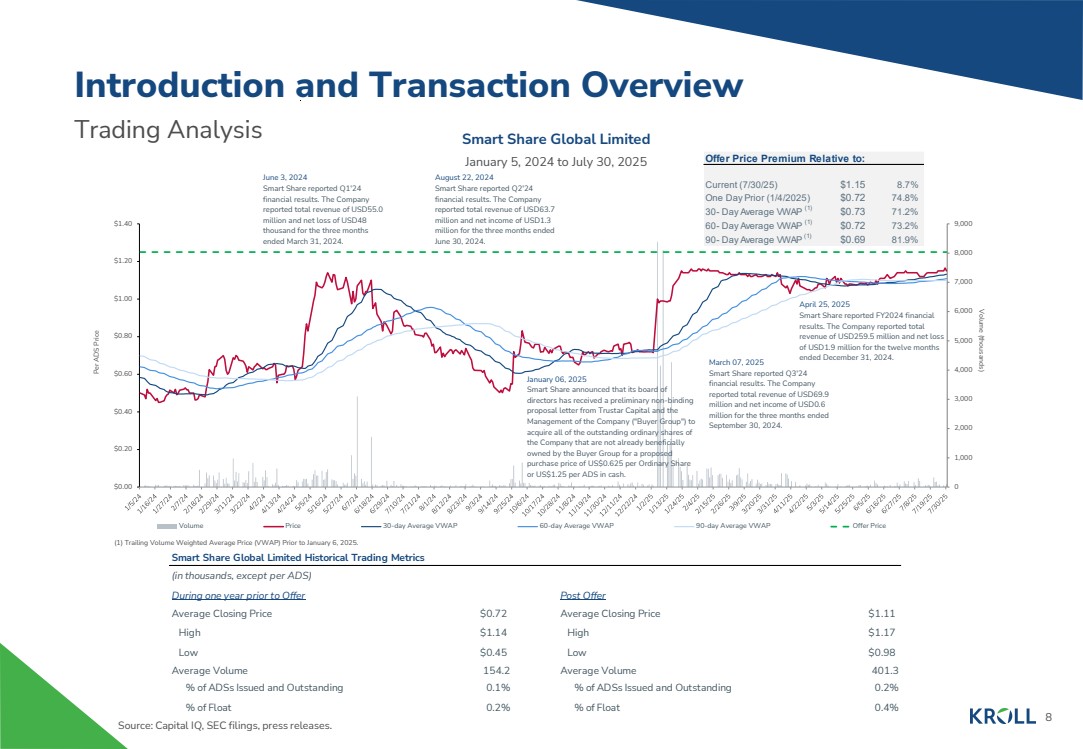
| 8 Trading Analysis Introduction and Transaction Overview Source: Capital IQ, SEC filings, press releases. Smart Share Global Limited January 5, 2024 to July 30, 2025 0 1,000 2,000 3,000 4,000 5,000 6,000 7,000 8,000 9,000 $0.00 $0.20 $0.40 $0.60 $0.80 $1.00 $1.20 $1.40 Volume (thousands) Per ADS Price Volume Price 30-day Average VWAP 60-day Average VWAP 90-day Average VWAP Offer Price (1) Trailing Volume Weighted Average Price (VWAP) Prior to January 6, 2025. April 25, 2025 Smart Share reported FY2024 financial results. The Company reported total revenue of USD259.5 million and net loss of USD1.9 million for the twelve months ended December 31, 2024. March 07, 2025 Smart Share reported Q3'24 financial results. The Company reported total revenue of USD69.9 million and net income of USD0.6 million for the three months ended September 30, 2024. August 22, 2024 Smart Share reported Q2'24 financial results. The Company reported total revenue of USD63.7 million and net income of USD1.3 million for the three months ended June 30, 2024. June 3, 2024 Smart Share reported Q1'24 financial results. The Company reported total revenue of USD55.0 million and net loss of USD48 thousand for the three months ended March 31, 2024. January 06, 2025 Smart Share announced that its board of directors has received a preliminary non-binding proposal letter from Trustar Capital and the Management of the Company ("Buyer Group") to acquire all of the outstanding ordinary shares of the Company that are not already beneficially owned by the Buyer Group for a proposed purchase price of US$0.625 per Ordinary Share or US$1.25 per ADS in cash. Offer Price Premium Relative to: Current (7/30/25) $1.15 8.7% One Day Prior (1/4/2025) $0.72 74.8% 30- Day Average VWAP (1) $0.73 71.2% 60- Day Average VWAP (1) $0.72 73.2% 90- Day Average VWAP (1) $0.69 81.9% Smart Share Global Limited Historical Trading Metrics (in thousands, except per ADS) During one year prior to Offer Post Offer Average Closing Price $0.72 Average Closing Price $1.11 High $1.14 High $1.17 Low $0.45 Low $0.98 Average Volume 154.2 Average Volume 401.3 % of ADSs Issued and Outstanding 0.1% % of ADSs Issued and Outstanding 0.2% % of Float 0.2% % of Float 0.4% |
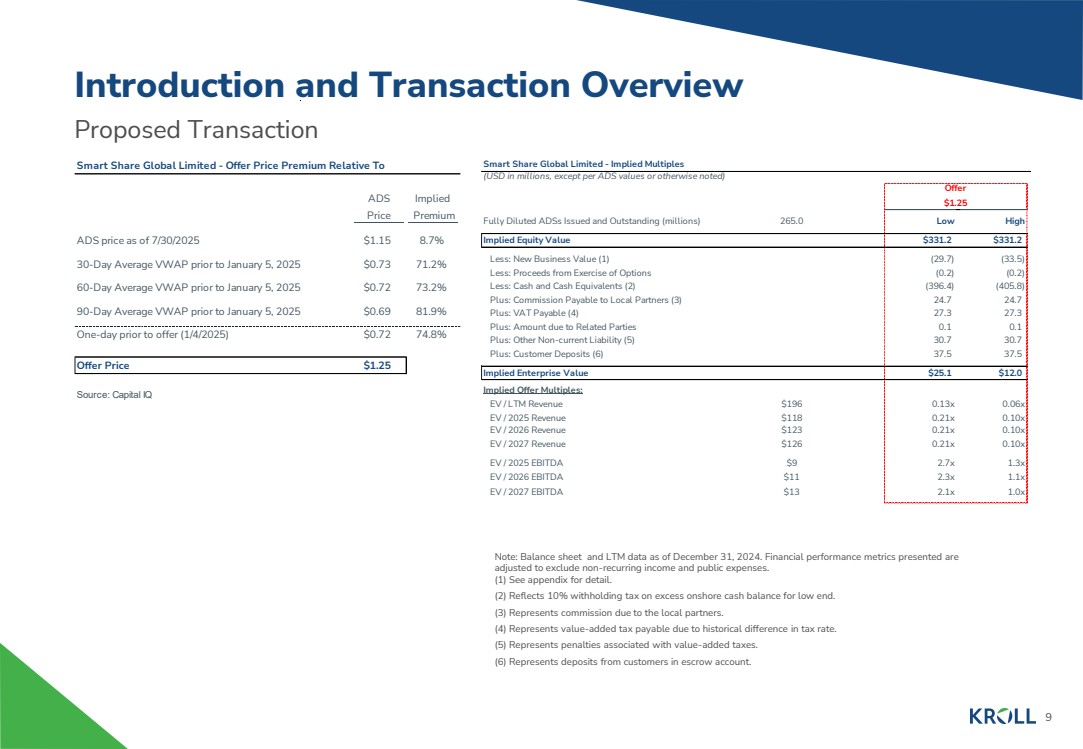
| 9 Proposed Transaction Introduction and Transaction Overview Note: Balance sheet and LTM data as of December 31, 2024. Financial performance metrics presented are adjusted to exclude non-recurring income and public expenses. (1) See appendix for detail. (2) Reflects 10% withholding tax on excess onshore cash balance for low end. (3) Represents commission due to the local partners. (4) Represents value-added tax payable due to historical difference in tax rate. (5) Represents penalties associated with value-added taxes. (6) Represents deposits from customers in escrow account. Smart Share Global Limited - Offer Price Premium Relative To ADS Implied Price Premium ADS price as of 7/30/2025 $1.15 8.7% 30-Day Average VWAP prior to January 5, 2025 $0.73 71.2% 60-Day Average VWAP prior to January 5, 2025 $0.72 73.2% 90-Day Average VWAP prior to January 5, 2025 $0.69 81.9% One-day prior to offer (1/4/2025) $0.72 74.8% Offer Price $1.25 Source: Capital IQ Smart Share Global Limited - Implied Multiples (USD in millions, except per ADS values or otherwise noted) Offer $1.25 Fully Diluted ADSs Issued and Outstanding (millions) 265.0 Low High 1.00 Implied Equity Value $331.2 $331.2 Less: New Business Value (1) (214.00) (241.00) (29.7) (33.5) Less: Proceeds from Exercise of Options (1.64) (1.64) (0.2) (0.2) Less: Cash and Cash Equivalents (2) (2,851.87) (2,919.35) (396.4) (405.8) Plus: Commission Payable to Local Partners (3) 177.60 177.60 24.7 24.7 Plus: VAT Payable (4) 196.25 196.25 27.3 27.3 Plus: Amount due to Related Parties 1.00 1.00 0.1 0.1 Plus: Other Non-current Liability (5) 220.59 220.59 30.7 30.7 Plus: Customer Deposits (6) 270.02 270.02 37.5 37.5 Implied Enterprise Value $25.1 $12.0 Implied Offer Multiples: EV / LTM Revenue $196 0.13x 0.06x EV / 2025 Revenue $118 0.21x 0.10x EV / 2026 Revenue $123 0.21x 0.10x EV / 2027 Revenue $126 0.21x 0.10x EV / 2025 EBITDA $9 2.7x 1.3x EV / 2026 EBITDA $11 2.3x 1.1x EV / 2027 EBITDA $13 2.1x 1.0x |
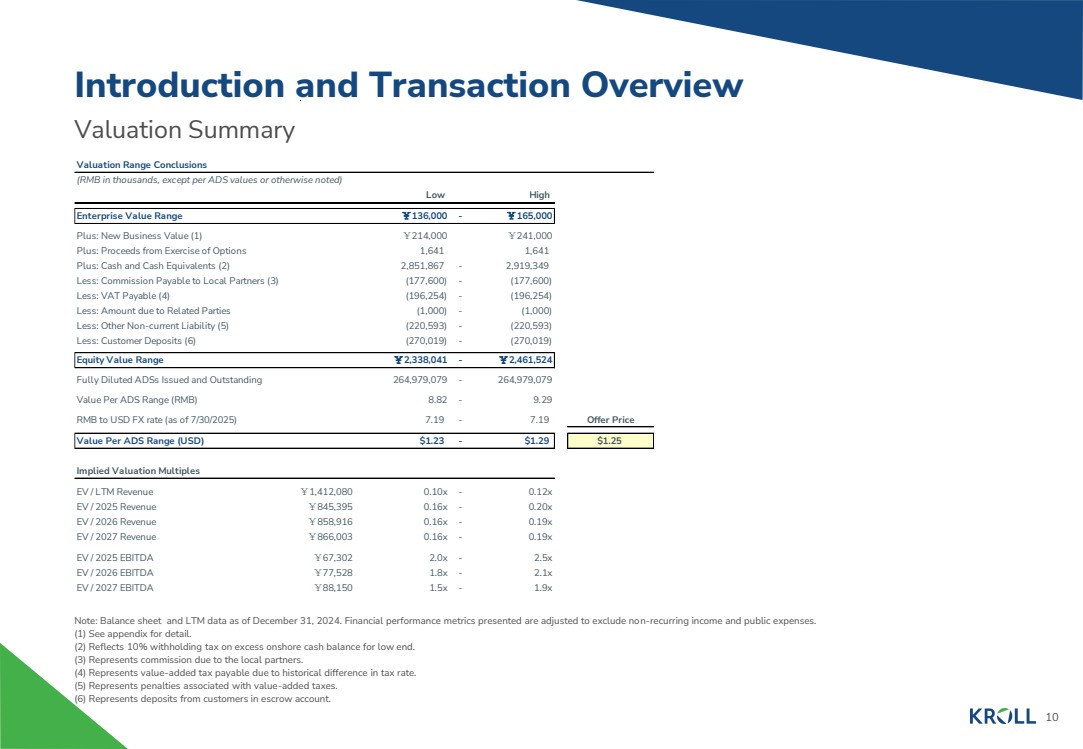
| 10 Valuation Summary Introduction and Transaction Overview Note: Balance sheet and LTM data as of December 31, 2024. Financial performance metrics presented are adjusted to exclude non-recurring income and public expenses. (1) See appendix for detail. (2) Reflects 10% withholding tax on excess onshore cash balance for low end. (3) Represents commission due to the local partners. (4) Represents value-added tax payable due to historical difference in tax rate. (5) Represents penalties associated with value-added taxes. (6) Represents deposits from customers in escrow account. Valuation Range Conclusions (RMB in thousands, except per ADS values or otherwise noted) Low High Per ADS Basis Enterprise Value Range ¥136,000 - ¥165,000 Plus: New Business Value (1) ¥214,000 ¥241,000 Plus: Proceeds from Exercise of Options 1,641 1,641 Plus: Cash and Cash Equivalents (2) 2,851,867 - 2,919,349 Less: Commission Payable to Local Partners (3) (177,600) - (177,600) Less: VAT Payable (4) (196,254) - (196,254) Less: Amount due to Related Parties (1,000) - (1,000) Less: Other Non-current Liability (5) (220,593) - (220,593) Less: Customer Deposits (6) (270,019) - (270,019) Equity Value Range ¥2,338,041 - ¥2,461,524 Fully Diluted ADSs Issued and Outstanding 264,979,079 - 264,979,079 Value Per ADS Range (RMB) 8.82 - 9.29 RMB to USD FX rate (as of 7/30/2025) 7.19 - 7.19 Offer Price Value Per ADS Range (USD) $1.23 - $1.29 $1.25 Implied Valuation Multiples EV / LTM Revenue ¥1,412,080 0.10x - 0.12x 0.09x EV / 2025 Revenue ¥845,395 0.16x - 0.20x 0.16x EV / 2026 Revenue ¥858,916 0.16x - 0.19x 0.16x EV / 2027 Revenue ¥866,003 0.16x - 0.19x 0.15x EV / 2025 EBITDA ¥67,302 2.0x - 2.5x 1.99x EV / 2026 EBITDA ¥77,528 1.8x - 2.1x 1.72x EV / 2027 EBITDA ¥88,150 1.5x - 1.9x 1.52x |
| 2. Valuation Analysis |
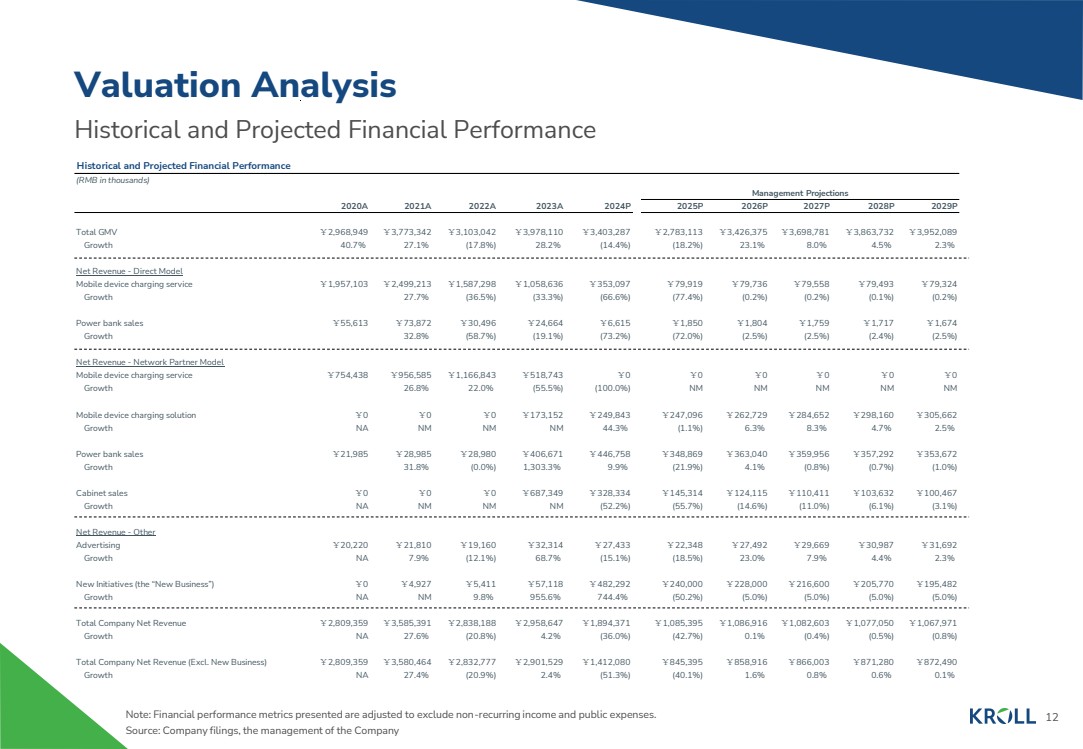
| 12 Historical and Projected Financial Performance Valuation Analysis Note: Financial performance metrics presented are adjusted to exclude non-recurring income and public expenses. Source: Company filings, the management of the Company Historical and Projected Financial Performance (RMB in thousands) Management Projections 2020A 2021A 2022A 2023A 2024P 2025P 2026P 2027P 2028P 2029P Total GMV ¥2,968,949 ¥3,773,342 ¥3,103,042 ¥3,978,110 ¥3,403,287 ¥2,783,113 ¥3,426,375 ¥3,698,781 ¥3,863,732 ¥3,952,089 Growth 40.7% 27.1% (17.8%) 28.2% (14.4%) (18.2%) 23.1% 8.0% 4.5% 2.3% Net Revenue - Direct Model Mobile device charging service ¥1,957,103 ¥2,499,213 ¥1,587,298 ¥1,058,636 ¥353,097 ¥79,919 ¥79,736 ¥79,558 ¥79,493 ¥79,324 Growth 27.7% (36.5%) (33.3%) (66.6%) (77.4%) (0.2%) (0.2%) (0.1%) (0.2%) Power bank sales ¥55,613 ¥73,872 ¥30,496 ¥24,664 ¥6,615 ¥1,850 ¥1,804 ¥1,759 ¥1,717 ¥1,674 Growth 32.8% (58.7%) (19.1%) (73.2%) (72.0%) (2.5%) (2.5%) (2.4%) (2.5%) Net Revenue - Network Partner Model Mobile device charging service ¥754,438 ¥956,585 ¥1,166,843 ¥518,743 ¥0 ¥0 ¥0 ¥0 ¥0 ¥0 Growth 26.8% 22.0% (55.5%) (100.0%) N M N M N M N M N M Mobile device charging solution ¥0 ¥0 ¥0 ¥173,152 ¥249,843 ¥247,096 ¥262,729 ¥284,652 ¥298,160 ¥305,662 Growth N A N M N M N M 44.3% (1.1%) 6.3% 8.3% 4.7% 2.5% Power bank sales ¥21,985 ¥28,985 ¥28,980 ¥406,671 ¥446,758 ¥348,869 ¥363,040 ¥359,956 ¥357,292 ¥353,672 Growth 31.8% (0.0%) 1,303.3% 9.9% (21.9%) 4.1% (0.8%) (0.7%) (1.0%) Cabinet sales ¥0 ¥0 ¥0 ¥687,349 ¥328,334 ¥145,314 ¥124,115 ¥110,411 ¥103,632 ¥100,467 Growth N A N M N M N M (52.2%) (55.7%) (14.6%) (11.0%) (6.1%) (3.1%) Net Revenue - Other Advertising ¥20,220 ¥21,810 ¥19,160 ¥32,314 ¥27,433 ¥22,348 ¥27,492 ¥29,669 ¥30,987 ¥31,692 Growth N A 7.9% (12.1%) 68.7% (15.1%) (18.5%) 23.0% 7.9% 4.4% 2.3% New Initiatives (the “New Business”) ¥0 ¥4,927 ¥5,411 ¥57,118 ¥482,292 ¥240,000 ¥228,000 ¥216,600 ¥205,770 ¥195,482 Growth N A N M 9.8% 955.6% 744.4% (50.2%) (5.0%) (5.0%) (5.0%) (5.0%) Total Company Net Revenue ¥2,809,359 ¥3,585,391 ¥2,838,188 ¥2,958,647 ¥1,894,371 ¥1,085,395 ¥1,086,916 ¥1,082,603 ¥1,077,050 ¥1,067,971 Growth N A 27.6% (20.8%) 4.2% (36.0%) (42.7%) 0.1% (0.4%) (0.5%) (0.8%) Total Company Net Revenue (Excl. New Business) ¥2,809,359 ¥3,580,464 ¥2,832,777 ¥2,901,529 ¥1,412,080 ¥845,395 ¥858,916 ¥866,003 ¥871,280 ¥872,490 Growth N A 27.4% (20.9%) 2.4% (51.3%) (40.1%) 1.6% 0.8% 0.6% 0.1% |
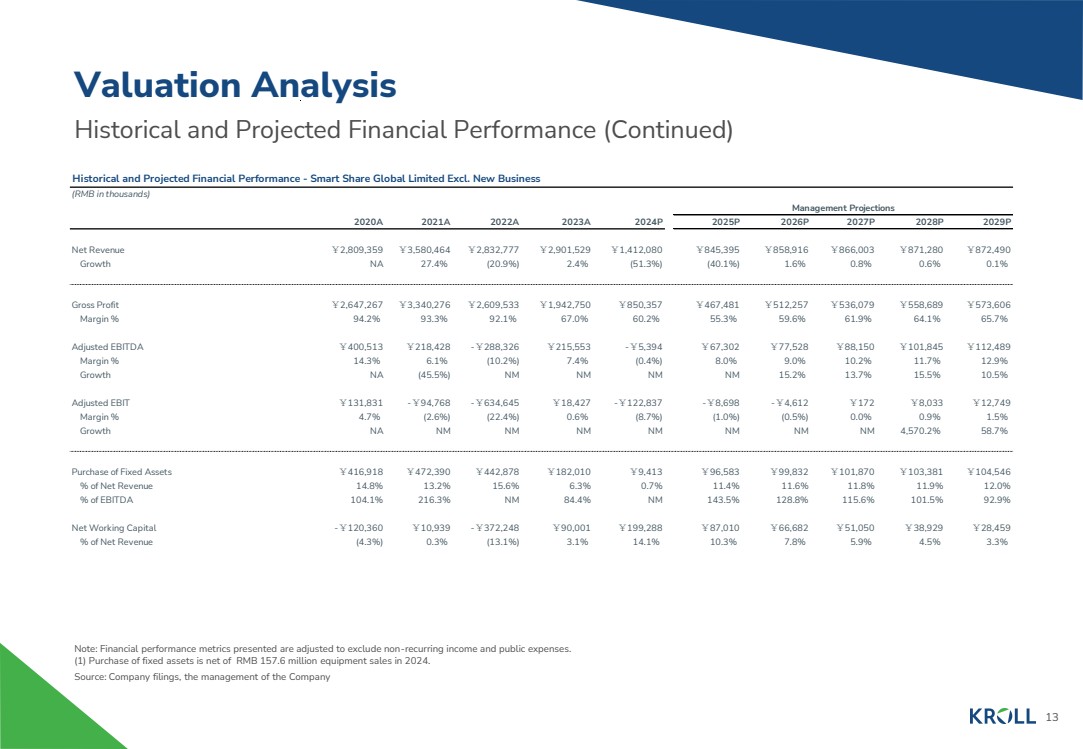
| 13 Historical and Projected Financial Performance (Continued) Valuation Analysis Note: Financial performance metrics presented are adjusted to exclude non-recurring income and public expenses. (1) Purchase of fixed assets is net of RMB 157.6 million equipment sales in 2024. Source: Company filings, the management of the Company Historical and Projected Financial Performance - Smart Share Global Limited Excl. New Business (RMB in thousands) Management Projections 2020A 2021A 2022A 2023A 2024P 2025P 2026P 2027P 2028P 2029P Net Revenue ¥2,809,359 ¥3,580,464 ¥2,832,777 ¥2,901,529 ¥1,412,080 ¥845,395 ¥858,916 ¥866,003 ¥871,280 ¥872,490 Growth N A 27.4% (20.9%) 2.4% (51.3%) (40.1%) 1.6% 0.8% 0.6% 0.1% Gross Profit ¥2,647,267 ¥3,340,276 ¥2,609,533 ¥1,942,750 ¥850,357 ¥467,481 ¥512,257 ¥536,079 ¥558,689 ¥573,606 Margin % 94.2% 93.3% 92.1% 67.0% 60.2% 55.3% 59.6% 61.9% 64.1% 65.7% Adjusted EBITDA ¥400,513 ¥218,428 -¥288,326 ¥215,553 -¥5,394 ¥67,302 ¥77,528 ¥88,150 ¥101,845 ¥112,489 Margin % 14.3% 6.1% (10.2%) 7.4% (0.4%) 8.0% 9.0% 10.2% 11.7% 12.9% Growth N A (45.5%) N M N M N M N M 15.2% 13.7% 15.5% 10.5% Adjusted EBIT ¥131,831 -¥94,768 -¥634,645 ¥18,427 -¥122,837 -¥8,698 -¥4,612 ¥172 ¥8,033 ¥12,749 Margin % 4.7% (2.6%) (22.4%) 0.6% (8.7%) (1.0%) (0.5%) 0.0% 0.9% 1.5% Growth N A N M N M N M N M N M N M N M 4,570.2% 58.7% Purchase of Fixed Assets ¥416,918 ¥472,390 ¥442,878 ¥182,010 ¥9,413 ¥96,583 ¥99,832 ¥101,870 ¥103,381 ¥104,546 % of Net Revenue 14.8% 13.2% 15.6% 6.3% 0.7% 11.4% 11.6% 11.8% 11.9% 12.0% % of EBITDA 104.1% 216.3% N M 84.4% N M 143.5% 128.8% 115.6% 101.5% 92.9% Net Working Capital -¥120,360 ¥10,939 -¥372,248 ¥90,001 ¥199,288 ¥87,010 ¥66,682 ¥51,050 ¥38,929 ¥28,459 % of Net Revenue (4.3%) 0.3% (13.1%) 3.1% 14.1% 10.3% 7.8% 5.9% 4.5% 3.3% |
| 14 Discounted Cash Flow Analysis Methodology and Key Assumptions Valuation Analysis Discounted Cash Flow Methodology • Duff & Phelps performed a discounted cash flow analysis of the projected unlevered free cash flows. • Unlevered free cash flow is defined as cash generated by the business that is available to either reinvest or to distribute to security holders. • Projected free cash flows are discounted to the present using a discount rate which reflects their relative risk. • The discount rate is equivalent to the rate of return that security holders could expect to realize on alternative investment opportunities with similar risk profiles. Discounted Cash Flow Key Assumptions • Duff & Phelps utilized and relied upon the Management Projections for the years ending December 31, 2025 through December 31, 2029, discussions with the Company, and a review of the Company’s historical performance and other factors to develop the discounted cash flow (“DCF”) analysis. • The discounted cash flow analysis excludes cash flows related to the “New Initiatives” in the Management Projections, comprising the Company’s photovoltaic EPC service business (the “New Business”). Duff & Phelps separately analyzed the New Business cash flows; see appendix for detail. • The following is a summary of the Management Projections utilized in the discounted cash flow analysis: – Net revenue increases at a compound annual growth rate (“CAGR”) of 0.8% from 2025 to 2030. – Adjusted EBITDA averages 10.3% of net revenue from 2025 to 2029. – Capital expenditures averages 11.7% of net revenue from 2025 to 2029. – Net working capital averages 6.3% of net revenue from 2025 to 2029. • Beyond the projection period, Duff & Phelps estimated the “terminal value” using a terminal EBIT multiple range of 6.0x to 8.0x. • Duff & Phelps discounted the resulting free cash flows and terminal value using a discount rate range of 16.25% to 18.25%. |
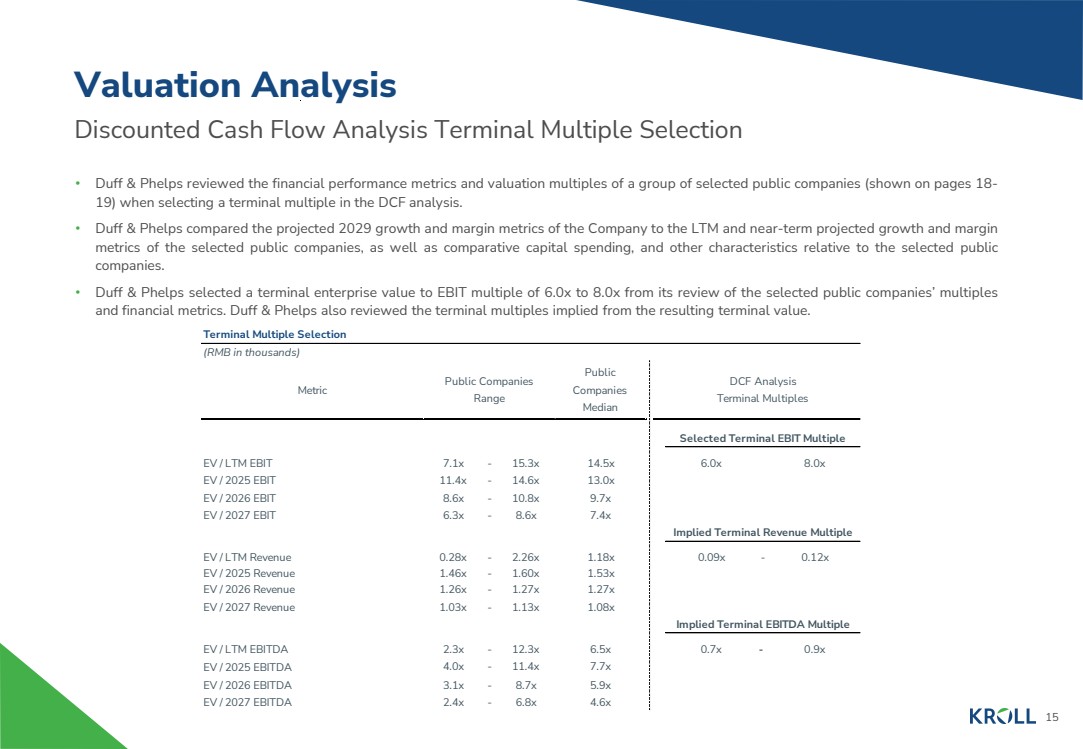
| 15 Discounted Cash Flow Analysis Terminal Multiple Selection Valuation Analysis • Duff & Phelps reviewed the financial performance metrics and valuation multiples of a group of selected public companies (shown on pages 18- 19) when selecting a terminal multiple in the DCF analysis. • Duff & Phelps compared the projected 2029 growth and margin metrics of the Company to the LTM and near-term projected growth and margin metrics of the selected public companies, as well as comparative capital spending, and other characteristics relative to the selected public companies. • Duff & Phelps selected a terminal enterprise value to EBIT multiple of 6.0x to 8.0x from its review of the selected public companies’ multiples and financial metrics. Duff & Phelps also reviewed the terminal multiples implied from the resulting terminal value. Terminal Multiple Selection (RMB in thousands) Metric Public Companies Median DCF Analysis Terminal Multiples Selected Terminal EBIT Multiple EV / LTM EBIT 7.1x - 15.3x 14.5x 6.0x 8.0x EV / 2025 EBIT 11.4x - 14.6x 13.0x EV / 2026 EBIT 8.6x - 10.8x 9.7x EV / 2027 EBIT 6.3x - 8.6x 7.4x Implied Terminal Revenue Multiple EV / LTM Revenue 0.28x - 2.26x 1.18x 0.09x - 0.12x EV / 2025 Revenue 1.46x - 1.60x 1.53x EV / 2026 Revenue 1.26x - 1.27x 1.27x EV / 2027 Revenue 1.03x - 1.13x 1.08x Implied Terminal EBITDA Multiple EV / LTM EBITDA 2.3x - 12.3x 6.5x 0.7x - 0.9x EV / 2025 EBITDA 4.0x - 11.4x 7.7x EV / 2026 EBITDA 3.1x - 8.7x 5.9x EV / 2027 EBITDA 2.4x - 6.8x 4.6x Public Companies Range |
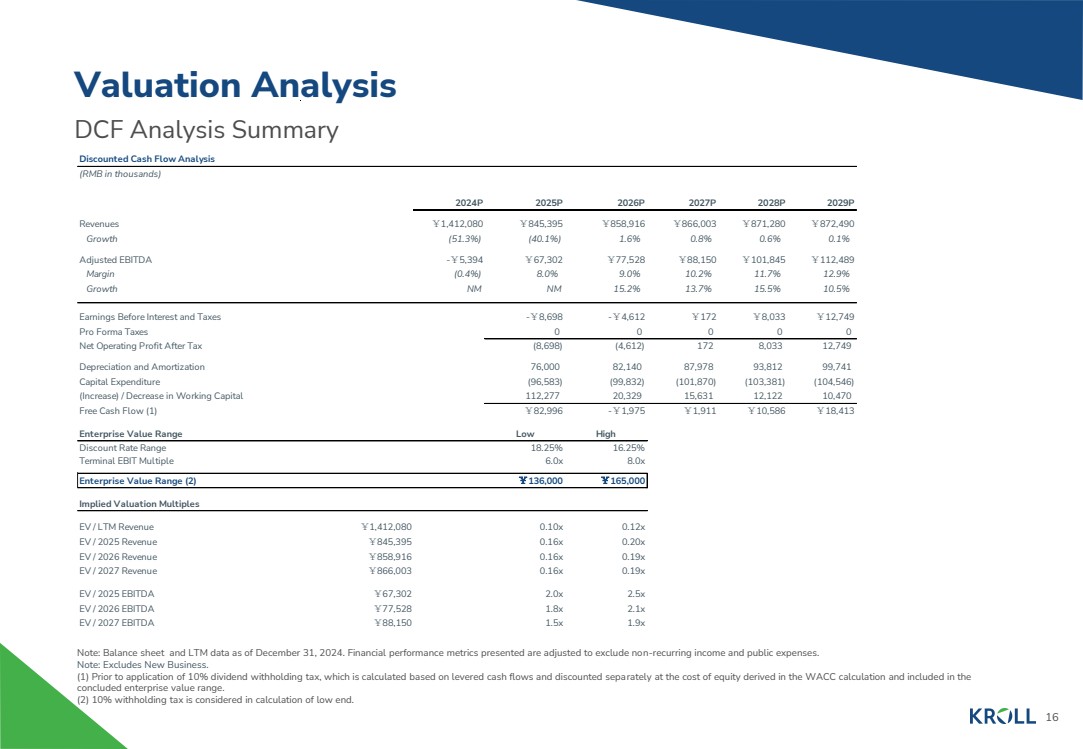
| 16 DCF Analysis Summary Valuation Analysis Note: Balance sheet and LTM data as of December 31, 2024. Financial performance metrics presented are adjusted to exclude non-recurring income and public expenses. Note: Excludes New Business. (1) Prior to application of 10% dividend withholding tax, which is calculated based on levered cash flows and discounted separately at the cost of equity derived in the WACC calculation and included in the concluded enterprise value range. (2) 10% withholding tax is considered in calculation of low end. Discounted Cash Flow Analysis (RMB in thousands) 2024P 2025P 2026P 2027P 2028P 2029P Revenues ¥1,412,080 ¥845,395 ¥858,916 ¥866,003 ¥871,280 ¥872,490 Growth (51.3%) (40.1%) 1.6% 0.8% 0.6% 0.1% Adjusted EBITDA -¥5,394 ¥67,302 ¥77,528 ¥88,150 ¥101,845 ¥112,489 Margin (0.4%) 8.0% 9.0% 10.2% 11.7% 12.9% Growth NM NM 15.2% 13.7% 15.5% 10.5% Earnings Before Interest and Taxes -¥8,698 -¥4,612 ¥172 ¥8,033 ¥12,749 Pro Forma Taxes 0 0 0 0 0 Net Operating Profit After Tax (8,698) (4,612) 172 8,033 12,749 Depreciation and Amortization 76,000 82,140 87,978 93,812 99,741 Capital Expenditure (96,583) (99,832) (101,870) (103,381) (104,546) (Increase) / Decrease in Working Capital 112,277 20,329 15,631 12,122 10,470 Free Cash Flow (1) ¥82,996 -¥1,975 ¥1,911 ¥10,586 ¥18,413 Enterprise Value Range Low High Discount Rate Range 18.25% 16.25% Terminal EBIT Multiple 6.0x 8.0x Enterprise Value Range (2) ¥136,000 ¥165,000 Implied Valuation Multiples EV / LTM Revenue ¥1,412,080 0.10x 0.12x EV / 2025 Revenue ¥845,395 0.16x 0.20x EV / 2026 Revenue ¥858,916 0.16x 0.19x EV / 2027 Revenue ¥866,003 0.16x 0.19x EV / 2025 EBITDA ¥67,302 2.0x 2.5x EV / 2026 EBITDA ¥77,528 1.8x 2.1x EV / 2027 EBITDA ¥88,150 1.5x 1.9x |
| 17 Selected Public Companies Analysis Methodology Selected Public Companies Analysis • Duff & Phelps selected six publicly traded companies that were deemed relevant to its analysis. • Duff & Phelps analyzed the financial performance of each of the publicly traded companies. Duff & Phelps then analyzed the selected public companies’ trading multiples, including enterprise value to LTM and projected EBITDA, EBIT and revenue. Due to the limited comparability of the financial metrics of the selected public companies relative to those of the Company, rather than applying a range of selected multiples from a review of the public companies, Duff & Phelps reviewed various valuation multiples for the Company implied by the valuation range determined from the DCF analysis in the context of the Company’s relative size, forecasted growth in revenue and profits, profit margins, capital spending, and other characteristics that we deemed relevant. Duff & Phelps also researched merger and acquisition transactions involving target companies similar to the Company; however, Duff & Phelps did not directly utilize the M&A transactions analysis due to the lack of recent transactions with target companies comparable to the Company. None of the companies utilized for comparative purposes in the following analysis are directly comparable to the Company. Duff & Phelps does not have access to non-public information of any of the companies used for comparative purposes. Accordingly, a complete valuation analysis of the Company and the Proposed Transaction cannot rely solely upon a quantitative review of the selected companies, and involves complex considerations and judgments concerning differences in financial and operating characteristics of such companies, as well as other factors that could affect their value relative to that of the Company. Therefore, the Selected Public Companies Analysis is subject to certain limitations. Valuation Analysis |
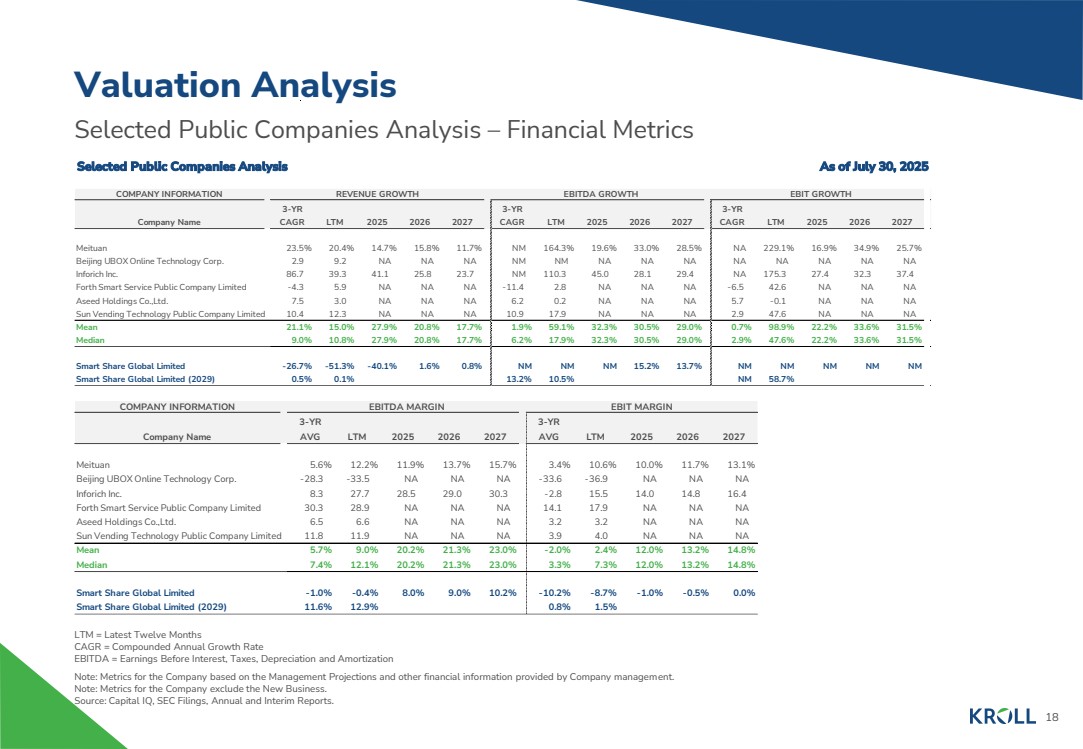
| 18 Selected Public Companies Analysis – Financial Metrics Valuation Analysis LTM = Latest Twelve Months CAGR = Compounded Annual Growth Rate EBITDA = Earnings Before Interest, Taxes, Depreciation and Amortization Note: Metrics for the Company based on the Management Projections and other financial information provided by Company management. Note: Metrics for the Company exclude the New Business. Source: Capital IQ, SEC Filings, Annual and Interim Reports. COMPANY INFORMATION EBITDA MARGIN EBIT MARGIN Company Name 3-YR AVG LTM 2025 2026 2027 3-YR AVG LTM 2025 2026 2027 Meituan 5.6% 12.2% 11.9% 13.7% 15.7% 3.4% 10.6% 10.0% 11.7% 13.1% Beijing UBOX Online Technology Corp. -28.3 -33.5 NA NA NA -33.6 -36.9 NA NA NA Inforich Inc. 8.3 27.7 28.5 29.0 30.3 -2.8 15.5 14.0 14.8 16.4 Forth Smart Service Public Company Limited 30.3 28.9 NA NA NA 14.1 17.9 NA NA NA Aseed Holdings Co.,Ltd. 6.5 6.6 NA NA NA 3.2 3.2 NA NA NA Sun Vending Technology Public Company Limited 11.8 11.9 NA NA NA 3.9 4.0 NA NA NA Mean 5.7% 9.0% 20.2% 21.3% 23.0% -2.0% 2.4% 12.0% 13.2% 14.8% Median 7.4% 12.1% 20.2% 21.3% 23.0% 3.3% 7.3% 12.0% 13.2% 14.8% Smart Share Global Limited -1.0% -0.4% 8.0% 9.0% 10.2% -10.2% -8.7% -1.0% -0.5% 0.0% Smart Share Global Limited (2029) 11.6% 12.9% 0.8% 1.5% Selected Public Companies Analysis As of July 30, 2025 COMPANY INFORMATION REVENUE GROWTH EBITDA GROWTH EBIT GROWTH EBITDA MARGIN Company Name 3-YR CAGR LTM 2025 2026 2027 3-YR CAGR LTM 2025 2026 2027 3-YR CAGR LTM 2025 2026 2027 Meituan 23.5% 20.4% 14.7% 15.8% 11.7% NM 164.3% 19.6% 33.0% 28.5% NA 229.1% 16.9% 34.9% 25.7% Beijing UBOX Online Technology Corp. 2.9 9.2 NA NA NA NM NM NA NA NA NA NA NA NA NA Inforich Inc. 86.7 39.3 41.1 25.8 23.7 NM 110.3 45.0 28.1 29.4 NA 175.3 27.4 32.3 37.4 Forth Smart Service Public Company Limited -4.3 5.9 NA NA NA -11.4 2.8 NA NA NA -6.5 42.6 NA NA NA Aseed Holdings Co.,Ltd. 7.5 3.0 NA NA NA 6.2 0.2 NA NA NA 5.7 -0.1 NA NA NA Sun Vending Technology Public Company Limited 10.4 12.3 NA NA NA 10.9 17.9 NA NA NA 2.9 47.6 NA NA NA Mean 21.1% 15.0% 27.9% 20.8% 17.7% 1.9% 59.1% 32.3% 30.5% 29.0% 0.7% 98.9% 22.2% 33.6% 31.5% Median 9.0% 10.8% 27.9% 20.8% 17.7% 6.2% 17.9% 32.3% 30.5% 29.0% 2.9% 47.6% 22.2% 33.6% 31.5% Smart Share Global Limited -26.7% -51.3% -40.1% 1.6% 0.8% N M N M N M 15.2% 13.7% N M N M N M N M N M Smart Share Global Limited (2029) 0.5% 0.1% 13.2% 10.5% N M 58.7% |
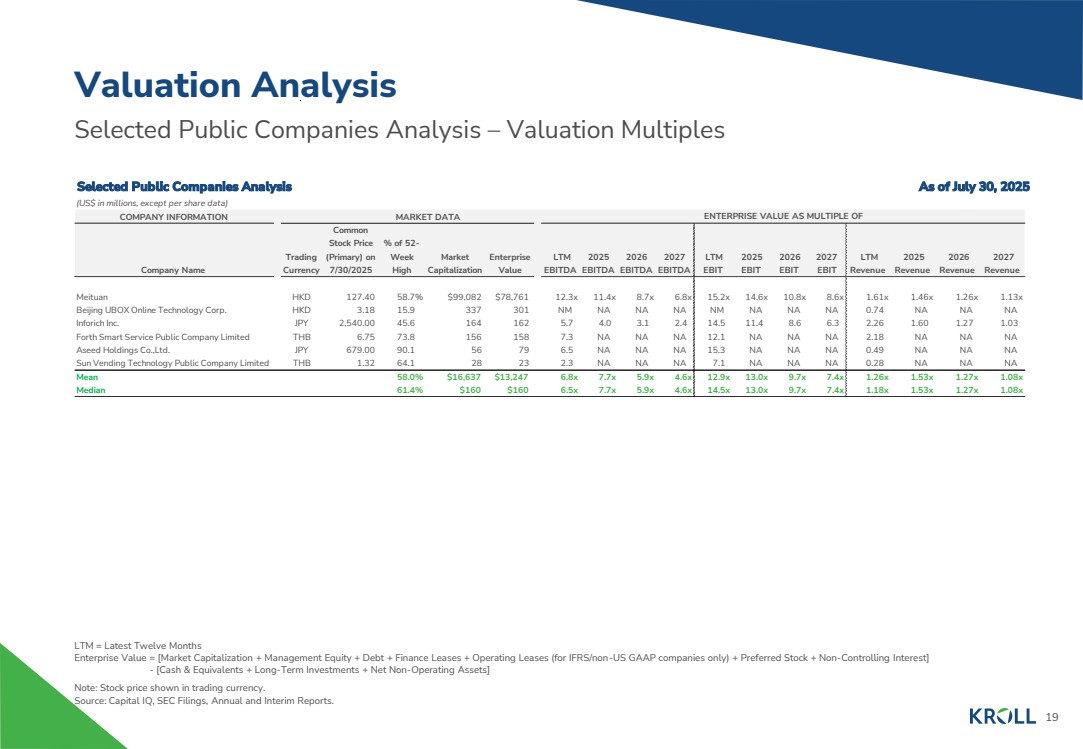
| 19 Selected Public Companies Analysis – Valuation Multiples Valuation Analysis LTM = Latest Twelve Months Enterprise Value = [Market Capitalization + Management Equity + Debt + Finance Leases + Operating Leases (for IFRS/non-US GAAP companies only) + Preferred Stock + Non-Controlling Interest] - [Cash & Equivalents + Long-Term Investments + Net Non-Operating Assets] Note: Stock price shown in trading currency. Source: Capital IQ, SEC Filings, Annual and Interim Reports. Selected Public Companies Analysis As of July 30, 2025 As of July 30, 2025 (US$ in millions, except per share data) COMPANY INFORMATION MARKET DATA Company Name Trading Currency Common Stock Price (Primary) on 7/30/2025 % of 52- Week High Market Capitalization Enterprise Value LTM EBITDA 2025 EBITDA 2026 EBITDA 2027 EBITDA LTM EBIT 2025 EBIT 2026 EBIT 2027 EBIT LTM Revenue 2025 Revenue 2026 Revenue 2027 Revenue Meituan HKD 127.40 58.7% $99,082 $78,761 12.3x 11.4x 8.7x 6.8x 15.2x 14.6x 10.8x 8.6x 1.61x 1.46x 1.26x 1.13x Beijing UBOX Online Technology Corp. HKD 3.18 15.9 337 301 NM NA NA NA NM NA NA NA 0.74 NA NA NA Inforich Inc. JPY 2,540.00 45.6 164 162 5.7 4.0 3.1 2.4 14.5 11.4 8.6 6.3 2.26 1.60 1.27 1.03 Forth Smart Service Public Company Limited THB 6.75 73.8 156 158 7.3 NA NA NA 12.1 NA NA NA 2.18 NA NA NA Aseed Holdings Co.,Ltd. JPY 679.00 90.1 5 6 7 9 6.5 NA NA NA 15.3 NA NA NA 0.49 NA NA NA Sun Vending Technology Public Company Limited THB 1.32 64.1 2 8 2 3 2.3 NA NA NA 7.1 NA NA NA 0.28 NA NA NA Mean 58.0% $16,637 $13,247 6.8x 7.7x 5.9x 4.6x 12.9x 13.0x 9.7x 7.4x 1.26x 1.53x 1.27x 1.08x Median 61.4% $160 $160 6.5x 7.7x 5.9x 4.6x 14.5x 13.0x 9.7x 7.4x 1.18x 1.53x 1.27x 1.08x ENTERPRISE VALUE AS MULTIPLE OF |
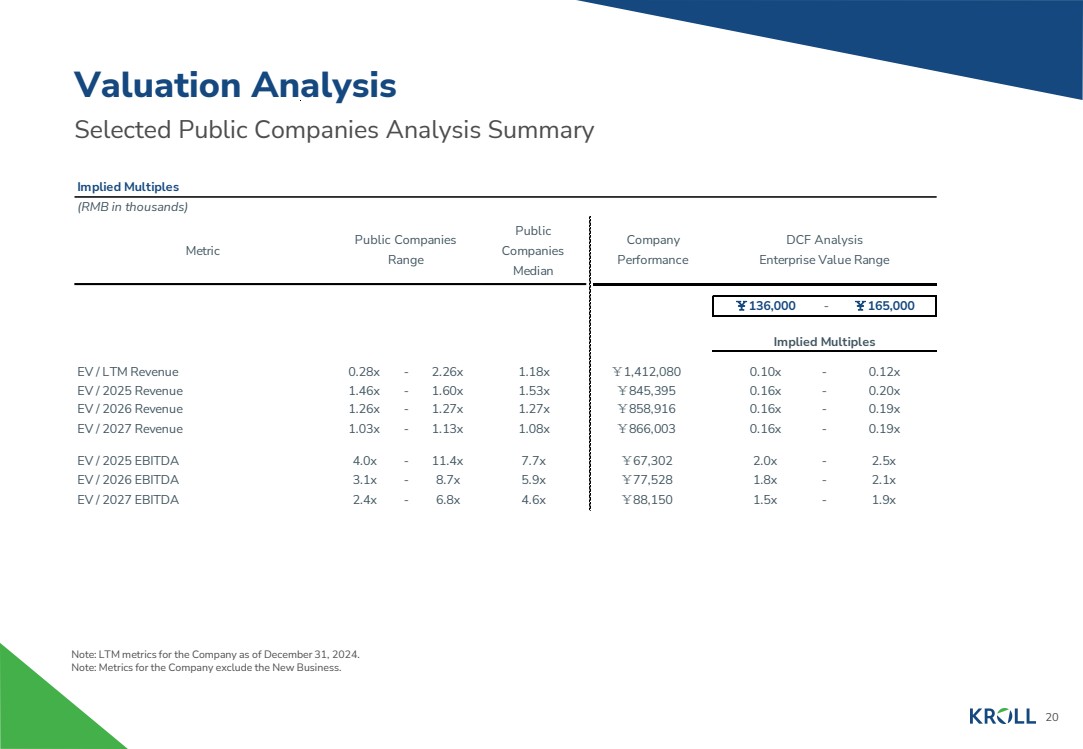
| 20 Valuation Analysis Selected Public Companies Analysis Summary Note: LTM metrics for the Company as of December 31, 2024. Note: Metrics for the Company exclude the New Business. Implied Multiples (RMB in thousands) Metric Public Companies Median Company Performance DCF Analysis Enterprise Value Range ¥136,000 - ¥165,000 Implied Multiples EV / LTM Revenue 0.28x - 2.26x 1.18x ¥1,412,080 0.10x - 0.12x EV / 2025 Revenue 1.46x - 1.60x 1.53x ¥845,395 0.16x - 0.20x EV / 2026 Revenue 1.26x - 1.27x 1.27x ¥858,916 0.16x - 0.19x EV / 2027 Revenue 1.03x - 1.13x 1.08x ¥866,003 0.16x - 0.19x EV / 2025 EBITDA 4.0x - 11.4x 7.7x ¥67,302 2.0x - 2.5x EV / 2026 EBITDA 3.1x - 8.7x 5.9x ¥77,528 1.8x - 2.1x EV / 2027 EBITDA 2.4x - 6.8x 4.6x ¥88,150 1.5x - 1.9x Public Companies Range |
| Appendix: New Business Analysis |

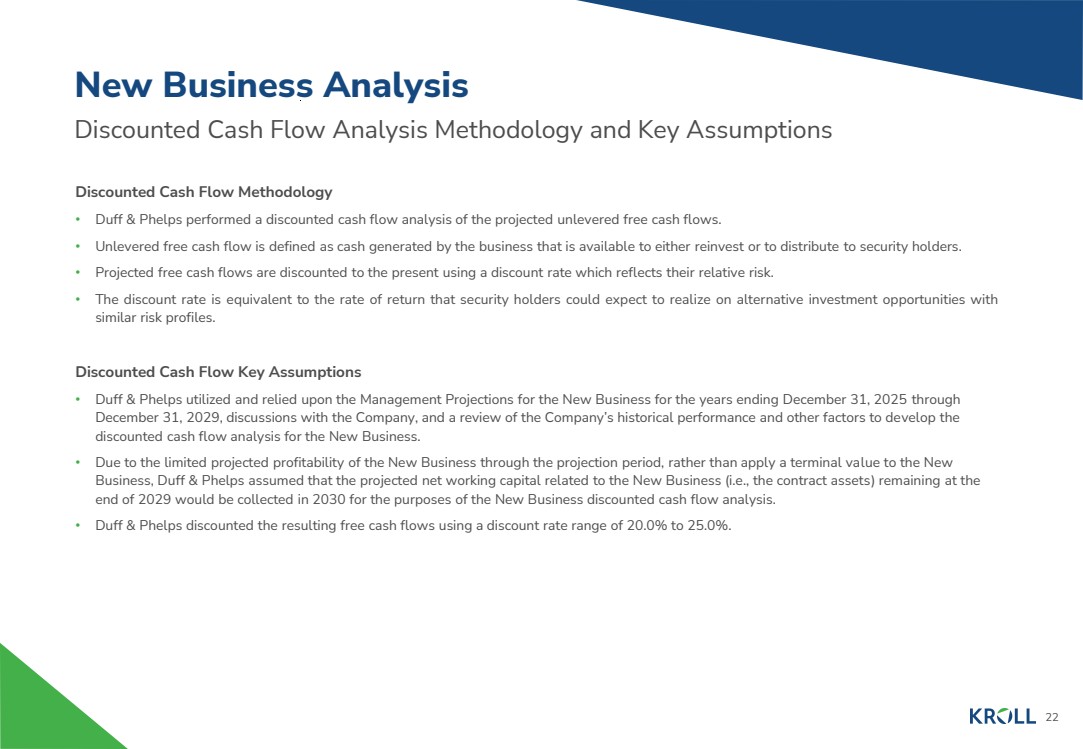
| 22 Discounted Cash Flow Analysis Methodology and Key Assumptions New Business Analysis Discounted Cash Flow Methodology • Duff & Phelps performed a discounted cash flow analysis of the projected unlevered free cash flows. • Unlevered free cash flow is defined as cash generated by the business that is available to either reinvest or to distribute to security holders. • Projected free cash flows are discounted to the present using a discount rate which reflects their relative risk. • The discount rate is equivalent to the rate of return that security holders could expect to realize on alternative investment opportunities with similar risk profiles. Discounted Cash Flow Key Assumptions • Duff & Phelps utilized and relied upon the Management Projections for the New Business for the years ending December 31, 2025 through December 31, 2029, discussions with the Company, and a review of the Company’s historical performance and other factors to develop the discounted cash flow analysis for the New Business. • Due to the limited projected profitability of the New Business through the projection period, rather than apply a terminal value to the New Business, Duff & Phelps assumed that the projected net working capital related to the New Business (i.e., the contract assets) remaining at the end of 2029 would be collected in 2030 for the purposes of the New Business discounted cash flow analysis. • Duff & Phelps discounted the resulting free cash flows using a discount rate range of 20.0% to 25.0%. |
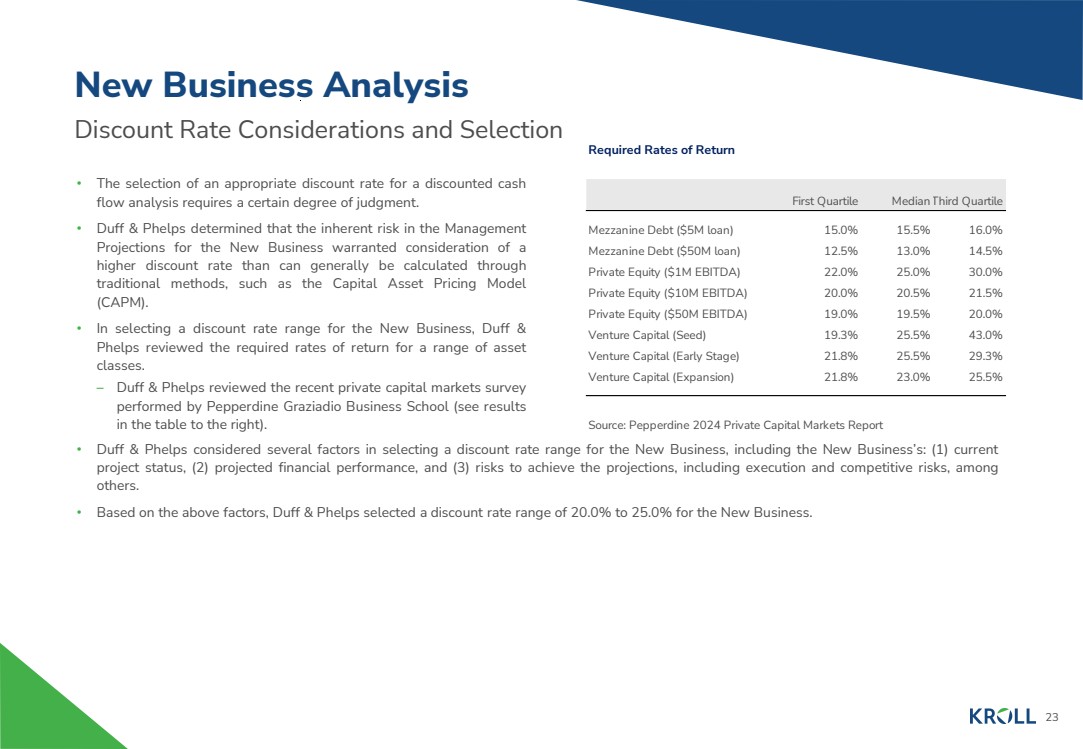
| 23 Discount Rate Considerations and Selection New Business Analysis • Duff & Phelps considered several factors in selecting a discount rate range for the New Business, including the New Business’s: (1) current project status, (2) projected financial performance, and (3) risks to achieve the projections, including execution and competitive risks, among others. • Based on the above factors, Duff & Phelps selected a discount rate range of 20.0% to 25.0% for the New Business. • The selection of an appropriate discount rate for a discounted cash flow analysis requires a certain degree of judgment. • Duff & Phelps determined that the inherent risk in the Management Projections for the New Business warranted consideration of a higher discount rate than can generally be calculated through traditional methods, such as the Capital Asset Pricing Model (CAPM). • In selecting a discount rate range for the New Business, Duff & Phelps reviewed the required rates of return for a range of asset classes. – Duff & Phelps reviewed the recent private capital markets survey performed by Pepperdine Graziadio Business School (see results in the table to the right). Required Rates of Return First Quartile MedianThird Quartile Mezzanine Debt ($5M loan) 15.0% 15.5% 16.0% Mezzanine Debt ($50M loan) 12.5% 13.0% 14.5% Private Equity ($1M EBITDA) 22.0% 25.0% 30.0% Private Equity ($10M EBITDA) 20.0% 20.5% 21.5% Private Equity ($50M EBITDA) 19.0% 19.5% 20.0% Venture Capital (Seed) 19.3% 25.5% 43.0% Venture Capital (Early Stage) 21.8% 25.5% 29.3% Venture Capital (Expansion) 21.8% 23.0% 25.5% Source: Pepperdine 2024 Private Capital Markets Report |
| 24 DCF Analysis Summary New Business Analysis Note: Balance sheet and LTM data as of December 31, 2024. Financial performance metrics presented are adjusted to exclude non-recurring income and public expenses. (1) Prior to application of 10% dividend withholding tax, which is calculated based on levered cash flows and discounted separately at the cost of equity derived in the WACC calculation and included in the concluded enterprise value range. (2) 10% withholding tax is considered in calculation of low end. Discounted Cash Flow Analysis (RMB in thousands) 2024A 2025P 2026P 2027P 2028P 2029P 2030P Revenues ¥482,292 ¥240,000 ¥228,000 ¥216,600 ¥205,770 ¥195,482 - Growth 744.4% (50.2%) (5.0%) (5.0%) (5.0%) (5.0%) (1.00) Adjusted EBITDA ¥58,616 ¥720 ¥684 ¥650 ¥617 ¥586 - Margin 12.2% 0.3% 0.3% 0.3% 0.3% 0.3% NM Growth NM (98.8%) (5.0%) (5.0%) (5.0%) (5.0%) (1.00) Earnings Before Interest and Taxes ¥720 ¥684 ¥650 ¥617 ¥586 ¥0 Pro Forma Taxes 0 0 0 0 0 0 Net Operating Profit After Tax 720 684 650 617 586 0 (Increase) / Decrease in Working Capital 200,340 9,205 8,433 7,715 7,047 26,778 Free Cash Flow (1) ¥201,060 ¥9,889 ¥9,083 ¥8,332 ¥7,633 ¥26,778 Enterprise Value Range Low High Discount Rate Range 25.00% 20.00% Enterprise Value Range (2) ¥214,000 ¥241,000 Implied Valuation Multiples EV / LTM Revenue ¥482,292 0.44x 0.50x EV / 2025 Revenue ¥240,000 0.89x 1.00x EV / 2026 Revenue ¥228,000 0.94x 1.06x EV / 2027 Revenue ¥216,600 0.99x 1.11x EV / LTM EBITDA ¥58,616 3.7x 4.1x |

| www.kroll.com About Kroll As the leading independent provider of risk and financial advisory solutions, Kroll leverages our unique insights, data and technology to help clients stay ahead of complex demands. Kroll’s global team continues the firm’s nearly 100-year history of trusted expertise spanning risk, governance, transactions and valuation. Our advanced solutions and intelligence provide clients the foresight they need to create an enduring competitive advantage. At Kroll, our values define who we are and how we partner with clients and communities. Learn more at www.kroll.com. M&A advisory, capital raising and secondary market advisory services in the United States are provided by Kroll Securities, LLC (member FINRA/SIPC). M&A advisory, capital raising and secondary market advisory services in the United Kingdom are provided by Kroll Securities Ltd., which is authorized and regulated by the Financial Conduct Authority (FCA). Valuation Advisory Services in India are provided by Kroll Advisory Private Limited (formerly, Duff & Phelps India Private Limited), under a category 1 merchant banker license issued by the Securities and Exchange Board of India. © 2025 Kroll, LLC. All rights reserved. |