Shareholder Report
Jul. 31, 2025
USD ($)
Holding
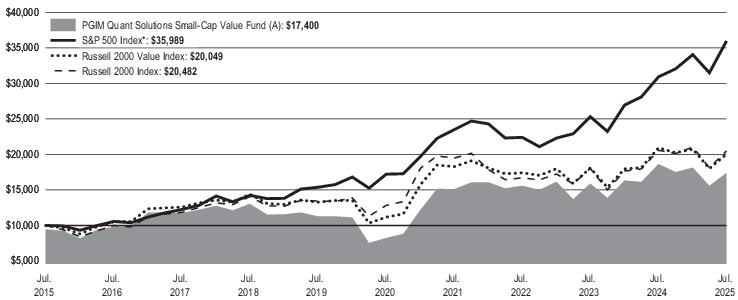
This annual shareholder report contains important information about the Class A shares of PGIM Quant Solutions Small-Cap Value Fund (the
“Fund”) for the period of August 1, 2024 to July 31, 2025.
You can find additional information about the Fund at
pgim.com/investments/mutual-funds/prospectuses-fact-sheets
. You can also request
this information by contacting us at (800) 225-1852 or (973) 367-3529 from outside the US.
WHAT WERE THE FUND COSTS FOR THE LAST YEAR?
(Based on a hypothetical $10,000 investment)
Costs of a $10,000 investment |
Costs paid as a percentage of a $10,000 investment | |
PGIM Quant Solutions Small-Cap Value Fund—Class A |
$105 |
1.09% |
WHAT AFFECTED
THE
FUND’S PERFORMANCE DURING THE REPORTING PERIOD?■
Market gains continued to be fueled by large-cap stocks, which
outperformed
small-cap names by over 17% during the reporting period. US small-cap stocks (as measured by the Russell 2000 Index) declined 0.55%, while large-cap stocks (as measured by the Russell 1000 Index)
gained 16.54%. Additionally, growth stocks continued to outpace value stocks. Although this gap was most significant among large-caps, the
Russell 2000 Value Index (-4.27%) trailed the Russell 2000 Growth Index (3.15%) by over 7%.
■
PGIM Quantitative Solutions’ focus on stocks with
low
valuations and attractive business prospects drove underperformance, as the Fund lagged the Russell 2000 Value Index in seven of the 11 economic sectors.
■
The most significant detractors relative to the Russell 2000
Value
Index were positions across multiple industries in the materials, communication services, and information technology sectors.
■
The most substantial positive contributions
came
from financials, driven by PGIM Quantitative Solutions’ positioning among insurance and financial services companies.
Average Annual Total Returns as of 7/31/2025 | |||
One Year (%) |
Five Years (%) |
Ten Years (%) | |
Class A with sales charges |
-11.87% |
14.82% |
5.70% |
Class A without sales charges |
-6.73% |
16.12% |
6.29% |
S&P 500 Index* |
16.33% |
15.88% |
13.66% |
Russell 2000 Value Index |
-4.27% |
12.41% |
7.20% |
Russell 2000 Index |
-0.55% |
9.81% |
7.43% |
*The Fund compares its performance against this broad-based index
in
response to regulatory requirements. The returns do not reflect the deduction of
taxes that a shareholder would pay on Fund distributions or redemption of Fund shares.
Visit
pgim.com/investments/mutual-funds/prospectuses-fact-sheets
or call (800) 225-1852 or (973) 367-3529 from outside the US for more recent performance data.
WHAT ARE SOME KEY FUND STATISTICS AS OF 7/31/2025?
Fund’s net assets |
$ 349,939,143 |
Number of fund holdings |
397 |
Total advisory fees paid for the year |
$ 2,180,736 |
Portfolio turnover rate for the year |
122% |
WHAT ARE
SOME
CHARACTERISTICS OF
THE FUND’S HOLDINGS
AS OF 7/31/2025?Industry Classification |
% of Net Assets |
Banks |
17.5% |
Affiliated Mutual Fund - Short-Term Investment (5.9% represents investments purchased with collateral from securities on loan) |
6.1% |
Oil, Gas & Consumable Fuels |
5.2% |
Insurance |
4.3% |
Electronic Equipment, Instruments & Components |
3.8% |
Machinery |
3.5% |
Commercial Services & Supplies |
3.3% |
Construction & Engineering |
3.1% |
Hotel & Resort REITs |
2.8% |
Pharmaceuticals |
2.7% |
Biotechnology |
2.7% |
Financial Services |
2.6% |
Software |
2.4% |
Gas Utilities |
2.2% |
Specialty Retail |
2.0% |
Health Care Providers & Services |
2.0% |
Real Estate Management & Development |
1.9% |
Multi-Utilities |
1.8% |
Consumer Finance |
1.8% |
Metals & Mining |
1.8% |
Electrical Equipment |
1.7% |
Food Products |
1.7% |
Diversified Consumer Services |
1.6% |
Automobile Components |
1.5% |
Energy Equipment & Services |
1.4% |
Marine Transportation |
1.3% |
Building Products |
1.2% |
Industry Classification |
% of Net Assets |
Electric Utilities |
1.2% |
Trading Companies & Distributors |
1.2% |
Passenger Airlines |
1.2% |
Media |
1.2% |
Specialized REITs |
1.1% |
Personal Care Products |
1.1% |
Office REITs |
1.1% |
Industrial REITs |
1.0% |
Containers & Packaging |
0.9% |
Diversified REITs |
0.9% |
Chemicals |
0.9% |
Textiles, Apparel & Luxury Goods |
0.9% |
Life Sciences Tools & Services |
0.8% |
Professional Services |
0.8% |
Consumer Staples Distribution & Retail |
0.8% |
Communications Equipment |
0.8% |
Semiconductors & Semiconductor Equipment |
0.7% |
Retail REITs |
0.7% |
Mortgage Real Estate Investment Trusts (REITs) |
0.7% |
Hotels, Restaurants & Leisure |
0.6% |
Unaffiliated Exchange-Traded Funds |
0.6% |
Health Care Equipment & Supplies |
0.6% |
Others* |
2.3% |
106.0% | |
Liabilities in excess of other assets |
(6.0)% |
100.0% |
* |
Consists of Industries that each make up less than 0.5% of the Fund's net assets |
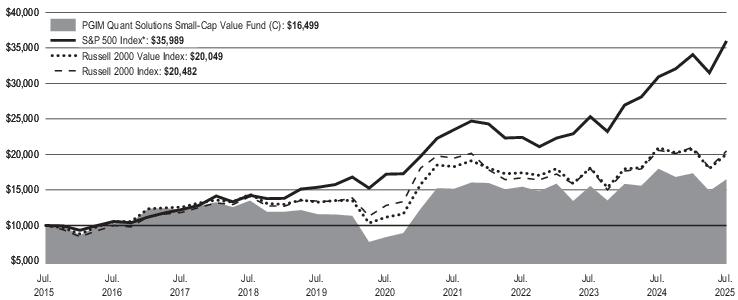
This annual shareholder report contains important information about the Class C shares of PGIM Quant Solutions Small-Cap Value Fund (the
“Fund”) for the period of August 1, 2024 to July 31, 2025.
You can find additional information about the Fund at
pgim.com/investments/mutual-funds/prospectuses-fact-sheets
. You can also request
this information by contacting us at (800) 225-1852 or (973) 367-3529 from outside the US.
WHAT WERE THE FUND COSTS FOR THE
LAST
YEAR?(Based on a hypothetical $10,000 investment)
Costs of a $10,000 investment |
Costs paid as a percentage of a $10,000 investment | |
PGIM Quant Solutions Small-Cap Value Fund—Class C |
$265 |
2.76% |
WHAT AFFECTED THE FUND’S PERFORMANCE DURING
THE
REPORTING PERIOD?■
Market gains continued to be fueled by large-cap stocks, which outperformed small-cap names by over 17% during the reporting period. US
small-cap stocks (as measured by the Russell 2000 Index) declined 0.55%, while
large
-cap stocks (as measured by the Russell 1000 Index) gained 16.54%. Additionally, growth stocks continued to outpace value stocks. Although this gap was most significant among large-caps, the
Russell 2000 Value Index (-4.27%) trailed the Russell 2000 Growth Index (3.15%) by over 7%.
■
PGIM Quantitative Solutions’ focus on stocks
with
low valuations and attractive business prospects drove underperformance, as the Fund lagged the Russell 2000 Value Index in seven of the 11 economic sectors.
■
The most significant detractors relative to the Russell 2000 Value
Index
were positions across multiple industries in the materials, communication services, and information technology sectors.
■
The most substantial positive contributions came
from
financials, driven by PGIM Quantitative Solutions’ positioning among insurance and financial services companies.
Average Annual Total Returns as of 7/31/2025 | |||
One Year (%) |
Five Years (%) |
Ten Years (%) | |
Class C with sales charges |
-9.05% |
14.57% |
5.13% |
Class C without sales charges |
-8.23% |
14.57% |
5.13% |
S&P 500 Index* |
16.33% |
15.88% |
13.66% |
Russell 2000 Value Index |
-4.27% |
12.41% |
7.20% |
Russell 2000 Index |
-0.55% |
9.81% |
7.43% |
*The Fund compares its performance against this broad-based index in
response
to regulatory requirements.The returns do not reflect the deduction of
taxes that a shareholder would pay on Fund distributions or redemption of Fund shares.
Visit
pgim.com/investments/mutual-funds/prospectuses-fact-sheets
or call (800) 225-1852 or (973) 367-3529 from outside the US for more recent performance data.
WHAT ARE SOME KEY FUND STATISTICS AS OF 7/31/2025?
Fund’s net assets |
$ 349,939,143 |
Number of fund holdings |
397 |
Total advisory fees paid for the year |
$ 2,180,736 |
Portfolio turnover rate for the year |
122% |
WHAT ARE SOME CHARACTERISTICS
OF
THE FUND’S HOLDINGS AS OF 7/31/2025?Industry Classification |
% of Net Assets |
Banks |
17.5% |
Affiliated Mutual Fund - Short-Term Investment (5.9% represents investments purchased with collateral from securities on loan) |
6.1% |
Oil, Gas & Consumable Fuels |
5.2% |
Insurance |
4.3% |
Electronic Equipment, Instruments & Components |
3.8% |
Machinery |
3.5% |
Commercial Services & Supplies |
3.3% |
Construction & Engineering |
3.1% |
Hotel & Resort REITs |
2.8% |
Pharmaceuticals |
2.7% |
Biotechnology |
2.7% |
Financial Services |
2.6% |
Software |
2.4% |
Gas Utilities |
2.2% |
Specialty Retail |
2.0% |
Health Care Providers & Services |
2.0% |
Real Estate Management & Development |
1.9% |
Multi-Utilities |
1.8% |
Consumer Finance |
1.8% |
Metals & Mining |
1.8% |
Electrical Equipment |
1.7% |
Food Products |
1.7% |
Diversified Consumer Services |
1.6% |
Automobile Components |
1.5% |
Energy Equipment & Services |
1.4% |
Marine Transportation |
1.3% |
Building Products |
1.2% |
Industry Classification |
% of Net Assets |
Electric Utilities |
1.2% |
Trading Companies & Distributors |
1.2% |
Passenger Airlines |
1.2% |
Media |
1.2% |
Specialized REITs |
1.1% |
Personal Care Products |
1.1% |
Office REITs |
1.1% |
Industrial REITs |
1.0% |
Containers & Packaging |
0.9% |
Diversified REITs |
0.9% |
Chemicals |
0.9% |
Textiles, Apparel & Luxury Goods |
0.9% |
Life Sciences Tools & Services |
0.8% |
Professional Services |
0.8% |
Consumer Staples Distribution & Retail |
0.8% |
Communications Equipment |
0.8% |
Semiconductors & Semiconductor Equipment |
0.7% |
Retail REITs |
0.7% |
Mortgage Real Estate Investment Trusts (REITs) |
0.7% |
Hotels, Restaurants & Leisure |
0.6% |
Unaffiliated Exchange-Traded Funds |
0.6% |
Health Care Equipment & Supplies |
0.6% |
Others* |
2.3% |
106.0% | |
Liabilities in excess of other assets |
(6.0)% |
100.0% |
* |
Consists of Industries that each make up less than 0.5% of the Fund's net assets |
WERE THERE ANY SIGNIFICANT CHANGES TO THE FUND THIS YEAR?
The following is a summary of certain changes to the Fund since August 1, 2024:
■
For the year ended July 31, 2025, the Class C shares total annual Fund operating expenses after waivers and/or expense reimbursement
increased from 2.49% in the year ended July 31, 2024 to 2.76% primarily due to a decrease in Fund's net assets.
For more complete information, you should review the Fund’s next prospectus, which we expect to be available by September 29, 2025 at
pgim.com/investments/mutual-funds/prospectuses-fact-sheets or by request at (800) 225-1852.
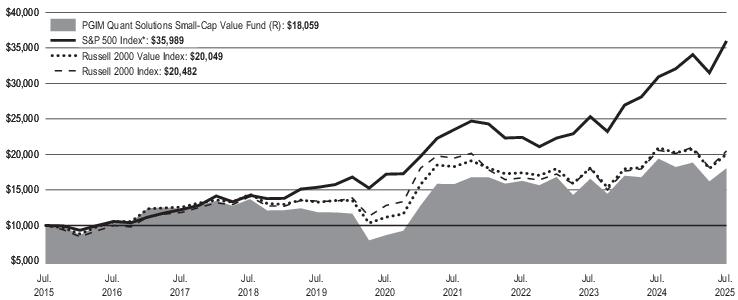
This annual shareholder report contains important information about the Class R shares of PGIM Quant Solutions Small-Cap Value Fund (the
“Fund”) for the period of August 1, 2024 to July 31, 2025.
You can find additional information about the Fund at
pgim.com/investments/mutual-funds/prospectuses-fact-sheets
. You can also request
this information by contacting us at (800) 225-1852 or (973) 367-3529 from outside the US.
WHAT WERE THE FUND COSTS FOR THE
LAST
YEAR?(Based on a hypothetical $10,000 investment)
Costs of a $10,000 investment |
Costs paid as a percentage of a $10,000 investment | |
PGIM Quant Solutions Small-Cap Value Fund—Class R |
$127 |
1.32% |
WHAT AFFECTED THE FUND’S PERFORMANCE DURING
THE
REPORTING PERIOD?■
Market gains continued to be fueled by large-cap stocks, which
outperformed
small-cap names by over 17% during the reporting period. US small-cap stocks (as measured by the Russell 2000 Index) declined 0.55%, while large-cap stocks (as measured by the Russell 1000 Index)
gained 16.54%. Additionally, growth stocks continued to outpace value stocks. Although this gap was most significant among large-caps, the
Russell 2000 Value Index (-4.27%) trailed the Russell 2000 Growth Index (3.15%) by over 7%.
■
PGIM Quantitative Solutions’ focus on stocks with low
valuations
and attractive business prospects drove underperformance, as the Fund lagged the Russell 2000 Value Index in seven of the 11 economic sectors.
■
The most significant detractors relative to
the
Russell 2000 Value Index were positions across multiple industries in the materials, communication services, and information technology sectors.
■
The most substantial positive contributions came from financials,
driven
by PGIM Quantitative Solutions’ positioning among insurance and financial services companies.
Average Annual Total Returns as of 7/31/2025 | |||
One Year (%) |
Five Years (%) |
Ten Years (%) | |
Class R |
-6.92% |
15.90% |
6.09% |
S&P 500 Index* |
16.33% |
15.88% |
13.66% |
Russell 2000 Value Index |
-4.27% |
12.41% |
7.20% |
Russell 2000 Index |
-0.55% |
9.81% |
7.43% |
*The Fund compares its
performance
against this broad-based index in response to regulatory requirements.The returns do not reflect the deduction of
taxes that a shareholder would pay on Fund distributions or redemption of Fund shares.
Visit
pgim.com/investments/mutual-funds/prospectuses-fact-sheets
or call (800) 225-1852 or (973) 367-3529 from outside the US for more recent performance data.
WHAT ARE SOME KEY FUND STATISTICS AS OF 7/31/2025?
Fund’s net assets |
$ 349,939,143 |
Number of fund holdings |
397 |
Total advisory fees paid for the year |
$ 2,180,736 |
Portfolio turnover rate for the year |
122% |
WHAT ARE SOME CHARACTERISTICS
OF
THE FUND’S HOLDINGS AS OF 7/31/2025?Industry Classification |
% of Net Assets |
Banks |
17.5% |
Affiliated Mutual Fund - Short-Term Investment (5.9% represents investments purchased with collateral from securities on loan) |
6.1% |
Oil, Gas & Consumable Fuels |
5.2% |
Insurance |
4.3% |
Electronic Equipment, Instruments & Components |
3.8% |
Machinery |
3.5% |
Commercial Services & Supplies |
3.3% |
Construction & Engineering |
3.1% |
Hotel & Resort REITs |
2.8% |
Pharmaceuticals |
2.7% |
Biotechnology |
2.7% |
Financial Services |
2.6% |
Software |
2.4% |
Gas Utilities |
2.2% |
Specialty Retail |
2.0% |
Health Care Providers & Services |
2.0% |
Real Estate Management & Development |
1.9% |
Multi-Utilities |
1.8% |
Consumer Finance |
1.8% |
Metals & Mining |
1.8% |
Electrical Equipment |
1.7% |
Food Products |
1.7% |
Diversified Consumer Services |
1.6% |
Automobile Components |
1.5% |
Energy Equipment & Services |
1.4% |
Marine Transportation |
1.3% |
Building Products |
1.2% |
Industry Classification |
% of Net Assets |
Electric Utilities |
1.2% |
Trading Companies & Distributors |
1.2% |
Passenger Airlines |
1.2% |
Media |
1.2% |
Specialized REITs |
1.1% |
Personal Care Products |
1.1% |
Office REITs |
1.1% |
Industrial REITs |
1.0% |
Containers & Packaging |
0.9% |
Diversified REITs |
0.9% |
Chemicals |
0.9% |
Textiles, Apparel & Luxury Goods |
0.9% |
Life Sciences Tools & Services |
0.8% |
Professional Services |
0.8% |
Consumer Staples Distribution & Retail |
0.8% |
Communications Equipment |
0.8% |
Semiconductors & Semiconductor Equipment |
0.7% |
Retail REITs |
0.7% |
Mortgage Real Estate Investment Trusts (REITs) |
0.7% |
Hotels, Restaurants & Leisure |
0.6% |
Unaffiliated Exchange-Traded Funds |
0.6% |
Health Care Equipment & Supplies |
0.6% |
Others* |
2.3% |
106.0% | |
Liabilities in excess of other assets |
(6.0)% |
100.0% |
* |
Consists of Industries that each make up less than 0.5% of the Fund's net assets |
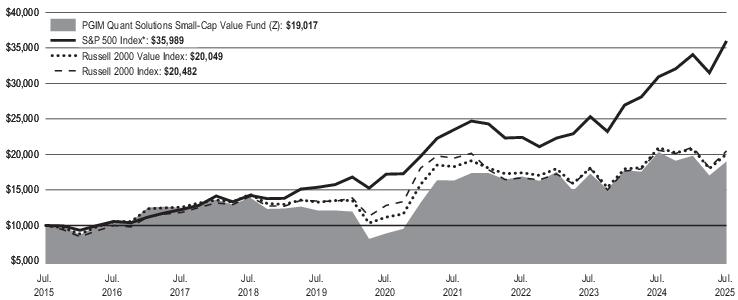
This annual shareholder report contains important information about the Class Z shares of PGIM Quant Solutions Small-Cap Value Fund (the
“Fund”) for the period of August 1, 2024 to July 31, 2025.
You can find additional information about the Fund at
pgim.com/investments/mutual-funds/prospectuses-fact-sheets
. You can also request
this information by contacting us at (800) 225-1852 or (973) 367-3529 from outside the US.
WHAT WERE THE FUND COSTS FOR THE LAST YEAR?
(Based on a hypothetical $10,000 investment)
Costs of a $10,000 investment |
Costs paid as a percentage of a $10,000 investment | |
PGIM Quant Solutions Small-Cap Value Fund—Class Z |
$77 |
0.80% |
WHAT AFFECTED THE FUND’S PERFORMANCE DURING THE REPORTING PERIOD?
■
Market gains continued to be fueled by large-cap stocks, which outperformed small-cap names by over 17% during the reporting period. US
small-cap stocks (as measured by the Russell 2000 Index) declined 0.55%, while large-cap stocks (as measured by the Russell 1000 Index)
gained 16.54%. Additionally, growth stocks continued to outpace value stocks. Although this gap was most significant among large-caps, the
Russell 2000 Value Index (-4.27%) trailed the Russell 2000 Growth Index (3.15%) by over 7%.
■
PGIM Quantitative Solutions’ focus on stocks with low valuations and attractive business prospects drove underperformance, as the Fund
lagged the Russell 2000 Value Index in seven of the 11 economic sectors.
■
The most significant detractors relative to the Russell 2000 Value Index were positions across multiple industries in the materials,
communication services, and information technology sectors.
■
The most substantial positive contributions came from financials, driven by PGIM Quantitative Solutions’ positioning among insurance and
financial services companies.
Average Annual Total Returns as of 7/31/2025 | |||
One Year (%) |
Five Years (%) |
Ten Years (%) | |
Class Z |
-6.45% |
16.47% |
6.64% |
S&P 500 Index* |
16.33% |
15.88% |
13.66% |
Russell 2000 Value Index |
-4.27% |
12.41% |
7.20% |
Russell 2000 Index |
-0.55% |
9.81% |
7.43% |
*The Fund compares its performance against this broad-based index in response to regulatory requirements.
The returns do not reflect the deduction of
taxes that a shareholder would pay on Fund distributions or redemption of Fund shares.
Visit
pgim.com/investments/mutual-funds/prospectuses-fact-sheets
or call (800) 225-1852 or (973) 367-3529 from outside the US for more recent performance data.
WHAT ARE SOME K
EY
FUND STATISTICS AS OF 7/31/2025?Fund’s net assets |
$ 349,939,143 |
Number of fund holdings |
397 |
Total advisory fees paid for the year |
$ 2,180,736 |
Portfolio turnover rate for the year |
122% |
WHAT ARE SOME CHARACTERISTICS OF THE FUND’S HOLDINGS AS OF 7/31/2025?
Industry Classification |
% of Net Assets |
Banks |
17.5% |
Affiliated Mutual Fund - Short-Term Investment (5.9% represents investments purchased with collateral from securities on loan) |
6.1% |
Oil, Gas & Consumable Fuels |
5.2% |
Insurance |
4.3% |
Electronic Equipment, Instruments & Components |
3.8% |
Machinery |
3.5% |
Commercial Services & Supplies |
3.3% |
Construction & Engineering |
3.1% |
Hotel & Resort REITs |
2.8% |
Pharmaceuticals |
2.7% |
Biotechnology |
2.7% |
Financial Services |
2.6% |
Software |
2.4% |
Gas Utilities |
2.2% |
Specialty Retail |
2.0% |
Health Care Providers & Services |
2.0% |
Real Estate Management & Development |
1.9% |
Multi-Utilities |
1.8% |
Consumer Finance |
1.8% |
Metals & Mining |
1.8% |
Electrical Equipment |
1.7% |
Food Products |
1.7% |
Diversified Consumer Services |
1.6% |
Automobile Components |
1.5% |
Energy Equipment & Services |
1.4% |
Marine Transportation |
1.3% |
Building Products |
1.2% |
Industry Classification |
% of Net Assets |
Electric Utilities |
1.2% |
Trading Companies & Distributors |
1.2% |
Passenger Airlines |
1.2% |
Media |
1.2% |
Specialized REITs |
1.1% |
Personal Care Products |
1.1% |
Office REITs |
1.1% |
Industrial REITs |
1.0% |
Containers & Packaging |
0.9% |
Diversified REITs |
0.9% |
Chemicals |
0.9% |
Textiles, Apparel & Luxury Goods |
0.9% |
Life Sciences Tools & Services |
0.8% |
Professional Services |
0.8% |
Consumer Staples Distribution & Retail |
0.8% |
Communications Equipment |
0.8% |
Semiconductors & Semiconductor Equipment |
0.7% |
Retail REITs |
0.7% |
Mortgage Real Estate Investment Trusts (REITs) |
0.7% |
Hotels, Restaurants & Leisure |
0.6% |
Unaffiliated Exchange-Traded Funds |
0.6% |
Health Care Equipment & Supplies |
0.6% |
Others* |
2.3% |
106.0% | |
Liabilities in excess of other assets |
(6.0)% |
100.0% |
* |
Consists of Industries that each make up less than 0.5% of the Fund's net assets |
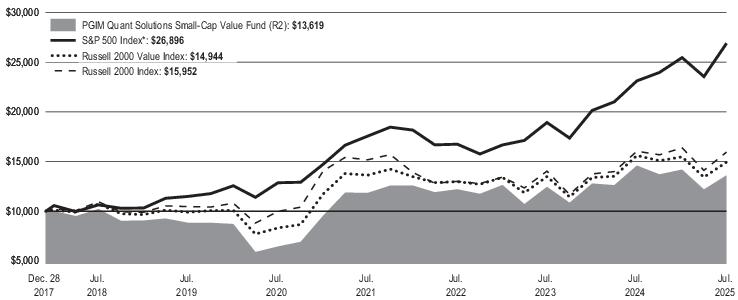
This annual shareholder report contains important information about the Class R2 shares of PGIM Quant Solutions Small-Cap Value Fund (the
“Fund”) for the period of August 1, 2024 to July 31, 2025.
You can find additional information about the Fund at
pgim.com/investments/mutual-funds/prospectuses-fact-sheets
. You can also request
this information by contacting us at (800) 225-1852 or (973) 367-3529 from outside the US.
WHAT WERE THE FUND COSTS FOR THE LAST YEAR?
(Based on a hypothetical $10,000 investment)
Costs of a $10,000 investment |
Costs paid as a percentage of a $10,000 investment | |
PGIM Quant Solutions Small-Cap Value Fund—Class R2 |
$110 |
1.14% |
WHAT AFFECTED THE FUND’S PERFORMANCE DURING THE REPORTING PERIOD?
■
Market gains continued to be fueled by large-cap stocks, which outperformed small-cap names by over 17% during the reporting period. US
small-cap stocks (as measured by the Russell 2000 Index) declined 0.55%, while large-cap stocks (as measured by the Russell 1000 Index)
gained 16.54%. Additionally, growth stocks continued to outpace value stocks. Although this gap was most significant among large-caps, the
Russell 2000 Value Index (-4.27%) trailed the Russell 2000 Growth Index (3.15%) by over 7%.
■
PGIM Quantitative Solutions’ focus on stocks with low valuations and attractive business prospects drove underperformance, as the Fund
lagged the Russell 2000 Value Index in seven of the 11 economic sectors.
■
The most significant detractors relative to the Russell 2000 Value Index were positions across multiple industries in the materials,
communication services, and information technology sectors.
■
The most substantial positive contributions came from financials, driven by PGIM Quantitative Solutions’ positioning among insurance and
financial services companies.
Average Annual Total Returns as of 7/31/2025 | |||
One Year (%) |
Five Years (%) |
Since Inception (%) | |
Class R2 |
-6.71% |
16.09% |
4.15% (12/28/2017) |
S&P 500 Index* |
16.33% |
15.88% |
13.94% |
Russell 2000 Value Index |
-4.27% |
12.41% |
5.44% |
Russell 2000 Index |
-0.55% |
9.81% |
6.35% |
*The Fund compares its performance against this broad-based index in response to regulatory requirements.
The returns do not reflect the deduction of
taxes that a shareholder would pay on Fund distributions or redemption of Fund shares.
Visit
pgim.com/investments/mutual-funds/prospectuses-fact-sheets
or call (800) 225-1852 or (973) 367-3529 from outside the US for more recent performance data.
WHAT ARE SOME KEY FUND STATISTICS AS OF 7/31/2025?
Fund’s net assets |
$ 349,939,143 |
Number of fund holdings |
397 |
Total advisory fees paid for the year |
$ 2,180,736 |
Portfolio turnover rate for the year |
122% |
WHAT
ARE SOME CHARACTERISTICS OF THE FUND’S HOLDINGS AS OF 7/31/2025?Industry Classification |
% of Net Assets |
Banks |
17.5% |
Affiliated Mutual Fund - Short-Term Investment (5.9% represents investments purchased with collateral from securities on loan) |
6.1% |
Oil, Gas & Consumable Fuels |
5.2% |
Insurance |
4.3% |
Electronic Equipment, Instruments & Components |
3.8% |
Machinery |
3.5% |
Commercial Services & Supplies |
3.3% |
Construction & Engineering |
3.1% |
Hotel & Resort REITs |
2.8% |
Pharmaceuticals |
2.7% |
Biotechnology |
2.7% |
Financial Services |
2.6% |
Software |
2.4% |
Gas Utilities |
2.2% |
Specialty Retail |
2.0% |
Health Care Providers & Services |
2.0% |
Real Estate Management & Development |
1.9% |
Multi-Utilities |
1.8% |
Consumer Finance |
1.8% |
Metals & Mining |
1.8% |
Electrical Equipment |
1.7% |
Food Products |
1.7% |
Diversified Consumer Services |
1.6% |
Automobile Components |
1.5% |
Energy Equipment & Services |
1.4% |
Marine Transportation |
1.3% |
Building Products |
1.2% |
Industry Classification |
% of Net Assets |
Electric Utilities |
1.2% |
Trading Companies & Distributors |
1.2% |
Passenger Airlines |
1.2% |
Media |
1.2% |
Specialized REITs |
1.1% |
Personal Care Products |
1.1% |
Office REITs |
1.1% |
Industrial REITs |
1.0% |
Containers & Packaging |
0.9% |
Diversified REITs |
0.9% |
Chemicals |
0.9% |
Textiles, Apparel & Luxury Goods |
0.9% |
Life Sciences Tools & Services |
0.8% |
Professional Services |
0.8% |
Consumer Staples Distribution & Retail |
0.8% |
Communications Equipment |
0.8% |
Semiconductors & Semiconductor Equipment |
0.7% |
Retail REITs |
0.7% |
Mortgage Real Estate Investment Trusts (REITs) |
0.7% |
Hotels, Restaurants & Leisure |
0.6% |
Unaffiliated Exchange-Traded Funds |
0.6% |
Health Care Equipment & Supplies |
0.6% |
Others* |
2.3% |
106.0% | |
Liabilities in excess of other assets |
(6.0)% |
100.0% |
* |
Consists of Industries that each make up less than 0.5% of the Fund's net assets |
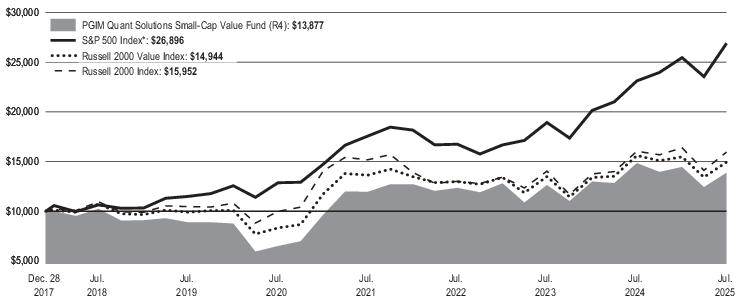
This annual shareholder report contains important information about the Class R4 shares of PGIM Quant Solutions Small-Cap Value Fund (the
“Fund”) for the period of August 1, 2024 to July 31, 2025.
You can find additional information about the Fund at
pgim.com/investments/mutual-funds/prospectuses-fact-sheets
. You can also request
this information by contacting us at (800) 225-1852 or (973) 367-3529 from outside the US.
WHAT WERE THE FUND COSTS FOR THE LAST YEAR?
(Based on a hypothetical $10,000 investment)
Costs of a $10,000 investment |
Costs paid as a percentage of a $10,000 investment | |
PGIM Quant Solutions Small-Cap Value Fund—Class R4 |
$86 |
0.89% |
WHAT AFFECTED THE FUND’S PERFORMANCE DURING THE REPORTING PERIOD?
■
Market gains continued to be fueled by large-cap stocks, which outperformed small-cap names by over 17% during the reporting period. US
small-cap stocks (as measured by the Russell 2000 Index) declined 0.55%, while large-cap stocks (as measured by the Russell 1000 Index)
gained 16.54%. Additionally, growth stocks continued to outpace value stocks. Although this gap was most significant among large-caps, the
Russell 2000 Value Index (-4.27%) trailed the Russell 2000 Growth Index (3.15%) by over 7%.
■
PGIM Quantitative Solutions’ focus on stocks with low valuations and attractive business prospects drove underperformance, as the Fund
lagged the Russell 2000 Value Index in seven of the 11 economic sectors.
■
The most significant detractors relative to the Russell 2000 Value Index were positions across multiple industries in the materials,
communication services, and information technology sectors.
■
The most substantial positive contributions came from financials, driven by PGIM Quantitative Solutions’ positioning among insurance and
financial services companies.
Average Annual Total Returns as of 7/31/2025 | |||
One Year (%) |
Five Years (%) |
Since Inception (%) | |
Class R4 |
-6.52% |
16.37% |
4.41% (12/28/2017) |
S&P 500 Index* |
16.33% |
15.88% |
13.94% |
Russell 2000 Value Index |
-4.27% |
12.41% |
5.44% |
Russell 2000 Index |
-0.55% |
9.81% |
6.35% |
*The Fund compares its performance against this broad-based index in response to regulatory requirements.
The returns do not reflect the deduction of
taxes that a shareholder would pay on Fund distributions or redemption of Fund shares.
Visit
pgim.com/investments/mutual-funds/prospectuses-fact-sheets
or call (800) 225-1852 or (973) 367-3529 from outside the US for more recent performance data.
WHAT ARE SOME KEY FUND STATISTICS AS OF 7/31/2025?
Fund’s net assets |
$ 349,939,143 |
Number of fund holdings |
397 |
Total advisory fees paid for the year |
$ 2,180,736 |
Portfolio turnover rate for the year |
122% |
WHA
TIndustry Classification |
% of Net Assets |
Banks |
17.5% |
Affiliated Mutual Fund - Short-Term Investment (5.9% represents investments purchased with collateral from securities on loan) |
6.1% |
Oil, Gas & Consumable Fuels |
5.2% |
Insurance |
4.3% |
Electronic Equipment, Instruments & Components |
3.8% |
Machinery |
3.5% |
Commercial Services & Supplies |
3.3% |
Construction & Engineering |
3.1% |
Hotel & Resort REITs |
2.8% |
Pharmaceuticals |
2.7% |
Biotechnology |
2.7% |
Financial Services |
2.6% |
Software |
2.4% |
Gas Utilities |
2.2% |
Specialty Retail |
2.0% |
Health Care Providers & Services |
2.0% |
Real Estate Management & Development |
1.9% |
Multi-Utilities |
1.8% |
Consumer Finance |
1.8% |
Metals & Mining |
1.8% |
Electrical Equipment |
1.7% |
Food Products |
1.7% |
Diversified Consumer Services |
1.6% |
Automobile Components |
1.5% |
Energy Equipment & Services |
1.4% |
Marine Transportation |
1.3% |
Building Products |
1.2% |
Industry Classification |
% of Net Assets |
Electric Utilities |
1.2% |
Trading Companies & Distributors |
1.2% |
Passenger Airlines |
1.2% |
Media |
1.2% |
Specialized REITs |
1.1% |
Personal Care Products |
1.1% |
Office REITs |
1.1% |
Industrial REITs |
1.0% |
Containers & Packaging |
0.9% |
Diversified REITs |
0.9% |
Chemicals |
0.9% |
Textiles, Apparel & Luxury Goods |
0.9% |
Life Sciences Tools & Services |
0.8% |
Professional Services |
0.8% |
Consumer Staples Distribution & Retail |
0.8% |
Communications Equipment |
0.8% |
Semiconductors & Semiconductor Equipment |
0.7% |
Retail REITs |
0.7% |
Mortgage Real Estate Investment Trusts (REITs) |
0.7% |
Hotels, Restaurants & Leisure |
0.6% |
Unaffiliated Exchange-Traded Funds |
0.6% |
Health Care Equipment & Supplies |
0.6% |
Others* |
2.3% |
106.0% | |
Liabilities in excess of other assets |
(6.0)% |
100.0% |
* |
Consists of Industries that each make up less than 0.5% of the Fund's net assets |
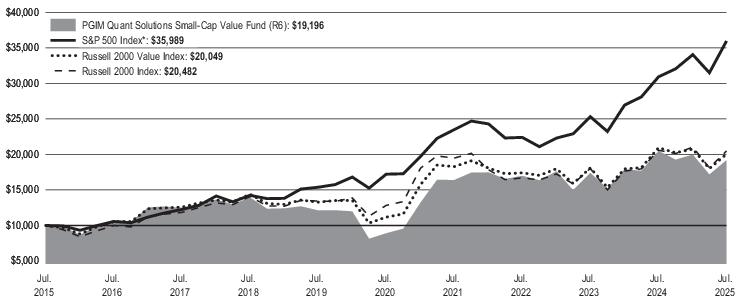
This annual shareholder report contains important information about the Class R6 shares of PGIM Quant Solutions Small-Cap Value Fund (the
“Fund”) for the period of August 1, 2024 to July 31, 2025.
You can find additional information about the Fund at
pgim.com/investments/mutual-funds/prospectuses-fact-sheets
. You can also request
this information by contacting us at (800) 225-1852 or (973) 367-3529 from outside the US.
WHAT WERE THE FUND COSTS FOR THE LAST YEAR?
(Based on a hypothetical $10,000 investment)
Costs of a $10,000 investment |
Costs paid as a percentage of a $10,000 investment | |
PGIM Quant Solutions Small-Cap Value Fund—Class R6 |
$66 |
0.68% |
WHAT AFFECTED THE FUND’S PERFORMANCE DURING THE REPORTING PERIOD?
■
Market gains continued to be fueled by large-cap stocks, which outperformed small-cap names by over 17% during the reporting period. US
small-cap stocks (as measured by the Russell 2000 Index) declined 0.55%, while large-cap stocks (as measured by the Russell 1000 Index)
gained 16.54%. Additionally, growth stocks continued to outpace value stocks. Although this gap was most significant among large-caps, the
Russell 2000 Value Index (-4.27%) trailed the Russell 2000 Growth Index (3.15%) by over 7%.
■
PGIM Quantitative Solutions’ focus on stocks with low valuations and attractive business prospects drove underperformance, as the Fund
lagged the Russell 2000 Value Index in seven of the 11 economic sectors.
■
The most significant detractors relative to the Russell 2000 Value Index were positions across multiple industries in the materials,
communication services, and information technology sectors.
■
The most substantial positive contributions came from financials, driven by PGIM Quantitative Solutions’ positioning among insurance and
financial services companies.
Average Annual Total Returns as of 7/31/2025 | |||
One Year (%) |
Five Years (%) |
Ten Years (%) | |
Class R6 |
-6.31% |
16.61% |
6.74% |
S&P 500 Index* |
16.33% |
15.88% |
13.66% |
Russell 2000 Value Index |
-4.27% |
12.41% |
7.20% |
Russell 2000 Index |
-0.55% |
9.81% |
7.43% |
*The Fund compares its performance against this broad-based index in response to regulatory requirements.
The returns do not reflect the deduction of
taxes that a shareholder would pay on Fund distributions or redemption of Fund shares.
Visit
pgim.com/investments/mutual-funds/prospectuses-fact-sheets
or call (800) 225-1852 or (973) 367-3529 from outside the US for more recent performance data.
WHAT ARE SOME KEY FUND STATISTICS AS OF 7/31/2025?
Fund’s net assets |
$ 349,939,143 |
Number of fund holdings |
397 |
Total advisory fees paid for the year |
$ 2,180,736 |
Portfolio turnover rate for the year |
122% |
WHAT
ARE SOME CHARACTERISTICS
OF THE FUND’S HOLDINGS AS OF 7/31/2025?Industry Classification |
% of Net Assets |
Banks |
17.5% |
Affiliated Mutual Fund - Short-Term Investment (5.9% represents investments purchased with collateral from securities on loan) |
6.1% |
Oil, Gas & Consumable Fuels |
5.2% |
Insurance |
4.3% |
Electronic Equipment, Instruments & Components |
3.8% |
Machinery |
3.5% |
Commercial Services & Supplies |
3.3% |
Construction & Engineering |
3.1% |
Hotel & Resort REITs |
2.8% |
Pharmaceuticals |
2.7% |
Biotechnology |
2.7% |
Financial Services |
2.6% |
Software |
2.4% |
Gas Utilities |
2.2% |
Specialty Retail |
2.0% |
Health Care Providers & Services |
2.0% |
Real Estate Management & Development |
1.9% |
Multi-Utilities |
1.8% |
Consumer Finance |
1.8% |
Metals & Mining |
1.8% |
Electrical Equipment |
1.7% |
Food Products |
1.7% |
Diversified Consumer Services |
1.6% |
Automobile Components |
1.5% |
Energy Equipment & Services |
1.4% |
Marine Transportation |
1.3% |
Building Products |
1.2% |
Industry Classification |
% of Net Assets |
Electric Utilities |
1.2% |
Trading Companies & Distributors |
1.2% |
Passenger Airlines |
1.2% |
Media |
1.2% |
Specialized REITs |
1.1% |
Personal Care Products |
1.1% |
Office REITs |
1.1% |
Industrial REITs |
1.0% |
Containers & Packaging |
0.9% |
Diversified REITs |
0.9% |
Chemicals |
0.9% |
Textiles, Apparel & Luxury Goods |
0.9% |
Life Sciences Tools & Services |
0.8% |
Professional Services |
0.8% |
Consumer Staples Distribution & Retail |
0.8% |
Communications Equipment |
0.8% |
Semiconductors & Semiconductor Equipment |
0.7% |
Retail REITs |
0.7% |
Mortgage Real Estate Investment Trusts (REITs) |
0.7% |
Hotels, Restaurants & Leisure |
0.6% |
Unaffiliated Exchange-Traded Funds |
0.6% |
Health Care Equipment & Supplies |
0.6% |
Others* |
2.3% |
106.0% | |
Liabilities in excess of other assets |
(6.0)% |
100.0% |
* |
Consists of Industries that each make up less than 0.5% of the Fund's net assets |
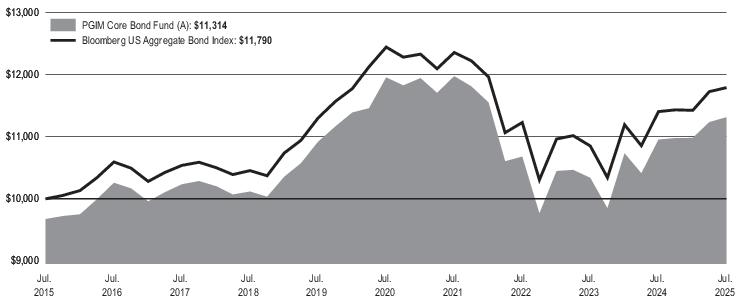
This annual shareholder report contains important information about the Class A shares of PGIM Core Bond Fund (the “Fund”) for the period of
August 1, 2024 to July 31, 2025.
You can find additional information about the Fund at
pgim.com/investments/mutual-funds/prospectuses-fact-sheets
. You can also request
this information by contacting us at (800) 225-1852 or (973) 367-3529 from outside the US.
This report describes changes to the Fund that occurred during the reporting period.
WHAT WERE THE FUND COSTS FOR THE LAST YEAR?
(Based on a hypothetical $10,000 investment)
Costs of a $10,000 investment |
Costs paid as a percentage of a $10,000 investment | |
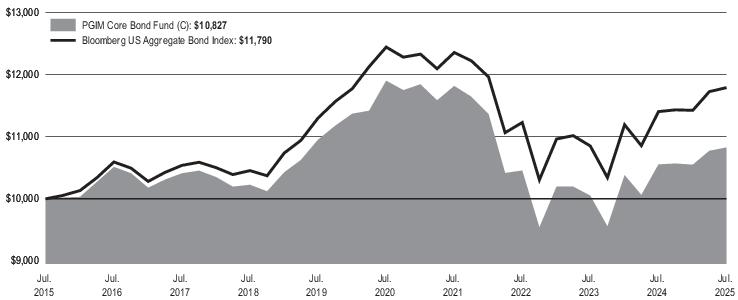
PGIM Core Bond Fund—Class A |
$66 |
0.65% |
WHAT AFFECTED THE FUND’S PERFORMANCE DURING THE REPORTING PERIOD?
■
During the reporting period, credit spreads across a broad spectrum of fixed income asset classes generally tightened, recovering from the US
administration’s announcement of reciprocal tariffs on April 2, 2025. The US Federal Reserve's easing cycle, which began with three rate cuts
in the second half of 2024, was paused in the first half of 2025 amid increased uncertainty over the impact of US policy changes on the
domestic labor market and inflation. Indeed, Core PCE came in higher than expected for the reporting period. In addition, revisions to the
non-farm payroll report in July 2025 revealed a weaker labor market than previously indicated, causing investors to reprice their expectations
for a September rate cut and a steepening of the US Treasury yield curve. (A yield curve is a line graph that illustrates the relationship between
the yields and maturities of fixed income securities. It is created by plotting the yields of different maturities for the same type of bonds.)
■
The following strategies contributed most to the Fund’s performance during the reporting period: overweights relative to the Index in the AAA
non-agency commercial mortgage-backed securities (CMBS), AAA collateralized loan obligations (CLO), and US investment-grade corporate
sectors; security selection in AAA CLOs, AAA non-agency CMBS, US Treasuries, asset-backed securities (ABS), and US investment-grade
corporates; credit positioning in banking, aerospace & defense, and technology.
■
The following strategies detracted from performance during the period: duration positioning and security selection in MBS.
■
The Fund uses derivatives to facilitate the implementation of the overall investment approach. During the reporting period, the Fund used
swaps, options, and futures to help manage duration positioning and yield curve exposure. In aggregate, these positions detracted
from performance.
Average Annual Total Returns as of 7/31/2025 | |||
One Year (%) |
Five Years (%) |
Ten Years (%) | |
Class A with sales charges |
-0.07% |
-1.75% |
1.24% |
Class A without sales charges |
3.28% |
-1.10% |
1.58% |
Bloomberg US Aggregate Bond Index |
3.38% |
-1.07% |
1.66% |
The returns do not reflect the deduction of
taxes that a shareholder would pay on Fund distributions or redemption of Fund shares.
Visit
pgim.com/investments/mutual-funds/prospectuses-fact-sheets
or call (800) 225-1852 or (973) 367-3529 from outside the US for more recent performance data.
WHAT ARE SOME KEY FUND STATISTICS AS OF 7/31/2025?
Fund’s net assets |
$ 2,252,570,714 |
Number of fund holdings |
1,292 |
Total advisory fees paid for the year |
$ 5,750,030 |
Portfolio turnover rate for the year |
121% |
WHAT ARE SOME CHARACTERISTICS OF THE FUND’S HOLDINGS AS OF 7/31/2025?
Credit Quality expressed as a percentage of total investments as of 7/31/2025 (%) | |
AAA |
32.7 |
AA |
36.3 |
A |
10.3 |
BBB |
14.8 |
BB |
1.8 |
B |
0.3 |
Not Rated |
4.7 |
Cash/Cash Equivalents |
(0.8) |
Total |
100.0 |
Credit ratings reflect the highest rating assigned by a nationally recognized statistical rating organization (NRSRO) such as Moody’s Investors Service, Inc. (Moody’s), S&P Global
Ratings (S&P), or Fitch Ratings, Inc. (Fitch). Credit ratings reflect the common nomenclature used by both S&P and Fitch. Where applicable, ratings are converted to the comparable
S&P/Fitch rating tier nomenclature. The Not Rated category consists of securities that have not been rated by an NRSRO. Credit ratings are subject to change. Values may not sum to
100.0% due to rounding.
WERE THERE ANY SIGNIFICANT CHANGES TO THE FUND THIS YEAR?
The following is a summary of certain changes to the Fund since August 1, 2024:
■
Effective April 7, 2025, the Fund’s investment strategy was revised to clarify that the Fund may invest up to 5% of its investable assets in below
investment-grade securities. At this time, the Fund's principal risk disclosure was revised to include
“
Junk Bonds Risk
”
as a principal risk of the
Fund.
For more complete information, you should review the Fund’s next prospectus, which we expect to be available by September 29, 2025 at
pgim.com/investments/mutual-funds/prospectuses-fact-sheets or by request at (800) 225-1852.
This annual shareholder report contains important information about the Class C shares of PGIM Core Bond Fund (the “Fund”) for the period of
August 1, 2024 to July 31, 2025.
You can find additional information about the Fund at
pgim.com/investments/mutual-funds/prospectuses-fact-sheets
. You can also request
this information by contacting us at (800) 225-1852 or (973) 367-3529 from outside the US.
This report describes changes to the Fund that occurred during the reporting period.
WHAT WERE THE FUND COSTS FOR THE LAST YEAR?
(Based on a hypothetical $10,000 investment)
Costs of a $10,000 investment |
Costs paid as a percentage of a $10,000 investment | |
PGIM Core Bond Fund—Class C |
$147 |
1.45% |
WHAT AFFECTED THE FUND’S PERFORMANCE DURING THE REPORTING PERIOD?
■
During the reporting period, credit spreads across a broad spectrum of fixed income asset classes generally tightened, recovering from the US
administration’s announcement of reciprocal tariffs on April 2, 2025. The US Federal Reserve's easing cycle, which began with three rate cuts
in the second half of 2024, was paused in the first half of 2025 amid increased uncertainty over the impact of US policy changes on the
domestic labor market and inflation. Indeed, Core PCE came in higher than expected for the reporting period. In addition, revisions to the
non-farm payroll report in July 2025 revealed a weaker labor market than previously indicated, causing investors to reprice their expectations
for a September rate cut and a steepening of the US Treasury yield curve. (A yield curve is a line graph that illustrates the relationship between
the yields and maturities of fixed income securities. It is created by plotting the yields of different maturities for the same type of bonds.)
■
The following strategies contributed most to the Fund’s performance during the reporting period: overweights relative to the Index in the AAA
non-agency commercial mortgage-backed securities (CMBS), AAA collateralized loan obligations (CLO), and US investment-grade corporate
sectors; security selection in AAA CLOs, AAA non-agency CMBS, US Treasuries, asset-backed securities (ABS), and US investment-grade
corporates; credit positioning in banking, aerospace & defense, and technology.
■
The following strategies detracted from performance during the period: duration positioning and security selection in MBS.
■
The Fund uses derivatives to facilitate the implementation of the overall investment approach. During the reporting period, the Fund used
swaps, options, and futures to help manage duration positioning and yield curve exposure. In aggregate, these positions detracted
from performance.
Average Annual Total Returns as of 7/31/2025 | |||
One Year (%) |
Five Years (%) |
Ten Years (%) | |
Class C with sales charges |
1.59% |
-1.88% |
0.80% |
Class C without sales charges |
2.58% |
-1.88% |
0.80% |
Bloomberg US Aggregate Bond Index |
3.38% |
-1.07% |
1.66% |
The returns do not reflect the deduction of
taxes that a shareholder would pay on Fund distributions or redemption of Fund shares.
Visit
pgim.com/investments/mutual-funds/prospectuses-fact-sheets
or call (800) 225-1852 or (973) 367-3529 from outside the US for more recent performance data.
WHAT ARE SOME KEY FUND STATISTICS AS OF 7/31/2025?
Fund’s net assets |
$ 2,252,570,714 |
Number of fund holdings |
1,292 |
Total advisory fees paid for the year |
$ 5,750,030 |
Portfolio turnover rate for the year |
121% |
WHAT ARE SOME CHARACTERISTICS OF THE FUND’S HOLDINGS AS OF 7/31/2025?
Credit Quality expressed as a percentage of total investments as of 7/31/2025 (%) | |
AAA |
32.7 |
AA |
36.3 |
A |
10.3 |
BBB |
14.8 |
BB |
1.8 |
B |
0.3 |
Not Rated |
4.7 |
Cash/Cash Equivalents |
(0.8) |
Total |
100.0 |
Credit ratings reflect the highest rating assigned by a nationally recognized statistical rating organization (NRSRO) such as Moody’s Investors Service, Inc. (Moody’s), S&P Global
Ratings (S&P), or Fitch Ratings, Inc. (Fitch). Credit ratings reflect the common nomenclature used by both S&P and Fitch. Where applicable, ratings are converted to the comparable
S&P/Fitch rating tier nomenclature. The Not Rated category consists of securities that have not been rated by an NRSRO. Credit ratings are subject to change. Values may not sum to
100.0% due to rounding.
Credit ratings reflect the highest rating assigned by a nationally recognized statistical rating organization (NRSRO) such as Moody’s Investors Service, Inc. (Moody’s), S&P Global
Ratings (S&P), or Fitch Ratings, Inc. (Fitch). Credit ratings reflect the common nomenclature used by both S&P and Fitch. Where applicable, ratings are converted to the comparable
S&P/Fitch rating tier nomenclature. The Not Rated category consists of securities that have not been rated by an NRSRO. Credit ratings are subject to change. Values may not sum to
100.0% due to rounding.
WERE THERE ANY SIGNIFICANT CHANGES TO THE FUND THIS YEAR?
The following is a summary of certain changes to the Fund since August 1, 2024:
■
Effective April 7, 2025, the Fund’s investment strategy was revised to clarify that the Fund may invest up to 5% of its investable assets in below
investment-grade securities. At this time, the Fund's principal risk disclosure was revised to include
“
Junk Bonds Risk
”
as a principal risk of the
Fund.
For more complete information, you should review the Fund’s next prospectus, which we expect to be available by September 29, 2025 at
pgim.com/investments/mutual-funds/prospectuses-fact-sheets or by request at (800) 225-1852.
WERE THERE ANY SIGNIFICANT CHANGES TO THE FUND THIS YEAR?
The following is a summary of certain changes to the Fund since August 1, 2024:
■
Effective April 7, 2025, the Fund’s investment strategy was revised to clarify that the Fund may invest up to 5% of its investable assets in below
investment-grade securities. At this time, the Fund's principal risk disclosure was revised to include
“
Junk Bonds Risk
”
as a principal risk of the
Fund.
For more complete information, you should review the Fund’s next prospectus, which we expect to be available by September 29, 2025 at
pgim.com/investments/mutual-funds/prospectuses-fact-sheets or by request at (800) 225-1852.
This annual shareholder report contains important information about the Class R shares of PGIM Core Bond Fund (the “Fund”) for the period of
August 1, 2024 to July 31, 2025.
You can find additional information about the Fund at
pgim.com/investments/mutual-funds/prospectuses-fact-sheets
. You can also request
this information by contacting us at (800) 225-1852 or (973) 367-3529 from outside the US.
This report describes changes to the Fund that occurred during the reporting period.
WHAT WERE THE FUND COSTS FOR THE LAST YEAR?
(Based on a hypothetical $10,000 investment)
Costs of a $10,000 investment |
Costs paid as a percentage of a $10,000 investment | |
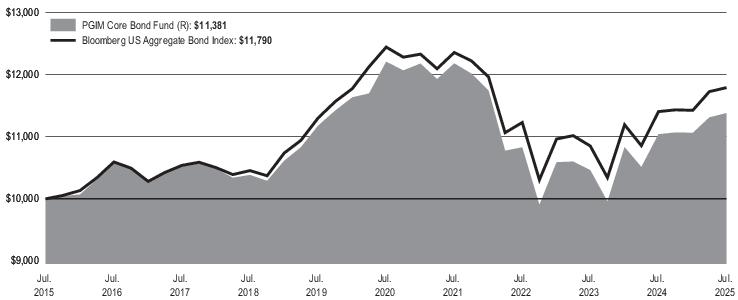
PGIM Core Bond Fund—Class R |
$96 |
0.95% |
WHAT AFFECTED THE FUND’S PERFORMANCE DURING THE REPORTING PERIOD?
■
During the reporting period, credit spreads across a broad spectrum of fixed income asset classes generally tightened, recovering from the US
administration’s announcement of reciprocal tariffs on April 2, 2025. The US Federal Reserve's easing cycle, which began with three rate cuts
in the second half of 2024, was paused in the first half of 2025 amid increased uncertainty over the impact of US policy changes on the
domestic labor market and inflation. Indeed, Core PCE came in higher than expected for the reporting period. In addition, revisions to the
non-farm payroll report in July 2025 revealed a weaker labor market than previously indicated, causing investors to reprice their expectations
for a September rate cut and a steepening of the US Treasury yield curve. (A yield curve is a line graph that illustrates the relationship between
the yields and maturities of fixed income securities. It is created by plotting the yields of different maturities for the same type of bonds.)
■
The following strategies contributed most to the Fund’s performance during the reporting period: overweights relative to the Index in the AAA
non-agency commercial mortgage-backed securities (CMBS), AAA collateralized loan obligations (CLO), and US investment-grade corporate
sectors; security selection in AAA CLOs, AAA non-agency CMBS, US Treasuries, asset-backed securities (ABS), and US investment-grade
corporates; credit positioning in banking, aerospace & defense, and technology.
■
The following strategies detracted from performance during the period: duration positioning and security selection in MBS.
■
The Fund uses derivatives to facilitate the implementation of the overall investment approach. During the reporting period, the Fund used
swaps, options, and futures to help manage duration positioning and yield curve exposure. In aggregate, these positions detracted
from performance.
Average Annual Total Returns as of 7/31/2025 | |||
One Year (%) |
Five Years (%) |
Ten Years (%) | |
Class R |
3.09% |
-1.39% |
1.30% |
Bloomberg US Aggregate Bond Index |
3.38% |
-1.07% |
1.66% |
The returns do not reflect the deduction of
taxes that a shareholder would pay on Fund distributions or redemption of Fund shares.
Visit
pgim.com/investments/mutual-funds/prospectuses-fact-sheets
or call (800) 225-1852 or (973) 367-3529 from outside the US for more recent performance data.
WHAT ARE SOME KEY FUND STATISTICS AS OF 7/31/2025?
Fund’s net assets |
$ 2,252,570,714 |
Number of fund holdings |
1,292 |
Total advisory fees paid for the year |
$ 5,750,030 |
Portfolio turnover rate for the year |
121% |
WHAT ARE SOME CHARACTERISTICS OF THE FUND’S HOLDINGS AS OF 7/31/2025?
Credit Quality expressed as a percentage of total investments as of 7/31/2025 (%) | |
AAA |
32.7 |
AA |
36.3 |
A |
10.3 |
BBB |
14.8 |
BB |
1.8 |
B |
0.3 |
Not Rated |
4.7 |
Cash/Cash Equivalents |
(0.8) |
Total |
100.0 |
Credit ratings reflect the highest rating assigned by a nationally recognized statistical rating organization (NRSRO) such as Moody’s Investors Service, Inc. (Moody’s), S&P Global
Ratings (S&P), or Fitch Ratings, Inc. (Fitch). Credit ratings reflect the common nomenclature used by both S&P and Fitch. Where applicable, ratings are converted to the comparable
S&P/Fitch rating tier nomenclature. The Not Rated category consists of securities that have not been rated by an NRSRO. Credit ratings are subject to change. Values may not sum to
100.0% due to rounding.
Credit ratings reflect the highest rating assigned by a nationally recognized statistical rating organization (NRSRO) such as Moody’s Investors Service, Inc. (Moody’s), S&P Global
Ratings (S&P), or Fitch Ratings, Inc. (Fitch). Credit ratings reflect the common nomenclature used by both S&P and Fitch. Where applicable, ratings are converted to the comparable
S&P/Fitch rating tier nomenclature. The Not Rated category consists of securities that have not been rated by an NRSRO. Credit ratings are subject to change. Values may not sum to
100.0% due to rounding.
WERE THERE ANY SIGNIFICANT CHANGES TO THE FUND THIS YEAR?
The following is a summary of certain changes to the Fund since August 1, 2024:
■
Effective April 7, 2025, the Fund’s investment strategy was revised to clarify that the Fund may invest up to 5% of its investable assets in below
investment-grade securities. At this time, the Fund's principal risk disclosure was revised to include
“
Junk Bonds Risk
”
as a principal risk of the
Fund.
For more complete information, you should review the Fund’s next prospectus, which we expect to be available by September 29, 2025 at
pgim.com/investments/mutual-funds/prospectuses-fact-sheets or by request at (800) 225-1852.
WERE THERE ANY SIGNIFICANT CHANGES TO THE FUND THIS YEAR?
The following is a summary of certain changes to the Fund since August 1, 2024:
■
Effective April 7, 2025, the Fund’s investment strategy was revised to clarify that the Fund may invest up to 5% of its investable assets in below
investment-grade securities. At this time, the Fund's principal risk disclosure was revised to include
“
Junk Bonds Risk
”
as a principal risk of the
Fund.
For more complete information, you should review the Fund’s next prospectus, which we expect to be available by September 29, 2025 at
pgim.com/investments/mutual-funds/prospectuses-fact-sheets or by request at (800) 225-1852.
This annual shareholder report contains important information about the Class Z shares of PGIM Core Bond Fund (the “Fund”) for the period of
August 1, 2024 to July 31, 2025.
You can find additional information about the Fund at
pgim.com/investments/mutual-funds/prospectuses-fact-sheets
. You can also request
this information by contacting us at (800) 225-1852 or (973) 367-3529 from outside the US.
This report describes changes to the Fund that occurred during the reporting period.
WHAT WERE THE FUND COSTS FOR THE LAST YEAR?
(Based on a hypothetical $10,000 investment)
Costs of a $10,000 investment |
Costs paid as a percentage of a $10,000 investment | |
PGIM Core Bond Fund—Class Z |
$34 |
0.33% |
WHAT AFFECTED THE FUND’S PERFORMANCE DURING THE REPORTING PERIOD?
■
During the reporting period, credit spreads across a broad spectrum of fixed income asset classes generally tightened, recovering from the US
administration’s announcement of reciprocal tariffs on April 2, 2025. The US Federal Reserve's easing cycle, which began with three rate cuts
in the second half of 2024, was paused in the first half of 2025 amid increased uncertainty over the impact of US policy changes on the
domestic labor market and inflation. Indeed, Core PCE came in higher than expected for the reporting period. In addition, revisions to the
non-farm payroll report in July 2025 revealed a weaker labor market than previously indicated, causing investors to reprice their expectations
for a September rate cut and a steepening of the US Treasury yield curve. (A yield curve is a line graph that illustrates the relationship between
the yields and maturities of fixed income securities. It is created by plotting the yields of different maturities for the same type of bonds.)
■
The following strategies contributed most to the Fund’s performance during the reporting period: overweights relative to the Index in the AAA
non-agency commercial mortgage-backed securities (CMBS), AAA collateralized loan obligations (CLO), and US investment-grade corporate
sectors; security selection in AAA CLOs, AAA non-agency CMBS, US Treasuries, asset-backed securities (ABS), and US investment-grade
corporates; credit positioning in banking, aerospace & defense, and technology.
■
The following strategies detracted from performance during the period: duration positioning and security selection in MBS.
■
The Fund uses derivatives to facilitate the implementation of the overall investment approach. During the reporting period, the Fund used
swaps, options, and futures to help manage duration positioning and yield curve exposure. In aggregate, these positions detracted
from performance.

Average Annual Total Returns as of 7/31/2025 | |||
One Year (%) |
Five Years (%) |
Ten Years (%) | |
Class Z |
3.61% |
-0.80% |
1.88% |
Bloomberg US Aggregate Bond Index |
3.38% |
-1.07% |
1.66% |
The returns do not reflect the deduction of
taxes that a shareholder would pay on Fund distributions or redemption of Fund shares.
Visit
pgim.com/investments/mutual-funds/prospectuses-fact-sheets
or call (800) 225-1852 or (973) 367-3529 from outside the US for more recent performance data.
WHAT ARE SOME KEY FUND STATISTICS AS OF 7/31/2025?
Fund’s net assets |
$ 2,252,570,714 |
Number of fund holdings |
1,292 |
Total advisory fees paid for the year |
$ 5,750,030 |
Portfolio turnover rate for the year |
121% |
WHAT ARE SOME CHARACTERISTICS OF THE FUND’S HOLDINGS AS OF 7/31/2025?
Credit Quality expressed as a percentage of total investments as of 7/31/2025 (%) | |
AAA |
32.7 |
AA |
36.3 |
A |
10.3 |
BBB |
14.8 |
BB |
1.8 |
B |
0.3 |
Not Rated |
4.7 |
Cash/Cash Equivalents |
(0.8) |
Total |
100.0 |
Credit ratings reflect the highest rating assigned by a nationally recognized statistical rating organization (NRSRO) such as Moody’s Investors Service, Inc. (Moody’s), S&P Global
Ratings (S&P), or Fitch Ratings, Inc. (Fitch). Credit ratings reflect the common nomenclature used by both S&P and Fitch. Where applicable, ratings are converted to the comparable
S&P/Fitch rating tier nomenclature. The Not Rated category consists of securities that have not been rated by an NRSRO. Credit ratings are subject to change. Values may not sum to
100.0% due to rounding.
Credit ratings reflect the highest rating assigned by a nationally recognized statistical rating organization (NRSRO) such as Moody’s Investors Service, Inc. (Moody’s), S&P Global
Ratings (S&P), or Fitch Ratings, Inc. (Fitch). Credit ratings reflect the common nomenclature used by both S&P and Fitch. Where applicable, ratings are converted to the comparable
S&P/Fitch rating tier nomenclature. The Not Rated category consists of securities that have not been rated by an NRSRO. Credit ratings are subject to change. Values may not sum to
100.0% due to rounding.
WERE THERE ANY SIGNIFICANT CHANGES TO THE FUND THIS YEAR?
The following is a summary of certain changes to the Fund since August 1, 2024:
■
Effective April 7, 2025, the Fund’s investment strategy was revised to clarify that the Fund may invest up to 5% of its investable assets in below
investment-grade securities. At this time, the Fund's principal risk disclosure was revised to include
“
Junk Bonds Risk
”
as a principal risk of the
Fund.
For more complete information, you should review the Fund’s next prospectus, which we expect to be available by September 29, 2025 at
pgim.com/investments/mutual-funds/prospectuses-fact-sheets or by request at (800) 225-1852.
WERE THERE ANY SIGNIFICANT CHANGES TO THE FUND THIS YEAR?
The following is a summary of certain changes to the Fund since August 1, 2024:
■
Effective April 7, 2025, the Fund’s investment strategy was revised to clarify that the Fund may invest up to 5% of its investable assets in below
investment-grade securities. At this time, the Fund's principal risk disclosure was revised to include
“
Junk Bonds Risk
”
as a principal risk of the
Fund.
For more complete information, you should review the Fund’s next prospectus, which we expect to be available by September 29, 2025 at
pgim.com/investments/mutual-funds/prospectuses-fact-sheets or by request at (800) 225-1852.
This annual shareholder report contains important information about the Class R6 shares of PGIM Core Bond Fund (the “Fund”) for the period of
August 1, 2024 to July 31, 2025.
You can find additional information about the Fund at
pgim.com/investments/mutual-funds/prospectuses-fact-sheets
. You can also request
this information by contacting us at (800) 225-1852 or (973) 367-3529 from outside the US.
This report describes changes to the Fund that occurred during the reporting period.
WHAT WERE THE FUND COSTS FOR THE LAST YEAR?
(Based on a hypothetical $10,000 investment)
Costs of a $10,000 investment |
Costs paid as a percentage of a $10,000 investment | |
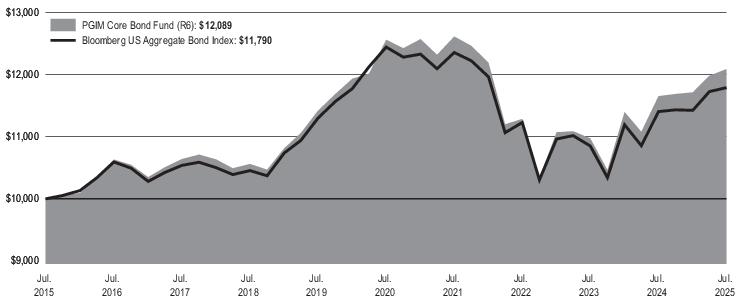
PGIM Core Bond Fund—Class R6 |
$33 |
0.32% |
WHAT
AFFECTED THE FUND’S PERFORMANCE DURING THE REPORTING PERIOD?■
During the reporting period, credit spreads across a broad spectrum of fixed income asset classes generally tightened, recovering from the US
administration’s announcement of reciprocal tariffs on April 2, 2025. The US Federal Reserve's easing cycle, which began with three rate cuts
in the second half of 2024, was paused in the first half of 2025 amid increased uncertainty over the impact of US policy changes on the
domestic labor market and inflation. Indeed, Core PCE came in higher than expected for the reporting period. In addition, revisions to the
non-farm payroll report in July 2025 revealed a weaker labor market than previously indicated, causing investors to reprice their expectations
for a September rate cut and a steepening of the US Treasury yield curve. (A yield curve is a line graph that illustrates the relationship between
the yields and maturities of fixed income securities. It is created by plotting the yields of different maturities for the same type of bonds.)
■
The following strategies contributed most to the Fund’s performance during the reporting period: overweights relative to the Index in the AAA
non-agency commercial mortgage-backed securities (CMBS), AAA collateralized loan obligations (CLO), and US investment-grade corporate
sectors; security selection in AAA CLOs, AAA non-agency CMBS, US Treasuries, asset-backed securities (ABS), and US investment-grade
corporates; credit positioning in banking, aerospace & defense, and technology.
■
The following strategies detracted from performance during the period: duration positioning and security selection in MBS.
■
The Fund uses derivatives to facilitate the implementation of the overall investment approach. During the reporting period, the Fund used
swaps, options, and futures to help manage duration positioning and yield curve exposure. In aggregate, these positions detracted
from performance.
Average Annual Total Returns as of 7/31/2025 | |||
One Year (%) |
Five Years (%) |
Ten Years (%) | |
Class R6 |
3.74% |
-0.76% |
1.92% |
Bloomberg US Aggregate Bond Index |
3.38% |
-1.07% |
1.66% |
The returns do not reflect the deduction of
taxes that a shareholder would pay on Fund distributions or redemption of Fund shares.
Visit
pgim.com/investments/mutual-funds/prospectuses-fact-sheets
or call (800) 225-1852 or (973) 367-3529 from outside the US for more recent performance data.
WHAT ARE SOME KEY FUND STATISTICS AS OF 7/31/2025?
Fund’s net assets |
$ 2,252,570,714 |
Number of fund holdings |
1,292 |
Total advisory fees paid for the year |
$ 5,750,030 |
Portfolio turnover rate for the year |
121% |
WHAT ARE SOME CHARACTERISTICS OF THE FUND’S HOLDINGS AS OF 7/31/2025?
Credit Quality expressed as a percentage of total investments as of 7/31/2025 (%) | |
AAA |
32.7 |
AA |
36.3 |
A |
10.3 |
BBB |
14.8 |
BB |
1.8 |
B |
0.3 |
Not Rated |
4.7 |
Cash/Cash Equivalents |
(0.8) |
Total |
100.0 |
Credit ratings reflect the highest rating assigned by a nationally recognized statistical rating organization (NRSRO) such as Moody’s Investors Service, Inc. (Moody’s), S&P Global
Ratings (S&P), or Fitch Ratings, Inc. (Fitch). Credit ratings reflect the common nomenclature used by both S&P and Fitch. Where applicable, ratings are converted to the comparable
S&P/Fitch rating tier nomenclature. The Not Rated category consists of securities that have not been rated by an NRSRO. Credit ratings are subject to change. Values may not sum to
100.0% due to rounding.
Credit ratings reflect the highest rating assigned by a nationally recognized statistical rating organization (NRSRO) such as Moody’s Investors Service, Inc. (Moody’s), S&P Global
Ratings (S&P), or Fitch Ratings, Inc. (Fitch). Credit ratings reflect the common nomenclature used by both S&P and Fitch. Where applicable, ratings are converted to the comparable
S&P/Fitch rating tier nomenclature. The Not Rated category consists of securities that have not been rated by an NRSRO. Credit ratings are subject to change. Values may not sum to
100.0% due to rounding.
WERE THERE ANY SIGNIFICANT CHANGES TO THE FUND THIS YEAR?
The following is a summary of certain changes to the Fund since August 1, 2024:
■
Effective April 7, 2025, the Fund’s investment strategy was revised to clarify that the Fund may invest up to 5% of its investable assets in below
investment-grade securities. At this time, the Fund's principal risk disclosure was revised to include
“
Junk Bonds Risk
”
as a principal risk of the
Fund.
For more complete information, you should review the Fund’s next prospectus, which we expect to be available by September 29, 2025 at
pgim.com/investments/mutual-funds/prospectuses-fact-sheets or by request at (800) 225-1852.
WERE THERE ANY SIGNIFICANT CHANGES TO THE FUND THIS YEAR?
The following is a summary of certain changes to the Fund since August 1, 2024:
■
Effective April 7, 2025, the Fund’s investment strategy was revised to clarify that the Fund may invest up to 5% of its investable assets in below
investment-grade securities. At this time, the Fund's principal risk disclosure was revised to include
“
Junk Bonds Risk
”
as a principal risk of the
Fund.
For more complete information, you should review the Fund’s next prospectus, which we expect to be available by September 29, 2025 at
pgim.com/investments/mutual-funds/prospectuses-fact-sheets or by request at (800) 225-1852.