Performance Management - Global X Funds - Global X S&P 500 Covered Call ETF
Sep. 30, 2025
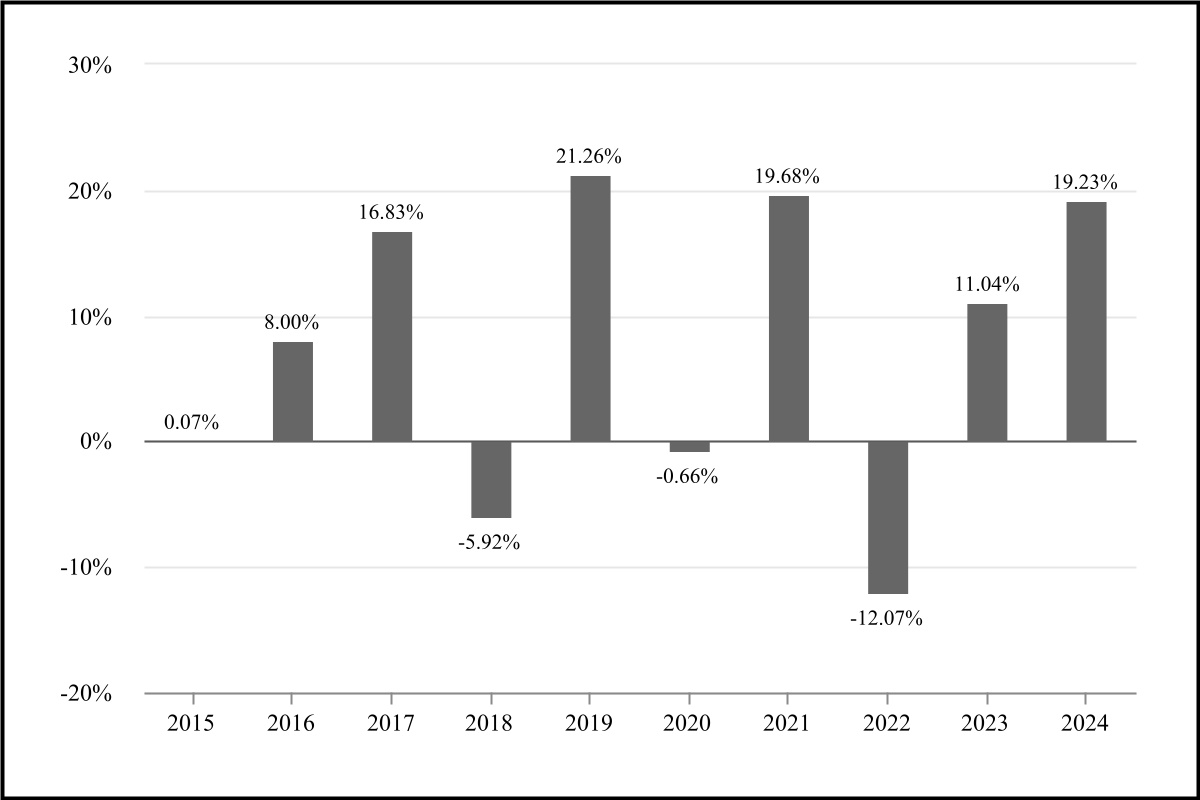
The bar chart and table that follow show how the Fund performed on a calendar year basis and provide an indication of the risks of investing in the Fund by showing changes in the Fund's performance from year to year and by showing how the Fund's average annual returns for the indicated periods compare with the Fund's broad-based benchmark index, which reflects a broad
measure of market performance, and the Underlying Index, which the Fund seeks to track. The Fund's past performance (before and after taxes) is not necessarily indicative of how the Fund will perform in the future. Updated performance information is available online at www.globalxetfs.com.
The Fund operated as the Horizons S&P 500® Covered Call ETF (the "Predecessor Fund"), a series of Horizons ETF Trust I, prior to the Fund's acquisition of the assets and assumption of the liabilities of the Predecessor Fund on December 24, 2018 (the "Reorganization"). As a result of the Reorganization, the Fund assumed the performance and accounting history of the Predecessor Fund. Accordingly, performance figures for the Fund for periods prior to the date of the Reorganization represent the performance of the Predecessor Fund.
| Best Quarter: | 3/31/2019 | 9.07% | ||||||
| Worst Quarter: | 3/31/2020 | -21.52% | ||||||