The fund’s investment objective is to provide you with current income exempt from regular federal income tax, consistent with the maturity and quality standards described in this prospectus, and to preserve capital.
This table describes the fees and expenses that you may pay if you buy, hold and sell shares of the fund. You may pay other fees, such as brokerage commissions and other fees to financial intermediaries, which are not reflected in the tables and examples below. For example, in addition to the fees and expenses described below, you may also be required to pay brokerage commissions on purchases and sales of Class F-2 or F-3 shares of the fund. You may qualify for sales charge discounts if you and your family invest, or agree to invest in the future, at least $100,000 in American Funds, Capital Group KKR Public-Private+ Funds, and/or Emerging Markets Equities Fund, Inc. (collectively “Capital Group Funds”). More information about these and other discounts is available from your financial professional, in the “Sales charge reductions and waivers” sections on page 49 of the prospectus and on page 91 of the fund’s statement of additional information, and in the sales charge waiver appendix to the prospectus.
| Shareholder fees (fees paid directly from your investment) | |||
| Share class: | A | T | All F share classes |
| Maximum sales charge (load) imposed on purchases (as a percentage of offering price) | 2.50% | 2.50% | none |
| Maximum deferred sales charge (load) (as a percentage of the amount redeemed) | 0.751 | none | none |
| Maximum sales charge (load) imposed on reinvested dividends | none | none | none |
| Redemption or exchange fees | none | none | none |
| Annual fund operating expenses (expenses that you pay each year as a percentage of the value of your investment) | |||||
| Share class: | A | T | F-1 | F-2 | F-3 |
| Management fees | 0.20% | 0.20% | 0.20% | 0.20% | 0.20% |
| Distribution and/or service (12b-1) fees | 0.15 | 0.25 | 0.25 | none | none |
| Other expenses | 0.09 | 0.09 | 0.18 | 0.12 | 0.05 |
| Total annual fund operating expenses | 0.44 | 0.54 | 0.63 | 0.32 | 0.25 |
| Expense reimbursement2 | 0.01 | 0.01 | 0.01 | 0.01 | 0.01 |
| Total annual fund operating expenses after expense reimbursement | 0.43 | 0.53 | 0.62 | 0.31 | 0.24 |
1 A contingent deferred sales charge of 0.75% applies on certain redemptions made within 18 months following purchases of $250,000 or more made without an initial sales charge. Contingent deferred sales charge is calculated based on the lesser of the offering price and market value of shares being sold.
2 The investment adviser is currently reimbursing a portion of the other expenses. This reimbursement will be in effect through at least October 1, 2026. The adviser may elect at its discretion to extend, modify or terminate the reimbursement at that time.
This example is intended to help you compare the cost of investing in the fund with the cost of investing in other mutual funds.
The example assumes that you invest $10,000 in the fund for the time periods indicated and then redeem or hold all of your shares at the end of those periods. The example also assumes that your investment has a 5% return each year and that the fund’s operating expenses remain the same. The example reflects the expense reimbursement described above through the expiration date of such reimbursement and total annual fund operating expenses thereafter. You may be required to pay brokerage commissions on your purchases and sales of Class F-2 or F-3 shares of the fund, which are not reflected in the example.
| Share class: | A | T | F-1 | F-2 | F-3 |
| 1 year | $293 | $303 | $63 | $32 | $25 |
| 3 years | 387 | 418 | 201 | 102 | 79 |
| 5 years | 489 | 543 | 350 | 179 | 140 |
| 10 years | 790 | 909 | 785 | 405 | 317 |
The fund pays transaction costs, such as commissions, when it buys and sells securities (or “turns over” its portfolio). A higher portfolio turnover rate may indicate higher transaction costs and may result in higher taxes when fund shares are held in a taxable account. These costs, which are not reflected in annual fund operating expenses or in the example, affect the fund’s investment results. During the most recent fiscal year, the fund’s portfolio turnover rate was 56% of the average value of its portfolio.
Under normal circumstances, the fund will invest at least 80% of its assets in, or derive at least 80% of its income from, securities that are exempt from regular federal income tax and that do not subject you to federal alternative minimum tax. The fund may also invest up to 20% of its assets in “private activity bonds” whose interest is generally subject to the federal alternative minimum tax. The fund invests primarily in debt securities rated AA- or better or Aa3 or better by Nationally Recognized Statistical Rating Organizations designated by the fund’s investment adviser, or unrated but determined by the fund’s investment adviser to be of equivalent quality. The fund may also invest in debt securities rated A- or better or A3 or better by Nationally Recognized Statistical Rating Organizations designated by the fund’s investment adviser, or unrated but determined by the fund’s investment adviser to be of equivalent quality. The fund’s aggregate portfolio will have a dollar-weighted average effective maturity no greater than three years.
The investment adviser uses a system of multiple portfolio managers in managing the fund’s assets. Under this approach, the portfolio of the fund is divided into segments managed by individual managers.
The fund relies on the professional judgment of its investment adviser to make decisions about the fund’s portfolio investments. The basic investment philosophy of the investment adviser is to seek to invest in attractively priced securities that, in its opinion, represent good, long-term investment opportunities. Securities may be sold when the investment adviser believes that they no longer represent relatively attractive investment opportunities.
The following bar chart shows how the fund’s investment results have varied from year to year, and the following table shows how the fund’s average annual total returns for various periods compare with a broad measure of securities market results and, if applicable, other measures of market results that reflect the fund’s investment universe. This information provides some indication of the risks of investing in the fund. Past investment results (before and after taxes) are not predictive of future investment results. Updated information on the fund’s investment results can be obtained by visiting capitalgroup.com.
The following bar chart shows how the fund’s investment results have varied from year to year, and the following table shows how the fund’s average annual total returns for various periods compare with a broad measure of securities market results and, if applicable, other measures of market results that reflect the fund’s investment universe.
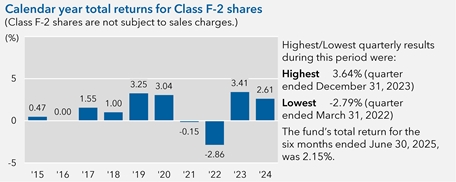
Highest/Lowest quarterly results during this period were:
Highest 3.64% (quarter ended December 31, 2023)
Lowest -2.79% (quarter ended March 31, 2022)
The fund's total return for the six months ended June 30, 2025, was 2.15%
| Average annual total returns For the periods ended December 31, 2024: | |||||
| Share class | Inception date | 1 year | 5 years | 10 years | Lifetime |
| F-2 − Before taxes | 8/12/2009 | 2.61% | 1.18% | 1.22% | 1.35 % |
| − After taxes on distributions | 2.61 | 1.14 | 1.19 | N/A | |
| − After taxes on distributions and sale of fund shares | 2.65 | 1.25 | 1.26 | N/A | |
| Share classes (before taxes) | Inception date | 1 year | 5 years | 10 years | Lifetime |
| A (with maximum sales charge) | 8/7/2009 | –0.03% | 0.55% | 0.88% | 1.11% |
| F-1 | 8/27/2009 | 2.29 | 0.87 | 0.92 | 1.08 |
| F-3 | 1/27/2017 | 2.68 | 1.25 | N/A | 1.50 |
| Indexes | 1 year | 5 years | 10 years | Lifetime (since Class F-2 inception) |
| Bloomberg Municipal Bond Index (reflects no deductions for sales charges, account fees, expenses or U.S. federal income taxes) | 1.05% | 0.99% | 2.25% | 3.39% |
| Bloomberg Municipal Short 1-5 Years Index (reflects no deductions for sales charges, account fees, expenses or U.S. federal income taxes) | 2.07 | 1.10 | 1.38 | 1.62 |
| Class F-2 annualized 30-day yield at July 31, 2025: 2.86% (For current yield information, please call American Funds Service Company at (800) 421-4225 or visit capitalgroup.com.) | ||||
After-tax returns are shown only for Class F-2 shares; after-tax returns for other share classes will vary. After-tax returns are calculated using the highest individual federal income tax rates in effect during each year of the periods shown and do not reflect the impact of state and local taxes. Your actual after-tax returns depend on your individual tax situation and likely will differ from the results shown above.