Shareholder Report
May 31, 2025
USD ($)
Holding
capitalgroup.com/ETF-literature
(800) 421-4225
.
What were the fund costs for the period?
(based on a hypothetical $10,000 investment)Fund | Cost of $10,000 Investment | Costs paid as a percentage of a $10,000 investment |
| CGMM | $ 19* | 0.51 % † |
*
Based on operations for the period from January 14, 2025 to May 31, 2025. Expenses for the full year would be higher.†
Annualized.Management's discussion of fund performance
The fund's shares gained 0.71% on a net asset value (NAV) and market price basis for the period from
May 31, 2025. These results compare with a 4.47% loss for the Russell 2500 Index. For information on returns for additional periods, including the fund lifetime, please refer to.
January
14, 2025 to May 31, 2025. These results compare with a 4.47% loss for the Russell 2500 Index. For information on returns for additional periods, including the fund lifetime, please refer to
capitalgroup.com/ETF-returns
What factors influenced results
U.S. equity markets delivered strong returns, rebounding from early 2025 volatility on the back of a late-stage rally in the technology sector. During the fund’s fiscal period, small and mid-cap equities generated modest returns and lagged large-cap stocks. Overall, the U.S. economy maintained steady growth, despite a contraction in the first quarter of 2025 amid rising uncertainty over the implementation of proposed tariffs. As inflation moderated, the U.S. Federal Reserve cut interest rates three times in 2024.
The fund’s holdings in consumer staples and communication services were most additive to results. Likewise, utilities, real estate and financials holdings notched returns surpassing those of the overall portfolio.
Conversely, holdings in the materials, energy, information technology and health care sectors posted negative returns that lagged the portfolio during the period. Holdings in industrials also detracted from the fund’s total return.
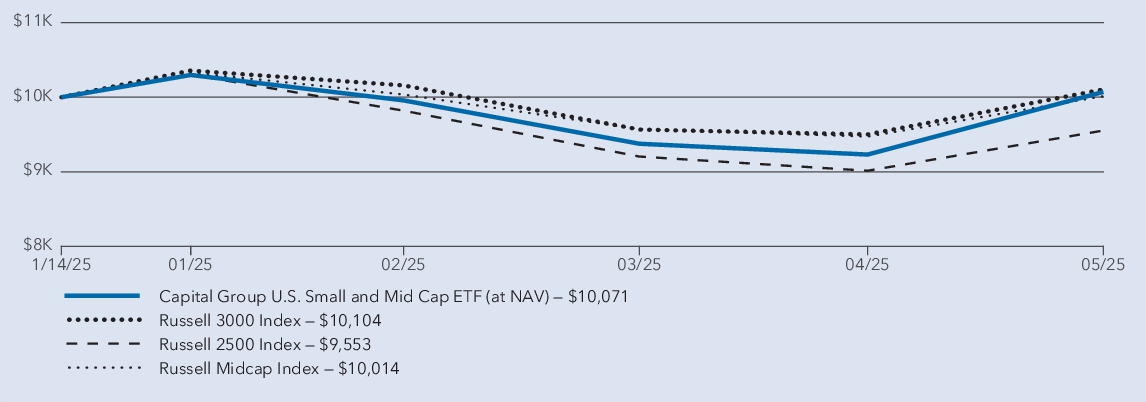
Average annual total returns
Since inception 1 | |
| Capital Group U.S. Small and Mid Cap ETF (at NAV) 2 | 0.71 % |
| Russell 3000 Index 3 | 1.04 % |
| Russell 2500 Index 3 | (4.47 ) % |
| Russell Midcap Index 3 | 0.14 % |
1
The fund began investment operations on January 14, 2025.2
Investment results assume all distributions are reinvested and reflect applicable fees and expenses. When applicable, results reflect fee waivers and/or expense reimbursements, without which they would have been lower.3
Results assume all distributions are reinvested. Any market index shown is unmanaged, and therefore
, has no expenses. Investors cannot invest directly in an index. Source(s): London Stock Exchange Group.Key fund statistics
| Fund net assets (in thousands) | $ 247,965 |
| Total number of portfolio holdings | 84 |
| Total advisory fees paid (in thousands) | $ 211 |
| Portfolio turnover rate | 9 % |
Portfolio holdings by sector
(percent of net assets)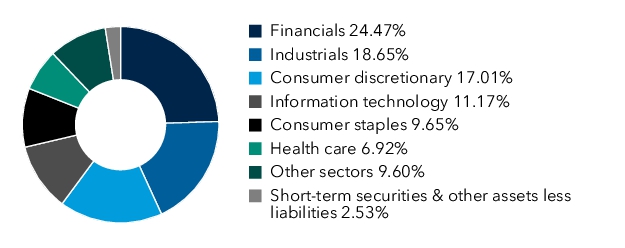
| [1] | Based on operations for the period from January 14, 2025 to May 31, 2025. Expenses for the full year would be higher. |
| [2] | Annualized. |