This annual shareholder report contains important information about the Kansas Municipal Fund.
Period covered: August 1, 2024 through July 31, 2025
What were the Fund costs for the
past year?
(Based on a hypothetical $10,000 investment)
| Class Name | Cost of a $10,000 investment | Costs paid as a percentage of a $10,000 investment |
| Class A | $97 | 0.98% |
| How did the Fund perform last year? | ||
| • | For the 12 month period ended July 31, 2025, the Fund’s Class A shares returned -2.23%. | |
| • | In comparison, the Bloomberg U.S. Municipal Bond Index (the Benchmark) returned 0.00% for the same period. | |
| What affected the Fund’s performance? | ||
| • | Short-term rates declined, while intermediate and long-term rates increased. | |
| • | The Fund underperformed the benchmark, primarily due to its longer duration, which increased sensitivity to rising rates. | |
| • | Credit positioning had little impact on performance, as yield movements were similar across maturities. | |
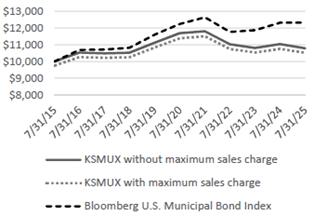
How did the Fund perform over the past 10 years?*
The chart below reflects a hypothetical $10,000 investment in the class of shares noted with and without sales charges.
CUMULATIVE PERFORMANCE
AVERAGE ANNUAL TOTAL RETURN (%)
For the Periods Ended July 31, 2025
| 1 Year | 5 Years | 10 Years | |
| Class A without sales charge | -2.23 | -1.58 | 0.76 |
| Class A with sales charge | -4.69 | -2.09 | 0.51 |
| Bloomberg U.S. Muni Bond Index | 0.00 | 0.13 | 2.11 |
What are some key Fund statistics?
(as of July 31, 2025)
| Total Net Assets (Millions) | $51 |
| Number of Holdings | 70 |
Net Advisory Fee Paid | $172K |
| Annual Portfolio Turnover | 42% |
What did the Fund invest in?
(as of July 31, 2025)
| Sectors* | % Net Assets | Credit Rating Breakdown** | % Net Assets | |||
| General Obligation | 48.9 | AAA | 0.36 | |||
| Other Revenue | 11.2 | AA | 74.75 | |||
| Utilities | 9.1 | A | 12.17 | |||
| Education | 9.0 | BBB | 3.07 | |||
| Housing | 8.7 | NR | 9.65 | |||
| Health Care | 5.4 | |||||
| Cash Equivalents and Other | 3.3 | |||||
| Pre-Refunded | 2.4 | |||||
| Transportation | 2.0 |
* All portfolio holdings are issued securities from the state of Kansas.
** The ratings agencies that provided the ratings are Standard & Poor’s
and Moody’s. When ratings vary, the higher rating is used. Credit quality ratings are measured on a scale that generally ranges
from AAA (highest) to D (lowest). “NR” is used to classify securities for which a rating is not available. Ratings apply to
the holdings in the Fund portfolio and not to the Fund or its shares. Ratings are subject to change.
This annual shareholder report contains important information about the Kansas Municipal Fund.
Period covered: August 1, 2024 through July 31, 2025
What were the Fund costs for the
past year?
(Based on a hypothetical $10,000 investment)
| Class Name | Cost of a $10,000 investment | Costs paid as a percentage of a $10,000 investment |
| Class I | $72 | 0.73% |
| How did the Fund perform last year? | ||
| • | For the 12 month period ended July 31, 2025, the Fund’s Class I shares returned -1.98%. | |
| • | In comparison, the Bloomberg U.S. Municipal Bond Index (the Benchmark) returned 0.00% for the same period. | |
| What affected the Fund’s performance? | ||
| • | Short-term rates declined, while intermediate and long-term rates increased. | |
| • | The Fund underperformed the benchmark, primarily due to its longer duration, which increased sensitivity to rising rates. | |
| • | Credit positioning had little impact on performance, as yield movements were similar across maturities. | |
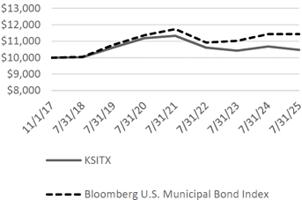
How did the Fund perform since inception?*
The chart below reflects a hypothetical $10,000 investment in the class of shares noted.
CUMULATIVE PERFORMANCE
AVERAGE ANNUAL TOTAL RETURN (%)
For the Periods Ended July 31, 2025
| 1 Year | 5 Years | Inception^ | |
| Class I | -1.98 | -1.32 | 0.59 |
| Bloomberg U.S. Muni Bond Index | 0.00 | 0.13 | 1.75 |
| ^Inception Date of 11/1/2017 |
What are some key Fund statistics?
(as of July 31, 2025)
| Total Net Assets (Millions) | $51 |
| Number of Holdings | 70 |
Net Advisory Fee Paid | $172K |
| Annual Portfolio Turnover | 42% |
What did the Fund invest in?
(as of July 31, 2025)
| Sectors* | % Net Assets | Credit Rating Breakdown** | % Net Assets | |||
| General Obligation | 48.9 | AAA | 0.36 | |||
| Other Revenue | 11.2 | AA | 74.75 | |||
| Utilities | 9.1 | A | 12.17 | |||
| Education | 9.0 | BBB | 3.07 | |||
| Housing | 8.7 | NR | 9.65 | |||
| Health Care | 5.4 | |||||
| Cash Equivalents and Other | 3.3 | |||||
| Pre-Refunded | 2.4 | |||||
| Transportation | 2.0 |
* All portfolio holdings are issued securities from the state of Kansas.
** The ratings agencies that provided the ratings are Standard & Poor’s
and Moody’s. When ratings vary, the higher rating is used. Credit quality ratings are measured on a scale that generally ranges
from AAA (highest) to D (lowest). “NR” is used to classify securities for which a rating is not available. Ratings apply to
the holdings in the Fund portfolio and not to the Fund or its shares. Ratings are subject to change.
This annual shareholder report contains important information about the Maine Municipal Fund.
Period covered: August 1, 2024 through July 31, 2025
What were the Fund costs for the
past year?
(Based on a hypothetical $10,000 investment)
| Class Name | Cost of a $10,000 investment | Costs paid as a percentage of a $10,000 investment |
| Class A | $97 | 0.98% |
| How did the Fund perform last year? | ||
| • | For the 12 month period ended July 31, 2025, the Fund’s Class A shares returned -1.90%. | |
| • | In comparison, the Bloomberg U.S. Municipal Bond Index (the Benchmark) returned 0.00% for the same period. | |
| What affected the Fund’s performance? | ||
| • | Short-term rates declined, while intermediate and long-term rates increased. | |
| • | The Fund underperformed the benchmark, primarily due to its longer duration, which increased sensitivity to rising rates. | |
| • | Credit positioning had little impact on performance, as yield movements were similar across maturities. | |
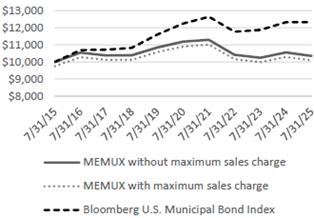
How did the Fund perform over the past 10 years?*
The chart below reflects a hypothetical $10,000 investment in the class of shares noted with and without sales charges.
CUMULATIVE PERFORMANCE
AVERAGE ANNUAL TOTAL RETURN (%)
For the Periods Ended July 31, 2025
| 1 Year | 5 Years | 10 Years | |
| Class A without sales charge | -1.90 | -1.53 | 0.34 |
| Class A with sales charge | -4.31 | -2.03 | 0.09 |
| Bloomberg U.S. Muni Bond Index | 0.00 | 0.13 | 2.11 |
What are some key Fund statistics?
(as of July 31, 2025)
| Total Net Assets (Millions) | $7 |
| Number of Holdings | 19 |
Net Advisory Fee Paid | $0 |
| Annual Portfolio Turnover | 18% |
What did the Fund invest in?
(as of July 31, 2025)
| Sectors* | % Net Assets | Credit Rating Breakdown** | % Net Assets | |||
| General Obligation | 27.6 | AAA | 8.67 | |||
| Housing | 22.0 | AA | 84.27 | |||
| Other Revenue | 17.5 | A | 7.06 | |||
| Health Care | 17.3 | |||||
| Cash Equivalents and Other | 12.4 | |||||
| Transportation | 3.2 | |||||
* All portfolio holdings are issued securities from the state of Maine.
** The ratings agencies that provided the ratings are Standard & Poor’s
and Moody’s. When ratings vary, the higher rating is used. Credit quality ratings are measured on a scale that generally ranges
from AAA (highest) to D (lowest). “NR” is used to classify securities for which a rating is not available. Ratings apply to
the holdings in the Fund portfolio and not to the Fund or its shares. Ratings are subject to change.
This annual shareholder report contains important information about the Maine Municipal Fund.
Period covered: August 1, 2024 through July 31, 2025
What were the Fund costs for the
past year?
(Based on a hypothetical $10,000 investment)
| Class Name | Cost of a $10,000 investment | Costs paid as a percentage of a $10,000 investment |
| Class I | $72 | 0.73% |
| How did the Fund perform last year? | ||
| • | For the 12 month period ended July 31, 2025, the Fund’s Class I shares returned -1.55%. | |
| • | In comparison, the Bloomberg U.S. Municipal Bond Index (the Benchmark) returned 0.00% for the same period. | |
| What affected the Fund’s performance? | ||
| • | Short-term rates declined, while intermediate and long-term rates increased. | |
| • | The Fund underperformed the benchmark, primarily due to its longer duration, which increased sensitivity to rising rates. | |
| • | Credit positioning had little impact on performance, as yield movements were similar across maturities. | |
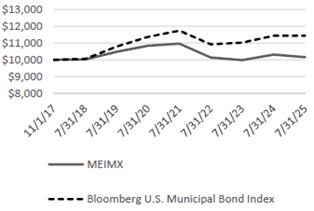
How did the Fund perform since inception?*
The chart below reflects a hypothetical $10,000 investment in the class of shares noted.
CUMULATIVE PERFORMANCE
AVERAGE ANNUAL TOTAL RETURN (%)
For the Periods Ended July 31, 2025
| 1 Year | 5 Years | Inception^ | |
| Class I | -1.55 | -1.29 | 0.19 |
| Bloomberg U.S. Muni Bond Index | 0.00 | 0.13 | 1.75 |
| ^Inception Date of 11/1/2017 |
What are some key Fund statistics?
(as of July 31, 2025)
| Total Net Assets (Millions) | $7 |
| Number of Holdings | 19 |
Net Advisory Fee Paid | $0 |
| Annual Portfolio Turnover | 18% |
What did the Fund invest in?
(as of July 31, 2025)
| Sectors* | % Net Assets | Credit Rating Breakdown** | % Net Assets | |||
| General Obligation | 27.6 | AAA | 8.67 | |||
| Housing | 22.0 | AA | 84.27 | |||
| Other Revenue | 17.5 | A | 7.06 | |||
| Health Care | 17.3 | |||||
| Cash Equivalents and Other | 12.4 | |||||
| Transportation | 3.2 | |||||
* All portfolio holdings are issued securities from the state of Maine.
** The ratings agencies that provided the ratings are Standard & Poor’s
and Moody’s. When ratings vary, the higher rating is used. Credit quality ratings are measured on a scale that generally ranges
from AAA (highest) to D (lowest). “NR” is used to classify securities for which a rating is not available. Ratings apply to
the holdings in the Fund portfolio and not to the Fund or its shares. Ratings are subject to change.
This annual shareholder report contains important information about the Nebraska Municipal Fund.
Period covered: August 1, 2024 through July 31, 2025
What were the Fund costs for the
past year?
(Based on a hypothetical $10,000 investment)
| Class Name | Cost of a $10,000 investment | Costs paid as a percentage of a $10,000 investment |
| Class A | $97 | 0.98% |
| How did the Fund perform last year? | ||
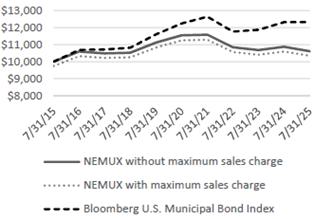
| • | For the 12 month period ended July 31, 2025, the Fund’s Class A shares returned -2.41%. | |
| • | In comparison, the Bloomberg U.S. Municipal Bond Index (the Benchmark) returned 0.00% for the same period. | |
| What affected the Fund’s performance? | ||
| • | Short-term rates declined, while intermediate and long-term rates increased. | |
| • | The Fund underperformed the benchmark, primarily due to its longer duration, which increased sensitivity to rising rates. | |
| • | Credit positioning had little impact on performance, as yield movements were similar across maturities. | |
How did the Fund perform over the past 10 years?*
The chart below reflects a hypothetical $10,000 investment in the class of shares noted with and without sales charges.
CUMULATIVE PERFORMANCE
AVERAGE ANNUAL TOTAL RETURN (%)
For the Periods Ended July 31, 2025
| 1 Year | 5 Years | 10 Years | |
| Class A without sales charge | -2.41 | -1.66 | 0.59 |
| Class A with sales charge | -4.85 | -2.17 | 0.34 |
| Bloomberg U.S. Muni Bond Index | 0.00 | 0.13 | 2.11 |
What are some key Fund statistics?
(as of July 31, 2025)
| Total Net Assets (Millions) | $29 |
| Number of Holdings | 45 |
Net Advisory Fee Paid | $68K |
| Annual Portfolio Turnover | 32% |
What did the Fund invest in?
(as of July 31, 2025)
| Sectors* | % Net Assets | Credit Rating Breakdown** | % Net Assets | |||
| General Obligation | 58.0 | AAA | 11.09 | |||
| Utilities | 12.5 | AA | 58.55 | |||
| Education | 11.0 | A | 11.09 | |||
| Housing | 10.8 | NR | 19.27 | |||
| Other Revenue | 5.1 | |||||
| Cash Equivalents and Other | 2.6 | |||||
* All portfolio holdings are issued securities from the state of Nebraska.
** The ratings agencies that provided the ratings are Standard & Poor’s
and Moody’s. When ratings vary, the higher rating is used. Credit quality ratings are measured on a scale that generally ranges
from AAA (highest) to D (lowest). “NR” is used to classify securities for which a rating is not available. Ratings apply to
the holdings in the Fund portfolio and not to the Fund or its shares. Ratings are subject to change.
This annual shareholder report contains important information about the Nebraska Municipal Fund.
Period covered: August 1, 2024 through July 31, 2025
What were the Fund costs for the
past year?
(Based on a hypothetical $10,000 investment)
| Class Name | Cost of a $10,000 investment | Costs paid as a percentage of a $10,000 investment |
| Class I | $72 | 0.73% |
| How did the Fund perform last year? | ||
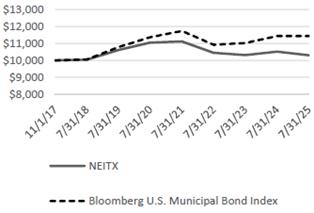
| • | For the 12 month period ended July 31, 2025, the Fund’s Class I shares returned -2.07%. | |
| • | In comparison, the Bloomberg U.S. Municipal Bond Index (the Benchmark) returned 0.00% for the same period. | |
| What affected the Fund’s performance? | ||
| • | Short-term rates declined, while intermediate and long-term rates increased. | |
| • | The Fund underperformed the benchmark, primarily due to its longer duration, which increased sensitivity to rising rates. | |
| • | Credit positioning had little impact on performance, as yield movements were similar across maturities. | |
How did the Fund perform since inception?*
The chart below reflects a hypothetical $10,000 investment in the class of shares noted.
CUMULATIVE PERFORMANCE
through July 31, 2025
AVERAGE ANNUAL TOTAL RETURN (%)
For the Periods Ended July 31, 2025
| 1 Year | 5 Years | Inception^ | |
| Class I | -2.07 | -1.40 | 0.38 |
| Bloomberg U.S. Muni Bond Index | 0.00 | 0.13 | 1.75 |
| ^Inception Date of 11/1/2017 |
What are some key Fund statistics?
(as of July 31, 2025)
| Total Net Assets (Millions) | $29 |
| Number of Holdings | 45 |
Net Advisory Fee Paid | $68K |
| Annual Portfolio Turnover | 32% |
What did the Fund invest in?
(as of July 31, 2025)
| Sectors* | % Net Assets | Credit Rating Breakdown** | % Net Assets | |||
| General Obligation | 58.0 | AAA | 11.09 | |||
| Utilities | 12.5 | AA | 58.55 | |||
| Education | 11.0 | A | 11.09 | |||
| Housing | 10.8 | NR | 19.27 | |||
| Other Revenue | 5.1 | |||||
| Cash Equivalents and Other | 2.6 | |||||
* All portfolio holdings are issued securities from the state of Nebraska.
** The ratings agencies that provided the ratings are Standard & Poor’s
and Moody’s. When ratings vary, the higher rating is used. Credit quality ratings are measured on a scale that generally ranges
from AAA (highest) to D (lowest). “NR” is used to classify securities for which a rating is not available. Ratings apply to
the holdings in the Fund portfolio and not to the Fund or its shares. Ratings are subject to change.
This annual shareholder report contains important information about the Oklahoma Municipal Fund.
Period covered: August 1, 2024 through July 31, 2025
What were the Fund costs for the
past year?
(Based on a hypothetical $10,000 investment)
| Class Name | Cost of a $10,000 investment | Costs paid as a percentage of a $10,000 investment |
| Class A | $97 | 0.98% |
| How did the Fund perform last year? | ||
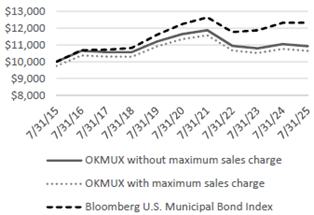
| • | For the 12 month period ended July 31, 2025, the Fund’s Class A shares returned -1.07%. | |
| • | In comparison, the Bloomberg U.S. Municipal Bond Index (the Benchmark) returned 0.00% for the same period. | |
| What affected the Fund’s performance? | ||
| • | Short-term rates declined, while intermediate and long-term rates increased. | |
| • | The Fund underperformed the benchmark, primarily due to its longer duration, which increased sensitivity to rising rates. | |
| • | Credit positioning had little impact on performance, as yield movements were similar across maturities. | |
How did the Fund perform over the past 10 years?*
The chart below reflects a hypothetical $10,000 investment in the class of shares noted with and without sales charges.
CUMULATIVE PERFORMANCE
AVERAGE ANNUAL TOTAL RETURN (%)
For the Periods Ended July 31, 2025
| 1 Year | 5 Years | 10 Years | |
| Class A without sales charge | -1.07 | -1.26 | 0.89 |
| Class A with sales charge | -3.53 | -1.75 | 0.63 |
| Bloomberg U.S. Muni Bond Index | 0.00 | 0.13 | 2.11 |
What are some key Fund statistics?
(as of July 31, 2025)
| Total Net Assets (Millions) | $40 |
| Number of Holdings | 62 |
Net Advisory Fee Paid | $116K |
| Annual Portfolio Turnover | 29% |
What did the Fund invest in?
(as of July 31, 2025)
| Sectors* | % Net Assets | Credit Rating Breakdown** | % Net Assets | |||
| Other Revenue | 68.5 | AAA | 11.78 | |||
| Housing | 11.6 | AA | 24.16 | |||
| Transportation | 5.0 | A | 25.75 | |||
| Education | 4.9 | BBB | 16.30 | |||
| Utilities | 3.4 | NR | 22.01 | |||
| General Obligation | 3.0 | |||||
| Cash Equivalents and Other | 2.5 | |||||
| Health Care | 1.1 | |||||
* All portfolio holdings are issued securities from the state of Oklahoma.
** The ratings agencies that provided the ratings are Standard & Poor’s
and Moody’s. When ratings vary, the higher rating is used. Credit quality ratings are measured on a scale that generally ranges
from AAA (highest) to D (lowest). “NR” is used to classify securities for which a rating is not available. Ratings apply to
the holdings in the Fund portfolio and not to the Fund or its shares. Ratings are subject to change
This annual shareholder report contains important information about the Oklahoma Municipal Fund.
Period covered: August 1, 2024 through July 31, 2025
What were the Fund costs for the
past year?
(Based on a hypothetical $10,000 investment)
| Class Name | Cost of a $10,000 investment | Costs paid as a percentage of a $10,000 investment |
| Class I | $73 | 0.73% |
| How did the Fund perform last year? | ||
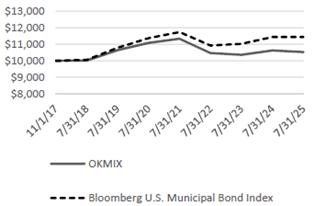
| • | For the 12 month period ended July 31, 2025, the Fund’s Class I shares returned -0.92%. | |
| • | In comparison, the Bloomberg U.S. Municipal Bond Index (the Benchmark) returned 0.00% for the same period. | |
| What affected the Fund’s performance? | ||
| • | Short-term rates declined, while intermediate and long-term rates increased. | |
| • | The Fund underperformed the benchmark, primarily due to its longer duration, which increased sensitivity to rising rates. | |
| • | Credit positioning had little impact on performance, as yield movements were similar across maturities. | |
How did the Fund perform since inception?*
The chart below reflects a hypothetical $10,000 investment in the class of shares noted.
CUMULATIVE PERFORMANCE
AVERAGE ANNUAL TOTAL RETURN (%)
For the Periods Ended July 31, 2025
| 1 Year | 5 Years | Inception^ | |
| Class I | -0.92 | -1.02 | 0.66 |
| Bloomberg U.S. Muni Bond Index | 0.00 | 0.13 | 1.75 |
^Inception Date of 11/1/2017 |
What are some key Fund statistics?
(as of July 31, 2025)
| Total Net Assets (Millions) | $40 |
| Number of Holdings | 62 |
Net Advisory Fee Paid | $116K |
| Annual Portfolio Turnover | 29% |
What did the Fund invest in?
(as of July 31, 2025)
| Sectors* | % Net Assets | Credit Rating Breakdown** | % Net Assets | |||
| Other Revenue | 68.5 | AAA | 11.78 | |||
| Housing | 11.6 | AA | 24.16 | |||
| Transportation | 5.0 | A | 25.75 | |||
| Education | 4.9 | BBB | 16.30 | |||
| Utilities | 3.4 | NR | 22.01 | |||
| General Obligation | 3.0 | |||||
| Cash Equivalents and Other | 2.5 | |||||
| Health Care | 1.1 | |||||
* All portfolio holdings are issued securities from the state of Oklahoma.
** The ratings agencies that provided the ratings are Standard & Poor’s
and Moody’s. When ratings vary, the higher rating is used. Credit quality ratings are measured on a scale that generally ranges
from AAA (highest) to D (lowest). “NR” is used to classify securities for which a rating is not available. Ratings apply to
the holdings in the Fund portfolio and not to the Fund or its shares. Ratings are subject to change.
This annual shareholder report contains important information about the Viking Tax-Free Fund for Montana.
Period covered: August 1, 2024 through July 31, 2025
What were the Fund costs for the
past year?
(Based on a hypothetical $10,000 investment)
| Class Name | Cost of a $10,000 investment | Costs paid as a percentage of a $10,000 investment |
| Class A | $97 | 0.98% |
| How did the Fund perform last year? | ||
| • | For the 12 month period ended July 31, 2025, the Fund’s Class A shares returned -1.16%. | |
| • | In comparison, the Bloomberg U.S. Municipal Bond Index (the Benchmark) returned 0.00% for the same period. | |
| What affected the Fund’s performance? | ||
| • | Short-term rates declined, while intermediate and long-term rates increased. | |
| • | The Fund underperformed the benchmark, primarily due to its longer duration, which increased sensitivity to rising rates. | |
| • | Credit positioning had little impact on performance, as yield movements were similar across maturities. | |
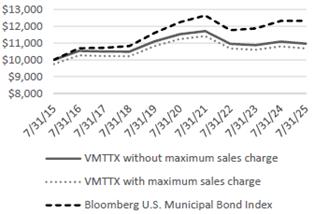
How did the Fund perform over the past 10 years?*
The chart below reflects a hypothetical $10,000 investment in the class of shares noted with and without sales charges.
CUMULATIVE PERFORMANCE
AVERAGE ANNUAL TOTAL RETURN (%)
For the Periods Ended July 31, 2025
| 1 Year | 5 Years | 10 Years | |
| Class A without sales charge | -1.16 | -1.01 | 0.92 |
Class A with sales charge | -3.59 | -1.52 | 0.66 |
Bloomberg U.S. Muni Bond Index | 0.00 | 0.13 | 2.11 |
What are some key Fund statistics?
(as of July 31, 2025)
| Total Net Assets (Millions) | $54 |
| Number of Holdings | 87 |
Net Advisory Fee Paid | $178K |
| Annual Portfolio Turnover | 23% |
What did the Fund invest in?
(as of July 31, 2025)
| Sectors* | % Net Assets | Credit Rating Breakdown** | % Net Assets | |||
| General Obligation | 47.1 | AA | 72.57 | |||
| Housing | 19.3 | A | 19.54 | |||
| Other Revenue | 13.6 | BBB | 0.62 | |||
| Health Care | 10.5 | NR | 7.27 | |||
| Education | 5.5 | |||||
| Cash Equivalents and Other | 2.4 | |||||
| Transportation | 1.6 | |||||
* All portfolio holdings are issued securities from the state of Montana.
** The ratings agencies that provided the ratings are Standard & Poor’s
and Moody’s. When ratings vary, the higher rating is used. Credit quality ratings are measured on a scale that generally ranges
from AAA (highest) to D (lowest). “NR” is used to classify securities for which a rating is not available. Ratings apply to
the holdings in the Fund portfolio and not to the Fund or its shares. Ratings are subject to change.
This annual shareholder report contains important information about the Viking Tax-Free Fund for Montana.
Period covered: August 1, 2024 through July 31, 2025
What were the Fund costs for the
past year?
(Based on a hypothetical $10,000 investment)
| Class Name | Cost of a $10,000 investment | Costs paid as a percentage of a $10,000 investment |
| Class I | $73 | 0.73% |
| How did the Fund perform last year? | ||
| • | For the 12 month period ended July 31, 2025, the Fund’s Class I shares returned -0.92%. | |
| • | In comparison, the Bloomberg U.S. Municipal Bond Index (the Benchmark) returned 0.00% for the same period. | |
| What affected the Fund’s performance? | ||
| • | Short-term rates declined, while intermediate and long-term rates increased. | |
| • | The Fund underperformed the benchmark, primarily due to its longer duration, which increased sensitivity to rising rates. | |
| • | Credit positioning had little impact on performance, as yield movements were similar across maturities. | |
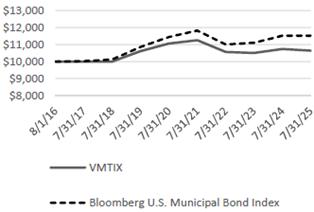
How did the Fund perform since inception?*
The chart below reflects a hypothetical $10,000 investment in the class of shares noted.
CUMULATIVE PERFORMANCE
AVERAGE ANNUAL TOTAL RETURN (%)
For the Periods Ended July 31, 2025
| 1 Year | 5 Years | Inception^ | |
| Class I | -0.92 | -0.76 | 0.69 |
Bloomberg U.S. Muni Bond Index | 0.00 | 0.13 | 1.59 |
^Inception Date of 8/1/2016 |
What are some key Fund statistics?
(as of July 31, 2025)
| Total Net Assets (Millions) | $54 |
| Number of Holdings | 87 |
Net Advisory Fee Paid | $178K |
| Annual Portfolio Turnover | 23% |
What did the Fund invest in?
(as of July 31, 2025)
| Sectors* | % Net Assets | Credit Rating Breakdown** | % Net Assets | |||
| General Obligation | 47.1 | AA | 72.57 | |||
| Housing | 19.3 | A | 19.54 | |||
| Other Revenue | 13.6 | BBB | 0.62 | |||
| Health Care | 10.5 | NR | 7.27 | |||
| Education | 5.5 | |||||
| Cash Equivalents and Other | 2.4 | |||||
| Transportation | 1.6 | |||||
* All portfolio holdings are issued securities from the state of Montana.
** The ratings agencies that provided the ratings are Standard & Poor’s
and Moody’s. When ratings vary, the higher rating is used. Credit quality ratings are measured on a scale that generally ranges
from AAA (highest) to D (lowest). “NR” is used to classify securities for which a rating is not available. Ratings apply to
the holdings in the Fund portfolio and not to the Fund or its shares. Ratings are subject to change.
This annual shareholder report contains important information about the Viking Tax-Free Fund for North Dakota.
Period covered: August 1, 2024 through July 31, 2025
What were the Fund costs for the
past year?
(Based on a hypothetical $10,000 investment)
| Class Name | Cost of a $10,000 investment | Costs paid as a percentage of a $10,000 investment |
| Class A | $97 | 0.98% |
| How did the Fund perform last year? | ||
| • | For the 12 month period ended July 31, 2025, the Fund’s Class A shares returned -2.81%. | |
| • | In comparison, the Bloomberg U.S. Municipal Bond Index (the Benchmark) returned 0.00% for the same period. | |
| What affected the Fund’s performance? | ||
| • | Short-term rates declined, while intermediate and long-term rates increased. | |
| • | The Fund underperformed the benchmark, primarily due to its longer duration, which increased sensitivity to rising rates. | |
| • | Credit positioning had little impact on performance, as yield movements were similar across maturities. | |
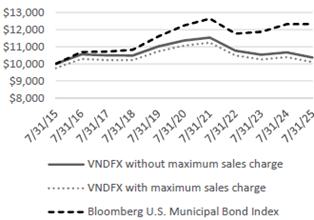
How did the Fund perform over the past 10 years?*
The chart below reflects a hypothetical $10,000 investment in the class of shares noted with and without sales charges.
CUMULATIVE PERFORMANCE
AVERAGE ANNUAL TOTAL RETURN (%)
For the Periods Ended July 31, 2025
| 1 Year | 5 Years | 10 Years | |
| Class A without sales charge | -2.81 | -1.80 | 0.36 |
Class A with sales charge | -5.23 | -2.30 | 0.11 |
Bloomberg U.S. Muni Bond Index | 0.00 | 0.13 | 2.11 |
What are some key Fund statistics?
(as of July 31, 2025)
| Total Net Assets (Millions) | $17 |
| Number of Holdings | 32 |
Net Advisory Fee Paid | $18K |
| Annual Portfolio Turnover | 23% |
What did the Fund invest in?
(as of July 31, 2025)
| Sectors* | % Net Assets | Credit Rating Breakdown** | % Net Assets | |||
| General Obligation | 35.5 | AAA | 1.92 | |||
| Housing | 14.9 | AA | 52.02 | |||
| Health Care | 12.5 | A | 10.85 | |||
| Utilities | 11.4 | BBB | 10.91 | |||
| Education | 10.4 | NR | 24.30 | |||
| Cash Equivalents and Other | 9.9 | |||||
| Other Revenue | 5.4 | |||||
* All portfolio holdings are issued securities from the state of North Dakota.
** The ratings agencies that provided the ratings are Standard & Poor’s
and Moody’s. When ratings vary, the higher rating is used. Credit quality ratings are measured on a scale that generally ranges
from AAA (highest) to D (lowest). “NR” is used to classify securities for which a rating is not available. Ratings apply to
the holdings in the Fund portfolio and not to the Fund or its shares. Ratings are subject to change.
This annual shareholder report contains important information about the Viking Tax-Free Fund for North Dakota.
Period covered: August 1, 2024 through July 31, 2025
What were the Fund costs for the
past year?
(Based on a hypothetical $10,000 investment)
| Class Name | Cost of a $10,000 investment | Costs paid as a percentage of a $10,000 investment |
| Class I | $72 | 0.73% |
| How did the Fund perform last year? | ||
| • | For the 12 month period ended July 31, 2025, the Fund’s Class I shares returned -2.57%. | |
| • | In comparison, the Bloomberg U.S. Municipal Bond Index (the Benchmark) returned 0.00% for the same period. | |
| What affected the Fund’s performance? | ||
| • | Short-term rates declined, while intermediate and long-term rates increased. | |
| • | The Fund underperformed the benchmark, primarily due to its longer duration, which increased sensitivity to rising rates. | |
| • | Credit positioning had little impact on performance, as yield movements were similar across maturities. | |
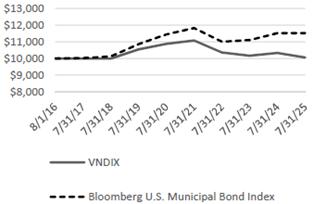
How did the Fund perform since inception?*
The chart below reflects a hypothetical $10,000 investment in the class of shares noted.
CUMULATIVE PERFORMANCE
AVERAGE ANNUAL TOTAL RETURN (%)
For the Periods Ended July 31, 2025
| 1 Year | 5 Years | Inception^ | |
| Class I | -2.57 | -1.55 | 0.07 |
Bloomberg U.S. Muni Bond Index | 0.00 | 0.13 | 1.59 |
^Inception Date of 8/1/2016 |
What are some key Fund statistics?
(as of July 31, 2025)
| Total Net Assets (Millions) | $17 |
| Number of Holdings | 32 |
Net Advisory Fee Paid | $18K |
| Annual Portfolio Turnover | 23% |
What did the Fund invest in?
(as of July 31, 2025)
| Sectors* | % Net Assets | Credit Rating Breakdown** | % Net Assets | |||
| General Obligation | 35.5 | AAA | 1.92 | |||
| Housing | 14.9 | AA | 52.02 | |||
| Health Care | 12.5 | A | 10.85 | |||
| Utilities | 11.4 | BBB | 10.91 | |||
| Education | 10.4 | NR | 24.30 | |||
| Cash Equivalents and Other | 9.9 | |||||
| Other Revenue | 5.4 | |||||
* All portfolio holdings are issued securities from the state of North Dakota.
** The ratings agencies that provided the ratings are Standard & Poor’s
and Moody’s. When ratings vary, the higher rating is used. Credit quality ratings are measured on a scale that generally ranges
from AAA (highest) to D (lowest). “NR” is used to classify securities for which a rating is not available. Ratings apply to
the holdings in the Fund portfolio and not to the Fund or its shares. Ratings are subject to change.
| [1] | The Fund’s past performance is not a good predictor of the Fund’s future performance. The graph and table do not reflect the deduction of taxes that a shareholder would pay on Fund distributions or redemptions of Fund shares. |
| [2] | The Fund’s past performance is not a good predictor of the Fund’s future performance. The graph and table do not reflect the deduction of taxes that a shareholder would pay on Fund distributions or redemptions of Fund shares. |
| [3] | The Fund’s past performance is not a good predictor of the Fund’s future performance. The graph and table do not reflect the deduction of taxes that a shareholder would pay on Fund distributions or redemptions of Fund shares. |
| [4] | The Fund’s past performance is not a good predictor of the Fund’s future performance. The graph and table do not reflect the deduction of taxes that a shareholder would pay on Fund distributions or redemptions of Fund shares. |
| [5] | The Fund’s past performance is not a good predictor of the Fund’s future performance. The graph and table do not reflect the deduction of taxes that a shareholder would pay on Fund distributions or redemptions of Fund shares. |
| [6] | The Fund’s past performance is not a good predictor of the Fund’s future performance. The graph and table do not reflect the deduction of taxes that a shareholder would pay on Fund distributions or redemptions of Fund shares. |
| [7] | The Fund’s past performance is not a good predictor of the Fund’s future performance. The graph and table do not reflect the deduction of taxes that a shareholder would pay on Fund distributions or redemptions of Fund shares. |
| [8] | The Fund’s past performance is not a good predictor of the Fund’s future performance. The graph and table do not reflect the deduction of taxes that a shareholder would pay on Fund distributions or redemptions of Fund shares. |
| [9] | The Fund’s past performance is not a good predictor of the Fund’s future performance. The graph and table do not reflect the deduction of taxes that a shareholder would pay on Fund distributions or redemptions of Fund shares. |
| [10] | The Fund’s past performance is not a good predictor of the Fund’s future performance. The graph and table do not reflect the deduction of taxes that a shareholder would pay on Fund distributions or redemptions of Fund shares. |
| [11] | The Fund’s past performance is not a good predictor of the Fund’s future performance. The graph and table do not reflect the deduction of taxes that a shareholder would pay on Fund distributions or redemptions of Fund shares. |
| [12] | The Fund’s past performance is not a good predictor of the Fund’s future performance. The graph and table do not reflect the deduction of taxes that a shareholder would pay on Fund distributions or redemptions of Fund shares. |