Shareholder Report
|
|
12 Months Ended |
Aug. 01, 2024 |
Jul. 31, 2025
USD ($)
Holding
|
| Shareholder Report [Line Items] |
|
|
| Document Type |
|
N-CSR
|
| Amendment Flag |
|
false
|
| Registrant Name |
|
DEUTSCHE DWS INVESTMENT TRUST
|
| Entity Central Index Key |
|
0000088064
|
| Entity Investment Company Type |
|
N-1A
|
| Document Period End Date |
|
Jul. 31, 2025
|
| C000015684 |
|
|
| Shareholder Report [Line Items] |
|
|
| Fund Name |
|
DWS Large Cap Focus Growth Fund
|
| Class Name |
|
Class A
|
| Trading Symbol |
|
SGGAX
|
| Annual or Semi-Annual Statement [Text Block] |
|
This annual shareholder report contains important information about DWS Large Cap Focus Growth Fund (the "Fund") for the period August 1, 2024 to July 31, 2025.
|
| Shareholder Report Annual or Semi-Annual |
|
Annual Shareholder Report
|
| Additional Information [Text Block] |
|
You can find additional information about the Fund on the Fund's website at dws.com/mutualreports. You can also request this information by contacting us at (800) 728-3337.
|
| Material Fund Change Notice [Text Block] |
|
This report describes changes to the Fund that occurred during the reporting period.
|
| Additional Information Phone Number |
|
(800) 728-3337
|
| Additional Information Website |
|
<span style="box-sizing: border-box; color: rgb(0, 0, 0); display: inline; flex-wrap: nowrap; font-size: 14.6667px; font-weight: 300; grid-area: auto; line-height: 17.6px; margin: 0px; overflow: visible; text-align: left; text-align-last: auto; white-space-collapse: preserve-breaks;">dws.com/mutualreports</span>
|
| Expenses [Text Block] |
|
What were the Fund costs for the last year?(Based on a hypothetical $10,000 investment) Fund | Costs of a $10,000 investment | Costs paid as a percentage of a $10,000 investment |
|---|
Class A | $120 | 1.07% |
|---|
Gross expense ratio as of the latest prospectus: 1.16%. See prospectus for any contractual or voluntary waivers; without a waiver, costs would have been higher. |
| Expenses Paid, Amount |
|
$ 120
|
| Expense Ratio, Percent |
|
1.07%
|
| Factors Affecting Performance [Text Block] |
|
How did the Fund perform last year and what affected its performance? Class A shares of the Fund returned 23.99% (unadjusted for sales charges) for the period ended July 31, 2025. The Fund's broad-based index, the Russell 1000® Index, returned 16.54% for the same period, while the Fund's additional, more narrowly based index, the Russell 1000® Growth Index, returned 23.75%. Stock selection was the primary driver of the Fund’s outperformance relative to the Russell 1000® Growth Index. The Fund produced the best results in the industrials sector, led by a position in Axon Entreprises, Inc. (2.1%). The company experienced surging demand for its law enforcement technologies, boosting its share price. Vertiv Holdings Co. (1.3%), a provider of infrastructure for data centers, was an additional contributor thanks to record bookings and strong earnings. The gaming platform company Roblox Corp. (1.1%), which gained on evidence of its growing ability to monetize its customer base, was the leading contributor outside of industrials. The Fund also benefited from an overweight in NVIDIA Corp. (14.6%). The stock surged on expectations that its central role in artificial intelligence will fuel outsized long-term growth. CyberArk Software Ltd. (1.2%), a cloud infrastructure software and IT security company that benefited from rising enterprise spending on security to combat cyber threats, was another key contributor. An underweight in Apple, Inc. (6.4%) further contributed to relative performance, as did zero weightings in several stocks that underperformed, most notably Eli Lilly & Co. The Fund experienced the weakest relative performance in information technology despite holding a number of outperforming stocks in the sector. Shares of the IT services company Globant SA (0.7%) fell after management provided underwhelming initial guidance for 2025 amid concerns about softness in enterprise IT services budgets. Confluent Inc. (0.5%) also lagged due to its inconsistent execution and reduced spending by its customers. Underweights or zero weightings in several winners, most notably Palantir Technologies, Inc., also detracted. Although the Fund performed well in healthcare overall, several holdings were among the largest individual detractors. Thermo Fisher Scientific, Inc. (1.2%) was a notable laggard amid questions about its long-term financial targets. Zoetis, Inc. (1.1%), which was hurt by rising competition and lower-than-expected sales growth, and Evolent Health, Inc.,* which faced profit-margin pressures, were additional detractors of note. Percentages in parentheses are based on the Fund’s net assets as of July 31, 2025. * Not held at July 31, 2025. |
| Performance Past Does Not Indicate Future [Text] |
|
The Fund's past performance is not a good predictor or guarantee of the Fund's future performance.
|
| Line Graph [Table Text Block] |
|
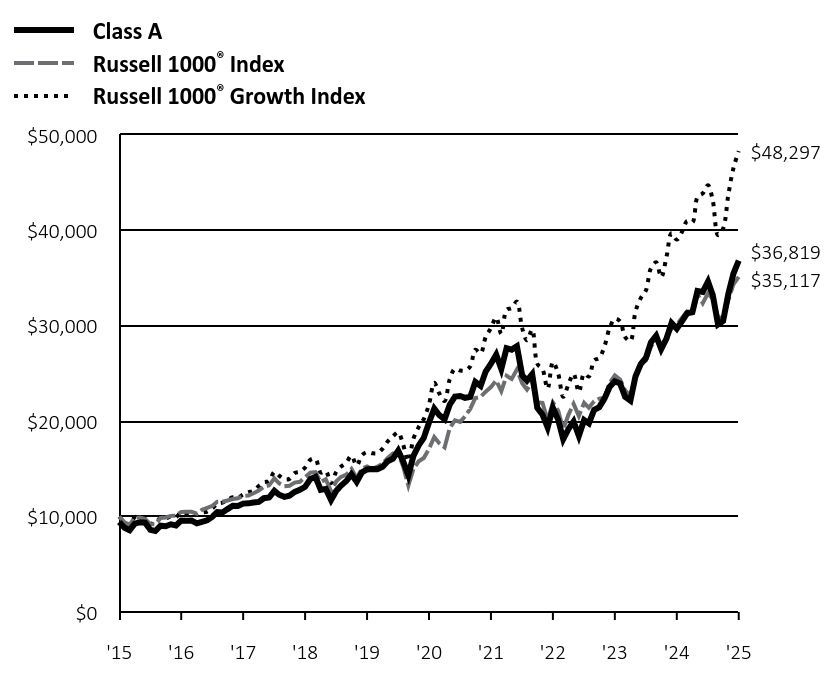 | Class A | Russell 1000® Index | Russell 1000® Growth Index |
|---|
'15 | $9,425 | $10,000 | $10,000 |
|---|
'15 | $8,833 | $9,398 | $9,393 |
|---|
'15 | $8,573 | $9,141 | $9,160 |
|---|
'15 | $9,256 | $9,880 | $9,949 |
|---|
'15 | $9,412 | $9,913 | $9,977 |
|---|
'15 | $9,367 | $9,735 | $9,831 |
|---|
'16 | $8,604 | $9,211 | $9,282 |
|---|
'16 | $8,489 | $9,208 | $9,278 |
|---|
'16 | $9,045 | $9,849 | $9,904 |
|---|
'16 | $8,988 | $9,903 | $9,813 |
|---|
'16 | $9,195 | $10,076 | $10,004 |
|---|
'16 | $9,075 | $10,099 | $9,964 |
|---|
'16 | $9,591 | $10,484 | $10,435 |
|---|
'16 | $9,572 | $10,497 | $10,383 |
|---|
'16 | $9,587 | $10,506 | $10,421 |
|---|
'16 | $9,290 | $10,301 | $10,176 |
|---|
'16 | $9,457 | $10,707 | $10,398 |
|---|
'16 | $9,614 | $10,908 | $10,526 |
|---|
'17 | $9,989 | $11,128 | $10,881 |
|---|
'17 | $10,464 | $11,558 | $11,333 |
|---|
'17 | $10,431 | $11,566 | $11,464 |
|---|
'17 | $10,783 | $11,688 | $11,726 |
|---|
'17 | $11,128 | $11,837 | $12,031 |
|---|
'17 | $11,101 | $11,920 | $11,999 |
|---|
'17 | $11,361 | $12,156 | $12,318 |
|---|
'17 | $11,388 | $12,194 | $12,544 |
|---|
'17 | $11,471 | $12,453 | $12,707 |
|---|
'17 | $11,541 | $12,739 | $13,200 |
|---|
'17 | $11,927 | $13,127 | $13,601 |
|---|
'17 | $11,998 | $13,274 | $13,707 |
|---|
'18 | $12,699 | $14,002 | $14,677 |
|---|
'18 | $12,290 | $13,488 | $14,292 |
|---|
'18 | $12,068 | $13,182 | $13,901 |
|---|
'18 | $12,187 | $13,227 | $13,949 |
|---|
'18 | $12,593 | $13,565 | $14,560 |
|---|
'18 | $12,807 | $13,652 | $14,701 |
|---|
'18 | $13,119 | $14,124 | $15,132 |
|---|
'18 | $13,950 | $14,610 | $15,960 |
|---|
'18 | $14,153 | $14,666 | $16,049 |
|---|
'18 | $12,796 | $13,628 | $14,614 |
|---|
'18 | $12,907 | $13,905 | $14,769 |
|---|
'18 | $11,741 | $12,639 | $13,499 |
|---|
'19 | $12,708 | $13,698 | $14,712 |
|---|
'19 | $13,253 | $14,162 | $15,239 |
|---|
'19 | $13,734 | $14,408 | $15,673 |
|---|
'19 | $14,435 | $14,990 | $16,381 |
|---|
'19 | $13,648 | $14,035 | $15,346 |
|---|
'19 | $14,624 | $15,020 | $16,400 |
|---|
'19 | $14,945 | $15,253 | $16,770 |
|---|
'19 | $14,986 | $14,974 | $16,642 |
|---|
'19 | $14,960 | $15,234 | $16,644 |
|---|
'19 | $15,222 | $15,557 | $17,113 |
|---|
'19 | $15,806 | $16,144 | $17,872 |
|---|
'19 | $16,077 | $16,611 | $18,411 |
|---|
'20 | $16,913 | $16,629 | $18,823 |
|---|
'20 | $15,808 | $15,270 | $17,541 |
|---|
'20 | $14,329 | $13,252 | $15,815 |
|---|
'20 | $16,361 | $15,003 | $18,156 |
|---|
'20 | $17,460 | $15,795 | $19,375 |
|---|
'20 | $18,246 | $16,144 | $20,218 |
|---|
'20 | $19,863 | $17,089 | $21,774 |
|---|
'20 | $21,321 | $18,343 | $24,021 |
|---|
'20 | $20,625 | $17,673 | $22,890 |
|---|
'20 | $20,191 | $17,247 | $22,113 |
|---|
'20 | $21,724 | $19,278 | $24,377 |
|---|
'20 | $22,576 | $20,093 | $25,498 |
|---|
'21 | $22,642 | $19,927 | $25,310 |
|---|
'21 | $22,449 | $20,505 | $25,304 |
|---|
'21 | $22,547 | $21,281 | $25,739 |
|---|
'21 | $24,119 | $22,426 | $27,490 |
|---|
'21 | $23,695 | $22,533 | $27,110 |
|---|
'21 | $25,208 | $23,097 | $28,810 |
|---|
'21 | $26,026 | $23,577 | $29,760 |
|---|
'21 | $26,975 | $24,260 | $30,873 |
|---|
'21 | $25,469 | $23,145 | $29,144 |
|---|
'21 | $27,654 | $24,751 | $31,668 |
|---|
'21 | $27,500 | $24,419 | $31,861 |
|---|
'21 | $27,859 | $25,408 | $32,535 |
|---|
'22 | $24,800 | $23,976 | $29,743 |
|---|
'22 | $24,252 | $23,318 | $28,479 |
|---|
'22 | $24,925 | $24,105 | $29,594 |
|---|
'22 | $21,406 | $21,956 | $26,020 |
|---|
'22 | $20,679 | $21,923 | $25,415 |
|---|
'22 | $19,333 | $20,087 | $23,402 |
|---|
'22 | $21,406 | $21,958 | $26,210 |
|---|
'22 | $20,159 | $21,114 | $24,989 |
|---|
'22 | $18,111 | $19,161 | $22,560 |
|---|
'22 | $19,187 | $20,697 | $23,879 |
|---|
'22 | $19,970 | $21,817 | $24,967 |
|---|
'22 | $18,455 | $20,549 | $23,055 |
|---|
'23 | $20,120 | $21,926 | $24,977 |
|---|
'23 | $19,773 | $21,404 | $24,680 |
|---|
'23 | $21,177 | $22,082 | $26,367 |
|---|
'23 | $21,465 | $22,355 | $26,628 |
|---|
'23 | $22,358 | $22,459 | $27,841 |
|---|
'23 | $23,579 | $23,976 | $29,745 |
|---|
'23 | $24,180 | $24,801 | $30,747 |
|---|
'23 | $23,953 | $24,367 | $30,471 |
|---|
'23 | $22,559 | $23,222 | $28,814 |
|---|
'23 | $22,152 | $22,660 | $28,404 |
|---|
'23 | $24,688 | $24,777 | $31,500 |
|---|
'23 | $25,973 | $26,000 | $32,895 |
|---|
'24 | $26,647 | $26,362 | $33,715 |
|---|
'24 | $28,253 | $27,786 | $36,016 |
|---|
'24 | $28,954 | $28,677 | $36,650 |
|---|
'24 | $27,561 | $27,457 | $35,095 |
|---|
'24 | $28,645 | $28,749 | $37,196 |
|---|
'24 | $30,286 | $29,701 | $39,704 |
|---|
'24 | $29,696 | $30,133 | $39,029 |
|---|
'24 | $30,484 | $30,847 | $39,842 |
|---|
'24 | $31,310 | $31,507 | $40,971 |
|---|
'24 | $31,432 | $31,287 | $40,835 |
|---|
'24 | $33,647 | $33,301 | $43,484 |
|---|
'24 | $33,556 | $32,373 | $43,867 |
|---|
'25 | $34,638 | $33,403 | $44,735 |
|---|
'25 | $33,219 | $32,819 | $43,128 |
|---|
'25 | $30,135 | $30,920 | $39,495 |
|---|
'25 | $30,497 | $30,736 | $40,194 |
|---|
'25 | $33,360 | $32,698 | $43,751 |
|---|
'25 | $35,479 | $34,353 | $46,540 |
|---|
'25 | $36,819 | $35,117 | $48,297 |
|---|
|
| Average Annual Return [Table Text Block] |
|
Class/Index
| 1-Year | 5-Year | 10-Year |
|---|
Class A Unadjusted for Sales Charge | 23.99% | 13.14% | 14.60% |
|---|
Class A Adjusted for the Maximum Sales Charge (max 5.75% load) | 16.86% | 11.80% | 13.92% |
|---|
Russell 1000® Index | 16.54% | 15.49% | 13.38% |
|---|
Russell 1000® Growth Index | 23.75% | 17.27% | 17.06% |
|---|
|
| No Deduction of Taxes [Text Block] |
|
The performance graph and returns table do not reflect the deduction of taxes that a shareholder would pay on Fund distributions or the redemption of Fund shares.
|
| Material Change Date |
Aug. 01, 2024
|
|
| AssetsNet |
|
$ 398,672,852
|
| Holdings Count | Holding |
|
51
|
| Advisory Fees Paid, Amount |
|
$ 2,263,011
|
| InvestmentCompanyPortfolioTurnover |
|
15.00%
|
| Additional Fund Statistics [Text Block] |
|
Net Assets ($) | 398,672,852 |
|---|
Number of Portfolio Holdings | 51 |
|---|
Portfolio Turnover Rate (%) | 15 |
|---|
Total Net Advisory Fees Paid ($) | 2,263,011 |
|---|
|
| Holdings [Text Block] |
|
Asset Type | % of Net Assets |
|---|
Common Stocks | 99% |
|---|
Cash Equivalents | 1% |
|---|
Other Assets and Liabilities, Net | 0% |
|---|
Total | 100% |
|---|
Sector | % of Net Assets |
|---|
Information Technology | 49% |
|---|
Consumer Discretionary | 12% |
|---|
Communication Services | 12% |
|---|
Health Care | 10% |
|---|
Financials | 8% |
|---|
Industrials | 6% |
|---|
Real Estate | 2% |
|---|
Consumer Staples | 1% |
|---|
Ten Largest Equity HoldingsHoldings | 63.6% of Net Assets |
|---|
NVIDIA Corp. | 14.6% | Microsoft Corp. | 12.5% | Amazon.com, Inc. | 7.7% | Apple, Inc. | 6.4% | Alphabet, Inc. | 4.8% | Broadcom, Inc. | 4.7% | Meta Platforms, Inc. | 4.5% | Visa, Inc. | 3.7% | Progressive Corp. | 2.6% | ServiceNow, Inc. | 2.1% |
|
| Material Fund Change [Text Block] |
|
This is a summary of certain changes of the Fund since August 1, 2024. For more information, review the Fund's current prospectus at dws.com/mutualreports, or call (800) 728-3337. On November 21, 2024, the Fund’s shareholders approved a change in the Fund’s diversification classification under the Investment Company Act of 1940, as amended, from diversified to non-diversified. This means the Fund may invest in securities of relatively few issuers. Thus, the performance of one or a small number of portfolio holdings can affect the Fund’s overall performance. |
| Material Fund Change Risks Change [Text Block] |
|
On November 21, 2024, the Fund’s shareholders approved a change in the Fund’s diversification classification under the Investment Company Act of 1940, as amended, from diversified to non-diversified. This means the Fund may invest in securities of relatively few issuers. Thus, the performance of one or a small number of portfolio holdings can affect the Fund’s overall performance.
|
| Summary of Change Legend [Text Block] |
|
This is a summary of certain changes of the Fund since August 1, 2024. For more information, review the Fund's current prospectus at dws.com/mutualreports, or call (800) 728-3337.
|
| C000015687 |
|
|
| Shareholder Report [Line Items] |
|
|
| Fund Name |
|
DWS Large Cap Focus Growth Fund
|
| Class Name |
|
Class C
|
| Trading Symbol |
|
SGGCX
|
| Annual or Semi-Annual Statement [Text Block] |
|
This annual shareholder report contains important information about DWS Large Cap Focus Growth Fund (the "Fund") for the period August 1, 2024 to July 31, 2025.
|
| Shareholder Report Annual or Semi-Annual |
|
Annual Shareholder Report
|
| Additional Information [Text Block] |
|
You can find additional information about the Fund on the Fund's website at dws.com/mutualreports. You can also request this information by contacting us at (800) 728-3337.
|
| Material Fund Change Notice [Text Block] |
|
This report describes changes to the Fund that occurred during the reporting period.
|
| Additional Information Phone Number |
|
(800) 728-3337
|
| Additional Information Website |
|
<span style="box-sizing: border-box; color: rgb(0, 0, 0); display: inline; flex-wrap: nowrap; font-size: 14.6667px; font-weight: 300; grid-area: auto; line-height: 17.6px; margin: 0px; overflow: visible; text-align: left; text-align-last: auto; white-space-collapse: preserve-breaks;">dws.com/mutualreports</span>
|
| Expenses [Text Block] |
|
What were the Fund costs for the last year?(Based on a hypothetical $10,000 investment) Fund | Costs of a $10,000 investment | Costs paid as a percentage of a $10,000 investment |
|---|
Class C | $203 | 1.82% |
|---|
Gross expense ratio as of the latest prospectus: 1.94%. See prospectus for any contractual or voluntary waivers; without a waiver, costs would have been higher. |
| Expenses Paid, Amount |
|
$ 203
|
| Expense Ratio, Percent |
|
1.82%
|
| Factors Affecting Performance [Text Block] |
|
How did the Fund perform last year and what affected its performance? Class C shares of the Fund returned 23.04% (unadjusted for sales charges) for the period ended July 31, 2025. The Fund's broad-based index, the Russell 1000® Index, returned 16.54% for the same period, while the Fund's additional, more narrowly based index, the Russell 1000® Growth Index, returned 23.75%. Stock selection was the primary driver of the Fund’s outperformance relative to the Russell 1000® Growth Index. The Fund produced the best results in the industrials sector, led by a position in Axon Entreprises, Inc. (2.1%). The company experienced surging demand for its law enforcement technologies, boosting its share price. Vertiv Holdings Co. (1.3%), a provider of infrastructure for data centers, was an additional contributor thanks to record bookings and strong earnings. The gaming platform company Roblox Corp. (1.1%), which gained on evidence of its growing ability to monetize its customer base, was the leading contributor outside of industrials. The Fund also benefited from an overweight in NVIDIA Corp. (14.6%). The stock surged on expectations that its central role in artificial intelligence will fuel outsized long-term growth. CyberArk Software Ltd. (1.2%), a cloud infrastructure software and IT security company that benefited from rising enterprise spending on security to combat cyber threats, was another key contributor. An underweight in Apple, Inc. (6.4%) further contributed to relative performance, as did zero weightings in several stocks that underperformed, most notably Eli Lilly & Co. The Fund experienced the weakest relative performance in information technology despite holding a number of outperforming stocks in the sector. Shares of the IT services company Globant SA (0.7%) fell after management provided underwhelming initial guidance for 2025 amid concerns about softness in enterprise IT services budgets. Confluent Inc. (0.5%) also lagged due to its inconsistent execution and reduced spending by its customers. Underweights or zero weightings in several winners, most notably Palantir Technologies, Inc., also detracted. Although the Fund performed well in healthcare overall, several holdings were among the largest individual detractors. Thermo Fisher Scientific, Inc. (1.2%) was a notable laggard amid questions about its long-term financial targets. Zoetis, Inc. (1.1%), which was hurt by rising competition and lower-than-expected sales growth, and Evolent Health, Inc.,* which faced profit-margin pressures, were additional detractors of note. Percentages in parentheses are based on the Fund’s net assets as of July 31, 2025. * Not held at July 31, 2025. |
| Performance Past Does Not Indicate Future [Text] |
|
The Fund's past performance is not a good predictor or guarantee of the Fund's future performance.
|
| Line Graph [Table Text Block] |
|
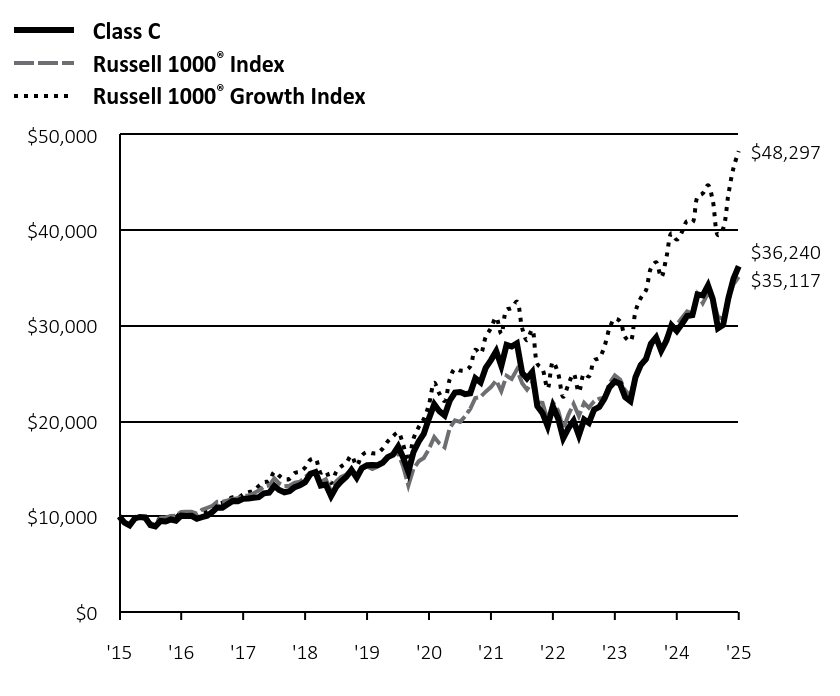 | Class C | Russell 1000® Index | Russell 1000® Growth Index |
|---|
'15 | $10,000 | $10,000 | $10,000 |
|---|
'15 | $9,365 | $9,398 | $9,393 |
|---|
'15 | $9,086 | $9,141 | $9,160 |
|---|
'15 | $9,802 | $9,880 | $9,949 |
|---|
'15 | $9,962 | $9,913 | $9,977 |
|---|
'15 | $9,908 | $9,735 | $9,831 |
|---|
'16 | $9,095 | $9,211 | $9,282 |
|---|
'16 | $8,969 | $9,208 | $9,278 |
|---|
'16 | $9,547 | $9,849 | $9,904 |
|---|
'16 | $9,484 | $9,903 | $9,813 |
|---|
'16 | $9,694 | $10,076 | $10,004 |
|---|
'16 | $9,562 | $10,099 | $9,964 |
|---|
'16 | $10,098 | $10,484 | $10,435 |
|---|
'16 | $10,074 | $10,497 | $10,383 |
|---|
'16 | $10,083 | $10,506 | $10,421 |
|---|
'16 | $9,764 | $10,301 | $10,176 |
|---|
'16 | $9,932 | $10,707 | $10,398 |
|---|
'16 | $10,091 | $10,908 | $10,526 |
|---|
'17 | $10,478 | $11,128 | $10,881 |
|---|
'17 | $10,972 | $11,558 | $11,333 |
|---|
'17 | $10,929 | $11,566 | $11,464 |
|---|
'17 | $11,289 | $11,688 | $11,726 |
|---|
'17 | $11,646 | $11,837 | $12,031 |
|---|
'17 | $11,610 | $11,920 | $11,999 |
|---|
'17 | $11,875 | $12,156 | $12,318 |
|---|
'17 | $11,894 | $12,194 | $12,544 |
|---|
'17 | $11,973 | $12,453 | $12,707 |
|---|
'17 | $12,038 | $12,739 | $13,200 |
|---|
'17 | $12,434 | $13,127 | $13,601 |
|---|
'17 | $12,502 | $13,274 | $13,707 |
|---|
'18 | $13,222 | $14,002 | $14,677 |
|---|
'18 | $12,789 | $13,488 | $14,292 |
|---|
'18 | $12,549 | $13,182 | $13,901 |
|---|
'18 | $12,666 | $13,227 | $13,949 |
|---|
'18 | $13,079 | $13,565 | $14,560 |
|---|
'18 | $13,291 | $13,652 | $14,701 |
|---|
'18 | $13,608 | $14,124 | $15,132 |
|---|
'18 | $14,459 | $14,610 | $15,960 |
|---|
'18 | $14,660 | $14,666 | $16,049 |
|---|
'18 | $13,250 | $13,628 | $14,614 |
|---|
'18 | $13,352 | $13,905 | $14,769 |
|---|
'18 | $12,141 | $12,639 | $13,499 |
|---|
'19 | $13,134 | $13,698 | $14,712 |
|---|
'19 | $13,687 | $14,162 | $15,239 |
|---|
'19 | $14,174 | $14,408 | $15,673 |
|---|
'19 | $14,892 | $14,990 | $16,381 |
|---|
'19 | $14,068 | $14,035 | $15,346 |
|---|
'19 | $15,064 | $15,020 | $16,400 |
|---|
'19 | $15,387 | $15,253 | $16,770 |
|---|
'19 | $15,416 | $14,974 | $16,642 |
|---|
'19 | $15,383 | $15,234 | $16,644 |
|---|
'19 | $15,643 | $15,557 | $17,113 |
|---|
'19 | $16,233 | $16,144 | $17,872 |
|---|
'19 | $16,499 | $16,611 | $18,411 |
|---|
'20 | $17,344 | $16,629 | $18,823 |
|---|
'20 | $16,201 | $15,270 | $17,541 |
|---|
'20 | $14,680 | $13,252 | $15,815 |
|---|
'20 | $16,751 | $15,003 | $18,156 |
|---|
'20 | $17,862 | $15,795 | $19,375 |
|---|
'20 | $18,656 | $16,144 | $20,218 |
|---|
'20 | $20,298 | $17,089 | $21,774 |
|---|
'20 | $21,771 | $18,343 | $24,021 |
|---|
'20 | $21,048 | $17,673 | $22,890 |
|---|
'20 | $20,593 | $17,247 | $22,113 |
|---|
'20 | $22,144 | $19,278 | $24,377 |
|---|
'20 | $22,997 | $20,093 | $25,498 |
|---|
'21 | $23,051 | $19,927 | $25,310 |
|---|
'21 | $22,839 | $20,505 | $25,304 |
|---|
'21 | $22,926 | $21,281 | $25,739 |
|---|
'21 | $24,506 | $22,426 | $27,490 |
|---|
'21 | $24,063 | $22,533 | $27,110 |
|---|
'21 | $25,581 | $23,097 | $28,810 |
|---|
'21 | $26,398 | $23,577 | $29,760 |
|---|
'21 | $27,343 | $24,260 | $30,873 |
|---|
'21 | $25,796 | $23,145 | $29,144 |
|---|
'21 | $27,994 | $24,751 | $31,668 |
|---|
'21 | $27,820 | $24,419 | $31,861 |
|---|
'21 | $28,163 | $25,408 | $32,535 |
|---|
'22 | $25,059 | $23,976 | $29,743 |
|---|
'22 | $24,489 | $23,318 | $28,479 |
|---|
'22 | $25,152 | $24,105 | $29,594 |
|---|
'22 | $21,589 | $21,956 | $26,020 |
|---|
'22 | $20,842 | $21,923 | $25,415 |
|---|
'22 | $19,473 | $20,087 | $23,402 |
|---|
'22 | $21,547 | $21,958 | $26,210 |
|---|
'22 | $20,280 | $21,114 | $24,989 |
|---|
'22 | $18,211 | $19,161 | $22,560 |
|---|
'22 | $19,278 | $20,697 | $23,879 |
|---|
'22 | $20,053 | $21,817 | $24,967 |
|---|
'22 | $18,519 | $20,549 | $23,055 |
|---|
'23 | $20,178 | $21,926 | $24,977 |
|---|
'23 | $19,817 | $21,404 | $24,680 |
|---|
'23 | $21,210 | $22,082 | $26,367 |
|---|
'23 | $21,486 | $22,355 | $26,628 |
|---|
'23 | $22,370 | $22,459 | $27,841 |
|---|
'23 | $23,574 | $23,976 | $29,745 |
|---|
'23 | $24,162 | $24,801 | $30,747 |
|---|
'23 | $23,915 | $24,367 | $30,471 |
|---|
'23 | $22,513 | $23,222 | $28,814 |
|---|
'23 | $22,093 | $22,660 | $28,404 |
|---|
'23 | $24,606 | $24,777 | $31,500 |
|---|
'23 | $25,870 | $26,000 | $32,895 |
|---|
'24 | $26,523 | $26,362 | $33,715 |
|---|
'24 | $28,108 | $27,786 | $36,016 |
|---|
'24 | $28,786 | $28,677 | $36,650 |
|---|
'24 | $27,389 | $27,457 | $35,095 |
|---|
'24 | $28,447 | $28,749 | $37,196 |
|---|
'24 | $30,057 | $29,701 | $39,704 |
|---|
'24 | $29,455 | $30,133 | $39,029 |
|---|
'24 | $30,214 | $30,847 | $39,842 |
|---|
'24 | $31,014 | $31,507 | $40,971 |
|---|
'24 | $31,115 | $31,287 | $40,835 |
|---|
'24 | $33,287 | $33,301 | $43,484 |
|---|
'24 | $33,175 | $32,373 | $43,867 |
|---|
'25 | $34,221 | $33,403 | $44,735 |
|---|
'25 | $32,803 | $32,819 | $43,128 |
|---|
'25 | $29,737 | $30,920 | $39,495 |
|---|
'25 | $30,080 | $30,736 | $40,194 |
|---|
'25 | $32,883 | $32,698 | $43,751 |
|---|
'25 | $34,942 | $34,353 | $46,540 |
|---|
'25 | $36,240 | $35,117 | $48,297 |
|---|
|
| Average Annual Return [Table Text Block] |
|
Class/Index
| 1-Year | 5-Year | 10-Year |
|---|
Class C Unadjusted for Sales Charge | 23.04% | 12.29% | 13.74% |
|---|
Class C Adjusted for the Maximum Sales Charge (max 1.00% CDSC) | 22.04% | 12.29% | 13.74% |
|---|
Russell 1000® Index | 16.54% | 15.49% | 13.38% |
|---|
Russell 1000® Growth Index | 23.75% | 17.27% | 17.06% |
|---|
|
| No Deduction of Taxes [Text Block] |
|
The performance graph and returns table do not reflect the deduction of taxes that a shareholder would pay on Fund distributions or the redemption of Fund shares.
|
| Material Change Date |
Aug. 01, 2024
|
|
| AssetsNet |
|
$ 398,672,852
|
| Holdings Count | Holding |
|
51
|
| Advisory Fees Paid, Amount |
|
$ 2,263,011
|
| InvestmentCompanyPortfolioTurnover |
|
15.00%
|
| Additional Fund Statistics [Text Block] |
|
Net Assets ($) | 398,672,852 |
|---|
Number of Portfolio Holdings | 51 |
|---|
Portfolio Turnover Rate (%) | 15 |
|---|
Total Net Advisory Fees Paid ($) | 2,263,011 |
|---|
|
| Holdings [Text Block] |
|
Asset Type | % of Net Assets |
|---|
Common Stocks | 99% |
|---|
Cash Equivalents | 1% |
|---|
Other Assets and Liabilities, Net | 0% |
|---|
Total | 100% |
|---|
Sector | % of Net Assets |
|---|
Information Technology | 49% |
|---|
Consumer Discretionary | 12% |
|---|
Communication Services | 12% |
|---|
Health Care | 10% |
|---|
Financials | 8% |
|---|
Industrials | 6% |
|---|
Real Estate | 2% |
|---|
Consumer Staples | 1% |
|---|
Ten Largest Equity HoldingsHoldings | 63.6% of Net Assets |
|---|
NVIDIA Corp. | 14.6% | Microsoft Corp. | 12.5% | Amazon.com, Inc. | 7.7% | Apple, Inc. | 6.4% | Alphabet, Inc. | 4.8% | Broadcom, Inc. | 4.7% | Meta Platforms, Inc. | 4.5% | Visa, Inc. | 3.7% | Progressive Corp. | 2.6% | ServiceNow, Inc. | 2.1% |
|
| Material Fund Change [Text Block] |
|
This is a summary of certain changes of the Fund since August 1, 2024. For more information, review the Fund's current prospectus at dws.com/mutualreports, or call (800) 728-3337. On November 21, 2024, the Fund’s shareholders approved a change in the Fund’s diversification classification under the Investment Company Act of 1940, as amended, from diversified to non-diversified. This means the Fund may invest in securities of relatively few issuers. Thus, the performance of one or a small number of portfolio holdings can affect the Fund’s overall performance. |
| Material Fund Change Risks Change [Text Block] |
|
On November 21, 2024, the Fund’s shareholders approved a change in the Fund’s diversification classification under the Investment Company Act of 1940, as amended, from diversified to non-diversified. This means the Fund may invest in securities of relatively few issuers. Thus, the performance of one or a small number of portfolio holdings can affect the Fund’s overall performance.
|
| Summary of Change Legend [Text Block] |
|
This is a summary of certain changes of the Fund since August 1, 2024. For more information, review the Fund's current prospectus at dws.com/mutualreports, or call (800) 728-3337.
|
| C000015689 |
|
|
| Shareholder Report [Line Items] |
|
|
| Fund Name |
|
DWS Large Cap Focus Growth Fund
|
| Class Name |
|
Class S
|
| Trading Symbol |
|
SCQGX
|
| Annual or Semi-Annual Statement [Text Block] |
|
This annual shareholder report contains important information about DWS Large Cap Focus Growth Fund (the "Fund") for the period August 1, 2024 to July 31, 2025.
|
| Shareholder Report Annual or Semi-Annual |
|
Annual Shareholder Report
|
| Additional Information [Text Block] |
|
You can find additional information about the Fund on the Fund's website at dws.com/mutualreports. You can also request this information by contacting us at (800) 728-3337.
|
| Material Fund Change Notice [Text Block] |
|
This report describes changes to the Fund that occurred during the reporting period.
|
| Additional Information Phone Number |
|
(800) 728-3337
|
| Additional Information Website |
|
<span style="box-sizing: border-box; color: rgb(0, 0, 0); display: inline; flex-wrap: nowrap; font-size: 14.6667px; font-weight: 300; grid-area: auto; line-height: 17.6px; margin: 0px; overflow: visible; text-align: left; text-align-last: auto; white-space-collapse: preserve-breaks;">dws.com/mutualreports</span>
|
| Expenses [Text Block] |
|
What were the Fund costs for the last year?(Based on a hypothetical $10,000 investment) Fund | Costs of a $10,000 investment | Costs paid as a percentage of a $10,000 investment |
|---|
Class S | $92 | 0.82% |
|---|
Gross expense ratio as of the latest prospectus: 0.88%. See prospectus for any contractual or voluntary waivers; without a waiver, costs would have been higher. |
| Expenses Paid, Amount |
|
$ 92
|
| Expense Ratio, Percent |
|
0.82%
|
| Factors Affecting Performance [Text Block] |
|
How did the Fund perform last year and what affected its performance? Class S shares of the Fund returned 24.29% for the period ended July 31, 2025. The Fund's broad-based index, the Russell 1000® Index, returned 16.54% for the same period, while the Fund's additional, more narrowly based index, the Russell 1000® Growth Index, returned 23.75%. Stock selection was the primary driver of the Fund’s outperformance relative to the Russell 1000® Growth Index. The Fund produced the best results in the industrials sector, led by a position in Axon Entreprises, Inc. (2.1%). The company experienced surging demand for its law enforcement technologies, boosting its share price. Vertiv Holdings Co. (1.3%), a provider of infrastructure for data centers, was an additional contributor thanks to record bookings and strong earnings. The gaming platform company Roblox Corp. (1.1%), which gained on evidence of its growing ability to monetize its customer base, was the leading contributor outside of industrials. The Fund also benefited from an overweight in NVIDIA Corp. (14.6%). The stock surged on expectations that its central role in artificial intelligence will fuel outsized long-term growth. CyberArk Software Ltd. (1.2%), a cloud infrastructure software and IT security company that benefited from rising enterprise spending on security to combat cyber threats, was another key contributor. An underweight in Apple, Inc. (6.4%) further contributed to relative performance, as did zero weightings in several stocks that underperformed, most notably Eli Lilly & Co. The Fund experienced the weakest relative performance in information technology despite holding a number of outperforming stocks in the sector. Shares of the IT services company Globant SA (0.7%) fell after management provided underwhelming initial guidance for 2025 amid concerns about softness in enterprise IT services budgets. Confluent Inc. (0.5%) also lagged due to its inconsistent execution and reduced spending by its customers. Underweights or zero weightings in several winners, most notably Palantir Technologies, Inc., also detracted. Although the Fund performed well in healthcare overall, several holdings were among the largest individual detractors. Thermo Fisher Scientific, Inc. (1.2%) was a notable laggard amid questions about its long-term financial targets. Zoetis, Inc. (1.1%), which was hurt by rising competition and lower-than-expected sales growth, and Evolent Health, Inc.,* which faced profit-margin pressures, were additional detractors of note. Percentages in parentheses are based on the Fund’s net assets as of July 31, 2025. * Not held at July 31, 2025. |
| Performance Past Does Not Indicate Future [Text] |
|
The Fund's past performance is not a good predictor or guarantee of the Fund's future performance.
|
| Line Graph [Table Text Block] |
|
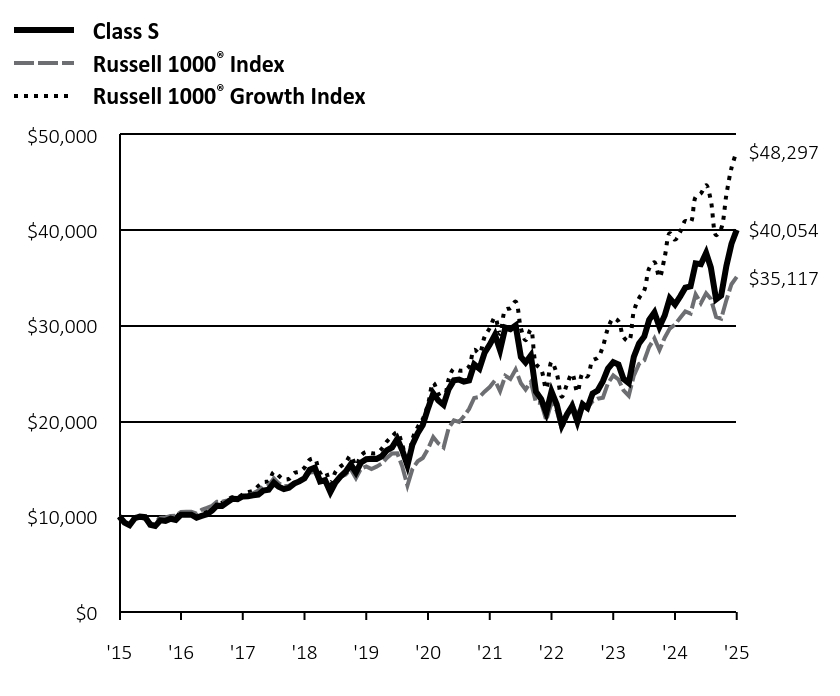 | Class S | Russell 1000® Index | Russell 1000® Growth Index |
|---|
'15 | $10,000 | $10,000 | $10,000 |
|---|
'15 | $9,371 | $9,398 | $9,393 |
|---|
'15 | $9,099 | $9,141 | $9,160 |
|---|
'15 | $9,826 | $9,880 | $9,949 |
|---|
'15 | $9,993 | $9,913 | $9,977 |
|---|
'15 | $9,948 | $9,735 | $9,831 |
|---|
'16 | $9,139 | $9,211 | $9,282 |
|---|
'16 | $9,019 | $9,208 | $9,278 |
|---|
'16 | $9,610 | $9,849 | $9,904 |
|---|
'16 | $9,551 | $9,903 | $9,813 |
|---|
'16 | $9,774 | $10,076 | $10,004 |
|---|
'16 | $9,648 | $10,099 | $9,964 |
|---|
'16 | $10,198 | $10,484 | $10,435 |
|---|
'16 | $10,180 | $10,497 | $10,383 |
|---|
'16 | $10,198 | $10,506 | $10,421 |
|---|
'16 | $9,886 | $10,301 | $10,176 |
|---|
'16 | $10,065 | $10,707 | $10,398 |
|---|
'16 | $10,236 | $10,908 | $10,526 |
|---|
'17 | $10,635 | $11,128 | $10,881 |
|---|
'17 | $11,143 | $11,558 | $11,333 |
|---|
'17 | $11,110 | $11,566 | $11,464 |
|---|
'17 | $11,486 | $11,688 | $11,726 |
|---|
'17 | $11,857 | $11,837 | $12,031 |
|---|
'17 | $11,833 | $11,920 | $11,999 |
|---|
'17 | $12,113 | $12,156 | $12,318 |
|---|
'17 | $12,143 | $12,194 | $12,544 |
|---|
'17 | $12,234 | $12,453 | $12,707 |
|---|
'17 | $12,313 | $12,739 | $13,200 |
|---|
'17 | $12,728 | $13,127 | $13,601 |
|---|
'17 | $12,807 | $13,274 | $13,707 |
|---|
'18 | $13,554 | $14,002 | $14,677 |
|---|
'18 | $13,123 | $13,488 | $14,292 |
|---|
'18 | $12,887 | $13,182 | $13,901 |
|---|
'18 | $13,018 | $13,227 | $13,949 |
|---|
'18 | $13,457 | $13,565 | $14,560 |
|---|
'18 | $13,685 | $13,652 | $14,701 |
|---|
'18 | $14,021 | $14,124 | $15,132 |
|---|
'18 | $14,912 | $14,610 | $15,960 |
|---|
'18 | $15,135 | $14,666 | $16,049 |
|---|
'18 | $13,688 | $13,628 | $14,614 |
|---|
'18 | $13,807 | $13,905 | $14,769 |
|---|
'18 | $12,564 | $12,639 | $13,499 |
|---|
'19 | $13,605 | $13,698 | $14,712 |
|---|
'19 | $14,187 | $14,162 | $15,239 |
|---|
'19 | $14,706 | $14,408 | $15,673 |
|---|
'19 | $15,463 | $14,990 | $16,381 |
|---|
'19 | $14,621 | $14,035 | $15,346 |
|---|
'19 | $15,668 | $15,020 | $16,400 |
|---|
'19 | $16,018 | $15,253 | $16,770 |
|---|
'19 | $16,063 | $14,974 | $16,642 |
|---|
'19 | $16,039 | $15,234 | $16,644 |
|---|
'19 | $16,322 | $15,557 | $17,113 |
|---|
'19 | $16,953 | $16,144 | $17,872 |
|---|
'19 | $17,249 | $16,611 | $18,411 |
|---|
'20 | $18,145 | $16,629 | $18,823 |
|---|
'20 | $16,965 | $15,270 | $17,541 |
|---|
'20 | $15,380 | $13,252 | $15,815 |
|---|
'20 | $17,565 | $15,003 | $18,156 |
|---|
'20 | $18,748 | $15,795 | $19,375 |
|---|
'20 | $19,599 | $16,144 | $20,218 |
|---|
'20 | $21,340 | $17,089 | $21,774 |
|---|
'20 | $22,909 | $18,343 | $24,021 |
|---|
'20 | $22,166 | $17,673 | $22,890 |
|---|
'20 | $21,707 | $17,247 | $22,113 |
|---|
'20 | $23,359 | $19,278 | $24,377 |
|---|
'20 | $24,278 | $20,093 | $25,498 |
|---|
'21 | $24,354 | $19,927 | $25,310 |
|---|
'21 | $24,152 | $20,505 | $25,304 |
|---|
'21 | $24,265 | $21,281 | $25,739 |
|---|
'21 | $25,960 | $22,426 | $27,490 |
|---|
'21 | $25,511 | $22,533 | $27,110 |
|---|
'21 | $27,143 | $23,097 | $28,810 |
|---|
'21 | $28,031 | $23,577 | $29,760 |
|---|
'21 | $29,058 | $24,260 | $30,873 |
|---|
'21 | $27,442 | $23,145 | $29,144 |
|---|
'21 | $29,802 | $24,751 | $31,668 |
|---|
'21 | $29,643 | $24,419 | $31,861 |
|---|
'21 | $30,035 | $25,408 | $32,535 |
|---|
'22 | $26,745 | $23,976 | $29,743 |
|---|
'22 | $26,156 | $23,318 | $28,479 |
|---|
'22 | $26,889 | $24,105 | $29,594 |
|---|
'22 | $23,096 | $21,956 | $26,020 |
|---|
'22 | $22,316 | $21,923 | $25,415 |
|---|
'22 | $20,871 | $20,087 | $23,402 |
|---|
'22 | $23,111 | $21,958 | $26,210 |
|---|
'22 | $21,767 | $21,114 | $24,989 |
|---|
'22 | $19,564 | $19,161 | $22,560 |
|---|
'22 | $20,727 | $20,697 | $23,879 |
|---|
'22 | $21,579 | $21,817 | $24,967 |
|---|
'22 | $19,945 | $20,549 | $23,055 |
|---|
'23 | $21,750 | $21,926 | $24,977 |
|---|
'23 | $21,380 | $21,404 | $24,680 |
|---|
'23 | $22,902 | $22,082 | $26,367 |
|---|
'23 | $23,219 | $22,355 | $26,628 |
|---|
'23 | $24,190 | $22,459 | $27,841 |
|---|
'23 | $25,519 | $23,976 | $29,745 |
|---|
'23 | $26,176 | $24,801 | $30,747 |
|---|
'23 | $25,934 | $24,367 | $30,471 |
|---|
'23 | $24,431 | $23,222 | $28,814 |
|---|
'23 | $23,993 | $22,660 | $28,404 |
|---|
'23 | $26,746 | $24,777 | $31,500 |
|---|
'23 | $28,144 | $26,000 | $32,895 |
|---|
'24 | $28,878 | $26,362 | $33,715 |
|---|
'24 | $30,627 | $27,786 | $36,016 |
|---|
'24 | $31,396 | $28,677 | $36,650 |
|---|
'24 | $29,893 | $27,457 | $35,095 |
|---|
'24 | $31,073 | $28,749 | $37,196 |
|---|
'24 | $32,860 | $29,701 | $39,704 |
|---|
'24 | $32,226 | $30,133 | $39,029 |
|---|
'24 | $33,087 | $30,847 | $39,842 |
|---|
'24 | $33,994 | $31,507 | $40,971 |
|---|
'24 | $34,129 | $31,287 | $40,835 |
|---|
'24 | $36,546 | $33,301 | $43,484 |
|---|
'24 | $36,455 | $32,373 | $43,867 |
|---|
'25 | $37,637 | $33,403 | $44,735 |
|---|
'25 | $36,100 | $32,819 | $43,128 |
|---|
'25 | $32,756 | $30,920 | $39,495 |
|---|
'25 | $33,157 | $30,736 | $40,194 |
|---|
'25 | $36,280 | $32,698 | $43,751 |
|---|
'25 | $38,589 | $34,353 | $46,540 |
|---|
'25 | $40,054 | $35,117 | $48,297 |
|---|
|
| Average Annual Return [Table Text Block] |
|
Class/Index
| 1-Year | 5-Year | 10-Year |
|---|
Class S No Sales Charge | 24.29% | 13.42% | 14.89% |
|---|
Russell 1000® Index | 16.54% | 15.49% | 13.38% |
|---|
Russell 1000® Growth Index | 23.75% | 17.27% | 17.06% |
|---|
|
| No Deduction of Taxes [Text Block] |
|
The performance graph and returns table do not reflect the deduction of taxes that a shareholder would pay on Fund distributions or the redemption of Fund shares.
|
| Material Change Date |
Aug. 01, 2024
|
|
| AssetsNet |
|
$ 398,672,852
|
| Holdings Count | Holding |
|
51
|
| Advisory Fees Paid, Amount |
|
$ 2,263,011
|
| InvestmentCompanyPortfolioTurnover |
|
15.00%
|
| Additional Fund Statistics [Text Block] |
|
Net Assets ($) | 398,672,852 |
|---|
Number of Portfolio Holdings | 51 |
|---|
Portfolio Turnover Rate (%) | 15 |
|---|
Total Net Advisory Fees Paid ($) | 2,263,011 |
|---|
|
| Holdings [Text Block] |
|
Asset Type | % of Net Assets |
|---|
Common Stocks | 99% |
|---|
Cash Equivalents | 1% |
|---|
Other Assets and Liabilities, Net | 0% |
|---|
Total | 100% |
|---|
Sector | % of Net Assets |
|---|
Information Technology | 49% |
|---|
Consumer Discretionary | 12% |
|---|
Communication Services | 12% |
|---|
Health Care | 10% |
|---|
Financials | 8% |
|---|
Industrials | 6% |
|---|
Real Estate | 2% |
|---|
Consumer Staples | 1% |
|---|
Ten Largest Equity HoldingsHoldings | 63.6% of Net Assets |
|---|
NVIDIA Corp. | 14.6% | Microsoft Corp. | 12.5% | Amazon.com, Inc. | 7.7% | Apple, Inc. | 6.4% | Alphabet, Inc. | 4.8% | Broadcom, Inc. | 4.7% | Meta Platforms, Inc. | 4.5% | Visa, Inc. | 3.7% | Progressive Corp. | 2.6% | ServiceNow, Inc. | 2.1% |
|
| Material Fund Change [Text Block] |
|
This is a summary of certain changes of the Fund since August 1, 2024. For more information, review the Fund's current prospectus at dws.com/mutualreports, or call (800) 728-3337. On November 21, 2024, the Fund’s shareholders approved a change in the Fund’s diversification classification under the Investment Company Act of 1940, as amended, from diversified to non-diversified. This means the Fund may invest in securities of relatively few issuers. Thus, the performance of one or a small number of portfolio holdings can affect the Fund’s overall performance. |
| Material Fund Change Risks Change [Text Block] |
|
On November 21, 2024, the Fund’s shareholders approved a change in the Fund’s diversification classification under the Investment Company Act of 1940, as amended, from diversified to non-diversified. This means the Fund may invest in securities of relatively few issuers. Thus, the performance of one or a small number of portfolio holdings can affect the Fund’s overall performance.
|
| Summary of Change Legend [Text Block] |
|
This is a summary of certain changes of the Fund since August 1, 2024. For more information, review the Fund's current prospectus at dws.com/mutualreports, or call (800) 728-3337.
|
| C000015690 |
|
|
| Shareholder Report [Line Items] |
|
|
| Fund Name |
|
DWS Large Cap Focus Growth Fund
|
| Class Name |
|
Institutional Class
|
| Trading Symbol |
|
SGGIX
|
| Annual or Semi-Annual Statement [Text Block] |
|
This annual shareholder report contains important information about DWS Large Cap Focus Growth Fund (the "Fund") for the period August 1, 2024 to July 31, 2025.
|
| Shareholder Report Annual or Semi-Annual |
|
Annual Shareholder Report
|
| Additional Information [Text Block] |
|
You can find additional information about the Fund on the Fund's website at dws.com/mutualreports. You can also request this information by contacting us at (800) 728-3337.
|
| Material Fund Change Notice [Text Block] |
|
This report describes changes to the Fund that occurred during the reporting period.
|
| Additional Information Phone Number |
|
(800) 728-3337
|
| Additional Information Website |
|
<span style="box-sizing: border-box; color: rgb(0, 0, 0); display: inline; flex-wrap: nowrap; font-size: 14.6667px; font-weight: 300; grid-area: auto; line-height: 17.6px; margin: 0px; overflow: visible; text-align: left; text-align-last: auto; white-space-collapse: preserve-breaks;">dws.com/mutualreports</span>
|
| Expenses [Text Block] |
|
What were the Fund costs for the last year?(Based on a hypothetical $10,000 investment) Fund | Costs of a $10,000 investment | Costs paid as a percentage of a $10,000 investment |
|---|
Institutional Class | $92 | 0.82% |
|---|
Gross expense ratio as of the latest prospectus: 0.90%. See prospectus for any contractual or voluntary waivers; without a waiver, costs would have been higher. |
| Expenses Paid, Amount |
|
$ 92
|
| Expense Ratio, Percent |
|
0.82%
|
| Factors Affecting Performance [Text Block] |
|
How did the Fund perform last year and what affected its performance? Institutional Class shares of the Fund returned 24.29% for the period ended July 31, 2025. The Fund's broad-based index, the Russell 1000® Index, returned 16.54% for the same period, while the Fund's additional, more narrowly based index, the Russell 1000® Growth Index, returned 23.75%. Stock selection was the primary driver of the Fund’s outperformance relative to the Russell 1000® Growth Index. The Fund produced the best results in the industrials sector, led by a position in Axon Entreprises, Inc. (2.1%). The company experienced surging demand for its law enforcement technologies, boosting its share price. Vertiv Holdings Co. (1.3%), a provider of infrastructure for data centers, was an additional contributor thanks to record bookings and strong earnings. The gaming platform company Roblox Corp. (1.1%), which gained on evidence of its growing ability to monetize its customer base, was the leading contributor outside of industrials. The Fund also benefited from an overweight in NVIDIA Corp. (14.6%). The stock surged on expectations that its central role in artificial intelligence will fuel outsized long-term growth. CyberArk Software Ltd. (1.2%), a cloud infrastructure software and IT security company that benefited from rising enterprise spending on security to combat cyber threats, was another key contributor. An underweight in Apple, Inc. (6.4%) further contributed to relative performance, as did zero weightings in several stocks that underperformed, most notably Eli Lilly & Co. The Fund experienced the weakest relative performance in information technology despite holding a number of outperforming stocks in the sector. Shares of the IT services company Globant SA (0.7%) fell after management provided underwhelming initial guidance for 2025 amid concerns about softness in enterprise IT services budgets. Confluent Inc. (0.5%) also lagged due to its inconsistent execution and reduced spending by its customers. Underweights or zero weightings in several winners, most notably Palantir Technologies, Inc., also detracted. Although the Fund performed well in healthcare overall, several holdings were among the largest individual detractors. Thermo Fisher Scientific, Inc. (1.2%) was a notable laggard amid questions about its long-term financial targets. Zoetis, Inc. (1.1%), which was hurt by rising competition and lower-than-expected sales growth, and Evolent Health, Inc.,* which faced profit-margin pressures, were additional detractors of note. Percentages in parentheses are based on the Fund’s net assets as of July 31, 2025. * Not held at July 31, 2025. |
| Performance Past Does Not Indicate Future [Text] |
|
The Fund's past performance is not a good predictor or guarantee of the Fund's future performance.
|
| Line Graph [Table Text Block] |
|
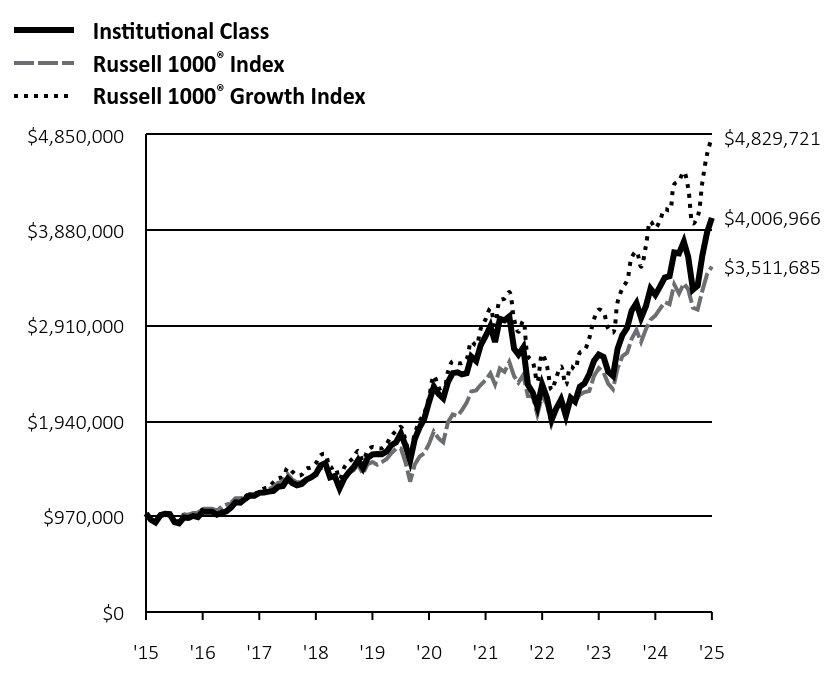 | Institutional Class | Russell 1000® Index | Russell 1000® Growth Index |
|---|
'15 | $1,000,000 | $1,000,000 | $1,000,000 |
|---|
'15 | $937,295 | $939,847 | $939,271 |
|---|
'15 | $909,985 | $914,088 | $916,035 |
|---|
'15 | $982,740 | $988,046 | $994,911 |
|---|
'15 | $999,345 | $991,310 | $997,704 |
|---|
'15 | $994,827 | $973,476 | $983,063 |
|---|
'16 | $913,926 | $921,079 | $928,181 |
|---|
'16 | $902,044 | $920,763 | $927,785 |
|---|
'16 | $960,950 | $984,904 | $990,356 |
|---|
'16 | $955,388 | $990,260 | $981,312 |
|---|
'16 | $977,636 | $1,007,601 | $1,000,368 |
|---|
'16 | $964,995 | $1,009,883 | $996,439 |
|---|
'16 | $1,019,856 | $1,048,354 | $1,043,473 |
|---|
'16 | $1,018,339 | $1,049,747 | $1,038,289 |
|---|
'16 | $1,019,856 | $1,050,578 | $1,042,087 |
|---|
'16 | $988,760 | $1,030,092 | $1,017,616 |
|---|
'16 | $1,006,457 | $1,070,702 | $1,039,758 |
|---|
'16 | $1,023,742 | $1,090,817 | $1,052,629 |
|---|
'17 | $1,063,617 | $1,112,752 | $1,088,101 |
|---|
'17 | $1,114,614 | $1,155,824 | $1,133,296 |
|---|
'17 | $1,111,088 | $1,156,554 | $1,146,404 |
|---|
'17 | $1,148,793 | $1,168,781 | $1,172,622 |
|---|
'17 | $1,185,956 | $1,183,697 | $1,203,113 |
|---|
'17 | $1,183,244 | $1,191,962 | $1,199,943 |
|---|
'17 | $1,211,184 | $1,215,567 | $1,231,837 |
|---|
'17 | $1,214,439 | $1,219,369 | $1,254,418 |
|---|
'17 | $1,223,390 | $1,245,336 | $1,270,728 |
|---|
'17 | $1,231,528 | $1,273,899 | $1,319,965 |
|---|
'17 | $1,272,760 | $1,312,748 | $1,360,065 |
|---|
'17 | $1,280,878 | $1,327,383 | $1,370,653 |
|---|
'18 | $1,355,662 | $1,400,247 | $1,467,731 |
|---|
'18 | $1,312,366 | $1,348,839 | $1,429,246 |
|---|
'18 | $1,288,750 | $1,318,223 | $1,390,052 |
|---|
'18 | $1,301,683 | $1,322,703 | $1,394,908 |
|---|
'18 | $1,345,541 | $1,356,466 | $1,456,049 |
|---|
'18 | $1,368,594 | $1,365,238 | $1,470,068 |
|---|
'18 | $1,402,331 | $1,412,354 | $1,513,224 |
|---|
'18 | $1,491,453 | $1,461,020 | $1,595,962 |
|---|
'18 | $1,513,663 | $1,466,568 | $1,604,882 |
|---|
'18 | $1,368,875 | $1,362,789 | $1,461,362 |
|---|
'18 | $1,380,965 | $1,390,523 | $1,476,884 |
|---|
'18 | $1,256,775 | $1,263,878 | $1,349,905 |
|---|
'19 | $1,359,995 | $1,369,795 | $1,471,243 |
|---|
'19 | $1,418,297 | $1,416,174 | $1,523,884 |
|---|
'19 | $1,470,353 | $1,440,829 | $1,567,258 |
|---|
'19 | $1,545,611 | $1,499,016 | $1,638,067 |
|---|
'19 | $1,461,726 | $1,403,492 | $1,534,585 |
|---|
'19 | $1,566,433 | $1,502,023 | $1,639,975 |
|---|
'19 | $1,601,236 | $1,525,349 | $1,677,007 |
|---|
'19 | $1,605,698 | $1,497,411 | $1,664,163 |
|---|
'19 | $1,603,913 | $1,523,366 | $1,664,370 |
|---|
'19 | $1,632,469 | $1,555,651 | $1,711,291 |
|---|
'19 | $1,695,531 | $1,614,441 | $1,787,209 |
|---|
'19 | $1,725,407 | $1,661,064 | $1,841,131 |
|---|
'20 | $1,815,292 | $1,662,857 | $1,882,290 |
|---|
'20 | $1,697,122 | $1,526,973 | $1,754,103 |
|---|
'20 | $1,539,038 | $1,325,184 | $1,581,542 |
|---|
'20 | $1,757,150 | $1,500,298 | $1,815,565 |
|---|
'20 | $1,875,320 | $1,579,456 | $1,937,451 |
|---|
'20 | $1,960,490 | $1,614,384 | $2,021,817 |
|---|
'20 | $2,134,602 | $1,708,916 | $2,177,374 |
|---|
'20 | $2,291,743 | $1,834,345 | $2,402,062 |
|---|
'20 | $2,217,259 | $1,767,304 | $2,289,045 |
|---|
'20 | $2,171,373 | $1,724,686 | $2,211,305 |
|---|
'20 | $2,336,371 | $1,927,780 | $2,437,725 |
|---|
'20 | $2,428,497 | $2,009,278 | $2,549,839 |
|---|
'21 | $2,436,354 | $1,992,730 | $2,530,973 |
|---|
'21 | $2,415,729 | $2,050,480 | $2,530,387 |
|---|
'21 | $2,427,187 | $2,128,077 | $2,573,860 |
|---|
'21 | $2,596,769 | $2,242,633 | $2,748,982 |
|---|
'21 | $2,551,591 | $2,253,279 | $2,710,960 |
|---|
'21 | $2,714,953 | $2,309,740 | $2,881,040 |
|---|
'21 | $2,804,000 | $2,357,722 | $2,975,988 |
|---|
'21 | $2,906,797 | $2,425,960 | $3,087,257 |
|---|
'21 | $2,744,745 | $2,314,526 | $2,914,353 |
|---|
'21 | $2,980,785 | $2,475,125 | $3,166,781 |
|---|
'21 | $2,965,071 | $2,441,922 | $3,186,143 |
|---|
'21 | $3,004,413 | $2,540,833 | $3,253,507 |
|---|
'22 | $2,675,050 | $2,397,580 | $2,974,274 |
|---|
'22 | $2,616,426 | $2,331,787 | $2,847,946 |
|---|
'22 | $2,689,618 | $2,410,474 | $2,959,351 |
|---|
'22 | $2,310,513 | $2,195,603 | $2,601,975 |
|---|
'22 | $2,232,347 | $2,192,266 | $2,541,485 |
|---|
'22 | $2,087,740 | $2,008,664 | $2,340,171 |
|---|
'22 | $2,311,934 | $2,195,750 | $2,621,041 |
|---|
'22 | $2,177,631 | $2,111,441 | $2,498,942 |
|---|
'22 | $1,956,990 | $1,916,075 | $2,256,006 |
|---|
'22 | $2,073,528 | $2,069,745 | $2,387,866 |
|---|
'22 | $2,158,445 | $2,181,713 | $2,496,674 |
|---|
'22 | $1,995,168 | $2,054,850 | $2,305,537 |
|---|
'23 | $2,175,939 | $2,192,617 | $2,497,698 |
|---|
'23 | $2,138,820 | $2,140,442 | $2,468,035 |
|---|
'23 | $2,291,010 | $2,208,151 | $2,636,740 |
|---|
'23 | $2,322,561 | $2,235,512 | $2,662,754 |
|---|
'23 | $2,419,814 | $2,245,924 | $2,784,118 |
|---|
'23 | $2,552,701 | $2,397,609 | $2,974,511 |
|---|
'23 | $2,618,403 | $2,480,059 | $3,074,722 |
|---|
'23 | $2,594,275 | $2,436,675 | $3,047,114 |
|---|
'23 | $2,443,942 | $2,322,161 | $2,881,400 |
|---|
'23 | $2,400,141 | $2,266,036 | $2,840,376 |
|---|
'23 | $2,675,567 | $2,477,673 | $3,150,008 |
|---|
'23 | $2,815,536 | $2,599,985 | $3,289,496 |
|---|
'24 | $2,888,804 | $2,636,244 | $3,371,541 |
|---|
'24 | $3,064,043 | $2,778,605 | $3,601,571 |
|---|
'24 | $3,140,711 | $2,867,679 | $3,664,974 |
|---|
'24 | $2,990,020 | $2,745,653 | $3,509,521 |
|---|
'24 | $3,108,609 | $2,874,945 | $3,719,619 |
|---|
'24 | $3,286,869 | $2,970,097 | $3,970,439 |
|---|
'24 | $3,223,798 | $3,013,320 | $3,902,900 |
|---|
'24 | $3,309,907 | $3,084,746 | $3,984,189 |
|---|
'24 | $3,400,548 | $3,150,703 | $4,097,063 |
|---|
'24 | $3,414,144 | $3,128,688 | $4,083,505 |
|---|
'24 | $3,655,476 | $3,330,110 | $4,348,363 |
|---|
'24 | $3,646,495 | $3,237,268 | $4,386,747 |
|---|
'25 | $3,764,877 | $3,340,316 | $4,473,518 |
|---|
'25 | $3,611,267 | $3,281,890 | $4,312,799 |
|---|
'25 | $3,276,602 | $3,091,955 | $3,949,491 |
|---|
'25 | $3,316,746 | $3,073,554 | $4,019,439 |
|---|
'25 | $3,628,881 | $3,269,762 | $4,375,081 |
|---|
'25 | $3,859,910 | $3,435,347 | $4,654,022 |
|---|
'25 | $4,006,966 | $3,511,685 | $4,829,721 |
|---|
|
| Average Annual Return [Table Text Block] |
|
Class/Index
| 1-Year | 5-Year | 10-Year |
|---|
Institutional Class No Sales Charge | 24.29% | 13.42% | 14.89% |
|---|
Russell 1000® Index | 16.54% | 15.49% | 13.38% |
|---|
Russell 1000® Growth Index | 23.75% | 17.27% | 17.06% |
|---|
|
| No Deduction of Taxes [Text Block] |
|
The performance graph and returns table do not reflect the deduction of taxes that a shareholder would pay on Fund distributions or the redemption of Fund shares.
|
| Material Change Date |
Aug. 01, 2024
|
|
| AssetsNet |
|
$ 398,672,852
|
| Holdings Count | Holding |
|
51
|
| Advisory Fees Paid, Amount |
|
$ 2,263,011
|
| InvestmentCompanyPortfolioTurnover |
|
15.00%
|
| Additional Fund Statistics [Text Block] |
|
Net Assets ($) | 398,672,852 |
|---|
Number of Portfolio Holdings | 51 |
|---|
Portfolio Turnover Rate (%) | 15 |
|---|
Total Net Advisory Fees Paid ($) | 2,263,011 |
|---|
|
| Holdings [Text Block] |
|
Asset Type | % of Net Assets |
|---|
Common Stocks | 99% |
|---|
Cash Equivalents | 1% |
|---|
Other Assets and Liabilities, Net | 0% |
|---|
Total | 100% |
|---|
Sector | % of Net Assets |
|---|
Information Technology | 49% |
|---|
Consumer Discretionary | 12% |
|---|
Communication Services | 12% |
|---|
Health Care | 10% |
|---|
Financials | 8% |
|---|
Industrials | 6% |
|---|
Real Estate | 2% |
|---|
Consumer Staples | 1% |
|---|
Ten Largest Equity HoldingsHoldings | 63.6% of Net Assets |
|---|
NVIDIA Corp. | 14.6% | Microsoft Corp. | 12.5% | Amazon.com, Inc. | 7.7% | Apple, Inc. | 6.4% | Alphabet, Inc. | 4.8% | Broadcom, Inc. | 4.7% | Meta Platforms, Inc. | 4.5% | Visa, Inc. | 3.7% | Progressive Corp. | 2.6% | ServiceNow, Inc. | 2.1% |
|
| Material Fund Change [Text Block] |
|
This is a summary of certain changes of the Fund since August 1, 2024. For more information, review the Fund's current prospectus at dws.com/mutualreports, or call (800) 728-3337. On November 21, 2024, the Fund’s shareholders approved a change in the Fund’s diversification classification under the Investment Company Act of 1940, as amended, from diversified to non-diversified. This means the Fund may invest in securities of relatively few issuers. Thus, the performance of one or a small number of portfolio holdings can affect the Fund’s overall performance. |
| Material Fund Change Risks Change [Text Block] |
|
On November 21, 2024, the Fund’s shareholders approved a change in the Fund’s diversification classification under the Investment Company Act of 1940, as amended, from diversified to non-diversified. This means the Fund may invest in securities of relatively few issuers. Thus, the performance of one or a small number of portfolio holdings can affect the Fund’s overall performance.
|
| Summary of Change Legend [Text Block] |
|
This is a summary of certain changes of the Fund since August 1, 2024. For more information, review the Fund's current prospectus at dws.com/mutualreports, or call (800) 728-3337.
|