Performance Management - BFS Equity Fund
|
Oct. 01, 2025 |
| Prospectus [Line Items] |
|
| Bar Chart and Performance Table [Heading] |
Performance
|
| Performance Narrative [Text Block] |
The
bar chart below shows how the Fund’s investment results have varied from year to year. The table below shows how the Fund’s
average annual total returns for the one-year, five-year, and ten-year periods compare over time
to those of a broad-based securities market index as well as a secondary benchmark. The performance information prior to November 3,
2023, is for Investor Class shares of the Fund, which were exchanged for Institutional Class shares of the Fund on November 3, 2023.
The Institutional Class shares of the Fund had no operating history prior to the exchange. This information provides some indication
of the risks of investing in the Fund. Past performance (before and after taxes) of the Fund is no guarantee of how it will perform in
the future.
|
| Performance Past Does Not Indicate Future [Text] |
Past performance (before and after taxes) of the Fund is no guarantee of how it will perform in
the future.
|
| Performance Information Illustrates Variability of Returns [Text] |
The
bar chart below shows how the Fund’s investment results have varied from year to year. The table below shows how the Fund’s
average annual total returns for the one-year, five-year, and ten-year periods compare over time
to those of a broad-based securities market index as well as a secondary benchmark.
|
| Bar Chart [Heading] |
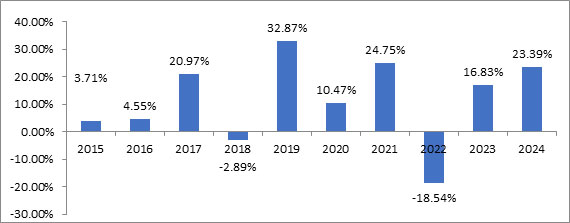
Annual
Total Return (years ended December 31st)
|
| Bar Chart [Table] |
| |
2015 |
2016 |
2017 |
2018 |
2019 |
2020 |
2021 |
2022 |
2023 |
2024 |
| |
3.71% |
4.55% |
20.97% |
-2.89% |
32.87% |
10.47% |
24.75% |
-18.54% |
16.83% |
23.39% |
|
| Bar Chart Closing [Text Block] |
Highest/Lowest
quarterly results during this time period were:
| Highest
Quarter: |
2nd
Quarter, 2020, 18.12% |
| Lowest
Quarter: |
1st
Quarter, 2020, (22.33%) |
The
year to date return as of June 30, 2025 was 3.14%.
|
| Year to Date Return, Label [Optional Text] |
The
year to date return
|
| Bar Chart, Year to Date Return |
3.14%
|
| Bar Chart, Year to Date Return, Date |
Jun. 30, 2025
|
| Highest Quarterly Return, Label [Optional Text] |
Highest
Quarter:
|
| Highest Quarterly Return |
18.12%
|
| Highest Quarterly Return, Date |
Jun. 30, 2020
|
| Lowest Quarterly Return, Label [Optional Text] |
Lowest
Quarter:
|
| Lowest Quarterly Return |
(22.33%)
|
| Lowest Quarterly Return, Date |
Mar. 31, 2020
|
| Performance Table Heading |
Average
Annual Total Returns for the periods ending December 31, 2024:
|
| Performance Table Uses Highest Federal Rate |
After-tax
returns are calculated using the historical highest individual federal marginal income tax rates in effect and do not reflect the impact
of state and local taxes.
|
| Performance Table Not Relevant to Tax Deferred |
Actual after-tax returns depend on an investor’s tax situation and may differ from those shown. After-tax
returns shown are not relevant to investors who hold their Fund shares through tax-advantaged arrangements, such as 401(k) plans or individual
retirement accounts (“IRAs”).
|
| Performance [Table] |
| BFS
Equity Fund |
1
Year |
5
Years |
10
Years |
| Institutional
Class Return Before Taxes |
23.39% |
10.11% |
10.60% |
| Institutional
Class Return After Taxes on Distributions |
22.91% |
9.28% |
10.02% |
| Institutional
Class Return After Taxes on Distributions and Sale of Fund Shares |
14.20% |
7.82% |
8.61% |
S&P
500 Index®
(reflects no deduction for fees, expenses, or taxes) |
25.02% |
14.53% |
13.10% |
Dow
Jones Industrial Average
(reflects no deduction for fees, expenses, or taxes) |
14.99% |
10.55% |
11.57% |
|
| Index No Deduction for Fees, Expenses, or Taxes [Text] |
reflects no deduction for fees, expenses, or taxes
|
| Performance Table Closing [Text Block] |
After-tax
returns are calculated using the historical highest individual federal marginal income tax rates in effect and do not reflect the impact
of state and local taxes. Actual after-tax returns depend on an investor’s tax situation and may differ from those shown. After-tax
returns shown are not relevant to investors who hold their Fund shares through tax-advantaged arrangements, such as 401(k) plans or individual
retirement accounts (“IRAs”).
Current
performance of the Fund may be lower or higher than the performance quoted above. Performance data current to the most recent month end
may be obtained by calling (855) 575-2430.
|
| Performance Availability Phone [Text] |
(855) 575-2430
|