Shareholder Report
|
|
12 Months Ended |
Aug. 01, 2024 |
Jul. 31, 2025
USD ($)
Holding
|
| Shareholder Report [Line Items] |
|
|
| Document Type |
|
N-CSR
|
| Amendment Flag |
|
false
|
| Registrant Name |
|
ALLSPRING FUNDS TRUST
|
| Entity Central Index Key |
|
0001081400
|
| Entity Investment Company Type |
|
N-1A
|
| Document Period End Date |
|
Jul. 31, 2025
|
| C000092805 |
|
|
| Shareholder Report [Line Items] |
|
|
| Fund Name |
|
Disciplined U.S. Core Fund
|
| Class Name |
|
Institutional Class
|
| Trading Symbol |
|
EVSIX
|
| Annual or Semi-Annual Statement [Text Block] |
|
This annual shareholder report contains important information about Disciplined U.S. Core Fund for the period from August 1, 2024 to July 31, 2025.
|
| Shareholder Report Annual or Semi-Annual |
|
Annual Shareholder Report
|
| Additional Information [Text Block] |
|
You can find additional information about the Fund at allspringglobal.com. You can also request this information by contacting us at 1-800-222-8222.
|
| Additional Information Phone Number |
|
<span style="white-space: nowrap; box-sizing: border-box; color: rgb(0, 0, 0); display: inline; flex-wrap: nowrap; font-size: 12px; font-weight: 400; grid-area: auto; line-height: 18px; margin: 0px; overflow: visible; text-align: left; text-align-last: auto;"> 1-800-222-8222.</span>
|
| Additional Information Website |
|
<span style="box-sizing: border-box; color: rgb(0, 0, 0); display: inline; flex-wrap: nowrap; font-size: 12px; font-weight: 400; grid-area: auto; line-height: 18px; margin: 0px; overflow: visible; text-align: left; text-align-last: auto; white-space-collapse: preserve-breaks;">allspringglobal.com</span>
|
| Expenses [Text Block] |
|
What were the Fund costs for the past year?The table explains the costs you would have paid within the reporting period based on a hypothetical $10,000 investment.
CLASS NAME |
COSTS OF A $10,000 INVESTMENT |
COSTS PAID AS A % OF A $10,000 INVESTMENT |
Institutional Class |
$52 |
0.48% | The manager has contractually committed to waive fees and/or reimburse certain expenses to the extent necessary to cap the Fund's total annual fund operating expense ratio at a specific amount. Without this cap, the costs shown above may have been higher. Please see the prospectus for the amount and the expiration date of the cap. Prior to or after the commitment expiration date, the cap may be increased or the commitment to maintain the cap may be terminated only with the approval of the Board of Trustees. |
| Expenses Paid, Amount |
|
$ 52
|
| Expense Ratio, Percent |
|
0.48%
|
| Factors Affecting Performance [Text Block] |
|
How did the Fund perform last year and what affected its performance?Over the 12-month period, the U.S. equity market performed positively. Domestic large-cap stocks outperformed domestic small-cap stocks. · Changes to the Fund’s portfolio were minimal. Characteristics that are typically favored in the portfolio include attractive valuation, earnings consistency, profitability, and improving market sentiment. · Stock selection was the main contributor to outperformance, adding value in 7 of 11 sectors. This was primarily due to positive stock selection within the health care, financials, and communication services sectors. The largest individual contributors to relative performance were UnitedHealth Group, Inc.; Interactive Brokers Group, Inc.; and EMCOR Group, Inc. A modest underweight to energy contributed modestly to performance. However, variations in sector weights versus the index were relatively small, which is typical for the strategy. · Negative stock selection within real estate, utilities, and energy detracted from relative performance. The three largest individual detractors from relative performance were the Fund’s underweights to Palantir Technologies, Inc., GE Vernova, Inc., and Oracle Corp. |
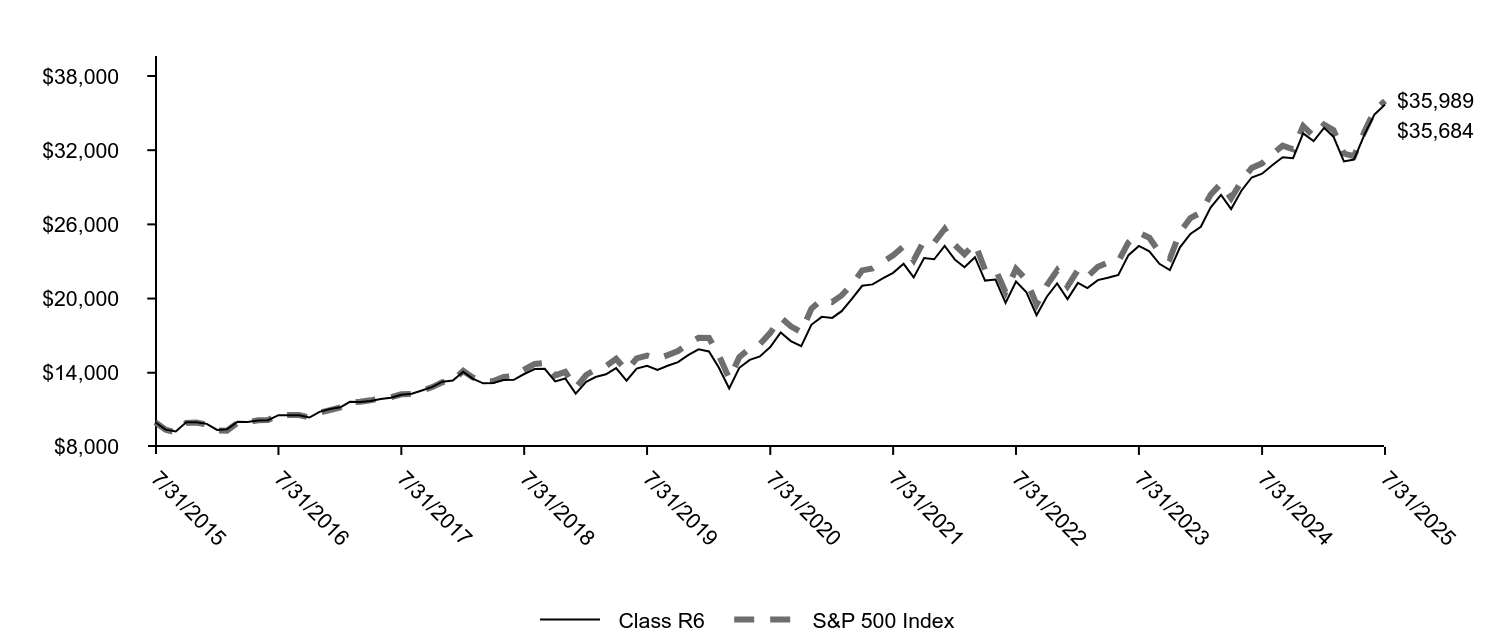
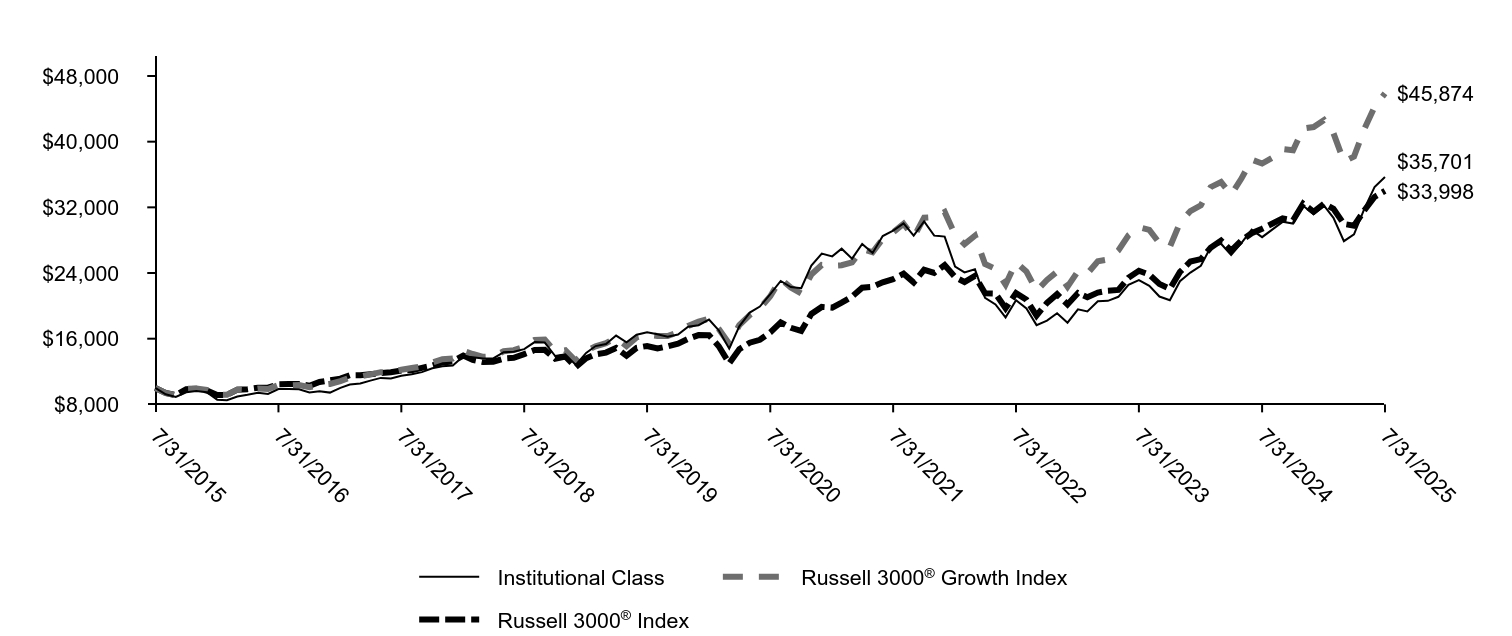
| Line Graph [Table Text Block] |
|

|
Institutional Class |
S&P 500 Index |
7/31/2015 |
$10,000 |
$10,000 |
8/31/2015 |
$9,400 |
$9,397 |
9/30/2015 |
$9,253 |
$9,164 |
10/31/2015 |
$9,981 |
$9,937 |
11/30/2015 |
$9,987 |
$9,967 |
12/31/2015 |
$9,861 |
$9,810 |
1/31/2016 |
$9,373 |
$9,323 |
2/29/2016 |
$9,416 |
$9,310 |
3/31/2016 |
$10,026 |
$9,942 |
4/30/2016 |
$10,004 |
$9,980 |
5/31/2016 |
$10,133 |
$10,160 |
6/30/2016 |
$10,162 |
$10,186 |
7/31/2016 |
$10,564 |
$10,561 |
8/31/2016 |
$10,550 |
$10,576 |
9/30/2016 |
$10,550 |
$10,578 |
10/31/2016 |
$10,370 |
$10,385 |
11/30/2016 |
$10,822 |
$10,770 |
12/31/2016 |
$11,053 |
$10,983 |
1/31/2017 |
$11,200 |
$11,191 |
2/28/2017 |
$11,628 |
$11,635 |
3/31/2017 |
$11,620 |
$11,649 |
4/30/2017 |
$11,709 |
$11,769 |
5/31/2017 |
$11,856 |
$11,934 |
6/30/2017 |
$11,959 |
$12,009 |
7/31/2017 |
$12,203 |
$12,256 |
8/31/2017 |
$12,277 |
$12,293 |
9/30/2017 |
$12,549 |
$12,547 |
10/31/2017 |
$12,837 |
$12,840 |
11/30/2017 |
$13,250 |
$13,233 |
12/31/2017 |
$13,360 |
$13,380 |
1/31/2018 |
$14,046 |
$14,147 |
2/28/2018 |
$13,506 |
$13,625 |
3/31/2018 |
$13,121 |
$13,279 |
4/30/2018 |
$13,136 |
$13,330 |
5/31/2018 |
$13,383 |
$13,651 |
6/30/2018 |
$13,406 |
$13,735 |
7/31/2018 |
$13,869 |
$14,246 |
8/31/2018 |
$14,278 |
$14,710 |
9/30/2018 |
$14,293 |
$14,794 |
10/31/2018 |
$13,260 |
$13,783 |
11/30/2018 |
$13,506 |
$14,064 |
12/31/2018 |
$12,280 |
$12,794 |
1/31/2019 |
$13,231 |
$13,819 |
2/28/2019 |
$13,611 |
$14,263 |
3/31/2019 |
$13,834 |
$14,540 |
4/30/2019 |
$14,330 |
$15,129 |
5/31/2019 |
$13,322 |
$14,167 |
6/30/2019 |
$14,288 |
$15,166 |
7/31/2019 |
$14,520 |
$15,384 |
8/31/2019 |
$14,189 |
$15,140 |
9/30/2019 |
$14,520 |
$15,423 |
10/31/2019 |
$14,817 |
$15,757 |
11/30/2019 |
$15,388 |
$16,329 |
12/31/2019 |
$15,847 |
$16,822 |
1/31/2020 |
$15,674 |
$16,816 |
2/29/2020 |
$14,377 |
$15,431 |
3/31/2020 |
$12,700 |
$13,525 |
4/30/2020 |
$14,360 |
$15,259 |
5/31/2020 |
$15,000 |
$15,986 |
6/30/2020 |
$15,268 |
$16,304 |
7/31/2020 |
$16,028 |
$17,223 |
8/31/2020 |
$17,204 |
$18,461 |
9/30/2020 |
$16,504 |
$17,760 |
10/31/2020 |
$16,080 |
$17,287 |
11/30/2020 |
$17,809 |
$19,180 |
12/31/2020 |
$18,457 |
$19,917 |
1/31/2021 |
$18,371 |
$19,716 |
2/28/2021 |
$18,912 |
$20,260 |
3/31/2021 |
$19,925 |
$21,147 |
4/30/2021 |
$20,958 |
$22,276 |
5/31/2021 |
$21,072 |
$22,431 |
6/30/2021 |
$21,545 |
$22,955 |
7/31/2021 |
$22,000 |
$23,500 |
8/31/2021 |
$22,730 |
$24,215 |
9/30/2021 |
$21,631 |
$23,089 |
10/31/2021 |
$23,194 |
$24,706 |
11/30/2021 |
$23,090 |
$24,535 |
12/31/2021 |
$24,167 |
$25,635 |
1/31/2022 |
$23,036 |
$24,308 |
2/28/2022 |
$22,439 |
$23,580 |
3/31/2022 |
$23,241 |
$24,456 |
4/30/2022 |
$21,359 |
$22,323 |
5/31/2022 |
$21,441 |
$22,364 |
6/30/2022 |
$19,558 |
$20,518 |
7/31/2022 |
$21,287 |
$22,410 |
8/31/2022 |
$20,412 |
$21,496 |
9/30/2022 |
$18,570 |
$19,516 |
10/31/2022 |
$20,072 |
$21,096 |
11/30/2022 |
$21,122 |
$22,275 |
12/31/2022 |
$19,860 |
$20,992 |
1/31/2023 |
$21,165 |
$22,311 |
2/28/2023 |
$20,742 |
$21,767 |
3/31/2023 |
$21,388 |
$22,566 |
4/30/2023 |
$21,565 |
$22,918 |
5/31/2023 |
$21,800 |
$23,018 |
6/30/2023 |
$23,387 |
$24,538 |
7/31/2023 |
$24,140 |
$25,327 |
8/31/2023 |
$23,693 |
$24,923 |
9/30/2023 |
$22,694 |
$23,735 |
10/31/2023 |
$22,176 |
$23,236 |
11/30/2023 |
$24,011 |
$25,358 |
12/31/2023 |
$25,089 |
$26,510 |
1/31/2024 |
$25,656 |
$26,956 |
2/29/2024 |
$27,216 |
$28,395 |
3/31/2024 |
$28,235 |
$29,309 |
4/30/2024 |
$27,075 |
$28,111 |
5/31/2024 |
$28,583 |
$29,505 |
6/30/2024 |
$29,627 |
$30,564 |
7/31/2024 |
$29,924 |
$30,936 |
8/31/2024 |
$30,633 |
$31,687 |
9/30/2024 |
$31,239 |
$32,363 |
10/31/2024 |
$31,161 |
$32,070 |
11/30/2024 |
$33,147 |
$33,952 |
12/31/2024 |
$32,545 |
$33,143 |
1/31/2025 |
$33,590 |
$34,066 |
2/28/2025 |
$32,889 |
$33,621 |
3/31/2025 |
$30,896 |
$31,727 |
4/30/2025 |
$31,047 |
$31,512 |
5/31/2025 |
$33,054 |
$33,495 |
6/30/2025 |
$34,676 |
$35,199 |
7/31/2025 |
$35,459 |
$35,989 |
|
| Average Annual Return [Table Text Block] |
|
AVERAGE ANNUAL TOTAL RETURNS (%)
AATR |
1 Year |
5 Years |
10 Years |
Institutional Class |
18.50 |
17.21 |
13.49 |
S&P 500 Index |
16.33 |
15.88 |
13.66 | |
| AssetsNet |
|
$ 1,304,567,477
|
| Holdings Count | Holding |
|
168
|
| Advisory Fees Paid, Amount |
|
$ 4,076,256
|
| InvestmentCompanyPortfolioTurnover |
|
31.00%
|
| Holdings [Text Block] |
|
SECTOR ALLOCATION (% OF LONG-TERM INVESTMENTS)
Information technology |
34.1 |
Financials |
14.0 |
Communication services |
10.2 |
Consumer discretionary |
9.9 |
Health care |
9.1 |
Industrials |
8.3 |
Consumer staples |
4.8 |
Energy |
2.5 |
Utilities |
2.5 |
Real estate |
2.3 |
Materials |
2.3 | |
| Largest Holdings [Text Block] |
|
TOP TEN HOLDINGS (% OF NET ASSETS)
NVIDIA Corp. |
8.0 |
Microsoft Corp. |
7.4 |
Apple, Inc. |
5.6 |
Amazon.com, Inc. |
4.2 |
Meta Platforms, Inc. Class A |
3.5 |
Broadcom, Inc. |
3.1 |
Alphabet, Inc. Class C |
2.1 |
Alphabet, Inc. Class A |
1.8 |
JPMorgan Chase & Co. |
1.6 |
Tesla, Inc. |
1.5 | |
| Material Fund Change [Text Block] |
|
|
| C000163729 |
|
|
| Shareholder Report [Line Items] |
|
|
| Fund Name |
|
Disciplined U.S. Core Fund
|
| Class Name |
|
Class R6
|
| Trading Symbol |
|
EVSRX
|
| Annual or Semi-Annual Statement [Text Block] |
|
This annual shareholder report contains important information about Disciplined U.S. Core Fund for the period from August 1, 2024 to July 31, 2025.
|
| Shareholder Report Annual or Semi-Annual |
|
Annual Shareholder Report
|
| Additional Information [Text Block] |
|
You can find additional information about the Fund at allspringglobal.com. You can also request this information by contacting us at 1-800-222-8222.
|
| Additional Information Phone Number |
|
<span style="white-space: nowrap; box-sizing: border-box; color: rgb(0, 0, 0); display: inline; flex-wrap: nowrap; font-size: 12px; font-weight: 400; grid-area: auto; line-height: 18px; margin: 0px; overflow: visible; text-align: left; text-align-last: auto;"> 1-800-222-8222.</span>
|
| Additional Information Website |
|
<span style="box-sizing: border-box; color: rgb(0, 0, 0); display: inline; flex-wrap: nowrap; font-size: 12px; font-weight: 400; grid-area: auto; line-height: 18px; margin: 0px; overflow: visible; text-align: left; text-align-last: auto; white-space-collapse: preserve-breaks;">allspringglobal.com</span>
|
| Expenses [Text Block] |
|
What were the Fund costs for the past year?The table explains the costs you would have paid within the reporting period based on a hypothetical $10,000 investment.
CLASS NAME |
COSTS OF A $10,000 INVESTMENT |
COSTS PAID AS A % OF A $10,000 INVESTMENT |
Class R6 |
$45 |
0.41% | The manager has contractually committed to waive fees and/or reimburse certain expenses to the extent necessary to cap the Fund's total annual fund operating expense ratio at a specific amount. Without this cap, the costs shown above may have been higher. Please see the prospectus for the amount and the expiration date of the cap. Prior to or after the commitment expiration date, the cap may be increased or the commitment to maintain the cap may be terminated only with the approval of the Board of Trustees. |
| Expenses Paid, Amount |
|
$ 45
|
| Expense Ratio, Percent |
|
0.41%
|
| Factors Affecting Performance [Text Block] |
|
How did the Fund perform last year and what affected its performance?Over the 12-month period, the U.S. equity market performed positively. Domestic large-cap stocks outperformed domestic small-cap stocks. · Changes to the Fund’s portfolio were minimal. Characteristics that are typically favored in the portfolio include attractive valuation, earnings consistency, profitability, and improving market sentiment. · Stock selection was the main contributor to outperformance, adding value in 7 of 11 sectors. This was primarily due to positive stock selection within the health care, financials, and communication services sectors. The largest individual contributors to relative performance were UnitedHealth Group, Inc.; Interactive Brokers Group, Inc.; and EMCOR Group, Inc. A modest underweight to energy contributed modestly to performance. However, variations in sector weights versus the index were relatively small, which is typical for the strategy. · Negative stock selection within real estate, utilities, and energy detracted from relative performance. The three largest individual detractors from relative performance were the Fund’s underweights to Palantir Technologies, Inc., GE Vernova, Inc., and Oracle Corp. |
| Line Graph [Table Text Block] |
|
|
Class R6 |
S&P 500 Index |
7/31/2015 |
$10,000 |
$10,000 |
8/31/2015 |
$9,400 |
$9,397 |
9/30/2015 |
$9,253 |
$9,164 |
10/31/2015 |
$9,987 |
$9,937 |
11/30/2015 |
$9,987 |
$9,967 |
12/31/2015 |
$9,866 |
$9,810 |
1/31/2016 |
$9,375 |
$9,323 |
2/29/2016 |
$9,425 |
$9,310 |
3/31/2016 |
$10,030 |
$9,942 |
4/30/2016 |
$10,008 |
$9,980 |
5/31/2016 |
$10,144 |
$10,160 |
6/30/2016 |
$10,165 |
$10,186 |
7/31/2016 |
$10,570 |
$10,561 |
8/31/2016 |
$10,563 |
$10,576 |
9/30/2016 |
$10,556 |
$10,578 |
10/31/2016 |
$10,378 |
$10,385 |
11/30/2016 |
$10,834 |
$10,770 |
12/31/2016 |
$11,060 |
$10,983 |
1/31/2017 |
$11,206 |
$11,191 |
2/28/2017 |
$11,645 |
$11,635 |
3/31/2017 |
$11,630 |
$11,649 |
4/30/2017 |
$11,718 |
$11,769 |
5/31/2017 |
$11,871 |
$11,934 |
6/30/2017 |
$11,973 |
$12,009 |
7/31/2017 |
$12,215 |
$12,256 |
8/31/2017 |
$12,295 |
$12,293 |
9/30/2017 |
$12,566 |
$12,547 |
10/31/2017 |
$12,858 |
$12,840 |
11/30/2017 |
$13,275 |
$13,233 |
12/31/2017 |
$13,378 |
$13,380 |
1/31/2018 |
$14,074 |
$14,147 |
2/28/2018 |
$13,531 |
$13,625 |
3/31/2018 |
$13,141 |
$13,279 |
4/30/2018 |
$13,164 |
$13,330 |
5/31/2018 |
$13,408 |
$13,651 |
6/30/2018 |
$13,431 |
$13,735 |
7/31/2018 |
$13,898 |
$14,246 |
8/31/2018 |
$14,303 |
$14,710 |
9/30/2018 |
$14,319 |
$14,794 |
10/31/2018 |
$13,294 |
$13,783 |
11/30/2018 |
$13,539 |
$14,064 |
12/31/2018 |
$12,306 |
$12,794 |
1/31/2019 |
$13,266 |
$13,819 |
2/28/2019 |
$13,651 |
$14,263 |
3/31/2019 |
$13,872 |
$14,540 |
4/30/2019 |
$14,373 |
$15,129 |
5/31/2019 |
$13,356 |
$14,167 |
6/30/2019 |
$14,332 |
$15,166 |
7/31/2019 |
$14,561 |
$15,384 |
8/31/2019 |
$14,233 |
$15,140 |
9/30/2019 |
$14,561 |
$15,423 |
10/31/2019 |
$14,856 |
$15,757 |
11/30/2019 |
$15,430 |
$16,329 |
12/31/2019 |
$15,894 |
$16,822 |
1/31/2020 |
$15,722 |
$16,816 |
2/29/2020 |
$14,417 |
$15,431 |
3/31/2020 |
$12,734 |
$13,525 |
4/30/2020 |
$14,400 |
$15,259 |
5/31/2020 |
$15,044 |
$15,986 |
6/30/2020 |
$15,318 |
$16,304 |
7/31/2020 |
$16,074 |
$17,223 |
8/31/2020 |
$17,259 |
$18,461 |
9/30/2020 |
$16,563 |
$17,760 |
10/31/2020 |
$16,143 |
$17,287 |
11/30/2020 |
$17,877 |
$19,180 |
12/31/2020 |
$18,521 |
$19,917 |
1/31/2021 |
$18,436 |
$19,716 |
2/28/2021 |
$18,982 |
$20,260 |
3/31/2021 |
$19,989 |
$21,147 |
4/30/2021 |
$21,034 |
$22,276 |
5/31/2021 |
$21,147 |
$22,431 |
6/30/2021 |
$21,626 |
$22,955 |
7/31/2021 |
$22,078 |
$23,500 |
8/31/2021 |
$22,812 |
$24,215 |
9/30/2021 |
$21,711 |
$23,089 |
10/31/2021 |
$23,283 |
$24,706 |
11/30/2021 |
$23,179 |
$24,535 |
12/31/2021 |
$24,264 |
$25,635 |
1/31/2022 |
$23,130 |
$24,308 |
2/28/2022 |
$22,537 |
$23,580 |
3/31/2022 |
$23,345 |
$24,456 |
4/30/2022 |
$21,455 |
$22,323 |
5/31/2022 |
$21,536 |
$22,364 |
6/30/2022 |
$19,646 |
$20,518 |
7/31/2022 |
$21,383 |
$22,410 |
8/31/2022 |
$20,504 |
$21,496 |
9/30/2022 |
$18,655 |
$19,516 |
10/31/2022 |
$20,167 |
$21,096 |
11/30/2022 |
$21,230 |
$22,275 |
12/31/2022 |
$19,952 |
$20,992 |
1/31/2023 |
$21,271 |
$22,311 |
2/28/2023 |
$20,851 |
$21,767 |
3/31/2023 |
$21,492 |
$22,566 |
4/30/2023 |
$21,679 |
$22,918 |
5/31/2023 |
$21,912 |
$23,018 |
6/30/2023 |
$23,511 |
$24,538 |
7/31/2023 |
$24,258 |
$25,327 |
8/31/2023 |
$23,814 |
$24,923 |
9/30/2023 |
$22,811 |
$23,735 |
10/31/2023 |
$22,297 |
$23,236 |
11/30/2023 |
$24,141 |
$25,358 |
12/31/2023 |
$25,226 |
$26,510 |
1/31/2024 |
$25,802 |
$26,956 |
2/29/2024 |
$27,362 |
$28,395 |
3/31/2024 |
$28,384 |
$29,309 |
4/30/2024 |
$27,234 |
$28,111 |
5/31/2024 |
$28,742 |
$29,505 |
6/30/2024 |
$29,791 |
$30,564 |
7/31/2024 |
$30,098 |
$30,936 |
8/31/2024 |
$30,801 |
$31,687 |
9/30/2024 |
$31,427 |
$32,363 |
10/31/2024 |
$31,351 |
$32,070 |
11/30/2024 |
$33,358 |
$33,952 |
12/31/2024 |
$32,740 |
$33,143 |
1/31/2025 |
$33,803 |
$34,066 |
2/28/2025 |
$33,094 |
$33,621 |
3/31/2025 |
$31,091 |
$31,727 |
4/30/2025 |
$31,240 |
$31,512 |
5/31/2025 |
$33,258 |
$33,495 |
6/30/2025 |
$34,893 |
$35,199 |
7/31/2025 |
$35,684 |
$35,989 |
|
| Average Annual Return [Table Text Block] |
|
AVERAGE ANNUAL TOTAL RETURNS (%)
AATR |
1 Year |
5 Years |
10 Years |
Class R6Footnote Reference* |
18.56 |
17.29 |
13.57 |
S&P 500 Index |
16.33 |
15.88 |
13.66 |
| Footnote |
Description |
Footnote* |
Historical performance shown for the Class R6 shares prior to their inception on September 30, 2015 reflects the performance of the Institutional Class shares, and includes the higher expenses applicable to the Institutional Class shares. If these expenses had not been included, returns for the Class R6 shares would be higher. | |
| AssetsNet |
|
$ 1,304,567,477
|
| Holdings Count | Holding |
|
168
|
| Advisory Fees Paid, Amount |
|
$ 4,076,256
|
| InvestmentCompanyPortfolioTurnover |
|
31.00%
|
| Holdings [Text Block] |
|
SECTOR ALLOCATION (% OF LONG-TERM INVESTMENTS)
Information technology |
34.1 |
Financials |
14.0 |
Communication services |
10.2 |
Consumer discretionary |
9.9 |
Health care |
9.1 |
Industrials |
8.3 |
Consumer staples |
4.8 |
Energy |
2.5 |
Utilities |
2.5 |
Real estate |
2.3 |
Materials |
2.3 | |
| Largest Holdings [Text Block] |
|
TOP TEN HOLDINGS (% OF NET ASSETS)
NVIDIA Corp. |
8.0 |
Microsoft Corp. |
7.4 |
Apple, Inc. |
5.6 |
Amazon.com, Inc. |
4.2 |
Meta Platforms, Inc. Class A |
3.5 |
Broadcom, Inc. |
3.1 |
Alphabet, Inc. Class C |
2.1 |
Alphabet, Inc. Class A |
1.8 |
JPMorgan Chase & Co. |
1.6 |
Tesla, Inc. |
1.5 | |
| Material Fund Change [Text Block] |
|
|
| C000089478 |
|
|
| Shareholder Report [Line Items] |
|
|
| Fund Name |
|
Disciplined U.S. Core Fund
|
| Class Name |
|
Class C
|
| Trading Symbol |
|
EVSTX
|
| Annual or Semi-Annual Statement [Text Block] |
|
This annual shareholder report contains important information about Disciplined U.S. Core Fund for the period from August 1, 2024 to July 31, 2025.
|
| Shareholder Report Annual or Semi-Annual |
|
Annual Shareholder Report
|
| Additional Information [Text Block] |
|
You can find additional information about the Fund at allspringglobal.com. You can also request this information by contacting us at 1-800-222-8222.
|
| Additional Information Phone Number |
|
<span style="white-space: nowrap; box-sizing: border-box; color: rgb(0, 0, 0); display: inline; flex-wrap: nowrap; font-size: 12px; font-weight: 400; grid-area: auto; line-height: 18px; margin: 0px; overflow: visible; text-align: left; text-align-last: auto;"> 1-800-222-8222.</span>
|
| Additional Information Website |
|
<span style="box-sizing: border-box; color: rgb(0, 0, 0); display: inline; flex-wrap: nowrap; font-size: 12px; font-weight: 400; grid-area: auto; line-height: 18px; margin: 0px; overflow: visible; text-align: left; text-align-last: auto; white-space-collapse: preserve-breaks;">allspringglobal.com</span>
|
| Expenses [Text Block] |
|
What were the Fund costs for the past year?The table explains the costs you would have paid within the reporting period based on a hypothetical $10,000 investment.
CLASS NAME |
COSTS OF A $10,000 INVESTMENT |
COSTS PAID AS A % OF A $10,000 INVESTMENT |
Class C |
$172 |
1.58% | The manager has contractually committed to waive fees and/or reimburse certain expenses to the extent necessary to cap the Fund's total annual fund operating expense ratio at a specific amount. Without this cap, the costs shown above may have been higher. Please see the prospectus for the amount and the expiration date of the cap. Prior to or after the commitment expiration date, the cap may be increased or the commitment to maintain the cap may be terminated only with the approval of the Board of Trustees. |
| Expenses Paid, Amount |
|
$ 172
|
| Expense Ratio, Percent |
|
1.58%
|
| Factors Affecting Performance [Text Block] |
|
How did the Fund perform last year and what affected its performance?Over the 12-month period, the U.S. equity market performed positively. Domestic large-cap stocks outperformed domestic small-cap stocks. · Changes to the Fund’s portfolio were minimal. Characteristics that are typically favored in the portfolio include attractive valuation, earnings consistency, profitability, and improving market sentiment. · Stock selection was the main contributor to outperformance, adding value in 7 of 11 sectors. This was primarily due to positive stock selection within the health care, financials, and communication services sectors. The largest individual contributors to relative performance were UnitedHealth Group, Inc.; Interactive Brokers Group, Inc.; and EMCOR Group, Inc. A modest underweight to energy contributed modestly to performance. However, variations in sector weights versus the index were relatively small, which is typical for the strategy. · Negative stock selection within real estate, utilities, and energy detracted from relative performance. The three largest individual detractors from relative performance were the Fund’s underweights to Palantir Technologies, Inc., GE Vernova, Inc., and Oracle Corp. |
| Line Graph [Table Text Block] |
|
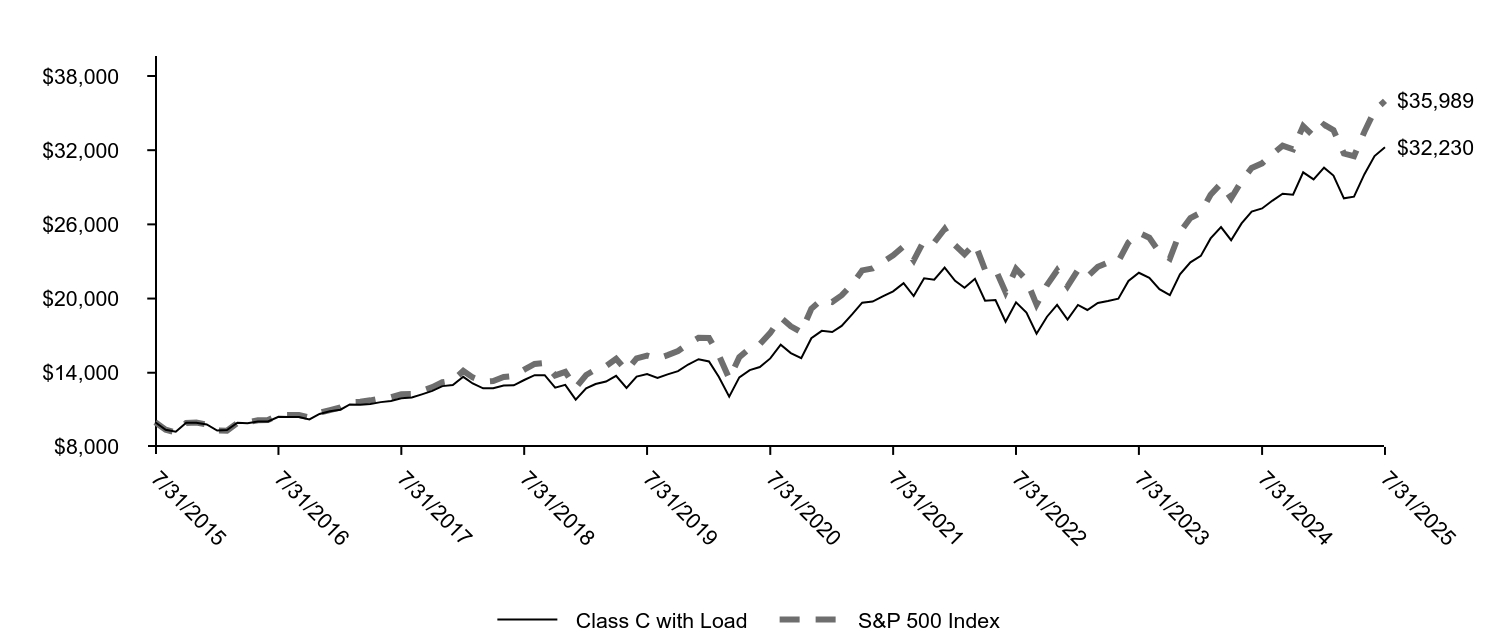
|
Class C with Load |
S&P 500 Index |
7/31/2015 |
$10,000 |
$10,000 |
8/31/2015 |
$9,393 |
$9,397 |
9/30/2015 |
$9,234 |
$9,164 |
10/31/2015 |
$9,959 |
$9,937 |
11/30/2015 |
$9,952 |
$9,967 |
12/31/2015 |
$9,821 |
$9,810 |
1/31/2016 |
$9,325 |
$9,323 |
2/29/2016 |
$9,363 |
$9,310 |
3/31/2016 |
$9,953 |
$9,942 |
4/30/2016 |
$9,922 |
$9,980 |
5/31/2016 |
$10,047 |
$10,160 |
6/30/2016 |
$10,062 |
$10,186 |
7/31/2016 |
$10,443 |
$10,561 |
8/31/2016 |
$10,427 |
$10,576 |
9/30/2016 |
$10,412 |
$10,578 |
10/31/2016 |
$10,225 |
$10,385 |
11/30/2016 |
$10,668 |
$10,770 |
12/31/2016 |
$10,877 |
$10,983 |
1/31/2017 |
$11,012 |
$11,191 |
2/28/2017 |
$11,433 |
$11,635 |
3/31/2017 |
$11,409 |
$11,649 |
4/30/2017 |
$11,480 |
$11,769 |
5/31/2017 |
$11,623 |
$11,934 |
6/30/2017 |
$11,711 |
$12,009 |
7/31/2017 |
$11,933 |
$12,256 |
8/31/2017 |
$11,996 |
$12,293 |
9/30/2017 |
$12,250 |
$12,547 |
10/31/2017 |
$12,528 |
$12,840 |
11/30/2017 |
$12,917 |
$13,233 |
12/31/2017 |
$13,002 |
$13,380 |
1/31/2018 |
$13,669 |
$14,147 |
2/28/2018 |
$13,133 |
$13,625 |
3/31/2018 |
$12,738 |
$13,279 |
4/30/2018 |
$12,746 |
$13,330 |
5/31/2018 |
$12,969 |
$13,651 |
6/30/2018 |
$12,985 |
$13,735 |
7/31/2018 |
$13,414 |
$14,246 |
8/31/2018 |
$13,801 |
$14,710 |
9/30/2018 |
$13,801 |
$14,794 |
10/31/2018 |
$12,796 |
$13,783 |
11/30/2018 |
$13,018 |
$14,064 |
12/31/2018 |
$11,827 |
$12,794 |
1/31/2019 |
$12,730 |
$13,819 |
2/28/2019 |
$13,089 |
$14,263 |
3/31/2019 |
$13,291 |
$14,540 |
4/30/2019 |
$13,755 |
$15,129 |
5/31/2019 |
$12,765 |
$14,167 |
6/30/2019 |
$13,685 |
$15,166 |
7/31/2019 |
$13,896 |
$15,384 |
8/31/2019 |
$13,571 |
$15,140 |
9/30/2019 |
$13,869 |
$15,423 |
10/31/2019 |
$14,132 |
$15,757 |
11/30/2019 |
$14,667 |
$16,329 |
12/31/2019 |
$15,095 |
$16,822 |
1/31/2020 |
$14,913 |
$16,816 |
2/29/2020 |
$13,670 |
$15,431 |
3/31/2020 |
$12,063 |
$13,525 |
4/30/2020 |
$13,624 |
$15,259 |
5/31/2020 |
$14,214 |
$15,986 |
6/30/2020 |
$14,460 |
$16,304 |
7/31/2020 |
$15,158 |
$17,223 |
8/31/2020 |
$16,266 |
$18,461 |
9/30/2020 |
$15,594 |
$17,760 |
10/31/2020 |
$15,177 |
$17,287 |
11/30/2020 |
$16,792 |
$19,180 |
12/31/2020 |
$17,391 |
$19,917 |
1/31/2021 |
$17,292 |
$19,716 |
2/28/2021 |
$17,787 |
$20,260 |
3/31/2021 |
$18,716 |
$21,147 |
4/30/2021 |
$19,665 |
$22,276 |
5/31/2021 |
$19,754 |
$22,431 |
6/30/2021 |
$20,179 |
$22,955 |
7/31/2021 |
$20,585 |
$23,500 |
8/31/2021 |
$21,247 |
$24,215 |
9/30/2021 |
$20,199 |
$23,089 |
10/31/2021 |
$21,642 |
$24,706 |
11/30/2021 |
$21,524 |
$24,535 |
12/31/2021 |
$22,509 |
$25,635 |
1/31/2022 |
$21,437 |
$24,308 |
2/28/2022 |
$20,868 |
$23,580 |
3/31/2022 |
$21,598 |
$24,456 |
4/30/2022 |
$19,828 |
$22,323 |
5/31/2022 |
$19,882 |
$22,364 |
6/30/2022 |
$18,123 |
$20,518 |
7/31/2022 |
$19,699 |
$22,410 |
8/31/2022 |
$18,874 |
$21,496 |
9/30/2022 |
$17,158 |
$19,516 |
10/31/2022 |
$18,531 |
$21,096 |
11/30/2022 |
$19,485 |
$22,275 |
12/31/2022 |
$18,300 |
$20,992 |
1/31/2023 |
$19,480 |
$22,311 |
2/28/2023 |
$19,075 |
$21,767 |
3/31/2023 |
$19,640 |
$22,566 |
4/30/2023 |
$19,800 |
$22,918 |
5/31/2023 |
$19,985 |
$23,018 |
6/30/2023 |
$21,424 |
$24,538 |
7/31/2023 |
$22,088 |
$25,327 |
8/31/2023 |
$21,680 |
$24,923 |
9/30/2023 |
$20,755 |
$23,735 |
10/31/2023 |
$20,281 |
$23,236 |
11/30/2023 |
$21,955 |
$25,358 |
12/31/2023 |
$22,932 |
$26,510 |
1/31/2024 |
$23,451 |
$26,956 |
2/29/2024 |
$24,862 |
$28,395 |
3/31/2024 |
$25,779 |
$29,309 |
4/30/2024 |
$24,717 |
$28,111 |
5/31/2024 |
$26,080 |
$29,505 |
6/30/2024 |
$27,033 |
$30,564 |
7/31/2024 |
$27,287 |
$30,936 |
8/31/2024 |
$27,926 |
$31,687 |
9/30/2024 |
$28,481 |
$32,363 |
10/31/2024 |
$28,396 |
$32,070 |
11/30/2024 |
$30,206 |
$33,952 |
12/31/2024 |
$29,636 |
$33,143 |
1/31/2025 |
$30,587 |
$34,066 |
2/28/2025 |
$29,945 |
$33,621 |
3/31/2025 |
$28,108 |
$31,727 |
4/30/2025 |
$28,237 |
$31,512 |
5/31/2025 |
$30,060 |
$33,495 |
6/30/2025 |
$31,524 |
$35,199 |
7/31/2025 |
$32,230 |
$35,989 |
|
| Average Annual Return [Table Text Block] |
|
AVERAGE ANNUAL TOTAL RETURNS (%)
AATR |
1 Year |
5 Years |
10 Years |
Class C |
17.21 |
15.94 |
12.42 |
Class C with Load |
16.21 |
15.94 |
12.42 |
S&P 500 Index |
16.33 |
15.88 |
13.66 | |
| AssetsNet |
|
$ 1,304,567,477
|
| Holdings Count | Holding |
|
168
|
| Advisory Fees Paid, Amount |
|
$ 4,076,256
|
| InvestmentCompanyPortfolioTurnover |
|
31.00%
|
| Holdings [Text Block] |
|
SECTOR ALLOCATION (% OF LONG-TERM INVESTMENTS)
Information technology |
34.1 |
Financials |
14.0 |
Communication services |
10.2 |
Consumer discretionary |
9.9 |
Health care |
9.1 |
Industrials |
8.3 |
Consumer staples |
4.8 |
Energy |
2.5 |
Utilities |
2.5 |
Real estate |
2.3 |
Materials |
2.3 | |
| Largest Holdings [Text Block] |
|
TOP TEN HOLDINGS (% OF NET ASSETS)
NVIDIA Corp. |
8.0 |
Microsoft Corp. |
7.4 |
Apple, Inc. |
5.6 |
Amazon.com, Inc. |
4.2 |
Meta Platforms, Inc. Class A |
3.5 |
Broadcom, Inc. |
3.1 |
Alphabet, Inc. Class C |
2.1 |
Alphabet, Inc. Class A |
1.8 |
JPMorgan Chase & Co. |
1.6 |
Tesla, Inc. |
1.5 | |
| Material Fund Change [Text Block] |
|
|
| C000089477 |
|
|
| Shareholder Report [Line Items] |
|
|
| Fund Name |
|
Disciplined U.S. Core Fund
|
| Class Name |
|
Class A
|
| Trading Symbol |
|
EVSAX
|
| Annual or Semi-Annual Statement [Text Block] |
|
This annual shareholder report contains important information about Disciplined U.S. Core Fund for the period from August 1, 2024 to July 31, 2025.
|
| Shareholder Report Annual or Semi-Annual |
|
Annual Shareholder Report
|
| Additional Information [Text Block] |
|
You can find additional information about the Fund at allspringglobal.com. You can also request this information by contacting us at 1-800-222-8222.
|
| Additional Information Phone Number |
|
<span style="white-space: nowrap; box-sizing: border-box; color: rgb(0, 0, 0); display: inline; flex-wrap: nowrap; font-size: 12px; font-weight: 400; grid-area: auto; line-height: 18px; margin: 0px; overflow: visible; text-align: left; text-align-last: auto;"> 1-800-222-8222.</span>
|
| Additional Information Website |
|
<span style="box-sizing: border-box; color: rgb(0, 0, 0); display: inline; flex-wrap: nowrap; font-size: 12px; font-weight: 400; grid-area: auto; line-height: 18px; margin: 0px; overflow: visible; text-align: left; text-align-last: auto; white-space-collapse: preserve-breaks;">allspringglobal.com</span>
|
| Expenses [Text Block] |
|
What were the Fund costs for the past year?The table explains the costs you would have paid within the reporting period based on a hypothetical $10,000 investment.
CLASS NAME |
COSTS OF A $10,000 INVESTMENT |
COSTS PAID AS A % OF A $10,000 INVESTMENT |
Class A |
$91 |
0.83% | The manager has contractually committed to waive fees and/or reimburse certain expenses to the extent necessary to cap the Fund's total annual fund operating expense ratio at a specific amount. Without this cap, the costs shown above may have been higher. Please see the prospectus for the amount and the expiration date of the cap. Prior to or after the commitment expiration date, the cap may be increased or the commitment to maintain the cap may be terminated only with the approval of the Board of Trustees. |
| Expenses Paid, Amount |
|
$ 91
|
| Expense Ratio, Percent |
|
0.83%
|
| Factors Affecting Performance [Text Block] |
|
How did the Fund perform last year and what affected its performance?Over the 12-month period, the U.S. equity market performed positively. Domestic large-cap stocks outperformed domestic small-cap stocks. · Changes to the Fund’s portfolio were minimal. Characteristics that are typically favored in the portfolio include attractive valuation, earnings consistency, profitability, and improving market sentiment. · Stock selection was the main contributor to outperformance, adding value in 7 of 11 sectors. This was primarily due to positive stock selection within the health care, financials, and communication services sectors. The largest individual contributors to relative performance were UnitedHealth Group, Inc.; Interactive Brokers Group, Inc.; and EMCOR Group, Inc. A modest underweight to energy contributed modestly to performance. However, variations in sector weights versus the index were relatively small, which is typical for the strategy. · Negative stock selection within real estate, utilities, and energy detracted from relative performance. The three largest individual detractors from relative performance were the Fund’s underweights to Palantir Technologies, Inc., GE Vernova, Inc., and Oracle Corp. |
| Line Graph [Table Text Block] |
|
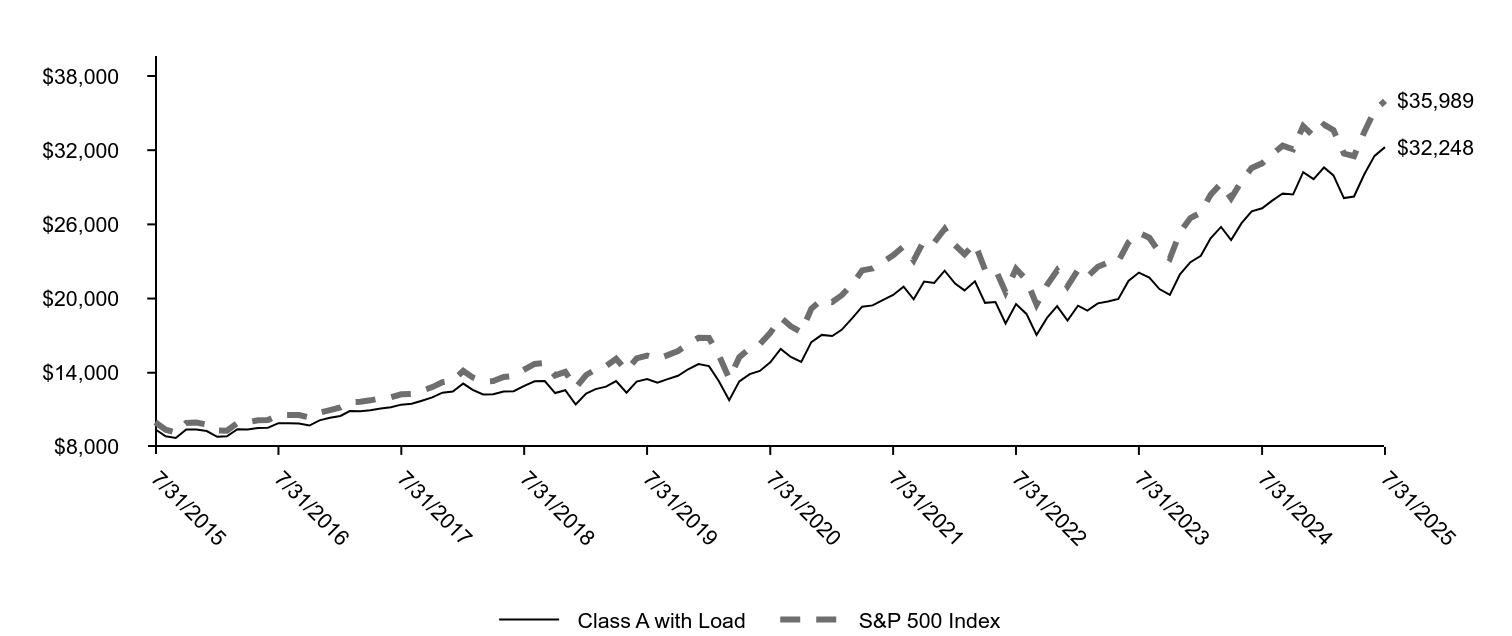
|
Class A with Load |
S&P 500 Index |
7/31/2015 |
$9,426 |
$10,000 |
8/31/2015 |
$8,859 |
$9,397 |
9/30/2015 |
$8,719 |
$9,164 |
10/31/2015 |
$9,402 |
$9,937 |
11/30/2015 |
$9,402 |
$9,967 |
12/31/2015 |
$9,283 |
$9,810 |
1/31/2016 |
$8,817 |
$9,323 |
2/29/2016 |
$8,858 |
$9,310 |
3/31/2016 |
$9,426 |
$9,942 |
4/30/2016 |
$9,406 |
$9,980 |
5/31/2016 |
$9,529 |
$10,160 |
6/30/2016 |
$9,549 |
$10,186 |
7/31/2016 |
$9,919 |
$10,561 |
8/31/2016 |
$9,912 |
$10,576 |
9/30/2016 |
$9,898 |
$10,578 |
10/31/2016 |
$9,727 |
$10,385 |
11/30/2016 |
$10,151 |
$10,770 |
12/31/2016 |
$10,361 |
$10,983 |
1/31/2017 |
$10,501 |
$11,191 |
2/28/2017 |
$10,900 |
$11,635 |
3/31/2017 |
$10,886 |
$11,649 |
4/30/2017 |
$10,963 |
$11,769 |
5/31/2017 |
$11,103 |
$11,934 |
6/30/2017 |
$11,202 |
$12,009 |
7/31/2017 |
$11,419 |
$12,256 |
8/31/2017 |
$11,489 |
$12,293 |
9/30/2017 |
$11,734 |
$12,547 |
10/31/2017 |
$12,007 |
$12,840 |
11/30/2017 |
$12,385 |
$13,233 |
12/31/2017 |
$12,482 |
$13,380 |
1/31/2018 |
$13,125 |
$14,147 |
2/28/2018 |
$12,620 |
$13,625 |
3/31/2018 |
$12,248 |
$13,279 |
4/30/2018 |
$12,262 |
$13,330 |
5/31/2018 |
$12,489 |
$13,651 |
6/30/2018 |
$12,503 |
$13,735 |
7/31/2018 |
$12,935 |
$14,246 |
8/31/2018 |
$13,307 |
$14,710 |
9/30/2018 |
$13,322 |
$14,794 |
10/31/2018 |
$12,357 |
$13,783 |
11/30/2018 |
$12,584 |
$14,064 |
12/31/2018 |
$11,432 |
$12,794 |
1/31/2019 |
$12,322 |
$13,819 |
2/28/2019 |
$12,673 |
$14,263 |
3/31/2019 |
$12,876 |
$14,540 |
4/30/2019 |
$13,329 |
$15,129 |
5/31/2019 |
$12,384 |
$14,167 |
6/30/2019 |
$13,282 |
$15,166 |
7/31/2019 |
$13,492 |
$15,384 |
8/31/2019 |
$13,188 |
$15,140 |
9/30/2019 |
$13,485 |
$15,423 |
10/31/2019 |
$13,758 |
$15,757 |
11/30/2019 |
$14,281 |
$16,329 |
12/31/2019 |
$14,707 |
$16,822 |
1/31/2020 |
$14,536 |
$16,816 |
2/29/2020 |
$13,331 |
$15,431 |
3/31/2020 |
$11,775 |
$13,525 |
4/30/2020 |
$13,306 |
$15,259 |
5/31/2020 |
$13,892 |
$15,986 |
6/30/2020 |
$14,145 |
$16,304 |
7/31/2020 |
$14,837 |
$17,223 |
8/31/2020 |
$15,920 |
$18,461 |
9/30/2020 |
$15,277 |
$17,760 |
10/31/2020 |
$14,878 |
$17,287 |
11/30/2020 |
$16,474 |
$19,180 |
12/31/2020 |
$17,061 |
$19,917 |
1/31/2021 |
$16,972 |
$19,716 |
2/28/2021 |
$17,471 |
$20,260 |
3/31/2021 |
$18,398 |
$21,147 |
4/30/2021 |
$19,342 |
$22,276 |
5/31/2021 |
$19,449 |
$22,431 |
6/30/2021 |
$19,877 |
$22,955 |
7/31/2021 |
$20,287 |
$23,500 |
8/31/2021 |
$20,955 |
$24,215 |
9/30/2021 |
$19,939 |
$23,089 |
10/31/2021 |
$21,374 |
$24,706 |
11/30/2021 |
$21,267 |
$24,535 |
12/31/2021 |
$22,252 |
$25,635 |
1/31/2022 |
$21,209 |
$24,308 |
2/28/2022 |
$20,658 |
$23,580 |
3/31/2022 |
$21,392 |
$24,456 |
4/30/2022 |
$19,654 |
$22,323 |
5/31/2022 |
$19,721 |
$22,364 |
6/30/2022 |
$17,983 |
$20,518 |
7/31/2022 |
$19,557 |
$22,410 |
8/31/2022 |
$18,756 |
$21,496 |
9/30/2022 |
$17,056 |
$19,516 |
10/31/2022 |
$18,437 |
$21,096 |
11/30/2022 |
$19,393 |
$22,275 |
12/31/2022 |
$18,220 |
$20,992 |
1/31/2023 |
$19,421 |
$22,311 |
2/28/2023 |
$19,024 |
$21,767 |
3/31/2023 |
$19,609 |
$22,566 |
4/30/2023 |
$19,763 |
$22,918 |
5/31/2023 |
$19,972 |
$23,018 |
6/30/2023 |
$21,427 |
$24,538 |
7/31/2023 |
$22,100 |
$25,327 |
8/31/2023 |
$21,692 |
$24,923 |
9/30/2023 |
$20,766 |
$23,735 |
10/31/2023 |
$20,292 |
$23,236 |
11/30/2023 |
$21,967 |
$25,358 |
12/31/2023 |
$22,944 |
$26,510 |
1/31/2024 |
$23,463 |
$26,956 |
2/29/2024 |
$24,875 |
$28,395 |
3/31/2024 |
$25,793 |
$29,309 |
4/30/2024 |
$24,731 |
$28,111 |
5/31/2024 |
$26,094 |
$29,505 |
6/30/2024 |
$27,048 |
$30,564 |
7/31/2024 |
$27,301 |
$30,936 |
8/31/2024 |
$27,941 |
$31,687 |
9/30/2024 |
$28,496 |
$32,363 |
10/31/2024 |
$28,412 |
$32,070 |
11/30/2024 |
$30,222 |
$33,952 |
12/31/2024 |
$29,653 |
$33,143 |
1/31/2025 |
$30,603 |
$34,066 |
2/28/2025 |
$29,961 |
$33,621 |
3/31/2025 |
$28,124 |
$31,727 |
4/30/2025 |
$28,252 |
$31,512 |
5/31/2025 |
$30,077 |
$33,495 |
6/30/2025 |
$31,541 |
$35,199 |
7/31/2025 |
$32,248 |
$35,989 |
|
| Average Annual Return [Table Text Block] |
|
AVERAGE ANNUAL TOTAL RETURNS (%)
AATR |
1 Year |
5 Years |
10 Years |
Class A |
18.12 |
16.80 |
13.09 |
Class A with Load |
11.33 |
15.42 |
12.42 |
S&P 500 Index |
16.33 |
15.88 |
13.66 | |
| AssetsNet |
|
$ 1,304,567,477
|
| Holdings Count | Holding |
|
168
|
| Advisory Fees Paid, Amount |
|
$ 4,076,256
|
| InvestmentCompanyPortfolioTurnover |
|
31.00%
|
| Holdings [Text Block] |
|
SECTOR ALLOCATION (% OF LONG-TERM INVESTMENTS)
Information technology |
34.1 |
Financials |
14.0 |
Communication services |
10.2 |
Consumer discretionary |
9.9 |
Health care |
9.1 |
Industrials |
8.3 |
Consumer staples |
4.8 |
Energy |
2.5 |
Utilities |
2.5 |
Real estate |
2.3 |
Materials |
2.3 | |
| Largest Holdings [Text Block] |
|
TOP TEN HOLDINGS (% OF NET ASSETS)
NVIDIA Corp. |
8.0 |
Microsoft Corp. |
7.4 |
Apple, Inc. |
5.6 |
Amazon.com, Inc. |
4.2 |
Meta Platforms, Inc. Class A |
3.5 |
Broadcom, Inc. |
3.1 |
Alphabet, Inc. Class C |
2.1 |
Alphabet, Inc. Class A |
1.8 |
JPMorgan Chase & Co. |
1.6 |
Tesla, Inc. |
1.5 | |
| Material Fund Change [Text Block] |
|
|
| C000089479 |
|
|
| Shareholder Report [Line Items] |
|
|
| Fund Name |
|
Disciplined U.S. Core Fund
|
| Class Name |
|
Administrator Class
|
| Trading Symbol |
|
EVSYX
|
| Annual or Semi-Annual Statement [Text Block] |
|
This annual shareholder report contains important information about Disciplined U.S. Core Fund for the period from August 1, 2024 to July 31, 2025.
|
| Shareholder Report Annual or Semi-Annual |
|
Annual Shareholder Report
|
| Additional Information [Text Block] |
|
You can find additional information about the Fund at allspringglobal.com. You can also request this information by contacting us at 1-800-222-8222.
|
| Material Fund Change Notice [Text Block] |
|
This report describes changes to the Fund that occurred either during or after the reporting period.
|
| Additional Information Phone Number |
|
<span style="white-space: nowrap; box-sizing: border-box; color: rgb(0, 0, 0); display: inline; flex-wrap: nowrap; font-size: 12px; font-weight: 400; grid-area: auto; line-height: 18px; margin: 0px; overflow: visible; text-align: left; text-align-last: auto;"> 1-800-222-8222.</span>
|
| Additional Information Website |
|
<span style="box-sizing: border-box; color: rgb(0, 0, 0); display: inline; flex-wrap: nowrap; font-size: 12px; font-weight: 400; grid-area: auto; line-height: 18px; margin: 0px; overflow: visible; text-align: left; text-align-last: auto; white-space-collapse: preserve-breaks;">allspringglobal.com</span>
|
| Expenses [Text Block] |
|
What were the Fund costs for the past year?The table explains the costs you would have paid within the reporting period based on a hypothetical $10,000 investment.
CLASS NAME |
COSTS OF A $10,000 INVESTMENT |
COSTS PAID AS A % OF A $10,000 INVESTMENT |
Administrator Class |
$80 |
0.73% | The manager has contractually committed to waive fees and/or reimburse certain expenses to the extent necessary to cap the Fund's total annual fund operating expense ratio at a specific amount. Without this cap, the costs shown above may have been higher. Please see the prospectus for the amount and the expiration date of the cap. Prior to or after the commitment expiration date, the cap may be increased or the commitment to maintain the cap may be terminated only with the approval of the Board of Trustees. |
| Expenses Paid, Amount |
|
$ 80
|
| Expense Ratio, Percent |
|
0.73%
|
| Factors Affecting Performance [Text Block] |
|
How did the Fund perform last year and what affected its performance?Over the 12-month period, the U.S. equity market performed positively. Domestic large-cap stocks outperformed domestic small-cap stocks. · Changes to the Fund’s portfolio were minimal. Characteristics that are typically favored in the portfolio include attractive valuation, earnings consistency, profitability, and improving market sentiment. · Stock selection was the main contributor to outperformance, adding value in 7 of 11 sectors. This was primarily due to positive stock selection within the health care, financials, and communication services sectors. The largest individual contributors to relative performance were UnitedHealth Group, Inc.; Interactive Brokers Group, Inc.; and EMCOR Group, Inc. A modest underweight to energy contributed modestly to performance. However, variations in sector weights versus the index were relatively small, which is typical for the strategy. · Negative stock selection within real estate, utilities, and energy detracted from relative performance. The three largest individual detractors from relative performance were the Fund’s underweights to Palantir Technologies, Inc., GE Vernova, Inc., and Oracle Corp. |
| Line Graph [Table Text Block] |
|
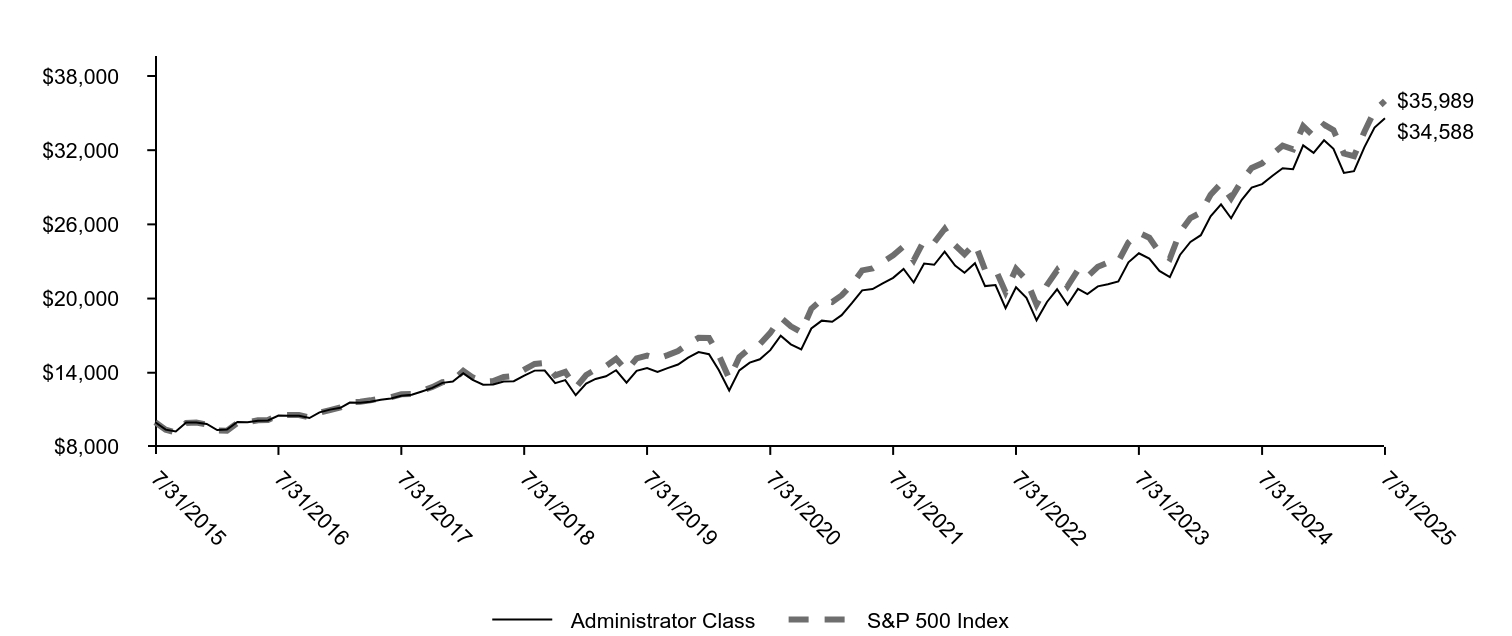
|
Administrator Class |
S&P 500 Index |
7/31/2015 |
$10,000 |
$10,000 |
8/31/2015 |
$9,399 |
$9,397 |
9/30/2015 |
$9,253 |
$9,164 |
10/31/2015 |
$9,981 |
$9,937 |
11/30/2015 |
$9,981 |
$9,967 |
12/31/2015 |
$9,855 |
$9,810 |
1/31/2016 |
$9,366 |
$9,323 |
2/29/2016 |
$9,408 |
$9,310 |
3/31/2016 |
$10,011 |
$9,942 |
4/30/2016 |
$9,990 |
$9,980 |
5/31/2016 |
$10,118 |
$10,160 |
6/30/2016 |
$10,139 |
$10,186 |
7/31/2016 |
$10,536 |
$10,561 |
8/31/2016 |
$10,529 |
$10,576 |
9/30/2016 |
$10,522 |
$10,578 |
10/31/2016 |
$10,338 |
$10,385 |
11/30/2016 |
$10,792 |
$10,770 |
12/31/2016 |
$11,016 |
$10,983 |
1/31/2017 |
$11,161 |
$11,191 |
2/28/2017 |
$11,590 |
$11,635 |
3/31/2017 |
$11,576 |
$11,649 |
4/30/2017 |
$11,663 |
$11,769 |
5/31/2017 |
$11,808 |
$11,934 |
6/30/2017 |
$11,910 |
$12,009 |
7/31/2017 |
$12,142 |
$12,256 |
8/31/2017 |
$12,222 |
$12,293 |
9/30/2017 |
$12,484 |
$12,547 |
10/31/2017 |
$12,775 |
$12,840 |
11/30/2017 |
$13,182 |
$13,233 |
12/31/2017 |
$13,285 |
$13,380 |
1/31/2018 |
$13,967 |
$14,147 |
2/28/2018 |
$13,429 |
$13,625 |
3/31/2018 |
$13,034 |
$13,279 |
4/30/2018 |
$13,057 |
$13,330 |
5/31/2018 |
$13,292 |
$13,651 |
6/30/2018 |
$13,315 |
$13,735 |
7/31/2018 |
$13,770 |
$14,246 |
8/31/2018 |
$14,171 |
$14,710 |
9/30/2018 |
$14,179 |
$14,794 |
10/31/2018 |
$13,156 |
$13,783 |
11/30/2018 |
$13,406 |
$14,064 |
12/31/2018 |
$12,182 |
$12,794 |
1/31/2019 |
$13,127 |
$13,819 |
2/28/2019 |
$13,499 |
$14,263 |
3/31/2019 |
$13,717 |
$14,540 |
4/30/2019 |
$14,202 |
$15,129 |
5/31/2019 |
$13,200 |
$14,167 |
6/30/2019 |
$14,153 |
$15,166 |
7/31/2019 |
$14,379 |
$15,384 |
8/31/2019 |
$14,056 |
$15,140 |
9/30/2019 |
$14,371 |
$15,423 |
10/31/2019 |
$14,662 |
$15,757 |
11/30/2019 |
$15,228 |
$16,329 |
12/31/2019 |
$15,677 |
$16,822 |
1/31/2020 |
$15,500 |
$16,816 |
2/29/2020 |
$14,219 |
$15,431 |
3/31/2020 |
$12,558 |
$13,525 |
4/30/2020 |
$14,193 |
$15,259 |
5/31/2020 |
$14,817 |
$15,986 |
6/30/2020 |
$15,087 |
$16,304 |
7/31/2020 |
$15,828 |
$17,223 |
8/31/2020 |
$16,991 |
$18,461 |
9/30/2020 |
$16,300 |
$17,760 |
10/31/2020 |
$15,879 |
$17,287 |
11/30/2020 |
$17,581 |
$19,180 |
12/31/2020 |
$18,214 |
$19,917 |
1/31/2021 |
$18,121 |
$19,716 |
2/28/2021 |
$18,655 |
$20,260 |
3/31/2021 |
$19,649 |
$21,147 |
4/30/2021 |
$20,662 |
$22,276 |
5/31/2021 |
$20,772 |
$22,431 |
6/30/2021 |
$21,232 |
$22,955 |
7/31/2021 |
$21,674 |
$23,500 |
8/31/2021 |
$22,392 |
$24,215 |
9/30/2021 |
$21,297 |
$23,089 |
10/31/2021 |
$22,834 |
$24,706 |
11/30/2021 |
$22,732 |
$24,535 |
12/31/2021 |
$23,786 |
$25,635 |
1/31/2022 |
$22,671 |
$24,308 |
2/28/2022 |
$22,083 |
$23,580 |
3/31/2022 |
$22,860 |
$24,456 |
4/30/2022 |
$21,007 |
$22,323 |
5/31/2022 |
$21,087 |
$22,364 |
6/30/2022 |
$19,224 |
$20,518 |
7/31/2022 |
$20,918 |
$22,410 |
8/31/2022 |
$20,061 |
$21,496 |
9/30/2022 |
$18,238 |
$19,516 |
10/31/2022 |
$19,722 |
$21,096 |
11/30/2022 |
$20,748 |
$22,275 |
12/31/2022 |
$19,501 |
$20,992 |
1/31/2023 |
$20,781 |
$22,311 |
2/28/2023 |
$20,362 |
$21,767 |
3/31/2023 |
$20,985 |
$22,566 |
4/30/2023 |
$21,155 |
$22,918 |
5/31/2023 |
$21,382 |
$23,018 |
6/30/2023 |
$22,934 |
$24,538 |
7/31/2023 |
$23,659 |
$25,327 |
8/31/2023 |
$23,229 |
$24,923 |
9/30/2023 |
$22,232 |
$23,735 |
10/31/2023 |
$21,733 |
$23,236 |
11/30/2023 |
$23,523 |
$25,358 |
12/31/2023 |
$24,579 |
$26,510 |
1/31/2024 |
$25,123 |
$26,956 |
2/29/2024 |
$26,646 |
$28,395 |
3/31/2024 |
$27,623 |
$29,309 |
4/30/2024 |
$26,497 |
$28,111 |
5/31/2024 |
$27,970 |
$29,505 |
6/30/2024 |
$28,972 |
$30,564 |
7/31/2024 |
$29,257 |
$30,936 |
8/31/2024 |
$29,938 |
$31,687 |
9/30/2024 |
$30,544 |
$32,363 |
10/31/2024 |
$30,457 |
$32,070 |
11/30/2024 |
$32,388 |
$33,952 |
12/31/2024 |
$31,787 |
$33,143 |
1/31/2025 |
$32,800 |
$34,066 |
2/28/2025 |
$32,116 |
$33,621 |
3/31/2025 |
$30,157 |
$31,727 |
4/30/2025 |
$30,302 |
$31,512 |
5/31/2025 |
$32,248 |
$33,495 |
6/30/2025 |
$33,825 |
$35,199 |
7/31/2025 |
$34,588 |
$35,989 |
|
| Average Annual Return [Table Text Block] |
|
AVERAGE ANNUAL TOTAL RETURNS (%)
AATR |
1 Year |
5 Years |
10 Years |
Administrator Class |
18.22 |
16.92 |
13.21 |
S&P 500 Index |
16.33 |
15.88 |
13.66 | |
| Material Change Date |
Aug. 01, 2024
|
|
| AssetsNet |
|
$ 1,304,567,477
|
| Holdings Count | Holding |
|
168
|
| Advisory Fees Paid, Amount |
|
$ 4,076,256
|
| InvestmentCompanyPortfolioTurnover |
|
31.00%
|
| Holdings [Text Block] |
|
SECTOR ALLOCATION (% OF LONG-TERM INVESTMENTS)
Information technology |
34.1 |
Financials |
14.0 |
Communication services |
10.2 |
Consumer discretionary |
9.9 |
Health care |
9.1 |
Industrials |
8.3 |
Consumer staples |
4.8 |
Energy |
2.5 |
Utilities |
2.5 |
Real estate |
2.3 |
Materials |
2.3 | |
| Largest Holdings [Text Block] |
|
TOP TEN HOLDINGS (% OF NET ASSETS)
NVIDIA Corp. |
8.0 |
Microsoft Corp. |
7.4 |
Apple, Inc. |
5.6 |
Amazon.com, Inc. |
4.2 |
Meta Platforms, Inc. Class A |
3.5 |
Broadcom, Inc. |
3.1 |
Alphabet, Inc. Class C |
2.1 |
Alphabet, Inc. Class A |
1.8 |
JPMorgan Chase & Co. |
1.6 |
Tesla, Inc. |
1.5 | |
| Material Fund Change [Text Block] |
|
This is a summary of certain changes and planned changes to the Fund since August 1, 2024. At a meeting held on May 27-29, 2025, the Board of Trustees of the Fund approved the conversion of the Fund’s Administrator Class shares into Institutional Class shares effective on or about the close of business on September 12, 2025. |
| Summary of Change Legend [Text Block] |
|
This is a summary of certain changes and planned changes to the Fund since August 1, 2024.
|
| C000019944 |
|
|
| Shareholder Report [Line Items] |
|
|
| Fund Name |
|
Growth Fund
|
| Class Name |
|
Institutional Class
|
| Trading Symbol |
|
SGRNX
|
| Annual or Semi-Annual Statement [Text Block] |
|
This annual shareholder report contains important information about Growth Fund for the period from August 1, 2024 to July 31, 2025.
|
| Shareholder Report Annual or Semi-Annual |
|
Annual Shareholder Report
|
| Additional Information [Text Block] |
|
You can find additional information about the Fund at allspringglobal.com. You can also request this information by contacting us at 1-800-222-8222.
|
| Additional Information Phone Number |
|
<span style="white-space: nowrap; box-sizing: border-box; color: rgb(0, 0, 0); display: inline; flex-wrap: nowrap; font-size: 12px; font-weight: 400; grid-area: auto; line-height: 18px; margin: 0px; overflow: visible; text-align: left; text-align-last: auto;"> 1-800-222-8222.</span>
|
| Additional Information Website |
|
<span style="box-sizing: border-box; color: rgb(0, 0, 0); display: inline; flex-wrap: nowrap; font-size: 12px; font-weight: 400; grid-area: auto; line-height: 18px; margin: 0px; overflow: visible; text-align: left; text-align-last: auto; white-space-collapse: preserve-breaks;">allspringglobal.com</span>
|
| Expenses [Text Block] |
|
What were the Fund costs for the past year?The table explains the costs you would have paid within the reporting period based on a hypothetical $10,000 investment.
CLASS NAME |
COSTS OF A $10,000 INVESTMENT |
COSTS PAID AS A % OF A $10,000 INVESTMENT |
Institutional Class |
$85 |
0.75% | The manager has contractually committed to waive fees and/or reimburse certain expenses to the extent necessary to cap the Fund's total annual fund operating expense ratio at a specific amount. Without this cap, the costs shown above may have been higher. Please see the prospectus for the amount and the expiration date of the cap. Prior to or after the commitment expiration date, the cap may be increased or the commitment to maintain the cap may be terminated only with the approval of the Board of Trustees. |
| Expenses Paid, Amount |
|
$ 85
|
| Expense Ratio, Percent |
|
0.75%
|
| Factors Affecting Performance [Text Block] |
|
How did the Fund perform last year and what affected its performance?The market environment for the 12-month period that ended July 31, 2025, was bifurcated for U.S. equities. During the first half of the period, the economy was generally healthy, with moderating inflation, resilient consumer spending, and favorable earnings growth. In early 2025, the new U.S. administration took office and implemented policies on government spending, immigration, and tariffs. Financial market sentiment grew concerned and volatility spiked until the administration temporarily paused tariffs. With uncertainty easing, overall corporate earnings generally exceeded expectations and propelled growth indexes upward. Artificial intelligence (AI) was a key driver as leading technology firms ramped up capital expenditures on AI infrastructure. The portfolio benefited from security selection within communication services and financials, where holdings with innovative products and strong demand, such as Robinhood Markets, Inc. and Roblox Corp., contributed. In contrast, relative underweights to select mega-cap technology companies, including NVIDIA Corp. and Broadcom, Inc. detracted from returns. |
| Line Graph [Table Text Block] |
|
|
Institutional Class |
Russell 3000® Growth Index |
Russell 3000® Index |
7/31/2015 |
$10,000 |
$10,000 |
$10,000 |
8/31/2015 |
$9,223 |
$9,381 |
$9,396 |
9/30/2015 |
$8,905 |
$9,120 |
$9,122 |
10/31/2015 |
$9,473 |
$9,885 |
$9,843 |
11/30/2015 |
$9,634 |
$9,937 |
$9,898 |
12/31/2015 |
$9,483 |
$9,766 |
$9,694 |
1/31/2016 |
$8,570 |
$9,183 |
$9,147 |
2/29/2016 |
$8,502 |
$9,175 |
$9,144 |
3/31/2016 |
$8,958 |
$9,799 |
$9,788 |
4/30/2016 |
$9,160 |
$9,723 |
$9,849 |
5/31/2016 |
$9,415 |
$9,917 |
$10,025 |
6/30/2016 |
$9,263 |
$9,878 |
$10,046 |
7/31/2016 |
$9,869 |
$10,357 |
$10,444 |
8/31/2016 |
$9,863 |
$10,318 |
$10,471 |
9/30/2016 |
$9,830 |
$10,364 |
$10,488 |
10/31/2016 |
$9,457 |
$10,090 |
$10,261 |
11/30/2016 |
$9,591 |
$10,359 |
$10,720 |
12/31/2016 |
$9,431 |
$10,488 |
$10,929 |
1/31/2017 |
$10,004 |
$10,828 |
$11,135 |
2/28/2017 |
$10,410 |
$11,263 |
$11,549 |
3/31/2017 |
$10,544 |
$11,394 |
$11,557 |
4/30/2017 |
$10,895 |
$11,651 |
$11,679 |
5/31/2017 |
$11,225 |
$11,924 |
$11,799 |
6/30/2017 |
$11,152 |
$11,924 |
$11,905 |
7/31/2017 |
$11,491 |
$12,224 |
$12,130 |
8/31/2017 |
$11,669 |
$12,430 |
$12,153 |
9/30/2017 |
$11,928 |
$12,631 |
$12,449 |
10/31/2017 |
$12,402 |
$13,097 |
$12,721 |
11/30/2017 |
$12,641 |
$13,493 |
$13,107 |
12/31/2017 |
$12,744 |
$13,592 |
$13,238 |
1/31/2018 |
$13,847 |
$14,521 |
$13,936 |
2/28/2018 |
$13,738 |
$14,138 |
$13,423 |
3/31/2018 |
$13,595 |
$13,793 |
$13,153 |
4/30/2018 |
$13,589 |
$13,839 |
$13,203 |
5/31/2018 |
$14,347 |
$14,466 |
$13,576 |
6/30/2018 |
$14,419 |
$14,603 |
$13,665 |
7/31/2018 |
$14,732 |
$15,018 |
$14,118 |
8/31/2018 |
$15,580 |
$15,848 |
$14,614 |
9/30/2018 |
$15,534 |
$15,901 |
$14,638 |
10/31/2018 |
$13,891 |
$14,433 |
$13,560 |
11/30/2018 |
$14,102 |
$14,592 |
$13,832 |
12/31/2018 |
$12,815 |
$13,304 |
$12,544 |
1/31/2019 |
$14,263 |
$14,524 |
$13,621 |
2/28/2019 |
$15,101 |
$15,075 |
$14,100 |
3/31/2019 |
$15,354 |
$15,456 |
$14,306 |
4/30/2019 |
$16,383 |
$16,138 |
$14,877 |
5/31/2019 |
$15,560 |
$15,106 |
$13,915 |
6/30/2019 |
$16,486 |
$16,152 |
$14,892 |
7/31/2019 |
$16,795 |
$16,503 |
$15,113 |
8/31/2019 |
$16,545 |
$16,337 |
$14,805 |
9/30/2019 |
$16,247 |
$16,330 |
$15,065 |
10/31/2019 |
$16,508 |
$16,791 |
$15,389 |
11/30/2019 |
$17,453 |
$17,551 |
$15,974 |
12/31/2019 |
$17,640 |
$18,073 |
$16,436 |
1/31/2020 |
$18,328 |
$18,437 |
$16,418 |
2/29/2020 |
$17,017 |
$17,177 |
$15,074 |
3/31/2020 |
$14,784 |
$15,388 |
$13,001 |
4/30/2020 |
$17,507 |
$17,666 |
$14,722 |
5/31/2020 |
$19,186 |
$18,880 |
$15,510 |
6/30/2020 |
$19,914 |
$19,696 |
$15,864 |
7/31/2020 |
$21,427 |
$21,163 |
$16,765 |
8/31/2020 |
$23,029 |
$23,295 |
$17,980 |
9/30/2020 |
$22,289 |
$22,229 |
$17,325 |
10/31/2020 |
$22,143 |
$21,526 |
$16,951 |
11/30/2020 |
$24,911 |
$23,823 |
$19,013 |
12/31/2020 |
$26,371 |
$24,987 |
$19,869 |
1/31/2021 |
$26,031 |
$24,893 |
$19,780 |
2/28/2021 |
$26,966 |
$24,944 |
$20,399 |
3/31/2021 |
$25,753 |
$25,285 |
$21,130 |
4/30/2021 |
$27,539 |
$26,926 |
$22,219 |
5/31/2021 |
$26,434 |
$26,527 |
$22,320 |
6/30/2021 |
$28,510 |
$28,163 |
$22,871 |
7/31/2021 |
$29,163 |
$28,958 |
$23,258 |
8/31/2021 |
$30,049 |
$30,005 |
$23,921 |
9/30/2021 |
$28,559 |
$28,358 |
$22,848 |
10/31/2021 |
$30,278 |
$30,742 |
$24,393 |
11/30/2021 |
$28,573 |
$30,825 |
$24,021 |
12/31/2021 |
$28,434 |
$31,446 |
$24,967 |
1/31/2022 |
$24,786 |
$28,659 |
$23,498 |
2/28/2022 |
$24,072 |
$27,516 |
$22,906 |
3/31/2022 |
$24,453 |
$28,537 |
$23,649 |
4/30/2022 |
$20,982 |
$25,088 |
$21,527 |
5/31/2022 |
$20,169 |
$24,511 |
$21,498 |
6/30/2022 |
$18,595 |
$22,594 |
$19,700 |
7/31/2022 |
$20,679 |
$25,295 |
$21,548 |
8/31/2022 |
$19,689 |
$24,172 |
$20,744 |
9/30/2022 |
$17,652 |
$21,832 |
$18,820 |
10/31/2022 |
$18,194 |
$23,157 |
$20,364 |
11/30/2022 |
$19,100 |
$24,170 |
$21,426 |
12/31/2022 |
$17,945 |
$22,338 |
$20,172 |
1/31/2023 |
$19,584 |
$24,222 |
$21,561 |
2/28/2023 |
$19,327 |
$23,936 |
$21,057 |
3/31/2023 |
$20,550 |
$25,432 |
$21,620 |
4/30/2023 |
$20,610 |
$25,651 |
$21,851 |
5/31/2023 |
$21,102 |
$26,754 |
$21,936 |
6/30/2023 |
$22,571 |
$28,604 |
$23,433 |
7/31/2023 |
$23,133 |
$29,587 |
$24,273 |
8/31/2023 |
$22,434 |
$29,255 |
$23,805 |
9/30/2023 |
$21,135 |
$27,647 |
$22,671 |
10/31/2023 |
$20,692 |
$27,168 |
$22,070 |
11/30/2023 |
$23,002 |
$30,107 |
$24,128 |
12/31/2023 |
$24,055 |
$31,543 |
$25,408 |
1/31/2024 |
$24,882 |
$32,241 |
$25,689 |
2/29/2024 |
$27,140 |
$34,460 |
$27,080 |
3/31/2024 |
$27,562 |
$35,084 |
$27,953 |
4/30/2024 |
$26,207 |
$33,538 |
$26,723 |
5/31/2024 |
$27,679 |
$35,536 |
$27,986 |
6/30/2024 |
$29,281 |
$37,819 |
$28,852 |
7/31/2024 |
$28,366 |
$37,340 |
$29,389 |
8/31/2024 |
$29,310 |
$38,060 |
$30,029 |
9/30/2024 |
$30,231 |
$39,112 |
$30,650 |
10/31/2024 |
$30,026 |
$38,964 |
$30,425 |
11/30/2024 |
$32,190 |
$41,594 |
$32,449 |
12/31/2024 |
$31,154 |
$41,781 |
$31,457 |
1/31/2025 |
$32,209 |
$42,629 |
$32,450 |
2/28/2025 |
$30,729 |
$41,037 |
$31,828 |
3/31/2025 |
$27,882 |
$37,582 |
$29,971 |
4/30/2025 |
$28,697 |
$38,185 |
$29,770 |
5/31/2025 |
$31,848 |
$41,561 |
$31,657 |
6/30/2025 |
$34,468 |
$44,243 |
$33,266 |
7/31/2025 |
$35,701 |
$45,874 |
$33,998 |
|
| Average Annual Return [Table Text Block] |
|
AVERAGE ANNUAL TOTAL RETURNS (%)
AATR |
1 Year |
5 Years |
10 Years |
Institutional Class |
25.81 |
10.75 |
13.57 |
Russell 3000® Growth Index |
22.86 |
16.73 |
16.45 |
Russell 3000® Index |
15.68 |
15.19 |
13.02 | |
| AssetsNet |
|
$ 3,582,917,430
|
| Holdings Count | Holding |
|
68
|
| Advisory Fees Paid, Amount |
|
$ 23,734,108
|
| InvestmentCompanyPortfolioTurnover |
|
73.00%
|
| Holdings [Text Block] |
|
SECTOR ALLOCATION (% OF LONG-TERM INVESTMENTS)
Information technology |
40.5 |
Consumer discretionary |
14.7 |
Communication services |
12.5 |
Financials |
12.3 |
Industrials |
9.8 |
Health care |
8.5 |
Materials |
1.7 | |
| Largest Holdings [Text Block] |
|
TOP TEN HOLDINGS (% OF NET ASSETS)
NVIDIA Corp. |
8.9 |
Microsoft Corp. |
8.9 |
Meta Platforms, Inc. Class A |
6.7 |
Amazon.com, Inc. |
4.7 |
Broadcom, Inc. |
4.3 |
Oracle Corp. |
2.2 |
Mastercard, Inc. Class A |
2.1 |
DoorDash, Inc. Class A |
1.9 |
Arista Networks, Inc. |
1.7 |
Booking Holdings, Inc. |
1.7 | |
| Material Fund Change [Text Block] |
|
|
| C000163725 |
|
|
| Shareholder Report [Line Items] |
|
|
| Fund Name |
|
Growth Fund
|
| Class Name |
|
Class R6
|
| Trading Symbol |
|
SGRHX
|
| Annual or Semi-Annual Statement [Text Block] |
|
This annual shareholder report contains important information about Growth Fund for the period from August 1, 2024 to July 31, 2025.
|
| Shareholder Report Annual or Semi-Annual |
|
Annual Shareholder Report
|
| Additional Information [Text Block] |
|
You can find additional information about the Fund at allspringglobal.com. You can also request this information by contacting us at 1-800-222-8222.
|
| Additional Information Phone Number |
|
<span style="white-space: nowrap; box-sizing: border-box; color: rgb(0, 0, 0); display: inline; flex-wrap: nowrap; font-size: 12px; font-weight: 400; grid-area: auto; line-height: 18px; margin: 0px; overflow: visible; text-align: left; text-align-last: auto;"> 1-800-222-8222.</span>
|
| Additional Information Website |
|
<span style="box-sizing: border-box; color: rgb(0, 0, 0); display: inline; flex-wrap: nowrap; font-size: 12px; font-weight: 400; grid-area: auto; line-height: 18px; margin: 0px; overflow: visible; text-align: left; text-align-last: auto; white-space-collapse: preserve-breaks;">allspringglobal.com</span>
|
| Expenses [Text Block] |
|
What were the Fund costs for the past year?The table explains the costs you would have paid within the reporting period based on a hypothetical $10,000 investment.
CLASS NAME |
COSTS OF A $10,000 INVESTMENT |
COSTS PAID AS A % OF A $10,000 INVESTMENT |
Class R6 |
$79 |
0.70% | The manager has contractually committed to waive fees and/or reimburse certain expenses to the extent necessary to cap the Fund's total annual fund operating expense ratio at a specific amount. Without this cap, the costs shown above may have been higher. Please see the prospectus for the amount and the expiration date of the cap. Prior to or after the commitment expiration date, the cap may be increased or the commitment to maintain the cap may be terminated only with the approval of the Board of Trustees. |
| Expenses Paid, Amount |
|
$ 79
|
| Expense Ratio, Percent |
|
0.70%
|
| Factors Affecting Performance [Text Block] |
|
How did the Fund perform last year and what affected its performance?The market environment for the 12-month period that ended July 31, 2025, was bifurcated for U.S. equities. During the first half of the period, the economy was generally healthy, with moderating inflation, resilient consumer spending, and favorable earnings growth. In early 2025, the new U.S. administration took office and implemented policies on government spending, immigration, and tariffs. Financial market sentiment grew concerned and volatility spiked until the administration temporarily paused tariffs. With uncertainty easing, overall corporate earnings generally exceeded expectations and propelled growth indexes upward. Artificial intelligence (AI) was a key driver as leading technology firms ramped up capital expenditures on AI infrastructure. The portfolio benefited from security selection within communication services and financials, where holdings with innovative products and strong demand, such as Robinhood Markets, Inc. and Roblox Corp., contributed. In contrast, relative underweights to select mega-cap technology companies, including NVIDIA Corp. and Broadcom, Inc. detracted from returns. |
| Line Graph [Table Text Block] |
|

|
Class R6 |
Russell 3000® Growth Index |
Russell 3000® Index |
7/31/2015 |
$10,000 |
$10,000 |
$10,000 |
8/31/2015 |
$9,223 |
$9,381 |
$9,396 |
9/30/2015 |
$8,905 |
$9,120 |
$9,122 |
10/31/2015 |
$9,474 |
$9,885 |
$9,843 |
11/30/2015 |
$9,636 |
$9,937 |
$9,898 |
12/31/2015 |
$9,485 |
$9,766 |
$9,694 |
1/31/2016 |
$8,572 |
$9,183 |
$9,147 |
2/29/2016 |
$8,504 |
$9,175 |
$9,144 |
3/31/2016 |
$8,960 |
$9,799 |
$9,788 |
4/30/2016 |
$9,164 |
$9,723 |
$9,849 |
5/31/2016 |
$9,419 |
$9,917 |
$10,025 |
6/30/2016 |
$9,267 |
$9,878 |
$10,046 |
7/31/2016 |
$9,875 |
$10,357 |
$10,444 |
8/31/2016 |
$9,869 |
$10,318 |
$10,471 |
9/30/2016 |
$9,836 |
$10,364 |
$10,488 |
10/31/2016 |
$9,465 |
$10,090 |
$10,261 |
11/30/2016 |
$9,599 |
$10,359 |
$10,720 |
12/31/2016 |
$9,439 |
$10,488 |
$10,929 |
1/31/2017 |
$10,012 |
$10,828 |
$11,135 |
2/28/2017 |
$10,420 |
$11,263 |
$11,549 |
3/31/2017 |
$10,554 |
$11,394 |
$11,557 |
4/30/2017 |
$10,908 |
$11,651 |
$11,679 |
5/31/2017 |
$11,235 |
$11,924 |
$11,799 |
6/30/2017 |
$11,164 |
$11,924 |
$11,905 |
7/31/2017 |
$11,504 |
$12,224 |
$12,130 |
8/31/2017 |
$11,684 |
$12,430 |
$12,153 |
9/30/2017 |
$11,943 |
$12,631 |
$12,449 |
10/31/2017 |
$12,416 |
$13,097 |
$12,721 |
11/30/2017 |
$12,656 |
$13,493 |
$13,107 |
12/31/2017 |
$12,765 |
$13,592 |
$13,238 |
1/31/2018 |
$13,867 |
$14,521 |
$13,936 |
2/28/2018 |
$13,758 |
$14,138 |
$13,423 |
3/31/2018 |
$13,615 |
$13,793 |
$13,153 |
4/30/2018 |
$13,609 |
$13,839 |
$13,203 |
5/31/2018 |
$14,370 |
$14,466 |
$13,576 |
6/30/2018 |
$14,441 |
$14,603 |
$13,665 |
7/31/2018 |
$14,754 |
$15,018 |
$14,118 |
8/31/2018 |
$15,605 |
$15,848 |
$14,614 |
9/30/2018 |
$15,558 |
$15,901 |
$14,638 |
10/31/2018 |
$13,916 |
$14,433 |
$13,560 |
11/30/2018 |
$14,127 |
$14,592 |
$13,832 |
12/31/2018 |
$12,842 |
$13,304 |
$12,544 |
1/31/2019 |
$14,288 |
$14,524 |
$13,621 |
2/28/2019 |
$15,132 |
$15,075 |
$14,100 |
3/31/2019 |
$15,386 |
$15,456 |
$14,306 |
4/30/2019 |
$16,417 |
$16,138 |
$14,877 |
5/31/2019 |
$15,591 |
$15,106 |
$13,915 |
6/30/2019 |
$16,520 |
$16,152 |
$14,892 |
7/31/2019 |
$16,828 |
$16,503 |
$15,113 |
8/31/2019 |
$16,579 |
$16,337 |
$14,805 |
9/30/2019 |
$16,281 |
$16,330 |
$15,065 |
10/31/2019 |
$16,546 |
$16,791 |
$15,389 |
11/30/2019 |
$17,493 |
$17,551 |
$15,974 |
12/31/2019 |
$17,680 |
$18,073 |
$16,436 |
1/31/2020 |
$18,375 |
$18,437 |
$16,418 |
2/29/2020 |
$17,058 |
$17,177 |
$15,074 |
3/31/2020 |
$14,820 |
$15,388 |
$13,001 |
4/30/2020 |
$17,551 |
$17,666 |
$14,722 |
5/31/2020 |
$19,231 |
$18,880 |
$15,510 |
6/30/2020 |
$19,963 |
$19,696 |
$15,864 |
7/31/2020 |
$21,482 |
$21,163 |
$16,765 |
8/31/2020 |
$23,090 |
$23,295 |
$17,980 |
9/30/2020 |
$22,346 |
$22,229 |
$17,325 |
10/31/2020 |
$22,201 |
$21,526 |
$16,951 |
11/30/2020 |
$24,981 |
$23,823 |
$19,013 |
12/31/2020 |
$26,443 |
$24,987 |
$19,869 |
1/31/2021 |
$26,108 |
$24,893 |
$19,780 |
2/28/2021 |
$27,046 |
$24,944 |
$20,399 |
3/31/2021 |
$25,831 |
$25,285 |
$21,130 |
4/30/2021 |
$27,622 |
$26,926 |
$22,219 |
5/31/2021 |
$26,514 |
$26,527 |
$22,320 |
6/30/2021 |
$28,600 |
$28,163 |
$22,871 |
7/31/2021 |
$29,257 |
$28,958 |
$23,258 |
8/31/2021 |
$30,145 |
$30,005 |
$23,921 |
9/30/2021 |
$28,654 |
$28,358 |
$22,848 |
10/31/2021 |
$30,378 |
$30,742 |
$24,393 |
11/30/2021 |
$28,667 |
$30,825 |
$24,021 |
12/31/2021 |
$28,529 |
$31,446 |
$24,967 |
1/31/2022 |
$24,870 |
$28,659 |
$23,498 |
2/28/2022 |
$24,158 |
$27,516 |
$22,906 |
3/31/2022 |
$24,542 |
$28,537 |
$23,649 |
4/30/2022 |
$21,055 |
$25,088 |
$21,527 |
5/31/2022 |
$20,244 |
$24,511 |
$21,498 |
6/30/2022 |
$18,659 |
$22,594 |
$19,700 |
7/31/2022 |
$20,759 |
$25,295 |
$21,548 |
8/31/2022 |
$19,761 |
$24,172 |
$20,744 |
9/30/2022 |
$17,718 |
$21,832 |
$18,820 |
10/31/2022 |
$18,259 |
$23,157 |
$20,364 |
11/30/2022 |
$19,173 |
$24,170 |
$21,426 |
12/31/2022 |
$18,016 |
$22,338 |
$20,172 |
1/31/2023 |
$19,661 |
$24,222 |
$21,561 |
2/28/2023 |
$19,405 |
$23,936 |
$21,057 |
3/31/2023 |
$20,630 |
$25,432 |
$21,620 |
4/30/2023 |
$20,695 |
$25,651 |
$21,851 |
5/31/2023 |
$21,185 |
$26,754 |
$21,936 |
6/30/2023 |
$22,661 |
$28,604 |
$23,433 |
7/31/2023 |
$23,232 |
$29,587 |
$24,273 |
8/31/2023 |
$22,530 |
$29,255 |
$23,805 |
9/30/2023 |
$21,223 |
$27,647 |
$22,671 |
10/31/2023 |
$20,782 |
$27,168 |
$22,070 |
11/30/2023 |
$23,102 |
$30,107 |
$24,128 |
12/31/2023 |
$24,162 |
$31,543 |
$25,408 |
1/31/2024 |
$24,992 |
$32,241 |
$25,689 |
2/29/2024 |
$27,260 |
$34,460 |
$27,080 |
3/31/2024 |
$27,686 |
$35,084 |
$27,953 |
4/30/2024 |
$26,324 |
$33,538 |
$26,723 |
5/31/2024 |
$27,803 |
$35,536 |
$27,986 |
6/30/2024 |
$29,416 |
$37,819 |
$28,852 |
7/31/2024 |
$28,499 |
$37,340 |
$29,389 |
8/31/2024 |
$29,445 |
$38,060 |
$30,029 |
9/30/2024 |
$30,375 |
$39,112 |
$30,650 |
10/31/2024 |
$30,170 |
$38,964 |
$30,425 |
11/30/2024 |
$32,344 |
$41,594 |
$32,449 |
12/31/2024 |
$31,299 |
$41,781 |
$31,457 |
1/31/2025 |
$32,370 |
$42,629 |
$32,450 |
2/28/2025 |
$30,877 |
$41,037 |
$31,828 |
3/31/2025 |
$28,024 |
$37,582 |
$29,971 |
4/30/2025 |
$28,841 |
$38,185 |
$29,770 |
5/31/2025 |
$32,004 |
$41,561 |
$31,657 |
6/30/2025 |
$34,645 |
$44,243 |
$33,266 |
7/31/2025 |
$35,878 |
$45,874 |
$33,998 |
|
| Average Annual Return [Table Text Block] |
|
AVERAGE ANNUAL TOTAL RETURNS (%)
AATR |
1 Year |
5 Years |
10 Years |
Class R6Footnote Reference* |
25.87 |
10.80 |
13.63 |
Russell 3000® Growth Index |
22.86 |
16.73 |
16.45 |
Russell 3000® Index |
15.68 |
15.19 |
13.02 |
| Footnote |
Description |
Footnote* |
Historical performance shown for the Class R6 shares prior to their inception on September 30, 2015 reflects the performance of the Institutional Class shares, and includes the higher expenses applicable to the Institutional Class shares. If these expenses had not been included, returns for the Class R6 shares would be higher. | |
| AssetsNet |
|
$ 3,582,917,430
|
| Holdings Count | Holding |
|
68
|
| Advisory Fees Paid, Amount |
|
$ 23,734,108
|
| InvestmentCompanyPortfolioTurnover |
|
73.00%
|
| Holdings [Text Block] |
|
SECTOR ALLOCATION (% OF LONG-TERM INVESTMENTS)
Information technology |
40.5 |
Consumer discretionary |
14.7 |
Communication services |
12.5 |
Financials |
12.3 |
Industrials |
9.8 |
Health care |
8.5 |
Materials |
1.7 | |
| Largest Holdings [Text Block] |
|
TOP TEN HOLDINGS (% OF NET ASSETS)
NVIDIA Corp. |
8.9 |
Microsoft Corp. |
8.9 |
Meta Platforms, Inc. Class A |
6.7 |
Amazon.com, Inc. |
4.7 |
Broadcom, Inc. |
4.3 |
Oracle Corp. |
2.2 |
Mastercard, Inc. Class A |
2.1 |
DoorDash, Inc. Class A |
1.9 |
Arista Networks, Inc. |
1.7 |
Booking Holdings, Inc. |
1.7 | |
| Material Fund Change [Text Block] |
|
|
| C000019941 |
|
|
| Shareholder Report [Line Items] |
|
|
| Fund Name |
|
Growth Fund
|
| Class Name |
|
Class C
|
| Trading Symbol |
|
WGFCX
|
| Annual or Semi-Annual Statement [Text Block] |
|
This annual shareholder report contains important information about Growth Fund for the period from August 1, 2024 to July 31, 2025.
|
| Shareholder Report Annual or Semi-Annual |
|
Annual Shareholder Report
|
| Additional Information [Text Block] |
|
You can find additional information about the Fund at allspringglobal.com. You can also request this information by contacting us at 1-800-222-8222.
|
| Material Fund Change Notice [Text Block] |
|
This report describes changes to the Fund that occurred either during or after the reporting period.
|
| Additional Information Phone Number |
|
<span style="white-space: nowrap; box-sizing: border-box; color: rgb(0, 0, 0); display: inline; flex-wrap: nowrap; font-size: 12px; font-weight: 400; grid-area: auto; line-height: 18px; margin: 0px; overflow: visible; text-align: left; text-align-last: auto;"> 1-800-222-8222.</span>
|
| Additional Information Website |
|
<span style="box-sizing: border-box; color: rgb(0, 0, 0); display: inline; flex-wrap: nowrap; font-size: 12px; font-weight: 400; grid-area: auto; line-height: 18px; margin: 0px; overflow: visible; text-align: left; text-align-last: auto; white-space-collapse: preserve-breaks;">allspringglobal.com</span>
|
| Expenses [Text Block] |
|
What were the Fund costs for the past year?The table explains the costs you would have paid within the reporting period based on a hypothetical $10,000 investment.
CLASS NAME |
COSTS OF A $10,000 INVESTMENT |
COSTS PAID AS A % OF A $10,000 INVESTMENT |
Class C |
$213 |
1.90% | The manager has contractually committed to waive fees and/or reimburse certain expenses to the extent necessary to cap the Fund's total annual fund operating expense ratio at a specific amount. Without this cap, the costs shown above may have been higher. Please see the prospectus for the amount and the expiration date of the cap. Prior to or after the commitment expiration date, the cap may be increased or the commitment to maintain the cap may be terminated only with the approval of the Board of Trustees. |
| Expenses Paid, Amount |
|
$ 213
|
| Expense Ratio, Percent |
|
1.90%
|
| Factors Affecting Performance [Text Block] |
|
How did the Fund perform last year and what affected its performance?The market environment for the 12-month period that ended July 31, 2025, was bifurcated for U.S. equities. During the first half of the period, the economy was generally healthy, with moderating inflation, resilient consumer spending, and favorable earnings growth. In early 2025, the new U.S. administration took office and implemented policies on government spending, immigration, and tariffs. Financial market sentiment grew concerned and volatility spiked until the administration temporarily paused tariffs. With uncertainty easing, overall corporate earnings generally exceeded expectations and propelled growth indexes upward. Artificial intelligence (AI) was a key driver as leading technology firms ramped up capital expenditures on AI infrastructure. The portfolio benefited from security selection within communication services and financials, where holdings with innovative products and strong demand, such as Robinhood Markets, Inc. and Roblox Corp., contributed. In contrast, relative underweights to select mega-cap technology companies, including NVIDIA Corp. and Broadcom, Inc. detracted from returns. |
| Line Graph [Table Text Block] |
|
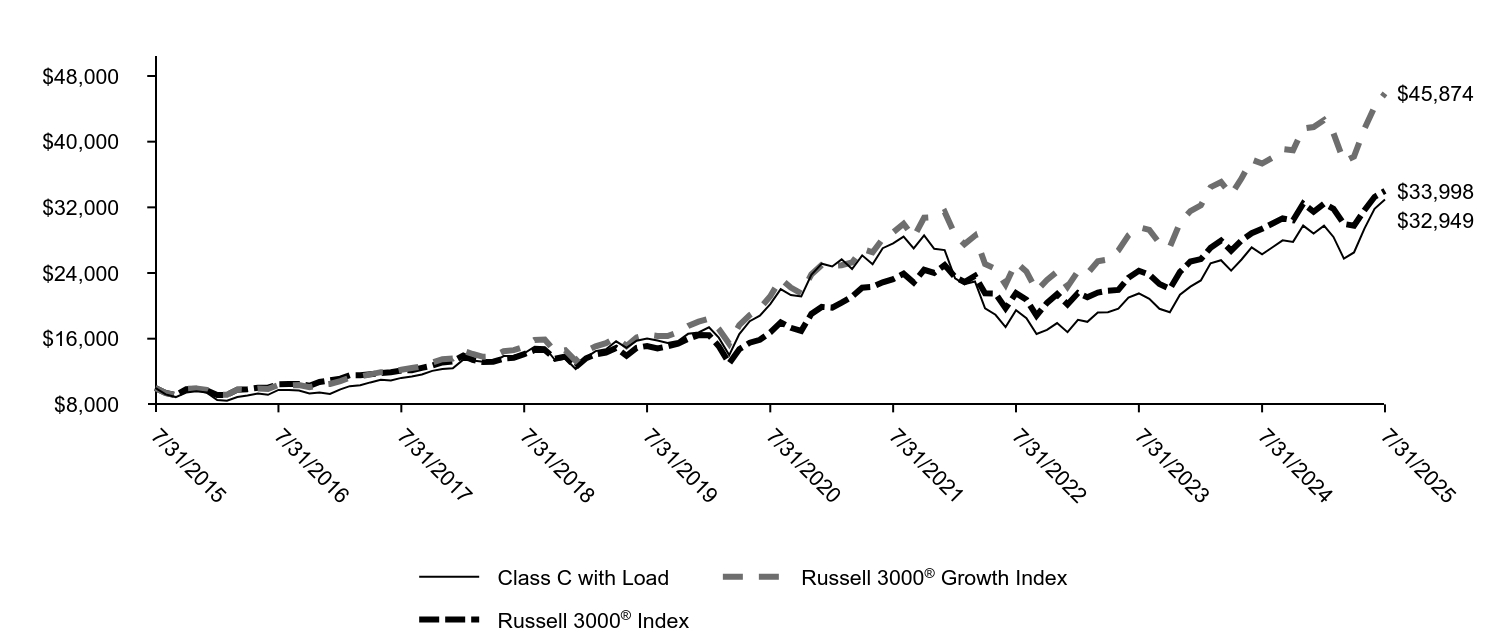
|
Class C with Load |
Russell 3000® Growth Index |
Russell 3000® Index |
7/31/2015 |
$10,000 |
$10,000 |
$10,000 |
8/31/2015 |
$9,214 |
$9,381 |
$9,396 |
9/30/2015 |
$8,886 |
$9,120 |
$9,122 |
10/31/2015 |
$9,445 |
$9,885 |
$9,843 |
11/30/2015 |
$9,598 |
$9,937 |
$9,898 |
12/31/2015 |
$9,435 |
$9,766 |
$9,694 |
1/31/2016 |
$8,519 |
$9,183 |
$9,147 |
2/29/2016 |
$8,445 |
$9,175 |
$9,144 |
3/31/2016 |
$8,887 |
$9,799 |
$9,788 |
4/30/2016 |
$9,079 |
$9,723 |
$9,849 |
5/31/2016 |
$9,324 |
$9,917 |
$10,025 |
6/30/2016 |
$9,164 |
$9,878 |
$10,046 |
7/31/2016 |
$9,756 |
$10,357 |
$10,444 |
8/31/2016 |
$9,740 |
$10,318 |
$10,471 |
9/30/2016 |
$9,698 |
$10,364 |
$10,488 |
10/31/2016 |
$9,322 |
$10,090 |
$10,261 |
11/30/2016 |
$9,445 |
$10,359 |
$10,720 |
12/31/2016 |
$9,273 |
$10,488 |
$10,929 |
1/31/2017 |
$9,830 |
$10,828 |
$11,135 |
2/28/2017 |
$10,219 |
$11,263 |
$11,549 |
3/31/2017 |
$10,341 |
$11,394 |
$11,557 |
4/30/2017 |
$10,674 |
$11,651 |
$11,679 |
5/31/2017 |
$10,987 |
$11,924 |
$11,799 |
6/30/2017 |
$10,905 |
$11,924 |
$11,905 |
7/31/2017 |
$11,224 |
$12,224 |
$12,130 |
8/31/2017 |
$11,389 |
$12,430 |
$12,153 |
9/30/2017 |
$11,630 |
$12,631 |
$12,449 |
10/31/2017 |
$12,078 |
$13,097 |
$12,721 |
11/30/2017 |
$12,299 |
$13,493 |
$13,107 |
12/31/2017 |
$12,391 |
$13,592 |
$13,238 |
1/31/2018 |
$13,446 |
$14,521 |
$13,936 |
2/28/2018 |
$13,329 |
$14,138 |
$13,423 |
3/31/2018 |
$13,179 |
$13,793 |
$13,153 |
4/30/2018 |
$13,160 |
$13,839 |
$13,203 |
5/31/2018 |
$13,878 |
$14,466 |
$13,576 |
6/30/2018 |
$13,934 |
$14,603 |
$13,665 |
7/31/2018 |
$14,225 |
$15,018 |
$14,118 |
8/31/2018 |
$15,027 |
$15,848 |
$14,614 |
9/30/2018 |
$14,971 |
$15,901 |
$14,638 |
10/31/2018 |
$13,371 |
$14,433 |
$13,560 |
11/30/2018 |
$13,564 |
$14,592 |
$13,832 |
12/31/2018 |
$12,312 |
$13,304 |
$12,544 |
1/31/2019 |
$13,693 |
$14,524 |
$13,621 |
2/28/2019 |
$14,486 |
$15,075 |
$14,100 |
3/31/2019 |
$14,709 |
$15,456 |
$14,306 |
4/30/2019 |
$15,682 |
$16,138 |
$14,877 |
5/31/2019 |
$14,877 |
$15,106 |
$13,915 |
6/30/2019 |
$15,750 |
$16,152 |
$14,892 |
7/31/2019 |
$16,029 |
$16,503 |
$15,113 |
8/31/2019 |
$15,775 |
$16,337 |
$14,805 |
9/30/2019 |
$15,478 |
$16,330 |
$15,065 |
10/31/2019 |
$15,713 |
$16,791 |
$15,389 |
11/30/2019 |
$16,593 |
$17,551 |
$15,974 |
12/31/2019 |
$16,752 |
$18,073 |
$16,436 |
1/31/2020 |
$17,388 |
$18,437 |
$16,418 |
2/29/2020 |
$16,130 |
$17,177 |
$15,074 |
3/31/2020 |
$13,999 |
$15,388 |
$13,001 |
4/30/2020 |
$16,567 |
$17,666 |
$14,722 |
5/31/2020 |
$18,135 |
$18,880 |
$15,510 |
6/30/2020 |
$18,801 |
$19,696 |
$15,864 |
7/31/2020 |
$20,215 |
$21,163 |
$16,765 |
8/31/2020 |
$22,042 |
$23,295 |
$17,980 |
9/30/2020 |
$21,310 |
$22,229 |
$17,325 |
10/31/2020 |
$21,154 |
$21,526 |
$16,951 |
11/30/2020 |
$23,774 |
$23,823 |
$19,013 |
12/31/2020 |
$25,138 |
$24,987 |
$19,869 |
1/31/2021 |
$24,793 |
$24,893 |
$19,780 |
2/28/2021 |
$25,663 |
$24,944 |
$20,399 |
3/31/2021 |
$24,485 |
$25,285 |
$21,130 |
4/30/2021 |
$26,153 |
$26,926 |
$22,219 |
5/31/2021 |
$25,074 |
$26,527 |
$22,320 |
6/30/2021 |
$27,023 |
$28,163 |
$22,871 |
7/31/2021 |
$27,621 |
$28,958 |
$23,258 |
8/31/2021 |
$28,428 |
$30,005 |
$23,921 |
9/30/2021 |
$26,996 |
$28,358 |
$22,848 |
10/31/2021 |
$28,591 |
$30,742 |
$24,393 |
11/30/2021 |
$26,951 |
$30,825 |
$24,021 |
12/31/2021 |
$26,789 |
$31,446 |
$24,967 |
1/31/2022 |
$23,340 |
$28,659 |
$23,498 |
2/28/2022 |
$22,650 |
$27,516 |
$22,906 |
3/31/2022 |
$22,975 |
$28,537 |
$23,649 |
4/30/2022 |
$19,695 |
$25,088 |
$21,527 |
5/31/2022 |
$18,914 |
$24,511 |
$21,498 |
6/30/2022 |
$17,417 |
$22,594 |
$19,700 |
7/31/2022 |
$19,461 |
$25,295 |
$21,548 |
8/31/2022 |
$18,497 |
$24,172 |
$20,744 |
9/30/2022 |
$16,571 |
$21,832 |
$18,820 |
10/31/2022 |
$17,066 |
$23,157 |
$20,364 |
11/30/2022 |
$17,899 |
$24,170 |
$21,426 |
12/31/2022 |
$16,795 |
$22,338 |
$20,172 |
1/31/2023 |
$18,307 |
$24,222 |
$21,561 |
2/28/2023 |
$18,055 |
$23,936 |
$21,057 |
3/31/2023 |
$19,181 |
$25,432 |
$21,620 |
4/30/2023 |
$19,226 |
$25,651 |
$21,851 |
5/31/2023 |
$19,656 |
$26,754 |
$21,936 |
6/30/2023 |
$21,005 |
$28,604 |
$23,433 |
7/31/2023 |
$21,509 |
$29,587 |
$24,273 |
8/31/2023 |
$20,852 |
$29,255 |
$23,805 |
9/30/2023 |
$19,638 |
$27,647 |
$22,671 |
10/31/2023 |
$19,221 |
$27,168 |
$22,070 |
11/30/2023 |
$21,354 |
$30,107 |
$24,128 |
12/31/2023 |
$22,333 |
$31,543 |
$25,408 |
1/31/2024 |
$23,093 |
$32,241 |
$25,689 |
2/29/2024 |
$25,174 |
$34,460 |
$27,080 |
3/31/2024 |
$25,563 |
$35,084 |
$27,953 |
4/30/2024 |
$24,294 |
$33,538 |
$26,723 |
5/31/2024 |
$25,649 |
$35,536 |
$27,986 |
6/30/2024 |
$27,126 |
$37,819 |
$28,852 |
7/31/2024 |
$26,280 |
$37,340 |
$29,389 |
8/31/2024 |
$27,143 |
$38,060 |
$30,029 |
9/30/2024 |
$27,981 |
$39,112 |
$30,650 |
10/31/2024 |
$27,791 |
$38,964 |
$30,425 |
11/30/2024 |
$29,778 |
$41,594 |
$32,449 |
12/31/2024 |
$28,812 |
$41,781 |
$31,457 |
1/31/2025 |
$29,775 |
$42,629 |
$32,450 |
2/28/2025 |
$28,396 |
$41,037 |
$31,828 |
3/31/2025 |
$25,757 |
$37,582 |
$29,971 |
4/30/2025 |
$26,506 |
$38,185 |
$29,770 |
5/31/2025 |
$29,406 |
$41,561 |
$31,657 |
6/30/2025 |
$31,819 |
$44,243 |
$33,266 |
7/31/2025 |
$32,949 |
$45,874 |
$33,998 |
|
| Average Annual Return [Table Text Block] |
|
AVERAGE ANNUAL TOTAL RETURNS (%)
AATR |
1 Year |
5 Years |
10 Years |
Class C |
24.33 |
9.92 |
12.66 |
Class C with Load |
23.33 |
9.92 |
12.66 |
Russell 3000® Growth Index |
22.86 |
16.73 |
16.45 |
Russell 3000® Index |
15.68 |
15.19 |
13.02 | |
| Material Change Date |
Aug. 01, 2024
|
|
| AssetsNet |
|
$ 3,582,917,430
|
| Holdings Count | Holding |
|
68
|
| Advisory Fees Paid, Amount |
|
$ 23,734,108
|
| InvestmentCompanyPortfolioTurnover |
|
73.00%
|
| Holdings [Text Block] |
|
SECTOR ALLOCATION (% OF LONG-TERM INVESTMENTS)
Information technology |
40.5 |
Consumer discretionary |
14.7 |
Communication services |
12.5 |
Financials |
12.3 |
Industrials |
9.8 |
Health care |
8.5 |
Materials |
1.7 | |
| Largest Holdings [Text Block] |
|
TOP TEN HOLDINGS (% OF NET ASSETS)
NVIDIA Corp. |
8.9 |
Microsoft Corp. |
8.9 |
Meta Platforms, Inc. Class A |
6.7 |
Amazon.com, Inc. |
4.7 |
Broadcom, Inc. |
4.3 |
Oracle Corp. |
2.2 |
Mastercard, Inc. Class A |
2.1 |
DoorDash, Inc. Class A |
1.9 |
Arista Networks, Inc. |
1.7 |
Booking Holdings, Inc. |
1.7 | |
| Material Fund Change [Text Block] |
|
This is a summary of certain changes and planned changes to the Fund since August 1, 2024. At a meeting held on August 19-20, 2025, the Board of Trustees of the Fund approved the conversion of the Fund’s Class C shares into Class A shares effective on or about the close of business on November 14, 2025. In addition, effective at the close of business on September 29, 2025, Class C will be closed to new investors and additional investments from existing shareholders. |
| Summary of Change Legend [Text Block] |
|
This is a summary of certain changes and planned changes to the Fund since August 1, 2024.
|
| C000019942 |
|
|
| Shareholder Report [Line Items] |
|
|
| Fund Name |
|
Growth Fund
|
| Class Name |
|
Class A
|
| Trading Symbol |
|
SGRAX
|
| Annual or Semi-Annual Statement [Text Block] |
|
This annual shareholder report contains important information about Growth Fund for the period from August 1, 2024 to July 31, 2025.
|
| Shareholder Report Annual or Semi-Annual |
|
Annual Shareholder Report
|
| Additional Information [Text Block] |
|
You can find additional information about the Fund at allspringglobal.com. You can also request this information by contacting us at 1-800-222-8222.
|
| Additional Information Phone Number |
|
<span style="white-space: nowrap; box-sizing: border-box; color: rgb(0, 0, 0); display: inline; flex-wrap: nowrap; font-size: 12px; font-weight: 400; grid-area: auto; line-height: 18px; margin: 0px; overflow: visible; text-align: left; text-align-last: auto;"> 1-800-222-8222.</span>
|
| Additional Information Website |
|
<span style="box-sizing: border-box; color: rgb(0, 0, 0); display: inline; flex-wrap: nowrap; font-size: 12px; font-weight: 400; grid-area: auto; line-height: 18px; margin: 0px; overflow: visible; text-align: left; text-align-last: auto; white-space-collapse: preserve-breaks;">allspringglobal.com</span>
|
| Expenses [Text Block] |
|
What were the Fund costs for the past year?The table explains the costs you would have paid within the reporting period based on a hypothetical $10,000 investment.
CLASS NAME |
COSTS OF A $10,000 INVESTMENT |
COSTS PAID AS A % OF A $10,000 INVESTMENT |
Class A |
$126 |
1.12% | The manager has contractually committed to waive fees and/or reimburse certain expenses to the extent necessary to cap the Fund's total annual fund operating expense ratio at a specific amount. Without this cap, the costs shown above may have been higher. Please see the prospectus for the amount and the expiration date of the cap. Prior to or after the commitment expiration date, the cap may be increased or the commitment to maintain the cap may be terminated only with the approval of the Board of Trustees. |
| Expenses Paid, Amount |
|
$ 126
|
| Expense Ratio, Percent |
|
1.12%
|
| Factors Affecting Performance [Text Block] |
|
How did the Fund perform last year and what affected its performance?The market environment for the 12-month period that ended July 31, 2025, was bifurcated for U.S. equities. During the first half of the period, the economy was generally healthy, with moderating inflation, resilient consumer spending, and favorable earnings growth. In early 2025, the new U.S. administration took office and implemented policies on government spending, immigration, and tariffs. Financial market sentiment grew concerned and volatility spiked until the administration temporarily paused tariffs. With uncertainty easing, overall corporate earnings generally exceeded expectations and propelled growth indexes upward. Artificial intelligence (AI) was a key driver as leading technology firms ramped up capital expenditures on AI infrastructure. The portfolio benefited from security selection within communication services and financials, where holdings with innovative products and strong demand, such as Robinhood Markets, Inc. and Roblox Corp., contributed. In contrast, relative underweights to select mega-cap technology companies, including NVIDIA Corp. and Broadcom, Inc. detracted from returns. |
| Line Graph [Table Text Block] |
|

|
Class A with Load |
Russell 3000® Growth Index |
Russell 3000® Index |
7/31/2015 |
$9,425 |
$10,000 |
$10,000 |
8/31/2015 |
$8,690 |
$9,381 |
$9,396 |
9/30/2015 |
$8,387 |
$9,120 |
$9,122 |
10/31/2015 |
$8,920 |
$9,885 |
$9,843 |
11/30/2015 |
$9,069 |
$9,937 |
$9,898 |
12/31/2015 |
$8,922 |
$9,766 |
$9,694 |
1/31/2016 |
$8,060 |
$9,183 |
$9,147 |
2/29/2016 |
$7,995 |
$9,175 |
$9,144 |
3/31/2016 |
$8,420 |
$9,799 |
$9,788 |
4/30/2016 |
$8,606 |
$9,723 |
$9,849 |
5/31/2016 |
$8,845 |
$9,917 |
$10,025 |
6/30/2016 |
$8,698 |
$9,878 |
$10,046 |
7/31/2016 |
$9,266 |
$10,357 |
$10,444 |
8/31/2016 |
$9,255 |
$10,318 |
$10,471 |
9/30/2016 |
$9,222 |
$10,364 |
$10,488 |
10/31/2016 |
$8,869 |
$10,090 |
$10,261 |
11/30/2016 |
$8,992 |
$10,359 |
$10,720 |
12/31/2016 |
$8,839 |
$10,488 |
$10,929 |
1/31/2017 |
$9,374 |
$10,828 |
$11,135 |
2/28/2017 |
$9,749 |
$11,263 |
$11,549 |
3/31/2017 |
$9,871 |
$11,394 |
$11,557 |
4/30/2017 |
$10,199 |
$11,651 |
$11,679 |
5/31/2017 |
$10,502 |
$11,924 |
$11,799 |
6/30/2017 |
$10,430 |
$11,924 |
$11,905 |
7/31/2017 |
$10,744 |
$12,224 |
$12,130 |
8/31/2017 |
$10,906 |
$12,430 |
$12,153 |
9/30/2017 |
$11,146 |
$12,631 |
$12,449 |
10/31/2017 |
$11,582 |
$13,097 |
$12,721 |
11/30/2017 |
$11,803 |
$13,493 |
$13,107 |
12/31/2017 |
$11,896 |
$13,592 |
$13,238 |
1/31/2018 |
$12,918 |
$14,521 |
$13,936 |
2/28/2018 |
$12,815 |
$14,138 |
$13,423 |
3/31/2018 |
$12,677 |
$13,793 |
$13,153 |
4/30/2018 |
$12,666 |
$13,839 |
$13,203 |
5/31/2018 |
$13,368 |
$14,466 |
$13,576 |
6/30/2018 |
$13,432 |
$14,603 |
$13,665 |
7/31/2018 |
$13,716 |
$15,018 |
$14,118 |
8/31/2018 |
$14,500 |
$15,848 |
$14,614 |
9/30/2018 |
$14,454 |
$15,901 |
$14,638 |
10/31/2018 |
$12,921 |
$14,433 |
$13,560 |
11/30/2018 |
$13,113 |
$14,592 |
$13,832 |
12/31/2018 |
$11,913 |
$13,304 |
$12,544 |
1/31/2019 |
$13,253 |
$14,524 |
$13,621 |
2/28/2019 |
$14,028 |
$15,075 |
$14,100 |
3/31/2019 |
$14,260 |
$15,456 |
$14,306 |
4/30/2019 |
$15,211 |
$16,138 |
$14,877 |
5/31/2019 |
$14,440 |
$15,106 |
$13,915 |
6/30/2019 |
$15,294 |
$16,152 |
$14,892 |
7/31/2019 |
$15,574 |
$16,503 |
$15,113 |
8/31/2019 |
$15,338 |
$16,337 |
$14,805 |
9/30/2019 |
$15,057 |
$16,330 |
$15,065 |
10/31/2019 |
$15,294 |
$16,791 |
$15,389 |
11/30/2019 |
$16,165 |
$17,551 |
$15,974 |
12/31/2019 |
$16,331 |
$18,073 |
$16,436 |
1/31/2020 |
$16,967 |
$18,437 |
$16,418 |
2/29/2020 |
$15,745 |
$17,177 |
$15,074 |
3/31/2020 |
$13,675 |
$15,388 |
$13,001 |
4/30/2020 |
$16,187 |
$17,666 |
$14,722 |
5/31/2020 |
$17,731 |
$18,880 |
$15,510 |
6/30/2020 |
$18,402 |
$19,696 |
$15,864 |
7/31/2020 |
$19,792 |
$21,163 |
$16,765 |
8/31/2020 |
$21,267 |
$23,295 |
$17,980 |
9/30/2020 |
$20,576 |
$22,229 |
$17,325 |
10/31/2020 |
$20,432 |
$21,526 |
$16,951 |
11/30/2020 |
$22,985 |
$23,823 |
$19,013 |
12/31/2020 |
$24,319 |
$24,987 |
$19,869 |
1/31/2021 |
$24,000 |
$24,893 |
$19,780 |
2/28/2021 |
$24,854 |
$24,944 |
$20,399 |
3/31/2021 |
$23,727 |
$25,285 |
$21,130 |
4/30/2021 |
$25,366 |
$26,926 |
$22,219 |
5/31/2021 |
$24,341 |
$26,527 |
$22,320 |
6/30/2021 |
$26,242 |
$28,163 |
$22,871 |
7/31/2021 |
$26,840 |
$28,958 |
$23,258 |
8/31/2021 |
$27,642 |
$30,005 |
$23,921 |
9/30/2021 |
$26,265 |
$28,358 |
$22,848 |
10/31/2021 |
$27,836 |
$30,742 |
$24,393 |
11/30/2021 |
$26,259 |
$30,825 |
$24,021 |
12/31/2021 |
$26,121 |
$31,446 |
$24,967 |
1/31/2022 |
$22,760 |
$28,659 |
$23,498 |
2/28/2022 |
$22,102 |
$27,516 |
$22,906 |
3/31/2022 |
$22,442 |
$28,537 |
$23,649 |
4/30/2022 |
$19,251 |
$25,088 |
$21,527 |
5/31/2022 |
$18,501 |
$24,511 |
$21,498 |
6/30/2022 |
$17,051 |
$22,594 |
$19,700 |
7/31/2022 |
$18,961 |
$25,295 |
$21,548 |
8/31/2022 |
$18,041 |
$24,172 |
$20,744 |
9/30/2022 |
$16,166 |
$21,832 |
$18,820 |
10/31/2022 |
$16,662 |
$23,157 |
$20,364 |
11/30/2022 |
$17,482 |
$24,170 |
$21,426 |
12/31/2022 |
$16,423 |
$22,338 |
$20,172 |
1/31/2023 |
$17,911 |
$24,222 |
$21,561 |
2/28/2023 |
$17,676 |
$23,936 |
$21,057 |
3/31/2023 |
$18,784 |
$25,432 |
$21,620 |
4/30/2023 |
$18,837 |
$25,651 |
$21,851 |
5/31/2023 |
$19,277 |
$26,754 |
$21,936 |
6/30/2023 |
$20,613 |
$28,604 |
$23,433 |
7/31/2023 |
$21,121 |
$29,587 |
$24,273 |
8/31/2023 |
$20,476 |
$29,255 |
$23,805 |
9/30/2023 |
$19,285 |
$27,647 |
$22,671 |
10/31/2023 |
$18,875 |
$27,168 |
$22,070 |
11/30/2023 |
$20,970 |
$30,107 |
$24,128 |
12/31/2023 |
$21,931 |
$31,543 |
$25,408 |
1/31/2024 |
$22,677 |
$32,241 |
$25,689 |
2/29/2024 |
$24,721 |
$34,460 |
$27,080 |
3/31/2024 |
$25,103 |
$35,084 |
$27,953 |
4/30/2024 |
$23,856 |
$33,538 |
$26,723 |
5/31/2024 |
$25,188 |
$35,536 |
$27,986 |
6/30/2024 |
$26,638 |
$37,819 |
$28,852 |
7/31/2024 |
$25,807 |
$37,340 |
$29,389 |
8/31/2024 |
$26,655 |
$38,060 |
$30,029 |
9/30/2024 |
$27,478 |
$39,112 |
$30,650 |
10/31/2024 |
$27,291 |
$38,964 |
$30,425 |
11/30/2024 |
$29,241 |
$41,594 |
$32,449 |
12/31/2024 |
$28,294 |
$41,781 |
$31,457 |
1/31/2025 |
$29,239 |
$42,629 |
$32,450 |
2/28/2025 |
$27,885 |
$41,037 |
$31,828 |
3/31/2025 |
$25,294 |
$37,582 |
$29,971 |
4/30/2025 |
$26,029 |
$38,185 |
$29,770 |
5/31/2025 |
$28,877 |
$41,561 |
$31,657 |
6/30/2025 |
$31,247 |
$44,243 |
$33,266 |
7/31/2025 |
$32,355 |
$45,874 |
$33,998 |
|
| Average Annual Return [Table Text Block] |
|
AVERAGE ANNUAL TOTAL RETURNS (%)
AATR |
1 Year |
5 Years |
10 Years |
Class A |
25.33 |
10.33 |
13.13 |
Class A with Load |
18.11 |
9.03 |
12.46 |
Russell 3000® Growth Index |
22.86 |
16.73 |
16.45 |
Russell 3000® Index |
15.68 |
15.19 |
13.02 | |
| AssetsNet |
|
$ 3,582,917,430
|
| Holdings Count | Holding |
|
68
|
| Advisory Fees Paid, Amount |
|
$ 23,734,108
|
| InvestmentCompanyPortfolioTurnover |
|
73.00%
|
| Holdings [Text Block] |
|
SECTOR ALLOCATION (% OF LONG-TERM INVESTMENTS)
Information technology |
40.5 |
Consumer discretionary |
14.7 |
Communication services |
12.5 |
Financials |
12.3 |
Industrials |
9.8 |
Health care |
8.5 |
Materials |
1.7 | |
| Largest Holdings [Text Block] |
|
TOP TEN HOLDINGS (% OF NET ASSETS)
NVIDIA Corp. |
8.9 |
Microsoft Corp. |
8.9 |
Meta Platforms, Inc. Class A |
6.7 |
Amazon.com, Inc. |
4.7 |
Broadcom, Inc. |
4.3 |
Oracle Corp. |
2.2 |
Mastercard, Inc. Class A |
2.1 |
DoorDash, Inc. Class A |
1.9 |
Arista Networks, Inc. |
1.7 |
Booking Holdings, Inc. |
1.7 | |
| Material Fund Change [Text Block] |
|
|
| C000019943 |
|
|
| Shareholder Report [Line Items] |
|
|
| Fund Name |
|
Growth Fund
|
| Class Name |
|
Administrator Class
|
| Trading Symbol |
|
SGRKX
|
| Annual or Semi-Annual Statement [Text Block] |
|
This annual shareholder report contains important information about Growth Fund for the period from August 1, 2024 to July 31, 2025.
|
| Shareholder Report Annual or Semi-Annual |
|
Annual Shareholder Report
|
| Additional Information [Text Block] |
|
You can find additional information about the Fund at allspringglobal.com. You can also request this information by contacting us at 1-800-222-8222.
|
| Additional Information Phone Number |
|
<span style="white-space: nowrap; box-sizing: border-box; color: rgb(0, 0, 0); display: inline; flex-wrap: nowrap; font-size: 12px; font-weight: 400; grid-area: auto; line-height: 18px; margin: 0px; overflow: visible; text-align: left; text-align-last: auto;"> 1-800-222-8222.</span>
|
| Additional Information Website |
|
<span style="box-sizing: border-box; color: rgb(0, 0, 0); display: inline; flex-wrap: nowrap; font-size: 12px; font-weight: 400; grid-area: auto; line-height: 18px; margin: 0px; overflow: visible; text-align: left; text-align-last: auto; white-space-collapse: preserve-breaks;">allspringglobal.com</span>
|
| Expenses [Text Block] |
|
What were the Fund costs for the past year?The table explains the costs you would have paid within the reporting period based on a hypothetical $10,000 investment.
CLASS NAME |
COSTS OF A $10,000 INVESTMENT |
COSTS PAID AS A % OF A $10,000 INVESTMENT |
Administrator Class |
$108 |
0.96% | The manager has contractually committed to waive fees and/or reimburse certain expenses to the extent necessary to cap the Fund's total annual fund operating expense ratio at a specific amount. Without this cap, the costs shown above may have been higher. Please see the prospectus for the amount and the expiration date of the cap. Prior to or after the commitment expiration date, the cap may be increased or the commitment to maintain the cap may be terminated only with the approval of the Board of Trustees. |
| Expenses Paid, Amount |
|
$ 108
|
| Expense Ratio, Percent |
|
0.96%
|
| Factors Affecting Performance [Text Block] |
|
How did the Fund perform last year and what affected its performance?The market environment for the 12-month period that ended July 31, 2025, was bifurcated for U.S. equities. During the first half of the period, the economy was generally healthy, with moderating inflation, resilient consumer spending, and favorable earnings growth. In early 2025, the new U.S. administration took office and implemented policies on government spending, immigration, and tariffs. Financial market sentiment grew concerned and volatility spiked until the administration temporarily paused tariffs. With uncertainty easing, overall corporate earnings generally exceeded expectations and propelled growth indexes upward. Artificial intelligence (AI) was a key driver as leading technology firms ramped up capital expenditures on AI infrastructure. The portfolio benefited from security selection within communication services and financials, where holdings with innovative products and strong demand, such as Robinhood Markets, Inc. and Roblox Corp., contributed. In contrast, relative underweights to select mega-cap technology companies, including NVIDIA Corp. and Broadcom, Inc. detracted from returns. |
| Line Graph [Table Text Block] |
|
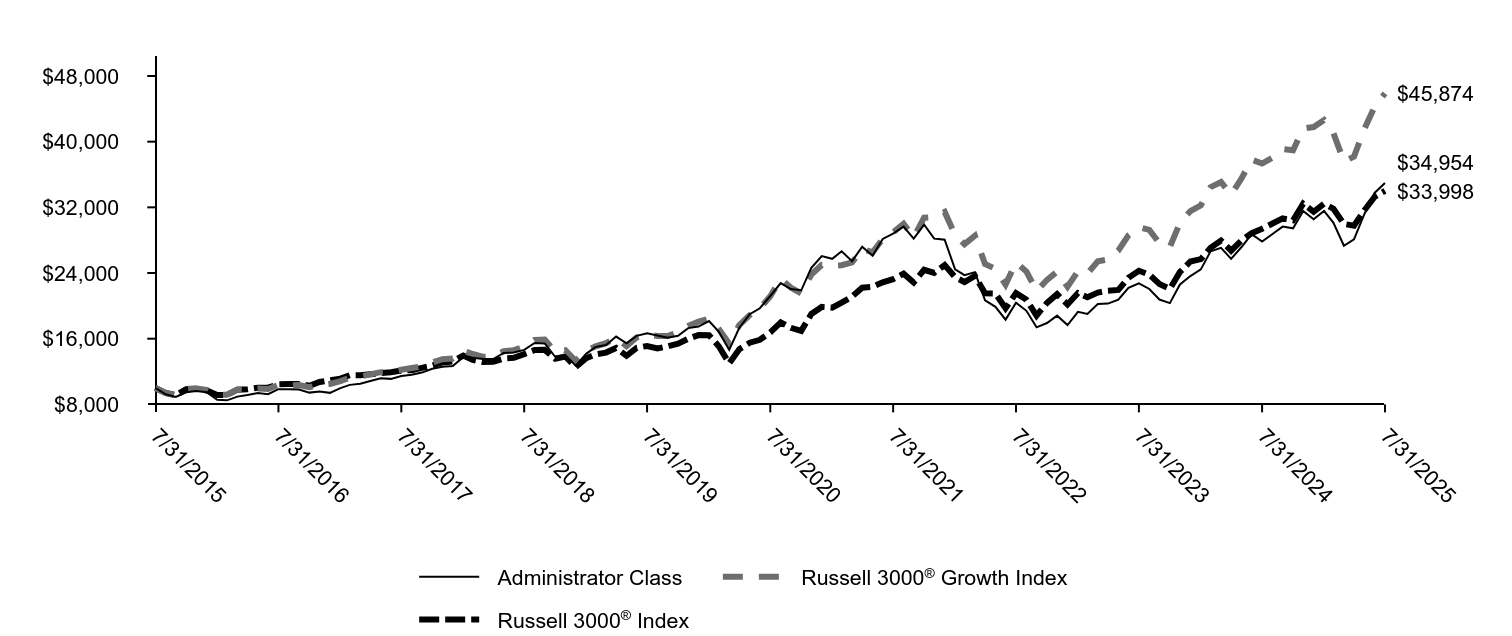
|
Administrator Class |
Russell 3000® Growth Index |
Russell 3000® Index |
7/31/2015 |
$10,000 |
$10,000 |
$10,000 |
8/31/2015 |
$9,221 |
$9,381 |
$9,396 |
9/30/2015 |
$8,899 |
$9,120 |
$9,122 |
10/31/2015 |
$9,467 |
$9,885 |
$9,843 |
11/30/2015 |
$9,627 |
$9,937 |
$9,898 |
12/31/2015 |
$9,472 |
$9,766 |
$9,694 |
1/31/2016 |
$8,560 |
$9,183 |
$9,147 |
2/29/2016 |
$8,491 |
$9,175 |
$9,144 |
3/31/2016 |
$8,943 |
$9,799 |
$9,788 |
4/30/2016 |
$9,144 |
$9,723 |
$9,849 |
5/31/2016 |
$9,396 |
$9,917 |
$10,025 |
6/30/2016 |
$9,243 |
$9,878 |
$10,046 |
7/31/2016 |
$9,847 |
$10,357 |
$10,444 |
8/31/2016 |
$9,838 |
$10,318 |
$10,471 |
9/30/2016 |
$9,804 |
$10,364 |
$10,488 |
10/31/2016 |
$9,431 |
$10,090 |
$10,261 |
11/30/2016 |
$9,562 |
$10,359 |
$10,720 |
12/31/2016 |
$9,401 |
$10,488 |
$10,929 |
1/31/2017 |
$9,971 |
$10,828 |
$11,135 |
2/28/2017 |
$10,373 |
$11,263 |
$11,549 |
3/31/2017 |
$10,507 |
$11,394 |
$11,557 |
4/30/2017 |
$10,855 |
$11,651 |
$11,679 |
5/31/2017 |
$11,180 |
$11,924 |
$11,799 |
6/30/2017 |
$11,105 |
$11,924 |
$11,905 |
7/31/2017 |
$11,442 |
$12,224 |
$12,130 |
8/31/2017 |
$11,618 |
$12,430 |
$12,153 |
9/30/2017 |
$11,873 |
$12,631 |
$12,449 |
10/31/2017 |
$12,339 |
$13,097 |
$12,721 |
11/30/2017 |
$12,576 |
$13,493 |
$13,107 |
12/31/2017 |
$12,681 |
$13,592 |
$13,238 |
1/31/2018 |
$13,771 |
$14,521 |
$13,936 |
2/28/2018 |
$13,664 |
$14,138 |
$13,423 |
3/31/2018 |
$13,518 |
$13,793 |
$13,153 |
4/30/2018 |
$13,511 |
$13,839 |
$13,203 |
5/31/2018 |
$14,258 |
$14,466 |
$13,576 |
6/30/2018 |
$14,328 |
$14,603 |
$13,665 |
7/31/2018 |
$14,635 |
$15,018 |
$14,118 |
8/31/2018 |
$15,475 |
$15,848 |
$14,614 |
9/30/2018 |
$15,428 |
$15,901 |
$14,638 |
10/31/2018 |
$13,795 |
$14,433 |
$13,560 |
11/30/2018 |
$14,001 |
$14,592 |
$13,832 |
12/31/2018 |
$12,723 |
$13,304 |
$12,544 |
1/31/2019 |
$14,157 |
$14,524 |
$13,621 |
2/28/2019 |
$14,986 |
$15,075 |
$14,100 |
3/31/2019 |
$15,234 |
$15,456 |
$14,306 |
4/30/2019 |
$16,255 |
$16,138 |
$14,877 |
5/31/2019 |
$15,430 |
$15,106 |
$13,915 |
6/30/2019 |
$16,347 |
$16,152 |
$14,892 |
7/31/2019 |
$16,651 |
$16,503 |
$15,113 |
8/31/2019 |
$16,399 |
$16,337 |
$14,805 |
9/30/2019 |
$16,103 |
$16,330 |
$15,065 |
10/31/2019 |
$16,359 |
$16,791 |
$15,389 |
11/30/2019 |
$17,292 |
$17,551 |
$15,974 |
12/31/2019 |
$17,472 |
$18,073 |
$16,436 |
1/31/2020 |
$18,153 |
$18,437 |
$16,418 |
2/29/2020 |
$16,853 |
$17,177 |
$15,074 |
3/31/2020 |
$14,635 |
$15,388 |
$13,001 |
4/30/2020 |
$17,334 |
$17,666 |
$14,722 |
5/31/2020 |
$18,986 |
$18,880 |
$15,510 |
6/30/2020 |
$19,708 |
$19,696 |
$15,864 |
7/31/2020 |
$21,200 |
$21,163 |
$16,765 |
8/31/2020 |
$22,781 |
$23,295 |
$17,980 |
9/30/2020 |
$22,046 |
$22,229 |
$17,325 |
10/31/2020 |
$21,895 |
$21,526 |
$16,951 |
11/30/2020 |
$24,629 |
$23,823 |
$19,013 |
12/31/2020 |
$26,067 |
$24,987 |
$19,869 |
1/31/2021 |
$25,733 |
$24,893 |
$19,780 |
2/28/2021 |
$26,650 |
$24,944 |
$20,399 |
3/31/2021 |
$25,448 |
$25,285 |
$21,130 |
4/30/2021 |
$27,208 |
$26,926 |
$22,219 |
5/31/2021 |
$26,106 |
$26,527 |
$22,320 |
6/30/2021 |
$28,156 |
$28,163 |
$22,871 |
7/31/2021 |
$28,794 |
$28,958 |
$23,258 |
8/31/2021 |
$29,661 |
$30,005 |
$23,921 |
9/30/2021 |
$28,191 |
$28,358 |
$22,848 |
10/31/2021 |
$29,881 |
$30,742 |
$24,393 |
11/30/2021 |
$28,191 |
$30,825 |
$24,021 |
12/31/2021 |
$28,050 |
$31,446 |
$24,967 |
1/31/2022 |
$24,443 |
$28,659 |
$23,498 |
2/28/2022 |
$23,737 |
$27,516 |
$22,906 |
3/31/2022 |
$24,111 |
$28,537 |
$23,649 |
4/30/2022 |
$20,682 |
$25,088 |
$21,527 |
5/31/2022 |
$19,881 |
$24,511 |
$21,498 |
6/30/2022 |
$18,321 |
$22,594 |
$19,700 |
7/31/2022 |
$20,379 |
$25,295 |
$21,548 |
8/31/2022 |
$19,394 |
$24,172 |
$20,744 |
9/30/2022 |
$17,383 |
$21,832 |
$18,820 |
10/31/2022 |
$17,911 |
$23,157 |
$20,364 |
11/30/2022 |
$18,807 |
$24,170 |
$21,426 |
12/31/2022 |
$17,664 |
$22,338 |
$20,172 |
1/31/2023 |
$19,274 |
$24,222 |
$21,561 |
2/28/2023 |
$19,017 |
$23,936 |
$21,057 |
3/31/2023 |
$20,219 |
$25,432 |
$21,620 |
4/30/2023 |
$20,276 |
$25,651 |
$21,851 |
5/31/2023 |
$20,752 |
$26,754 |
$21,936 |
6/30/2023 |
$22,193 |
$28,604 |
$23,433 |
7/31/2023 |
$22,744 |
$29,587 |
$24,273 |
8/31/2023 |
$22,055 |
$29,255 |
$23,805 |
9/30/2023 |
$20,771 |
$27,647 |
$22,671 |
10/31/2023 |
$20,332 |
$27,168 |
$22,070 |
11/30/2023 |
$22,600 |
$30,107 |
$24,128 |
12/31/2023 |
$23,631 |
$31,543 |
$25,408 |
1/31/2024 |
$24,442 |
$32,241 |
$25,689 |
2/29/2024 |
$26,649 |
$34,460 |
$27,080 |
3/31/2024 |
$27,065 |
$35,084 |
$27,953 |
4/30/2024 |
$25,729 |
$33,538 |
$26,723 |
5/31/2024 |
$27,167 |
$35,536 |
$27,986 |
6/30/2024 |
$28,734 |
$37,819 |
$28,852 |
7/31/2024 |
$27,834 |
$37,340 |
$29,389 |
8/31/2024 |
$28,754 |
$38,060 |
$30,029 |
9/30/2024 |
$29,653 |
$39,112 |
$30,650 |
10/31/2024 |
$29,449 |
$38,964 |
$30,425 |
11/30/2024 |
$31,561 |
$41,594 |
$32,449 |
12/31/2024 |
$30,541 |
$41,781 |
$31,457 |
1/31/2025 |
$31,567 |
$42,629 |
$32,450 |
2/28/2025 |
$30,113 |
$41,037 |
$31,828 |
3/31/2025 |
$27,317 |
$37,582 |
$29,971 |
4/30/2025 |
$28,112 |
$38,185 |
$29,770 |
5/31/2025 |
$31,191 |
$41,561 |
$31,657 |
6/30/2025 |
$33,757 |
$44,243 |
$33,266 |
7/31/2025 |
$34,954 |
$45,874 |
$33,998 |
|
| Average Annual Return [Table Text Block] |
|
AVERAGE ANNUAL TOTAL RETURNS (%)
AATR |
1 Year |
5 Years |
10 Years |
Administrator Class |
25.55 |
10.52 |
13.33 |
Russell 3000® Growth Index |
22.86 |
16.73 |
16.45 |
Russell 3000® Index |
15.68 |
15.19 |
13.02 | |
| AssetsNet |
|
$ 3,582,917,430
|
| Holdings Count | Holding |
|
68
|
| Advisory Fees Paid, Amount |
|
$ 23,734,108
|
| InvestmentCompanyPortfolioTurnover |
|
73.00%
|
| Holdings [Text Block] |
|
SECTOR ALLOCATION (% OF LONG-TERM INVESTMENTS)
Information technology |
40.5 |
Consumer discretionary |
14.7 |
Communication services |
12.5 |
Financials |
12.3 |
Industrials |
9.8 |
Health care |
8.5 |
Materials |
1.7 | |
| Largest Holdings [Text Block] |
|
TOP TEN HOLDINGS (% OF NET ASSETS)
NVIDIA Corp. |
8.9 |
Microsoft Corp. |
8.9 |
Meta Platforms, Inc. Class A |
6.7 |
Amazon.com, Inc. |
4.7 |
Broadcom, Inc. |
4.3 |
Oracle Corp. |
2.2 |
Mastercard, Inc. Class A |
2.1 |
DoorDash, Inc. Class A |
1.9 |
Arista Networks, Inc. |
1.7 |
Booking Holdings, Inc. |
1.7 | |
| Material Fund Change [Text Block] |
|
|
| C000089284 |
|
|
| Shareholder Report [Line Items] |
|
|
| Fund Name |
|
Large Cap Core Fund
|
| Class Name |
|
Institutional Class
|
| Trading Symbol |
|
EGOIX
|
| Annual or Semi-Annual Statement [Text Block] |
|
This annual shareholder report contains important information about Large Cap Core Fund for the period from August 1, 2024 to July 31, 2025.
|
| Shareholder Report Annual or Semi-Annual |
|
Annual Shareholder Report
|
| Additional Information [Text Block] |
|
You can find additional information about the Fund at allspringglobal.com. You can also request this information by contacting us at 1-800-222-8222.
|
| Additional Information Phone Number |
|
<span style="white-space: nowrap; box-sizing: border-box; color: rgb(0, 0, 0); display: inline; flex-wrap: nowrap; font-size: 12px; font-weight: 400; grid-area: auto; line-height: 18px; margin: 0px; overflow: visible; text-align: left; text-align-last: auto;"> 1-800-222-8222.</span>
|
| Additional Information Website |
|
<span style="box-sizing: border-box; color: rgb(0, 0, 0); display: inline; flex-wrap: nowrap; font-size: 12px; font-weight: 400; grid-area: auto; line-height: 18px; margin: 0px; overflow: visible; text-align: left; text-align-last: auto; white-space-collapse: preserve-breaks;">allspringglobal.com</span>
|
| Expenses [Text Block] |
|
What were the Fund costs for the past year?The table explains the costs you would have paid within the reporting period based on a hypothetical $10,000 investment.
CLASS NAME |
COSTS OF A $10,000 INVESTMENT |
COSTS PAID AS A % OF A $10,000 INVESTMENT |
Institutional Class |
$74 |
0.67% | The manager has contractually committed to waive fees and/or reimburse certain expenses to the extent necessary to cap the Fund's total annual fund operating expense ratio at a specific amount. Without this cap, the costs shown above may have been higher. Please see the prospectus for the amount and the expiration date of the cap. Prior to or after the commitment expiration date, the cap may be increased or the commitment to maintain the cap may be terminated only with the approval of the Board of Trustees. |
| Expenses Paid, Amount |
|
$ 74
|
| Expense Ratio, Percent |
|
0.67%
|
| Factors Affecting Performance [Text Block] |
|
How did the Fund perform last year and what affected its performance?Over the 12-month period, the U.S. equity market performed positively. Domestic large-cap stocks outperformed domestic small-cap stocks. · Changes to the Fund’s portfolio were minimal. Characteristics that are typically favored in the portfolio include attractive valuation, earnings consistency, profitability, and improving market sentiment. · Stock selection was the main contributor to outperformance, adding value in 6 of 11 sectors. This was primarily due to positive stock selection within the financials, health care, and industrials sectors. The largest individual contributors to relative performance were Twilio, Inc.; Interactive Brokers Group, Inc.; and United Airlines Holdings, Inc. A slight underweight to consumer discretionary contributed modestly to performance. However, variations in sector weights versus the index were relatively small, which is typical for the strategy. · Negative stock selection within energy, consumer staples, and consumer discretionary detracted from relative performance. The three largest individual detractors from relative performance were Regeneron Pharmaceuticals, Inc., Lennar Corporation, and Owens Corning. |
| Line Graph [Table Text Block] |
|
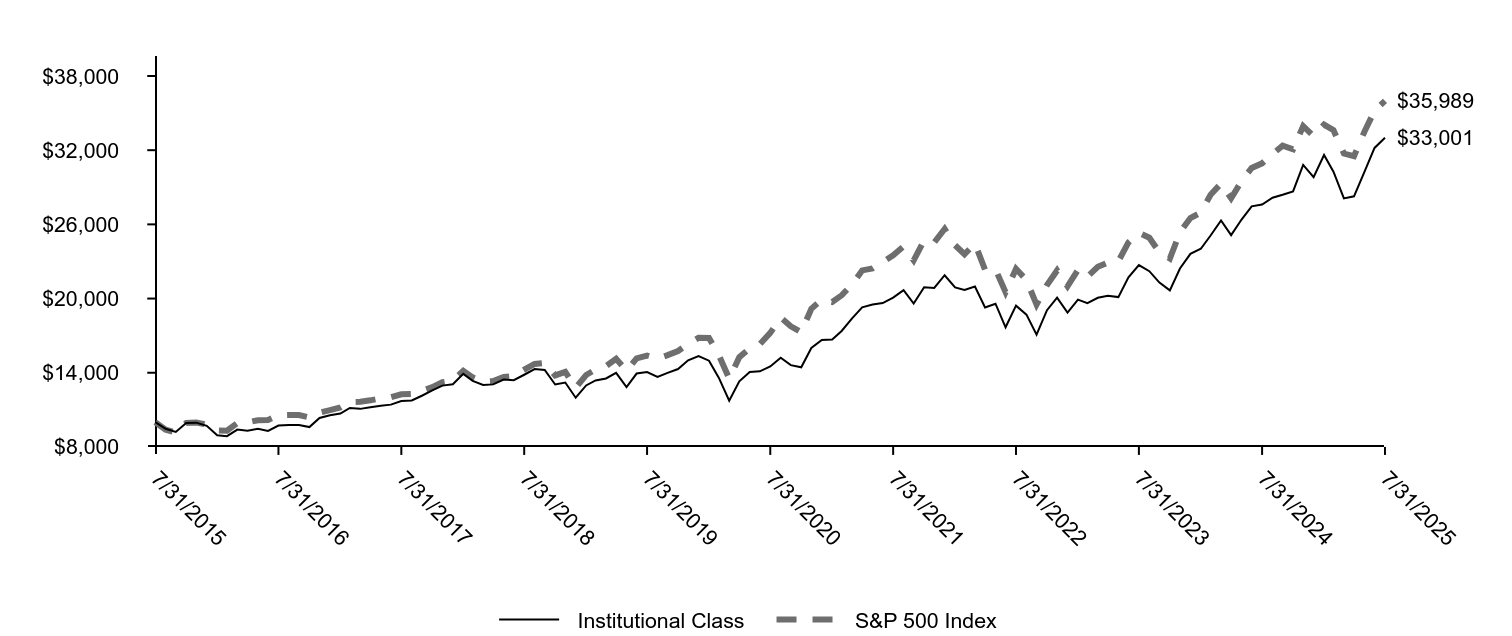
|
Institutional Class |
S&P 500 Index |
7/31/2015 |
$10,000 |
$10,000 |
8/31/2015 |
$9,466 |
$9,397 |
9/30/2015 |
$9,214 |
$9,164 |
10/31/2015 |
$9,943 |
$9,937 |
11/30/2015 |
$9,962 |
$9,967 |
12/31/2015 |
$9,705 |
$9,810 |
1/31/2016 |
$8,939 |
$9,323 |
2/29/2016 |
$8,869 |
$9,310 |
3/31/2016 |
$9,399 |
$9,942 |
4/30/2016 |
$9,316 |
$9,980 |
5/31/2016 |
$9,463 |
$10,160 |
6/30/2016 |
$9,297 |
$10,186 |
7/31/2016 |
$9,725 |
$10,561 |
8/31/2016 |
$9,769 |
$10,576 |
9/30/2016 |
$9,769 |
$10,578 |
10/31/2016 |
$9,603 |
$10,385 |
11/30/2016 |
$10,338 |
$10,770 |
12/31/2016 |
$10,561 |
$10,983 |
1/31/2017 |
$10,697 |
$11,191 |
2/28/2017 |
$11,156 |
$11,635 |
3/31/2017 |
$11,078 |
$11,649 |
4/30/2017 |
$11,214 |
$11,769 |
5/31/2017 |
$11,337 |
$11,934 |
6/30/2017 |
$11,421 |
$12,009 |
7/31/2017 |
$11,712 |
$12,256 |
8/31/2017 |
$11,757 |
$12,293 |
9/30/2017 |
$12,138 |
$12,547 |
10/31/2017 |
$12,578 |
$12,840 |
11/30/2017 |
$12,959 |
$13,233 |
12/31/2017 |
$13,072 |
$13,380 |
1/31/2018 |
$13,911 |
$14,147 |
2/28/2018 |
$13,343 |
$13,625 |
3/31/2018 |
$13,006 |
$13,279 |
4/30/2018 |
$13,059 |
$13,330 |
5/31/2018 |
$13,448 |
$13,651 |
6/30/2018 |
$13,402 |
$13,735 |
7/31/2018 |
$13,838 |
$14,246 |
8/31/2018 |
$14,294 |
$14,710 |
9/30/2018 |
$14,221 |
$14,794 |
10/31/2018 |
$13,052 |
$13,783 |
11/30/2018 |
$13,211 |
$14,064 |
12/31/2018 |
$11,980 |
$12,794 |
1/31/2019 |
$12,972 |
$13,819 |
2/28/2019 |
$13,378 |
$14,263 |
3/31/2019 |
$13,536 |
$14,540 |
4/30/2019 |
$13,994 |
$15,129 |
5/31/2019 |
$12,837 |
$14,167 |
6/30/2019 |
$13,934 |
$15,166 |
7/31/2019 |
$14,054 |
$15,384 |
8/31/2019 |
$13,656 |
$15,140 |
9/30/2019 |
$13,987 |
$15,423 |
10/31/2019 |
$14,302 |
$15,757 |
11/30/2019 |
$15,009 |
$16,329 |
12/31/2019 |
$15,350 |
$16,822 |
1/31/2020 |
$14,975 |
$16,816 |
2/29/2020 |
$13,600 |
$15,431 |
3/31/2020 |
$11,740 |
$13,525 |
4/30/2020 |
$13,307 |
$15,259 |
5/31/2020 |
$14,067 |
$15,986 |
6/30/2020 |
$14,113 |
$16,304 |
7/31/2020 |
$14,507 |
$17,223 |
8/31/2020 |
$15,213 |
$18,461 |
9/30/2020 |
$14,617 |
$17,760 |
10/31/2020 |
$14,443 |
$17,287 |
11/30/2020 |
$16,001 |
$19,180 |
12/31/2020 |
$16,655 |
$19,917 |
1/31/2021 |
$16,687 |
$19,716 |
2/28/2021 |
$17,376 |
$20,260 |
3/31/2021 |
$18,395 |
$21,147 |
4/30/2021 |
$19,286 |
$22,276 |
5/31/2021 |
$19,519 |
$22,431 |
6/30/2021 |
$19,636 |
$22,955 |
7/31/2021 |
$20,081 |
$23,500 |
8/31/2021 |
$20,686 |
$24,215 |
9/30/2021 |
$19,593 |
$23,089 |
10/31/2021 |
$20,909 |
$24,706 |
11/30/2021 |
$20,856 |
$24,535 |
12/31/2021 |
$21,887 |
$25,635 |
1/31/2022 |
$20,905 |
$24,308 |
2/28/2022 |
$20,698 |
$23,580 |
3/31/2022 |
$20,977 |
$24,456 |
4/30/2022 |
$19,279 |
$22,323 |
5/31/2022 |
$19,582 |
$22,364 |
6/30/2022 |
$17,677 |
$20,518 |
7/31/2022 |
$19,424 |
$22,410 |
8/31/2022 |
$18,697 |
$21,496 |
9/30/2022 |
$17,083 |
$19,516 |
10/31/2022 |
$19,060 |
$21,096 |
11/30/2022 |
$20,080 |
$22,275 |
12/31/2022 |
$18,865 |
$20,992 |
1/31/2023 |
$19,913 |
$22,311 |
2/28/2023 |
$19,627 |
$21,767 |
3/31/2023 |
$20,063 |
$22,566 |
4/30/2023 |
$20,227 |
$22,918 |
5/31/2023 |
$20,118 |
$23,018 |
6/30/2023 |
$21,725 |
$24,538 |
7/31/2023 |
$22,706 |
$25,327 |
8/31/2023 |
$22,215 |
$24,923 |
9/30/2023 |
$21,289 |
$23,735 |
10/31/2023 |
$20,663 |
$23,236 |
11/30/2023 |
$22,433 |
$25,358 |
12/31/2023 |
$23,614 |
$26,510 |
1/31/2024 |
$24,030 |
$26,956 |
2/29/2024 |
$25,099 |
$28,395 |
3/31/2024 |
$26,316 |
$29,309 |
4/30/2024 |
$25,128 |
$28,111 |
5/31/2024 |
$26,390 |
$29,505 |
6/30/2024 |
$27,459 |
$30,564 |
7/31/2024 |
$27,607 |
$30,936 |
8/31/2024 |
$28,156 |
$31,687 |
9/30/2024 |
$28,394 |
$32,363 |
10/31/2024 |
$28,661 |
$32,070 |
11/30/2024 |
$30,813 |
$33,952 |
12/31/2024 |
$29,823 |
$33,143 |
1/31/2025 |
$31,613 |
$34,066 |
2/28/2025 |
$30,258 |
$33,621 |
3/31/2025 |
$28,101 |
$31,727 |
4/30/2025 |
$28,268 |
$31,512 |
5/31/2025 |
$30,242 |
$33,495 |
6/30/2025 |
$32,182 |
$35,199 |
7/31/2025 |
$33,001 |
$35,989 |
|
| Average Annual Return [Table Text Block] |
|
AVERAGE ANNUAL TOTAL RETURNS (%)
AATR |
1 Year |
5 Years |
10 Years |
Institutional Class |
19.54 |
17.87 |
12.68 |
S&P 500 Index |
16.33 |
15.88 |
13.66 | |
| AssetsNet |
|
$ 592,772,427
|
| Holdings Count | Holding |
|
52
|
| Advisory Fees Paid, Amount |
|
$ 3,134,248
|
| InvestmentCompanyPortfolioTurnover |
|
41.00%
|
| Holdings [Text Block] |
|
SECTOR ALLOCATION (% OF LONG-TERM INVESTMENTS)
Information technology |
30.2 |
Industrials |
11.6 |
Financials |
11.1 |
Communication services |
10.9 |
Health care |
10.9 |
Consumer discretionary |
10.6 |
Real estate |
4.5 |
Energy |
4.1 |
Consumer staples |
3.6 |
Materials |
2.5 | |
| Largest Holdings [Text Block] |
|
TOP TEN HOLDINGS (% OF NET ASSETS)
Microsoft Corp. |
6.0 |
Broadcom, Inc. |
4.2 |
Apple, Inc. |
3.9 |
Alphabet, Inc. Class C |
3.8 |
Netflix, Inc. |
2.9 |
Amazon.com, Inc. |
2.7 |
Ulta Beauty, Inc. |
2.5 |
EMCOR Group, Inc. |
2.5 |
Interactive Brokers Group, Inc. Class A |
2.4 |
Generac Holdings, Inc. |
2.3 | |
| Material Fund Change [Text Block] |
|
|
| C000163727 |
|
|
| Shareholder Report [Line Items] |
|
|
| Fund Name |
|
Large Cap Core Fund
|
| Class Name |
|
Class R6
|
| Trading Symbol |
|
EGORX
|
| Annual or Semi-Annual Statement [Text Block] |
|
This annual shareholder report contains important information about Large Cap Core Fund for the period from August 1, 2024 to July 31, 2025.
|
| Shareholder Report Annual or Semi-Annual |
|
Annual Shareholder Report
|
| Additional Information [Text Block] |
|
You can find additional information about the Fund at allspringglobal.com. You can also request this information by contacting us at 1-800-222-8222.
|
| Additional Information Phone Number |
|
<span style="white-space: nowrap; box-sizing: border-box; color: rgb(0, 0, 0); display: inline; flex-wrap: nowrap; font-size: 12px; font-weight: 400; grid-area: auto; line-height: 18px; margin: 0px; overflow: visible; text-align: left; text-align-last: auto;"> 1-800-222-8222.</span>
|
| Additional Information Website |
|
<span style="box-sizing: border-box; color: rgb(0, 0, 0); display: inline; flex-wrap: nowrap; font-size: 12px; font-weight: 400; grid-area: auto; line-height: 18px; margin: 0px; overflow: visible; text-align: left; text-align-last: auto; white-space-collapse: preserve-breaks;">allspringglobal.com</span>
|
| Expenses [Text Block] |
|
What were the Fund costs for the past year?The table explains the costs you would have paid within the reporting period based on a hypothetical $10,000 investment.
CLASS NAME |
COSTS OF A $10,000 INVESTMENT |
COSTS PAID AS A % OF A $10,000 INVESTMENT |
Class R6 |
$71 |
0.65% | The manager has contractually committed to waive fees and/or reimburse certain expenses to the extent necessary to cap the Fund's total annual fund operating expense ratio at a specific amount. Without this cap, the costs shown above may have been higher. Please see the prospectus for the amount and the expiration date of the cap. Prior to or after the commitment expiration date, the cap may be increased or the commitment to maintain the cap may be terminated only with the approval of the Board of Trustees. |
| Expenses Paid, Amount |
|
$ 71
|
| Expense Ratio, Percent |
|
0.65%
|
| Factors Affecting Performance [Text Block] |
|
How did the Fund perform last year and what affected its performance?Over the 12-month period, the U.S. equity market performed positively. Domestic large-cap stocks outperformed domestic small-cap stocks. · Changes to the Fund’s portfolio were minimal. Characteristics that are typically favored in the portfolio include attractive valuation, earnings consistency, profitability, and improving market sentiment. · Stock selection was the main contributor to outperformance, adding value in 6 of 11 sectors. This was primarily due to positive stock selection within the financials, health care, and industrials sectors. The largest individual contributors to relative performance were Twilio, Inc.; Interactive Brokers Group, Inc.; and United Airlines Holdings, Inc. A slight underweight to consumer discretionary contributed modestly to performance. However, variations in sector weights versus the index were relatively small, which is typical for the strategy. · Negative stock selection within energy, consumer staples, and consumer discretionary detracted from relative performance. The three largest individual detractors from relative performance were Regeneron Pharmaceuticals, Inc., Lennar Corporation, and Owens Corning. |
| Line Graph [Table Text Block] |
|
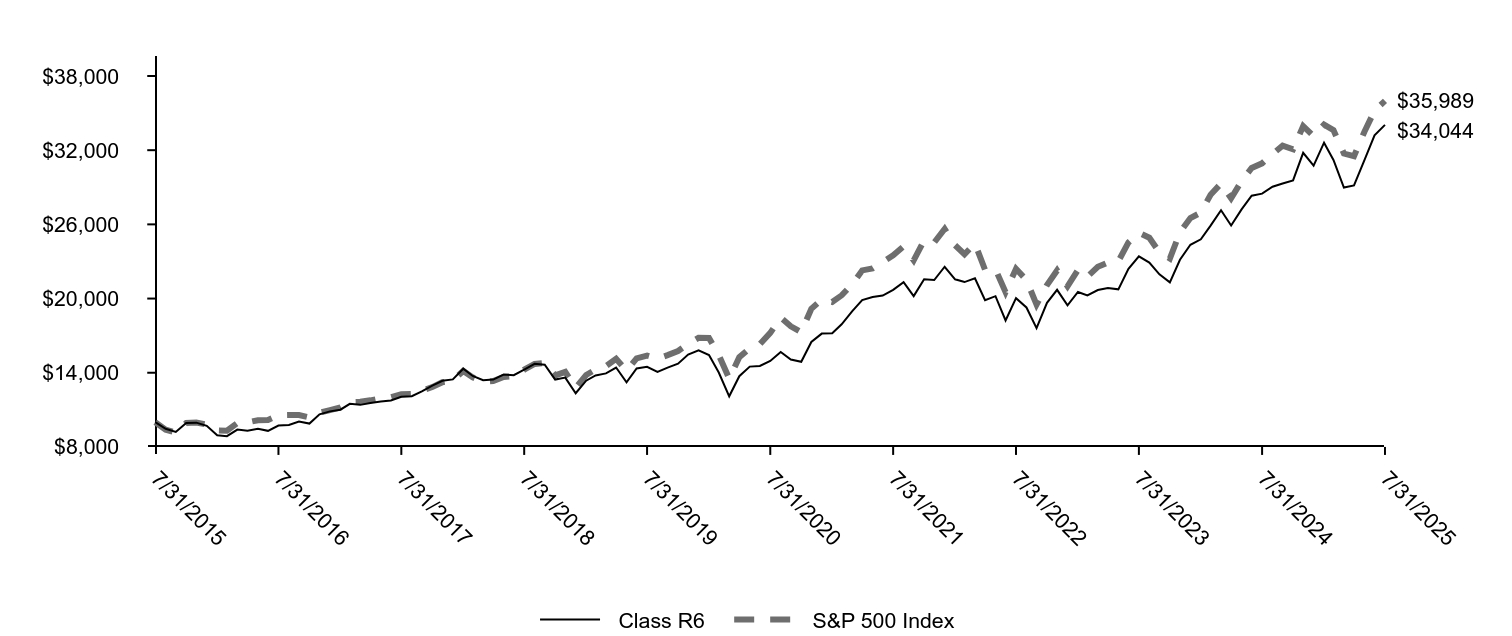
|
Class R6 |
S&P 500 Index |
7/31/2015 |
$10,000 |
$10,000 |
8/31/2015 |
$9,466 |
$9,397 |
9/30/2015 |
$9,214 |
$9,164 |
10/31/2015 |
$9,943 |
$9,937 |
11/30/2015 |
$9,962 |
$9,967 |
12/31/2015 |
$9,708 |
$9,810 |
1/31/2016 |
$8,942 |
$9,323 |
2/29/2016 |
$8,866 |
$9,310 |
3/31/2016 |
$9,402 |
$9,942 |
4/30/2016 |
$9,313 |
$9,980 |
5/31/2016 |
$9,466 |
$10,160 |
6/30/2016 |
$9,300 |
$10,186 |
7/31/2016 |
$9,727 |
$10,561 |
8/31/2016 |
$9,772 |
$10,576 |
9/30/2016 |
$10,059 |
$10,578 |
10/31/2016 |
$9,887 |
$10,385 |
11/30/2016 |
$10,640 |
$10,770 |
12/31/2016 |
$10,876 |
$10,983 |
1/31/2017 |
$11,009 |
$11,191 |
2/28/2017 |
$11,489 |
$11,635 |
3/31/2017 |
$11,402 |
$11,649 |
4/30/2017 |
$11,549 |
$11,769 |
5/31/2017 |
$11,676 |
$11,934 |
6/30/2017 |
$11,763 |
$12,009 |
7/31/2017 |
$12,063 |
$12,256 |
8/31/2017 |
$12,103 |
$12,293 |
9/30/2017 |
$12,496 |
$12,547 |
10/31/2017 |
$12,956 |
$12,840 |
11/30/2017 |
$13,350 |
$13,233 |
12/31/2017 |
$13,463 |
$13,380 |
1/31/2018 |
$14,328 |
$14,147 |
2/28/2018 |
$13,742 |
$13,625 |
3/31/2018 |
$13,395 |
$13,279 |
4/30/2018 |
$13,449 |
$13,330 |
5/31/2018 |
$13,851 |
$13,651 |
6/30/2018 |
$13,803 |
$13,735 |
7/31/2018 |
$14,253 |
$14,246 |
8/31/2018 |
$14,723 |
$14,710 |
9/30/2018 |
$14,648 |
$14,794 |
10/31/2018 |
$13,449 |
$13,783 |
11/30/2018 |
$13,606 |
$14,064 |
12/31/2018 |
$12,342 |
$12,794 |
1/31/2019 |
$13,358 |
$13,819 |
2/28/2019 |
$13,784 |
$14,263 |
3/31/2019 |
$13,947 |
$14,540 |
4/30/2019 |
$14,420 |
$15,129 |
5/31/2019 |
$13,226 |
$14,167 |
6/30/2019 |
$14,350 |
$15,166 |
7/31/2019 |
$14,482 |
$15,384 |
8/31/2019 |
$14,063 |
$15,140 |
9/30/2019 |
$14,412 |
$15,423 |
10/31/2019 |
$14,737 |
$15,757 |
11/30/2019 |
$15,466 |
$16,329 |
12/31/2019 |
$15,810 |
$16,822 |
1/31/2020 |
$15,432 |
$16,816 |
2/29/2020 |
$14,014 |
$15,431 |
3/31/2020 |
$12,094 |
$13,525 |
4/30/2020 |
$13,721 |
$15,259 |
5/31/2020 |
$14,496 |
$15,986 |
6/30/2020 |
$14,543 |
$16,304 |
7/31/2020 |
$14,950 |
$17,223 |
8/31/2020 |
$15,678 |
$18,461 |
9/30/2020 |
$15,073 |
$17,760 |
10/31/2020 |
$14,884 |
$17,287 |
11/30/2020 |
$16,491 |
$19,180 |
12/31/2020 |
$17,166 |
$19,917 |
1/31/2021 |
$17,198 |
$19,716 |
2/28/2021 |
$17,921 |
$20,260 |
3/31/2021 |
$18,961 |
$21,147 |
4/30/2021 |
$19,881 |
$22,276 |
5/31/2021 |
$20,121 |
$22,431 |
6/30/2021 |
$20,242 |
$22,955 |
7/31/2021 |
$20,702 |
$23,500 |
8/31/2021 |
$21,326 |
$24,215 |
9/30/2021 |
$20,198 |
$23,089 |
10/31/2021 |
$21,566 |
$24,706 |
11/30/2021 |
$21,501 |
$24,535 |
12/31/2021 |
$22,573 |
$25,635 |
1/31/2022 |
$21,558 |
$24,308 |
2/28/2022 |
$21,333 |
$23,580 |
3/31/2022 |
$21,633 |
$24,456 |
4/30/2022 |
$19,867 |
$22,323 |
5/31/2022 |
$20,193 |
$22,364 |
6/30/2022 |
$18,226 |
$20,518 |
7/31/2022 |
$20,030 |
$22,410 |
8/31/2022 |
$19,278 |
$21,496 |
9/30/2022 |
$17,612 |
$19,516 |
10/31/2022 |
$19,654 |
$21,096 |
11/30/2022 |
$20,706 |
$22,275 |
12/31/2022 |
$19,452 |
$20,992 |
1/31/2023 |
$20,535 |
$22,311 |
2/28/2023 |
$20,254 |
$21,767 |
3/31/2023 |
$20,690 |
$22,566 |
4/30/2023 |
$20,858 |
$22,918 |
5/31/2023 |
$20,746 |
$23,018 |
6/30/2023 |
$22,406 |
$24,538 |
7/31/2023 |
$23,418 |
$25,327 |
8/31/2023 |
$22,912 |
$24,923 |
9/30/2023 |
$21,956 |
$23,735 |
10/31/2023 |
$21,309 |
$23,236 |
11/30/2023 |
$23,137 |
$25,358 |
12/31/2023 |
$24,348 |
$26,510 |
1/31/2024 |
$24,793 |
$26,956 |
2/29/2024 |
$25,897 |
$28,395 |
3/31/2024 |
$27,139 |
$29,309 |
4/30/2024 |
$25,912 |
$28,111 |
5/31/2024 |
$27,215 |
$29,505 |
6/30/2024 |
$28,319 |
$30,564 |
7/31/2024 |
$28,488 |
$30,936 |
8/31/2024 |
$29,040 |
$31,687 |
9/30/2024 |
$29,301 |
$32,363 |
10/31/2024 |
$29,561 |
$32,070 |
11/30/2024 |
$31,784 |
$33,952 |
12/31/2024 |
$30,758 |
$33,143 |
1/31/2025 |
$32,609 |
$34,066 |
2/28/2025 |
$31,207 |
$33,621 |
3/31/2025 |
$28,976 |
$31,727 |
4/30/2025 |
$29,149 |
$31,512 |
5/31/2025 |
$31,190 |
$33,495 |
6/30/2025 |
$33,197 |
$35,199 |
7/31/2025 |
$34,044 |
$35,989 |
|
| Average Annual Return [Table Text Block] |
|
AVERAGE ANNUAL TOTAL RETURNS (%)
AATR |
1 Year |
5 Years |
10 Years |
Class R6Footnote Reference* |
19.50 |
17.89 |
13.03 |
S&P 500 Index |
16.33 |
15.88 |
13.66 |
| Footnote |
Description |
Footnote* |
Historical performance shown for the Class R6 shares prior to their inception on September 30, 2015 reflects the performance of the Institutional Class shares, and includes the higher expenses applicable to the Institutional Class shares. If these expenses had not been included, returns for the Class R6 shares would be higher. | |
| AssetsNet |
|
$ 592,772,427
|
| Holdings Count | Holding |
|
52
|
| Advisory Fees Paid, Amount |
|
$ 3,134,248
|
| InvestmentCompanyPortfolioTurnover |
|
41.00%
|
| Holdings [Text Block] |
|
SECTOR ALLOCATION (% OF LONG-TERM INVESTMENTS)
Information technology |
30.2 |
Industrials |
11.6 |
Financials |
11.1 |
Communication services |
10.9 |
Health care |
10.9 |
Consumer discretionary |
10.6 |
Real estate |
4.5 |
Energy |
4.1 |
Consumer staples |
3.6 |
Materials |
2.5 | |
| Largest Holdings [Text Block] |
|
TOP TEN HOLDINGS (% OF NET ASSETS)
Microsoft Corp. |
6.0 |
Broadcom, Inc. |
4.2 |
Apple, Inc. |
3.9 |
Alphabet, Inc. Class C |
3.8 |
Netflix, Inc. |
2.9 |
Amazon.com, Inc. |
2.7 |
Ulta Beauty, Inc. |
2.5 |
EMCOR Group, Inc. |
2.5 |
Interactive Brokers Group, Inc. Class A |
2.4 |
Generac Holdings, Inc. |
2.3 | |
| Material Fund Change [Text Block] |
|
|
| C000089282 |
|
|
| Shareholder Report [Line Items] |
|
|
| Fund Name |
|
Large Cap Core Fund
|
| Class Name |
|
Class C
|
| Trading Symbol |
|
EGOCX
|
| Annual or Semi-Annual Statement [Text Block] |
|
This annual shareholder report contains important information about Large Cap Core Fund for the period from August 1, 2024 to July 31, 2025.
|
| Shareholder Report Annual or Semi-Annual |
|
Annual Shareholder Report
|
| Additional Information [Text Block] |
|
You can find additional information about the Fund at allspringglobal.com. You can also request this information by contacting us at 1-800-222-8222.
|
| Additional Information Phone Number |
|
<span style="white-space: nowrap; box-sizing: border-box; color: rgb(0, 0, 0); display: inline; flex-wrap: nowrap; font-size: 12px; font-weight: 400; grid-area: auto; line-height: 18px; margin: 0px; overflow: visible; text-align: left; text-align-last: auto;"> 1-800-222-8222.</span>
|
| Additional Information Website |
|
<span style="box-sizing: border-box; color: rgb(0, 0, 0); display: inline; flex-wrap: nowrap; font-size: 12px; font-weight: 400; grid-area: auto; line-height: 18px; margin: 0px; overflow: visible; text-align: left; text-align-last: auto; white-space-collapse: preserve-breaks;">allspringglobal.com</span>
|
| Expenses [Text Block] |
|
What were the Fund costs for the past year?The table explains the costs you would have paid within the reporting period based on a hypothetical $10,000 investment.
CLASS NAME |
COSTS OF A $10,000 INVESTMENT |
COSTS PAID AS A % OF A $10,000 INVESTMENT |
Class C |
$198 |
1.82% | The manager has contractually committed to waive fees and/or reimburse certain expenses to the extent necessary to cap the Fund's total annual fund operating expense ratio at a specific amount. Without this cap, the costs shown above may have been higher. Please see the prospectus for the amount and the expiration date of the cap. Prior to or after the commitment expiration date, the cap may be increased or the commitment to maintain the cap may be terminated only with the approval of the Board of Trustees. |
| Expenses Paid, Amount |
|
$ 198
|
| Expense Ratio, Percent |
|
1.82%
|
| Factors Affecting Performance [Text Block] |
|
How did the Fund perform last year and what affected its performance?Over the 12-month period, the U.S. equity market performed positively. Domestic large-cap stocks outperformed domestic small-cap stocks. · Changes to the Fund’s portfolio were minimal. Characteristics that are typically favored in the portfolio include attractive valuation, earnings consistency, profitability, and improving market sentiment. · Stock selection was the main contributor to outperformance, adding value in 6 of 11 sectors. This was primarily due to positive stock selection within the financials, health care, and industrials sectors. The largest individual contributors to relative performance were Twilio, Inc.; Interactive Brokers Group, Inc.; and United Airlines Holdings, Inc. A slight underweight to consumer discretionary contributed modestly to performance. However, variations in sector weights versus the index were relatively small, which is typical for the strategy. · Negative stock selection within energy, consumer staples, and consumer discretionary detracted from relative performance. The three largest individual detractors from relative performance were Regeneron Pharmaceuticals, Inc., Lennar Corporation, and Owens Corning. |
| Line Graph [Table Text Block] |
|

|
Class C with Load |
S&P 500 Index |
7/31/2015 |
$10,000 |
$10,000 |
8/31/2015 |
$9,455 |
$9,397 |
9/30/2015 |
$9,199 |
$9,164 |
10/31/2015 |
$9,910 |
$9,937 |
11/30/2015 |
$9,923 |
$9,967 |
12/31/2015 |
$9,661 |
$9,810 |
1/31/2016 |
$8,886 |
$9,323 |
2/29/2016 |
$8,808 |
$9,310 |
3/31/2016 |
$9,325 |
$9,942 |
4/30/2016 |
$9,228 |
$9,980 |
5/31/2016 |
$9,371 |
$10,160 |
6/30/2016 |
$9,196 |
$10,186 |
7/31/2016 |
$9,610 |
$10,561 |
8/31/2016 |
$9,642 |
$10,576 |
9/30/2016 |
$9,635 |
$10,578 |
10/31/2016 |
$9,461 |
$10,385 |
11/30/2016 |
$10,172 |
$10,770 |
12/31/2016 |
$10,385 |
$10,983 |
1/31/2017 |
$10,501 |
$11,191 |
2/28/2017 |
$10,947 |
$11,635 |
3/31/2017 |
$10,857 |
$11,649 |
4/30/2017 |
$10,980 |
$11,769 |
5/31/2017 |
$11,090 |
$11,934 |
6/30/2017 |
$11,161 |
$12,009 |
7/31/2017 |
$11,439 |
$12,256 |
8/31/2017 |
$11,464 |
$12,293 |
9/30/2017 |
$11,826 |
$12,547 |
10/31/2017 |
$12,246 |
$12,840 |
11/30/2017 |
$12,608 |
$13,233 |
12/31/2017 |
$12,705 |
$13,380 |
1/31/2018 |
$13,502 |
$14,147 |
2/28/2018 |
$12,940 |
$13,625 |
3/31/2018 |
$12,600 |
$13,279 |
4/30/2018 |
$12,639 |
$13,330 |
5/31/2018 |
$12,999 |
$13,651 |
6/30/2018 |
$12,947 |
$13,735 |
7/31/2018 |
$13,358 |
$14,246 |
8/31/2018 |
$13,777 |
$14,710 |
9/30/2018 |
$13,698 |
$14,794 |
10/31/2018 |
$12,561 |
$13,783 |
11/30/2018 |
$12,698 |
$14,064 |
12/31/2018 |
$11,506 |
$12,794 |
1/31/2019 |
$12,441 |
$13,819 |
2/28/2019 |
$12,823 |
$14,263 |
3/31/2019 |
$12,963 |
$14,540 |
4/30/2019 |
$13,390 |
$15,129 |
5/31/2019 |
$12,271 |
$14,167 |
6/30/2019 |
$13,301 |
$15,166 |
7/31/2019 |
$13,404 |
$15,384 |
8/31/2019 |
$13,007 |
$15,140 |
9/30/2019 |
$13,316 |
$15,423 |
10/31/2019 |
$13,603 |
$15,757 |
11/30/2019 |
$14,258 |
$16,329 |
12/31/2019 |
$14,571 |
$16,822 |
1/31/2020 |
$14,207 |
$16,816 |
2/29/2020 |
$12,885 |
$15,431 |
3/31/2020 |
$11,110 |
$13,525 |
4/30/2020 |
$12,592 |
$15,259 |
5/31/2020 |
$13,293 |
$15,986 |
6/30/2020 |
$13,320 |
$16,304 |
7/31/2020 |
$13,674 |
$17,223 |
8/31/2020 |
$14,331 |
$18,461 |
9/30/2020 |
$13,763 |
$17,760 |
10/31/2020 |
$13,577 |
$17,287 |
11/30/2020 |
$15,032 |
$19,180 |
12/31/2020 |
$15,622 |
$19,917 |
1/31/2021 |
$15,642 |
$19,716 |
2/28/2021 |
$16,283 |
$20,260 |
3/31/2021 |
$17,220 |
$21,147 |
4/30/2021 |
$18,024 |
$22,276 |
5/31/2021 |
$18,227 |
$22,431 |
6/30/2021 |
$18,319 |
$22,955 |
7/31/2021 |
$18,716 |
$23,500 |
8/31/2021 |
$19,265 |
$24,215 |
9/30/2021 |
$18,227 |
$23,089 |
10/31/2021 |
$19,438 |
$24,706 |
11/30/2021 |
$19,367 |
$24,535 |
12/31/2021 |
$20,311 |
$25,635 |
1/31/2022 |
$19,370 |
$24,308 |
2/28/2022 |
$19,161 |
$23,580 |
3/31/2022 |
$19,405 |
$24,456 |
4/30/2022 |
$17,813 |
$22,323 |
5/31/2022 |
$18,080 |
$22,364 |
6/30/2022 |
$16,302 |
$20,518 |
7/31/2022 |
$17,894 |
$22,410 |
8/31/2022 |
$17,209 |
$21,496 |
9/30/2022 |
$15,710 |
$19,516 |
10/31/2022 |
$17,511 |
$21,096 |
11/30/2022 |
$18,429 |
$22,275 |
12/31/2022 |
$17,300 |
$20,992 |
1/31/2023 |
$18,245 |
$22,311 |
2/28/2023 |
$17,973 |
$21,767 |
3/31/2023 |
$18,335 |
$22,566 |
4/30/2023 |
$18,465 |
$22,918 |
5/31/2023 |
$18,361 |
$23,018 |
6/30/2023 |
$19,797 |
$24,538 |
7/31/2023 |
$20,677 |
$25,327 |
8/31/2023 |
$20,238 |
$24,923 |
9/30/2023 |
$19,386 |
$23,735 |
10/31/2023 |
$18,809 |
$23,236 |
11/30/2023 |
$20,414 |
$25,358 |
12/31/2023 |
$21,478 |
$26,510 |
1/31/2024 |
$21,846 |
$26,956 |
2/29/2024 |
$22,813 |
$28,395 |
3/31/2024 |
$23,903 |
$29,309 |
4/30/2024 |
$22,827 |
$28,111 |
5/31/2024 |
$23,958 |
$29,505 |
6/30/2024 |
$24,925 |
$30,564 |
7/31/2024 |
$25,062 |
$30,936 |
8/31/2024 |
$25,539 |
$31,687 |
9/30/2024 |
$25,757 |
$32,363 |
10/31/2024 |
$25,988 |
$32,070 |
11/30/2024 |
$27,924 |
$33,952 |
12/31/2024 |
$27,020 |
$33,143 |
1/31/2025 |
$28,630 |
$34,066 |
2/28/2025 |
$27,403 |
$33,621 |
3/31/2025 |
$25,440 |
$31,727 |
4/30/2025 |
$25,578 |
$31,512 |
5/31/2025 |
$27,357 |
$33,495 |
6/30/2025 |
$29,105 |
$35,199 |
7/31/2025 |
$29,841 |
$35,989 |
|
| Average Annual Return [Table Text Block] |
|
AVERAGE ANNUAL TOTAL RETURNS (%)
AATR |
1 Year |
5 Years |
10 Years |
Class C |
18.09 |
16.52 |
11.55 |
Class C with Load |
17.09 |
16.52 |
11.55 |
S&P 500 Index |
16.33 |
15.88 |
13.66 | |
| AssetsNet |
|
$ 592,772,427
|
| Holdings Count | Holding |
|
52
|
| Advisory Fees Paid, Amount |
|
$ 3,134,248
|
| InvestmentCompanyPortfolioTurnover |
|
41.00%
|
| Holdings [Text Block] |
|
SECTOR ALLOCATION (% OF LONG-TERM INVESTMENTS)
Information technology |
30.2 |
Industrials |
11.6 |
Financials |
11.1 |
Communication services |
10.9 |
Health care |
10.9 |
Consumer discretionary |
10.6 |
Real estate |
4.5 |
Energy |
4.1 |
Consumer staples |
3.6 |
Materials |
2.5 | |
| Largest Holdings [Text Block] |
|
TOP TEN HOLDINGS (% OF NET ASSETS)
Microsoft Corp. |
6.0 |
Broadcom, Inc. |
4.2 |
Apple, Inc. |
3.9 |
Alphabet, Inc. Class C |
3.8 |
Netflix, Inc. |
2.9 |
Amazon.com, Inc. |
2.7 |
Ulta Beauty, Inc. |
2.5 |
EMCOR Group, Inc. |
2.5 |
Interactive Brokers Group, Inc. Class A |
2.4 |
Generac Holdings, Inc. |
2.3 | |
| Material Fund Change [Text Block] |
|
|
| C000089281 |
|
|
| Shareholder Report [Line Items] |
|
|
| Fund Name |
|
Large Cap Core Fund
|
| Class Name |
|
Class A
|
| Trading Symbol |
|
EGOAX
|
| Annual or Semi-Annual Statement [Text Block] |
|
This annual shareholder report contains important information about Large Cap Core Fund for the period from August 1, 2024 to July 31, 2025.
|
| Shareholder Report Annual or Semi-Annual |
|
Annual Shareholder Report
|
| Additional Information [Text Block] |
|
You can find additional information about the Fund at allspringglobal.com. You can also request this information by contacting us at 1-800-222-8222.
|
| Additional Information Phone Number |
|
<span style="white-space: nowrap; box-sizing: border-box; color: rgb(0, 0, 0); display: inline; flex-wrap: nowrap; font-size: 12px; font-weight: 400; grid-area: auto; line-height: 18px; margin: 0px; overflow: visible; text-align: left; text-align-last: auto;"> 1-800-222-8222.</span>
|
| Additional Information Website |
|
<span style="box-sizing: border-box; color: rgb(0, 0, 0); display: inline; flex-wrap: nowrap; font-size: 12px; font-weight: 400; grid-area: auto; line-height: 18px; margin: 0px; overflow: visible; text-align: left; text-align-last: auto; white-space-collapse: preserve-breaks;">allspringglobal.com</span>
|
| Expenses [Text Block] |
|
What were the Fund costs for the past year?The table explains the costs you would have paid within the reporting period based on a hypothetical $10,000 investment.
CLASS NAME |
COSTS OF A $10,000 INVESTMENT |
COSTS PAID AS A % OF A $10,000 INVESTMENT |
Class A |
$113 |
1.03% | The manager has contractually committed to waive fees and/or reimburse certain expenses to the extent necessary to cap the Fund's total annual fund operating expense ratio at a specific amount. Without this cap, the costs shown above may have been higher. Please see the prospectus for the amount and the expiration date of the cap. Prior to or after the commitment expiration date, the cap may be increased or the commitment to maintain the cap may be terminated only with the approval of the Board of Trustees. |
| Expenses Paid, Amount |
|
$ 113
|
| Expense Ratio, Percent |
|
1.03%
|
| Factors Affecting Performance [Text Block] |
|
How did the Fund perform last year and what affected its performance?Over the 12-month period, the U.S. equity market performed positively. Domestic large-cap stocks outperformed domestic small-cap stocks. · Changes to the Fund’s portfolio were minimal. Characteristics that are typically favored in the portfolio include attractive valuation, earnings consistency, profitability, and improving market sentiment. · Stock selection was the main contributor to outperformance, adding value in 6 of 11 sectors. This was primarily due to positive stock selection within the financials, health care, and industrials sectors. The largest individual contributors to relative performance were Twilio, Inc.; Interactive Brokers Group, Inc.; and United Airlines Holdings, Inc. A slight underweight to consumer discretionary contributed modestly to performance. However, variations in sector weights versus the index were relatively small, which is typical for the strategy. · Negative stock selection within energy, consumer staples, and consumer discretionary detracted from relative performance. The three largest individual detractors from relative performance were Regeneron Pharmaceuticals, Inc., Lennar Corporation, and Owens Corning. |
| Line Graph [Table Text Block] |
|
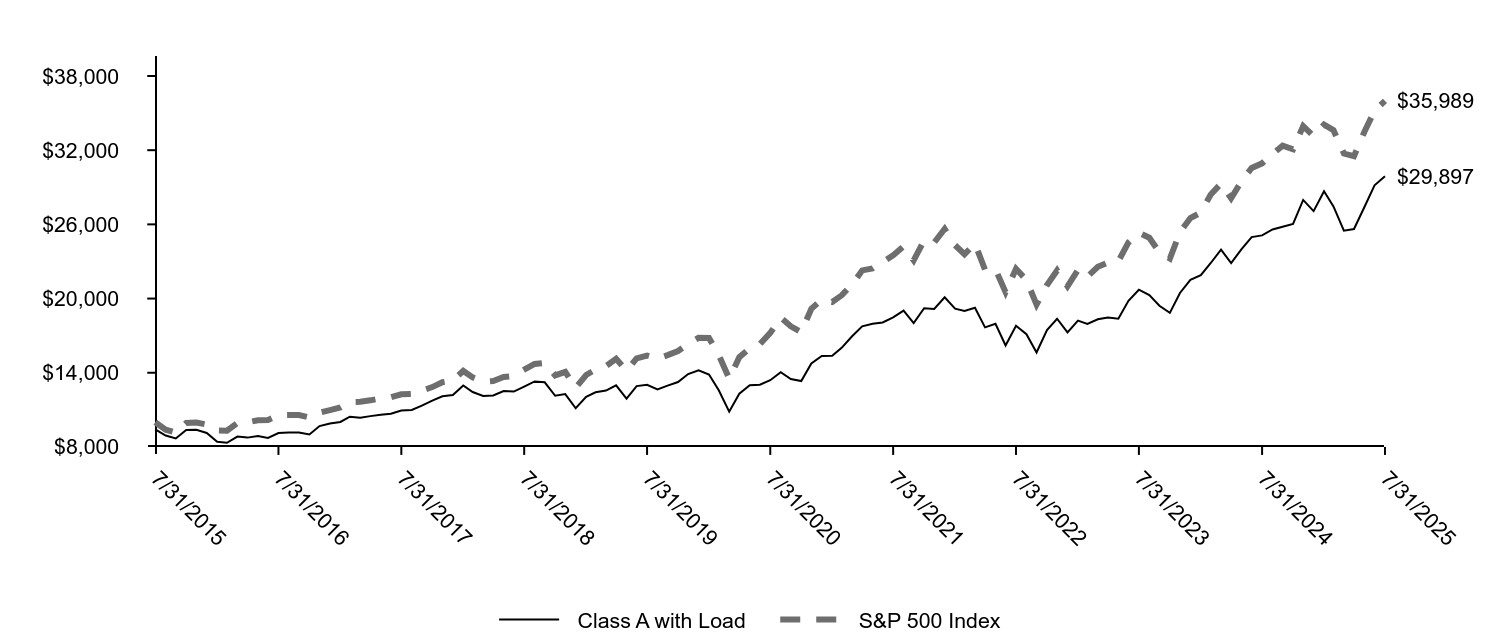
|
Class A with Load |
S&P 500 Index |
7/31/2015 |
$9,428 |
$10,000 |
8/31/2015 |
$8,921 |
$9,397 |
9/30/2015 |
$8,682 |
$9,164 |
10/31/2015 |
$9,362 |
$9,937 |
11/30/2015 |
$9,380 |
$9,967 |
12/31/2015 |
$9,133 |
$9,810 |
1/31/2016 |
$8,409 |
$9,323 |
2/29/2016 |
$8,337 |
$9,310 |
3/31/2016 |
$8,838 |
$9,942 |
4/30/2016 |
$8,753 |
$9,980 |
5/31/2016 |
$8,892 |
$10,160 |
6/30/2016 |
$8,729 |
$10,186 |
7/31/2016 |
$9,127 |
$10,561 |
8/31/2016 |
$9,164 |
$10,576 |
9/30/2016 |
$9,164 |
$10,578 |
10/31/2016 |
$9,001 |
$10,385 |
11/30/2016 |
$9,688 |
$10,770 |
12/31/2016 |
$9,896 |
$10,983 |
1/31/2017 |
$10,017 |
$11,191 |
2/28/2017 |
$10,443 |
$11,635 |
3/31/2017 |
$10,364 |
$11,649 |
4/30/2017 |
$10,491 |
$11,769 |
5/31/2017 |
$10,601 |
$11,934 |
6/30/2017 |
$10,680 |
$12,009 |
7/31/2017 |
$10,947 |
$12,256 |
8/31/2017 |
$10,984 |
$12,293 |
9/30/2017 |
$11,336 |
$12,547 |
10/31/2017 |
$11,744 |
$12,840 |
11/30/2017 |
$12,096 |
$13,233 |
12/31/2017 |
$12,194 |
$13,380 |
1/31/2018 |
$12,973 |
$14,147 |
2/28/2018 |
$12,441 |
$13,625 |
3/31/2018 |
$12,120 |
$13,279 |
4/30/2018 |
$12,163 |
$13,330 |
5/31/2018 |
$12,522 |
$13,651 |
6/30/2018 |
$12,478 |
$13,735 |
7/31/2018 |
$12,881 |
$14,246 |
8/31/2018 |
$13,295 |
$14,710 |
9/30/2018 |
$13,227 |
$14,794 |
10/31/2018 |
$12,138 |
$13,783 |
11/30/2018 |
$12,274 |
$14,064 |
12/31/2018 |
$11,129 |
$12,794 |
1/31/2019 |
$12,048 |
$13,819 |
2/28/2019 |
$12,420 |
$14,263 |
3/31/2019 |
$12,560 |
$14,540 |
4/30/2019 |
$12,981 |
$15,129 |
5/31/2019 |
$11,908 |
$14,167 |
6/30/2019 |
$12,918 |
$15,166 |
7/31/2019 |
$13,023 |
$15,384 |
8/31/2019 |
$12,651 |
$15,140 |
9/30/2019 |
$12,953 |
$15,423 |
10/31/2019 |
$13,247 |
$15,757 |
11/30/2019 |
$13,892 |
$16,329 |
12/31/2019 |
$14,205 |
$16,822 |
1/31/2020 |
$13,855 |
$16,816 |
2/29/2020 |
$12,576 |
$15,431 |
3/31/2020 |
$10,854 |
$13,525 |
4/30/2020 |
$12,303 |
$15,259 |
5/31/2020 |
$12,994 |
$15,986 |
6/30/2020 |
$13,037 |
$16,304 |
7/31/2020 |
$13,395 |
$17,223 |
8/31/2020 |
$14,043 |
$18,461 |
9/30/2020 |
$13,489 |
$17,760 |
10/31/2020 |
$13,327 |
$17,287 |
11/30/2020 |
$14,750 |
$19,180 |
12/31/2020 |
$15,352 |
$19,917 |
1/31/2021 |
$15,381 |
$19,716 |
2/28/2021 |
$16,011 |
$20,260 |
3/31/2021 |
$16,946 |
$21,147 |
4/30/2021 |
$17,753 |
$22,276 |
5/31/2021 |
$17,969 |
$22,431 |
6/30/2021 |
$18,068 |
$22,955 |
7/31/2021 |
$18,471 |
$23,500 |
8/31/2021 |
$19,022 |
$24,215 |
9/30/2021 |
$18,009 |
$23,089 |
10/31/2021 |
$19,219 |
$24,706 |
11/30/2021 |
$19,160 |
$24,535 |
12/31/2021 |
$20,108 |
$25,635 |
1/31/2022 |
$19,187 |
$24,308 |
2/28/2022 |
$18,996 |
$23,580 |
3/31/2022 |
$19,254 |
$24,456 |
4/30/2022 |
$17,671 |
$22,323 |
5/31/2022 |
$17,963 |
$22,364 |
6/30/2022 |
$16,201 |
$20,518 |
7/31/2022 |
$17,795 |
$22,410 |
8/31/2022 |
$17,121 |
$21,496 |
9/30/2022 |
$15,639 |
$19,516 |
10/31/2022 |
$17,447 |
$21,096 |
11/30/2022 |
$18,368 |
$22,275 |
12/31/2022 |
$17,261 |
$20,992 |
1/31/2023 |
$18,216 |
$22,311 |
2/28/2023 |
$17,952 |
$21,767 |
3/31/2023 |
$18,329 |
$22,566 |
4/30/2023 |
$18,467 |
$22,918 |
5/31/2023 |
$18,367 |
$23,018 |
6/30/2023 |
$19,824 |
$24,538 |
7/31/2023 |
$20,716 |
$25,327 |
8/31/2023 |
$20,276 |
$24,923 |
9/30/2023 |
$19,422 |
$23,735 |
10/31/2023 |
$18,844 |
$23,236 |
11/30/2023 |
$20,452 |
$25,358 |
12/31/2023 |
$21,518 |
$26,510 |
1/31/2024 |
$21,886 |
$26,956 |
2/29/2024 |
$22,856 |
$28,395 |
3/31/2024 |
$23,948 |
$29,309 |
4/30/2024 |
$22,869 |
$28,111 |
5/31/2024 |
$24,002 |
$29,505 |
6/30/2024 |
$24,972 |
$30,564 |
7/31/2024 |
$25,108 |
$30,936 |
8/31/2024 |
$25,586 |
$31,687 |
9/30/2024 |
$25,805 |
$32,363 |
10/31/2024 |
$26,037 |
$32,070 |
11/30/2024 |
$27,976 |
$33,952 |
12/31/2024 |
$27,070 |
$33,143 |
1/31/2025 |
$28,683 |
$34,066 |
2/28/2025 |
$27,454 |
$33,621 |
3/31/2025 |
$25,488 |
$31,727 |
4/30/2025 |
$25,626 |
$31,512 |
5/31/2025 |
$27,408 |
$33,495 |
6/30/2025 |
$29,159 |
$35,199 |
7/31/2025 |
$29,897 |
$35,989 |
|
| Average Annual Return [Table Text Block] |
|
AVERAGE ANNUAL TOTAL RETURNS (%)
AATR |
1 Year |
5 Years |
10 Years |
Class A |
19.07 |
17.42 |
12.23 |
Class A with Load |
12.24 |
16.03 |
11.57 |
S&P 500 Index |
16.33 |
15.88 |
13.66 | |
| AssetsNet |
|
$ 592,772,427
|
| Holdings Count | Holding |
|
52
|
| Advisory Fees Paid, Amount |
|
$ 3,134,248
|
| InvestmentCompanyPortfolioTurnover |
|
41.00%
|
| Holdings [Text Block] |
|
SECTOR ALLOCATION (% OF LONG-TERM INVESTMENTS)
Information technology |
30.2 |
Industrials |
11.6 |
Financials |
11.1 |
Communication services |
10.9 |
Health care |
10.9 |
Consumer discretionary |
10.6 |
Real estate |
4.5 |
Energy |
4.1 |
Consumer staples |
3.6 |
Materials |
2.5 | |
| Largest Holdings [Text Block] |
|
TOP TEN HOLDINGS (% OF NET ASSETS)
Microsoft Corp. |
6.0 |
Broadcom, Inc. |
4.2 |
Apple, Inc. |
3.9 |
Alphabet, Inc. Class C |
3.8 |
Netflix, Inc. |
2.9 |
Amazon.com, Inc. |
2.7 |
Ulta Beauty, Inc. |
2.5 |
EMCOR Group, Inc. |
2.5 |
Interactive Brokers Group, Inc. Class A |
2.4 |
Generac Holdings, Inc. |
2.3 | |
| Material Fund Change [Text Block] |
|
|
| C000089285 |
|
|
| Shareholder Report [Line Items] |
|
|
| Fund Name |
|
Large Cap Core Fund
|
| Class Name |
|
Administrator Class
|
| Trading Symbol |
|
WFLLX
|
| Annual or Semi-Annual Statement [Text Block] |
|
This annual shareholder report contains important information about Large Cap Core Fund for the period from August 1, 2024 to July 31, 2025.
|
| Shareholder Report Annual or Semi-Annual |
|
Annual Shareholder Report
|
| Additional Information [Text Block] |
|
You can find additional information about the Fund at allspringglobal.com. You can also request this information by contacting us at 1-800-222-8222.
|
| Material Fund Change Notice [Text Block] |
|
This report describes changes to the Fund that occurred either during or after the reporting period.
|
| Additional Information Phone Number |
|
<span style="white-space: nowrap; box-sizing: border-box; color: rgb(0, 0, 0); display: inline; flex-wrap: nowrap; font-size: 12px; font-weight: 400; grid-area: auto; line-height: 18px; margin: 0px; overflow: visible; text-align: left; text-align-last: auto;"> 1-800-222-8222.</span>
|
| Additional Information Website |
|
<span style="box-sizing: border-box; color: rgb(0, 0, 0); display: inline; flex-wrap: nowrap; font-size: 12px; font-weight: 400; grid-area: auto; line-height: 18px; margin: 0px; overflow: visible; text-align: left; text-align-last: auto; white-space-collapse: preserve-breaks;">allspringglobal.com</span>
|
| Expenses [Text Block] |
|
What were the Fund costs for the past year?The table explains the costs you would have paid within the reporting period based on a hypothetical $10,000 investment.
CLASS NAME |
COSTS OF A $10,000 INVESTMENT |
COSTS PAID AS A % OF A $10,000 INVESTMENT |
Administrator Class |
$106 |
0.97% | The manager has contractually committed to waive fees and/or reimburse certain expenses to the extent necessary to cap the Fund's total annual fund operating expense ratio at a specific amount. Without this cap, the costs shown above may have been higher. Please see the prospectus for the amount and the expiration date of the cap. Prior to or after the commitment expiration date, the cap may be increased or the commitment to maintain the cap may be terminated only with the approval of the Board of Trustees. |
| Expenses Paid, Amount |
|
$ 106
|
| Expense Ratio, Percent |
|
0.97%
|
| Factors Affecting Performance [Text Block] |
|
How did the Fund perform last year and what affected its performance?Over the 12-month period, the U.S. equity market performed positively. Domestic large-cap stocks outperformed domestic small-cap stocks. · Changes to the Fund’s portfolio were minimal. Characteristics that are typically favored in the portfolio include attractive valuation, earnings consistency, profitability, and improving market sentiment. · Stock selection was the main contributor to outperformance, adding value in 6 of 11 sectors. This was primarily due to positive stock selection within the financials, health care, and industrials sectors. The largest individual contributors to relative performance were Twilio, Inc.; Interactive Brokers Group, Inc.; and United Airlines Holdings, Inc. A slight underweight to consumer discretionary contributed modestly to performance. However, variations in sector weights versus the index were relatively small, which is typical for the strategy. · Negative stock selection within energy, consumer staples, and consumer discretionary detracted from relative performance. The three largest individual detractors from relative performance were Regeneron Pharmaceuticals, Inc., Lennar Corporation, and Owens Corning. |
| Line Graph [Table Text Block] |
|
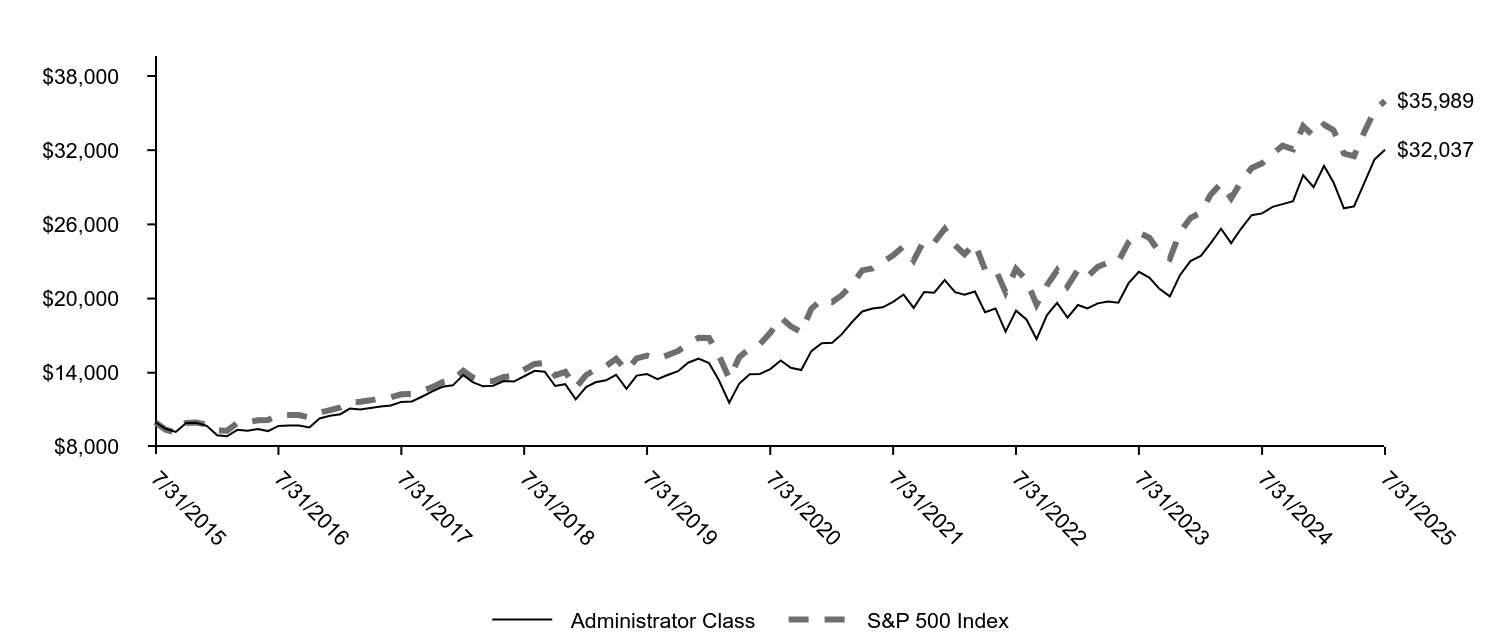
|
Administrator Class |
S&P 500 Index |
7/31/2015 |
$10,000 |
$10,000 |
8/31/2015 |
$9,464 |
$9,397 |
9/30/2015 |
$9,212 |
$9,164 |
10/31/2015 |
$9,937 |
$9,937 |
11/30/2015 |
$9,956 |
$9,967 |
12/31/2015 |
$9,702 |
$9,810 |
1/31/2016 |
$8,935 |
$9,323 |
2/29/2016 |
$8,859 |
$9,310 |
3/31/2016 |
$9,383 |
$9,942 |
4/30/2016 |
$9,300 |
$9,980 |
5/31/2016 |
$9,447 |
$10,160 |
6/30/2016 |
$9,280 |
$10,186 |
7/31/2016 |
$9,702 |
$10,561 |
8/31/2016 |
$9,741 |
$10,576 |
9/30/2016 |
$9,741 |
$10,578 |
10/31/2016 |
$9,568 |
$10,385 |
11/30/2016 |
$10,297 |
$10,770 |
12/31/2016 |
$10,517 |
$10,983 |
1/31/2017 |
$10,645 |
$11,191 |
2/28/2017 |
$11,105 |
$11,635 |
3/31/2017 |
$11,022 |
$11,649 |
4/30/2017 |
$11,156 |
$11,769 |
5/31/2017 |
$11,271 |
$11,934 |
6/30/2017 |
$11,354 |
$12,009 |
7/31/2017 |
$11,642 |
$12,256 |
8/31/2017 |
$11,680 |
$12,293 |
9/30/2017 |
$12,057 |
$12,547 |
10/31/2017 |
$12,492 |
$12,840 |
11/30/2017 |
$12,869 |
$13,233 |
12/31/2017 |
$12,979 |
$13,380 |
1/31/2018 |
$13,806 |
$14,147 |
2/28/2018 |
$13,240 |
$13,625 |
3/31/2018 |
$12,901 |
$13,279 |
4/30/2018 |
$12,946 |
$13,330 |
5/31/2018 |
$13,331 |
$13,651 |
6/30/2018 |
$13,285 |
$13,735 |
7/31/2018 |
$13,715 |
$14,246 |
8/31/2018 |
$14,158 |
$14,710 |
9/30/2018 |
$14,087 |
$14,794 |
10/31/2018 |
$12,927 |
$13,783 |
11/30/2018 |
$13,077 |
$14,064 |
12/31/2018 |
$11,851 |
$12,794 |
1/31/2019 |
$12,833 |
$13,819 |
2/28/2019 |
$13,231 |
$14,263 |
3/31/2019 |
$13,386 |
$14,540 |
4/30/2019 |
$13,836 |
$15,129 |
5/31/2019 |
$12,693 |
$14,167 |
6/30/2019 |
$13,770 |
$15,166 |
7/31/2019 |
$13,888 |
$15,384 |
8/31/2019 |
$13,482 |
$15,140 |
9/30/2019 |
$13,814 |
$15,423 |
10/31/2019 |
$14,124 |
$15,757 |
11/30/2019 |
$14,811 |
$16,329 |
12/31/2019 |
$15,142 |
$16,822 |
1/31/2020 |
$14,784 |
$16,816 |
2/29/2020 |
$13,414 |
$15,431 |
3/31/2020 |
$11,578 |
$13,525 |
4/30/2020 |
$13,127 |
$15,259 |
5/31/2020 |
$13,870 |
$15,986 |
6/30/2020 |
$13,906 |
$16,304 |
7/31/2020 |
$14,291 |
$17,223 |
8/31/2020 |
$14,990 |
$18,461 |
9/30/2020 |
$14,399 |
$17,760 |
10/31/2020 |
$14,220 |
$17,287 |
11/30/2020 |
$15,751 |
$19,180 |
12/31/2020 |
$16,392 |
$19,917 |
1/31/2021 |
$16,423 |
$19,716 |
2/28/2021 |
$17,102 |
$20,260 |
3/31/2021 |
$18,101 |
$21,147 |
4/30/2021 |
$18,956 |
$22,276 |
5/31/2021 |
$19,192 |
$22,431 |
6/30/2021 |
$19,295 |
$22,955 |
7/31/2021 |
$19,728 |
$23,500 |
8/31/2021 |
$20,325 |
$24,215 |
9/30/2021 |
$19,244 |
$23,089 |
10/31/2021 |
$20,531 |
$24,706 |
11/30/2021 |
$20,469 |
$24,535 |
12/31/2021 |
$21,487 |
$25,635 |
1/31/2022 |
$20,514 |
$24,308 |
2/28/2022 |
$20,302 |
$23,580 |
3/31/2022 |
$20,572 |
$24,456 |
4/30/2022 |
$18,895 |
$22,323 |
5/31/2022 |
$19,200 |
$22,364 |
6/30/2022 |
$17,323 |
$20,518 |
7/31/2022 |
$19,024 |
$22,410 |
8/31/2022 |
$18,309 |
$21,496 |
9/30/2022 |
$16,725 |
$19,516 |
10/31/2022 |
$18,660 |
$21,096 |
11/30/2022 |
$19,646 |
$22,275 |
12/31/2022 |
$18,456 |
$20,992 |
1/31/2023 |
$19,479 |
$22,311 |
2/28/2023 |
$19,203 |
$21,767 |
3/31/2023 |
$19,610 |
$22,566 |
4/30/2023 |
$19,767 |
$22,918 |
5/31/2023 |
$19,662 |
$23,018 |
6/30/2023 |
$21,222 |
$24,538 |
7/31/2023 |
$22,166 |
$25,327 |
8/31/2023 |
$21,694 |
$24,923 |
9/30/2023 |
$20,789 |
$23,735 |
10/31/2023 |
$20,173 |
$23,236 |
11/30/2023 |
$21,891 |
$25,358 |
12/31/2023 |
$23,031 |
$26,510 |
1/31/2024 |
$23,443 |
$26,956 |
2/29/2024 |
$24,468 |
$28,395 |
3/31/2024 |
$25,648 |
$29,309 |
4/30/2024 |
$24,482 |
$28,111 |
5/31/2024 |
$25,705 |
$29,505 |
6/30/2024 |
$26,744 |
$30,564 |
7/31/2024 |
$26,886 |
$30,936 |
8/31/2024 |
$27,412 |
$31,687 |
9/30/2024 |
$27,640 |
$32,363 |
10/31/2024 |
$27,882 |
$32,070 |
11/30/2024 |
$29,973 |
$33,952 |
12/31/2024 |
$29,004 |
$33,143 |
1/31/2025 |
$30,728 |
$34,066 |
2/28/2025 |
$29,403 |
$33,621 |
3/31/2025 |
$27,296 |
$31,727 |
4/30/2025 |
$27,456 |
$31,512 |
5/31/2025 |
$29,371 |
$33,495 |
6/30/2025 |
$31,255 |
$35,199 |
7/31/2025 |
$32,037 |
$35,989 |
|
| Average Annual Return [Table Text Block] |
|
AVERAGE ANNUAL TOTAL RETURNS (%)
AATR |
1 Year |
5 Years |
10 Years |
Administrator Class |
19.16 |
17.52 |
12.35 |
S&P 500 Index |
16.33 |
15.88 |
13.66 | |
| Material Change Date |
Aug. 01, 2024
|
|
| AssetsNet |
|
$ 592,772,427
|
| Holdings Count | Holding |
|
52
|
| Advisory Fees Paid, Amount |
|
$ 3,134,248
|
| InvestmentCompanyPortfolioTurnover |
|
41.00%
|
| Holdings [Text Block] |
|
SECTOR ALLOCATION (% OF LONG-TERM INVESTMENTS)
Information technology |
30.2 |
Industrials |
11.6 |
Financials |
11.1 |
Communication services |
10.9 |
Health care |
10.9 |
Consumer discretionary |
10.6 |
Real estate |
4.5 |
Energy |
4.1 |
Consumer staples |
3.6 |
Materials |
2.5 | |
| Largest Holdings [Text Block] |
|
TOP TEN HOLDINGS (% OF NET ASSETS)
Microsoft Corp. |
6.0 |
Broadcom, Inc. |
4.2 |
Apple, Inc. |
3.9 |
Alphabet, Inc. Class C |
3.8 |
Netflix, Inc. |
2.9 |
Amazon.com, Inc. |
2.7 |
Ulta Beauty, Inc. |
2.5 |
EMCOR Group, Inc. |
2.5 |
Interactive Brokers Group, Inc. Class A |
2.4 |
Generac Holdings, Inc. |
2.3 | |
| Material Fund Change [Text Block] |
|
This is a summary of certain changes and planned changes to the Fund since August 1, 2024. At a meeting held on May 27-29, 2025, the Board of Trustees of the Fund approved the conversion of the Fund’s Administrator Class shares into Institutional Class shares effective on or about the close of business on September 12, 2025. |
| Summary of Change Legend [Text Block] |
|
This is a summary of certain changes and planned changes to the Fund since August 1, 2024.
|
| C000092779 |
|
|
| Shareholder Report [Line Items] |
|
|
| Fund Name |
|
Large Cap Growth Fund
|
| Class Name |
|
Institutional Class
|
| Trading Symbol |
|
STNFX
|
| Annual or Semi-Annual Statement [Text Block] |
|
This annual shareholder report contains important information about Large Cap Growth Fund for the period from August 1, 2024 to July 31, 2025.
|
| Shareholder Report Annual or Semi-Annual |
|
Annual Shareholder Report
|
| Additional Information [Text Block] |
|
You can find additional information about the Fund at allspringglobal.com. You can also request this information by contacting us at 1-800-222-8222.
|
| Additional Information Phone Number |
|
<span style="white-space: nowrap; box-sizing: border-box; color: rgb(0, 0, 0); display: inline; flex-wrap: nowrap; font-size: 12px; font-weight: 400; grid-area: auto; line-height: 18px; margin: 0px; overflow: visible; text-align: left; text-align-last: auto;"> 1-800-222-8222.</span>
|
| Additional Information Website |
|
<span style="box-sizing: border-box; color: rgb(0, 0, 0); display: inline; flex-wrap: nowrap; font-size: 12px; font-weight: 400; grid-area: auto; line-height: 18px; margin: 0px; overflow: visible; text-align: left; text-align-last: auto; white-space-collapse: preserve-breaks;">allspringglobal.com</span>
|
| Expenses [Text Block] |
|
What were the Fund costs for the past year?The table explains the costs you would have paid within the reporting period based on a hypothetical $10,000 investment.
CLASS NAME |
COSTS OF A $10,000 INVESTMENT |
COSTS PAID AS A % OF A $10,000 INVESTMENT |
Institutional Class |
$79 |
0.70% | The manager has contractually committed to waive fees and/or reimburse certain expenses to the extent necessary to cap the Fund's total annual fund operating expense ratio at a specific amount. Without this cap, the costs shown above may have been higher. Please see the prospectus for the amount and the expiration date of the cap. Prior to or after the commitment expiration date, the cap may be increased or the commitment to maintain the cap may be terminated only with the approval of the Board of Trustees. |
| Expenses Paid, Amount |
|
$ 79
|
| Expense Ratio, Percent |
|
0.70%
|
| Factors Affecting Performance [Text Block] |
|
How did the Fund perform last year and what affected its performance?The market environment for the 12-month period that ended July 31, 2025, was bifurcated for U.S. equities. During the first half of the period, the economy was generally healthy, with moderating inflation, resilient consumer spending, and favorable earnings growth. In early 2025, the new U.S. administration took office and implemented policies on government spending, immigration, and tariffs. Financial market sentiment grew concerned and volatility spiked until the administration temporarily paused tariffs. With uncertainty easing, overall corporate earnings generally exceeded expectations and propelled growth indexes upward. Artificial intelligence (AI) was a key driver as leading technology firms ramped up capital expenditures on AI infrastructure. The portfolio benefited from security selection within communication services and consumer discretionary, where holdings with innovative services and strong demand, such as Meta Platforms, Inc. and DoorDash, Inc. contributed. In contrast, relative underweights to select mega-cap technology companies, including NVIDIA Corp. and Broadcom, Inc. detracted from returns. |
| Line Graph [Table Text Block] |
|

|
Institutional Class |
Russell 1000® Growth Index |
Russell 3000® Index |
7/31/2015 |
$10,000 |
$10,000 |
$10,000 |
8/31/2015 |
$9,392 |
$9,393 |
$9,396 |
9/30/2015 |
$9,171 |
$9,160 |
$9,122 |
10/31/2015 |
$9,958 |
$9,949 |
$9,843 |
11/30/2015 |
$9,972 |
$9,977 |
$9,898 |
12/31/2015 |
$9,771 |
$9,831 |
$9,694 |
1/31/2016 |
$8,989 |
$9,282 |
$9,147 |
2/29/2016 |
$8,886 |
$9,278 |
$9,144 |
3/31/2016 |
$9,384 |
$9,904 |
$9,788 |
4/30/2016 |
$9,386 |
$9,813 |
$9,849 |
5/31/2016 |
$9,563 |
$10,004 |
$10,025 |
6/30/2016 |
$9,318 |
$9,964 |
$10,046 |
7/31/2016 |
$9,851 |
$10,435 |
$10,444 |
8/31/2016 |
$9,799 |
$10,383 |
$10,471 |
9/30/2016 |
$9,797 |
$10,421 |
$10,488 |
10/31/2016 |
$9,552 |
$10,176 |
$10,261 |
11/30/2016 |
$9,630 |
$10,398 |
$10,720 |
12/31/2016 |
$9,559 |
$10,526 |
$10,929 |
1/31/2017 |
$9,992 |
$10,881 |
$11,135 |
2/28/2017 |
$10,354 |
$11,333 |
$11,549 |
3/31/2017 |
$10,479 |
$11,464 |
$11,557 |
4/30/2017 |
$10,783 |
$11,726 |
$11,679 |
5/31/2017 |
$11,132 |
$12,031 |
$11,799 |
6/30/2017 |
$11,003 |
$11,999 |
$11,905 |
7/31/2017 |
$11,327 |
$12,318 |
$12,130 |
8/31/2017 |
$11,512 |
$12,544 |
$12,153 |
9/30/2017 |
$11,754 |
$12,707 |
$12,449 |
10/31/2017 |
$12,260 |
$13,200 |
$12,721 |
11/30/2017 |
$12,620 |
$13,601 |
$13,107 |
12/31/2017 |
$12,746 |
$13,707 |
$13,238 |
1/31/2018 |
$13,917 |
$14,677 |
$13,936 |
2/28/2018 |
$13,704 |
$14,292 |
$13,423 |
3/31/2018 |
$13,360 |
$13,901 |
$13,153 |
4/30/2018 |
$13,426 |
$13,949 |
$13,203 |
5/31/2018 |
$14,105 |
$14,561 |
$13,576 |
6/30/2018 |
$14,176 |
$14,701 |
$13,665 |
7/31/2018 |
$14,541 |
$15,132 |
$14,118 |
8/31/2018 |
$15,196 |
$15,960 |
$14,614 |
9/30/2018 |
$15,381 |
$16,049 |
$14,638 |
10/31/2018 |
$13,797 |
$14,614 |
$13,560 |
11/30/2018 |
$14,017 |
$14,769 |
$13,832 |
12/31/2018 |
$12,866 |
$13,499 |
$12,544 |
1/31/2019 |
$14,117 |
$14,712 |
$13,621 |
2/28/2019 |
$14,753 |
$15,239 |
$14,100 |
3/31/2019 |
$15,124 |
$15,673 |
$14,306 |
4/30/2019 |
$16,014 |
$16,381 |
$14,877 |
5/31/2019 |
$15,071 |
$15,346 |
$13,915 |
6/30/2019 |
$15,958 |
$16,400 |
$14,892 |
7/31/2019 |
$16,194 |
$16,770 |
$15,113 |
8/31/2019 |
$15,852 |
$16,642 |
$14,805 |
9/30/2019 |
$15,862 |
$16,644 |
$15,065 |
10/31/2019 |
$16,032 |
$17,113 |
$15,389 |
11/30/2019 |
$16,700 |
$17,872 |
$15,974 |
12/31/2019 |
$17,124 |
$18,411 |
$16,436 |
1/31/2020 |
$17,684 |
$18,823 |
$16,418 |
2/29/2020 |
$16,468 |
$17,541 |
$15,074 |
3/31/2020 |
$14,519 |
$15,815 |
$13,001 |
4/30/2020 |
$16,856 |
$18,156 |
$14,722 |
5/31/2020 |
$18,173 |
$19,375 |
$15,510 |
6/30/2020 |
$18,713 |
$20,218 |
$15,864 |
7/31/2020 |
$20,064 |
$21,774 |
$16,765 |
8/31/2020 |
$21,858 |
$24,021 |
$17,980 |
9/30/2020 |
$20,825 |
$22,890 |
$17,325 |
10/31/2020 |
$20,060 |
$22,113 |
$16,951 |
11/30/2020 |
$21,955 |
$24,377 |
$19,013 |
12/31/2020 |
$22,704 |
$25,498 |
$19,869 |
1/31/2021 |
$22,044 |
$25,310 |
$19,780 |
2/28/2021 |
$22,664 |
$25,304 |
$20,399 |
3/31/2021 |
$22,647 |
$25,739 |
$21,130 |
4/30/2021 |
$24,205 |
$27,490 |
$22,219 |
5/31/2021 |
$23,700 |
$27,110 |
$22,320 |
6/30/2021 |
$24,927 |
$28,810 |
$22,871 |
7/31/2021 |
$25,604 |
$29,760 |
$23,258 |
8/31/2021 |
$26,388 |
$30,873 |
$23,921 |
9/30/2021 |
$24,838 |
$29,144 |
$22,848 |
10/31/2021 |
$26,379 |
$31,668 |
$24,393 |
11/30/2021 |
$26,020 |
$31,861 |
$24,021 |
12/31/2021 |
$26,338 |
$32,535 |
$24,967 |
1/31/2022 |
$23,672 |
$29,743 |
$23,498 |
2/28/2022 |
$22,851 |
$28,479 |
$22,906 |
3/31/2022 |
$23,448 |
$29,594 |
$23,649 |
4/30/2022 |
$20,267 |
$26,020 |
$21,527 |
5/31/2022 |
$19,844 |
$25,415 |
$21,498 |
6/30/2022 |
$18,289 |
$23,402 |
$19,700 |
7/31/2022 |
$20,338 |
$26,210 |
$21,548 |
8/31/2022 |
$19,360 |
$24,989 |
$20,744 |
9/30/2022 |
$17,535 |
$22,560 |
$18,820 |
10/31/2022 |
$18,411 |
$23,879 |
$20,364 |
11/30/2022 |
$19,533 |
$24,967 |
$21,426 |
12/31/2022 |
$18,232 |
$23,055 |
$20,172 |
1/31/2023 |
$19,539 |
$24,977 |
$21,561 |
2/28/2023 |
$19,212 |
$24,680 |
$21,057 |
3/31/2023 |
$20,530 |
$26,367 |
$21,620 |
4/30/2023 |
$20,987 |
$26,628 |
$21,851 |
5/31/2023 |
$21,702 |
$27,841 |
$21,936 |
6/30/2023 |
$23,162 |
$29,745 |
$23,433 |
7/31/2023 |
$23,640 |
$30,747 |
$24,273 |
8/31/2023 |
$23,550 |
$30,471 |
$23,805 |
9/30/2023 |
$22,277 |
$28,814 |
$22,671 |
10/31/2023 |
$22,119 |
$28,404 |
$22,070 |
11/30/2023 |
$24,694 |
$31,500 |
$24,128 |
12/31/2023 |
$25,677 |
$32,895 |
$25,408 |
1/31/2024 |
$26,993 |
$33,715 |
$25,689 |
2/29/2024 |
$29,088 |
$36,016 |
$27,080 |
3/31/2024 |
$29,619 |
$36,650 |
$27,953 |
4/30/2024 |
$28,061 |
$35,095 |
$26,723 |
5/31/2024 |
$29,673 |
$37,196 |
$27,986 |
6/30/2024 |
$31,842 |
$39,704 |
$28,852 |
7/31/2024 |
$30,666 |
$39,029 |
$29,389 |
8/31/2024 |
$31,647 |
$39,842 |
$30,029 |
9/30/2024 |
$32,372 |
$40,971 |
$30,650 |
10/31/2024 |
$32,265 |
$40,835 |
$30,425 |
11/30/2024 |
$34,279 |
$43,484 |
$32,449 |
12/31/2024 |
$33,513 |
$43,868 |
$31,457 |
1/31/2025 |
$34,543 |
$44,735 |
$32,450 |
2/28/2025 |
$33,284 |
$43,128 |
$31,828 |
3/31/2025 |
$30,621 |
$39,481 |
$29,971 |
4/30/2025 |
$31,224 |
$40,153 |
$29,770 |
5/31/2025 |
$34,108 |
$43,747 |
$31,657 |
6/30/2025 |
$36,725 |
$46,580 |
$33,266 |
7/31/2025 |
$38,137 |
$48,339 |
$33,998 |
|
| Average Annual Return [Table Text Block] |
|
AVERAGE ANNUAL TOTAL RETURNS (%)
AATR |
1 Year |
5 Years |
10 Years |
Institutional Class |
24.36 |
13.71 |
14.32 |
Russell 1000® Growth Index |
23.85 |
17.29 |
17.07 |
Russell 3000® Index |
15.68 |
15.19 |
13.02 | |
| AssetsNet |
|
$ 1,027,019,553
|
| Holdings Count | Holding |
|
36
|
| Advisory Fees Paid, Amount |
|
$ 5,162,043
|
| InvestmentCompanyPortfolioTurnover |
|
44.00%
|
| Holdings [Text Block] |
|
SECTOR ALLOCATION (% OF LONG-TERM INVESTMENTS)
Information technology |
40.7 |
Consumer discretionary |
15.7 |
Communication services |
14.0 |
Industrials |
12.2 |
Financials |
11.4 |
Health care |
6.0 | |
| Largest Holdings [Text Block] |
|
TOP TEN HOLDINGS (% OF NET ASSETS)
Microsoft Corp. |
10.8 |
NVIDIA Corp. |
8.6 |
Amazon.com, Inc. |
7.8 |
Meta Platforms, Inc. Class A |
7.0 |
Broadcom, Inc. |
4.7 |
Apple, Inc. |
4.6 |
Oracle Corp. |
3.7 |
General Electric Co. |
2.8 |
Alphabet, Inc. Class A |
2.5 |
Netflix, Inc. |
2.5 | |
| Material Fund Change [Text Block] |
|
|
| C000120071 |
|
|
| Shareholder Report [Line Items] |
|
|
| Fund Name |
|
Large Cap Growth Fund
|
| Class Name |
|
Class R6
|
| Trading Symbol |
|
STFFX
|
| Annual or Semi-Annual Statement [Text Block] |
|
This annual shareholder report contains important information about Large Cap Growth Fund for the period from August 1, 2024 to July 31, 2025.
|
| Shareholder Report Annual or Semi-Annual |
|
Annual Shareholder Report
|
| Additional Information [Text Block] |
|
You can find additional information about the Fund at allspringglobal.com. You can also request this information by contacting us at 1-800-222-8222.
|
| Additional Information Phone Number |
|
<span style="white-space: nowrap; box-sizing: border-box; color: rgb(0, 0, 0); display: inline; flex-wrap: nowrap; font-size: 12px; font-weight: 400; grid-area: auto; line-height: 18px; margin: 0px; overflow: visible; text-align: left; text-align-last: auto;"> 1-800-222-8222.</span>
|
| Additional Information Website |
|
<span style="box-sizing: border-box; color: rgb(0, 0, 0); display: inline; flex-wrap: nowrap; font-size: 12px; font-weight: 400; grid-area: auto; line-height: 18px; margin: 0px; overflow: visible; text-align: left; text-align-last: auto; white-space-collapse: preserve-breaks;">allspringglobal.com</span>
|
| Expenses [Text Block] |
|
What were the Fund costs for the past year?The table explains the costs you would have paid within the reporting period based on a hypothetical $10,000 investment.
CLASS NAME |
COSTS OF A $10,000 INVESTMENT |
COSTS PAID AS A % OF A $10,000 INVESTMENT |
Class R6 |
$67 |
0.60% | The manager has contractually committed to waive fees and/or reimburse certain expenses to the extent necessary to cap the Fund's total annual fund operating expense ratio at a specific amount. Without this cap, the costs shown above may have been higher. Please see the prospectus for the amount and the expiration date of the cap. Prior to or after the commitment expiration date, the cap may be increased or the commitment to maintain the cap may be terminated only with the approval of the Board of Trustees. |
| Expenses Paid, Amount |
|
$ 67
|
| Expense Ratio, Percent |
|
0.60%
|
| Factors Affecting Performance [Text Block] |
|
How did the Fund perform last year and what affected its performance?The market environment for the 12-month period that ended July 31, 2025, was bifurcated for U.S. equities. During the first half of the period, the economy was generally healthy, with moderating inflation, resilient consumer spending, and favorable earnings growth. In early 2025, the new U.S. administration took office and implemented policies on government spending, immigration, and tariffs. Financial market sentiment grew concerned and volatility spiked until the administration temporarily paused tariffs. With uncertainty easing, overall corporate earnings generally exceeded expectations and propelled growth indexes upward. Artificial intelligence (AI) was a key driver as leading technology firms ramped up capital expenditures on AI infrastructure. The portfolio benefited from security selection within communication services and consumer discretionary, where holdings with innovative services and strong demand, such as Meta Platforms, Inc. and DoorDash, Inc. contributed. In contrast, relative underweights to select mega-cap technology companies, including NVIDIA Corp. and Broadcom, Inc. detracted from returns. |
| Line Graph [Table Text Block] |
|
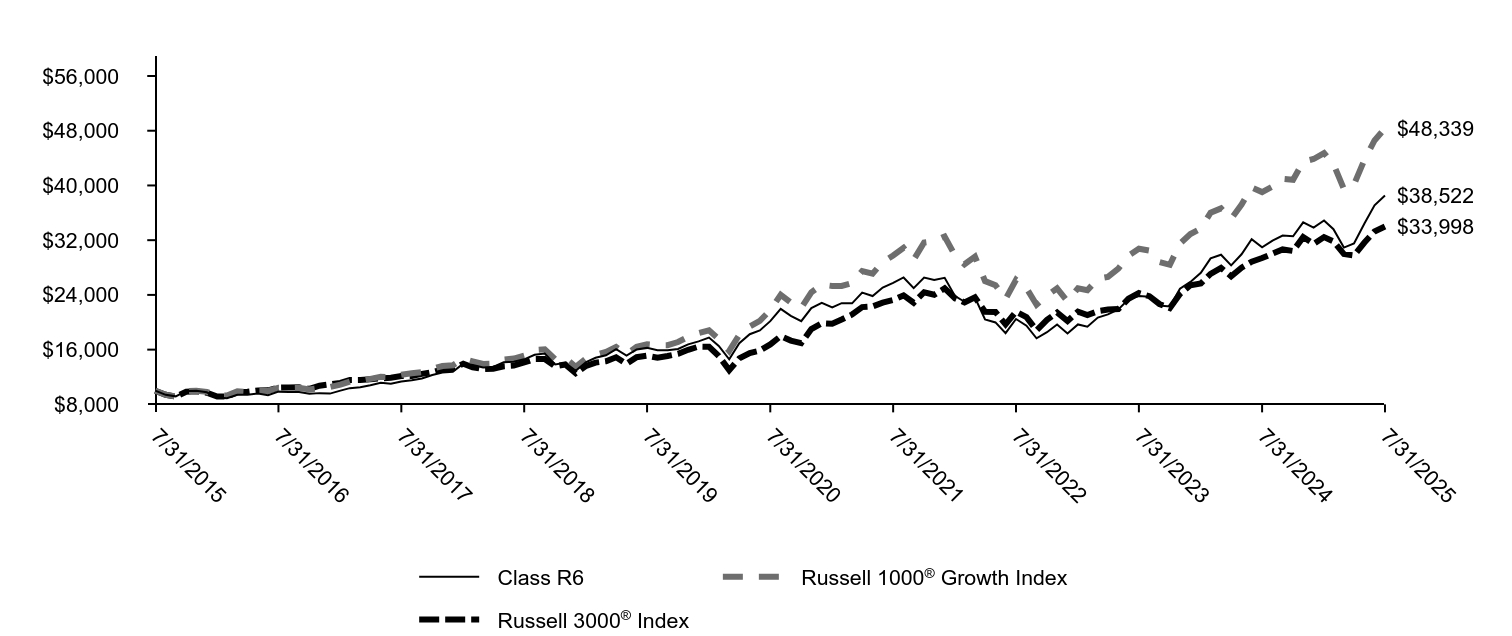
|
Class R6 |
Russell 1000® Growth Index |
Russell 3000® Index |
7/31/2015 |
$10,000 |
$10,000 |
$10,000 |
8/31/2015 |
$9,392 |
$9,393 |
$9,396 |
9/30/2015 |
$9,172 |
$9,160 |
$9,122 |
10/31/2015 |
$9,958 |
$9,949 |
$9,843 |
11/30/2015 |
$9,974 |
$9,977 |
$9,898 |
12/31/2015 |
$9,772 |
$9,831 |
$9,694 |
1/31/2016 |
$8,991 |
$9,282 |
$9,147 |
2/29/2016 |
$8,890 |
$9,278 |
$9,144 |
3/31/2016 |
$9,389 |
$9,904 |
$9,788 |
4/30/2016 |
$9,391 |
$9,813 |
$9,849 |
5/31/2016 |
$9,570 |
$10,004 |
$10,025 |
6/30/2016 |
$9,324 |
$9,964 |
$10,046 |
7/31/2016 |
$9,861 |
$10,435 |
$10,444 |
8/31/2016 |
$9,808 |
$10,383 |
$10,471 |
9/30/2016 |
$9,806 |
$10,421 |
$10,488 |
10/31/2016 |
$9,561 |
$10,176 |
$10,261 |
11/30/2016 |
$9,642 |
$10,398 |
$10,720 |
12/31/2016 |
$9,573 |
$10,526 |
$10,929 |
1/31/2017 |
$10,006 |
$10,881 |
$11,135 |
2/28/2017 |
$10,370 |
$11,333 |
$11,549 |
3/31/2017 |
$10,496 |
$11,464 |
$11,557 |
4/30/2017 |
$10,800 |
$11,726 |
$11,679 |
5/31/2017 |
$11,151 |
$12,031 |
$11,799 |
6/30/2017 |
$11,025 |
$11,999 |
$11,905 |
7/31/2017 |
$11,349 |
$12,318 |
$12,130 |
8/31/2017 |
$11,535 |
$12,544 |
$12,153 |
9/30/2017 |
$11,777 |
$12,707 |
$12,449 |
10/31/2017 |
$12,286 |
$13,200 |
$12,721 |
11/30/2017 |
$12,647 |
$13,601 |
$13,107 |
12/31/2017 |
$12,773 |
$13,707 |
$13,238 |
1/31/2018 |
$13,951 |
$14,677 |
$13,936 |
2/28/2018 |
$13,739 |
$14,292 |
$13,423 |
3/31/2018 |
$13,392 |
$13,901 |
$13,153 |
4/30/2018 |
$13,463 |
$13,949 |
$13,203 |
5/31/2018 |
$14,142 |
$14,561 |
$13,576 |
6/30/2018 |
$14,216 |
$14,701 |
$13,665 |
7/31/2018 |
$14,584 |
$15,132 |
$14,118 |
8/31/2018 |
$15,241 |
$15,960 |
$14,614 |
9/30/2018 |
$15,429 |
$16,049 |
$14,638 |
10/31/2018 |
$13,842 |
$14,614 |
$13,560 |
11/30/2018 |
$14,063 |
$14,769 |
$13,832 |
12/31/2018 |
$12,910 |
$13,499 |
$12,544 |
1/31/2019 |
$14,166 |
$14,712 |
$13,621 |
2/28/2019 |
$14,805 |
$15,239 |
$14,100 |
3/31/2019 |
$15,179 |
$15,673 |
$14,306 |
4/30/2019 |
$16,072 |
$16,381 |
$14,877 |
5/31/2019 |
$15,126 |
$15,346 |
$13,915 |
6/30/2019 |
$16,019 |
$16,400 |
$14,892 |
7/31/2019 |
$16,255 |
$16,770 |
$15,113 |
8/31/2019 |
$15,913 |
$16,642 |
$14,805 |
9/30/2019 |
$15,927 |
$16,644 |
$15,065 |
10/31/2019 |
$16,097 |
$17,113 |
$15,389 |
11/30/2019 |
$16,771 |
$17,872 |
$15,974 |
12/31/2019 |
$17,201 |
$18,411 |
$16,436 |
1/31/2020 |
$17,760 |
$18,823 |
$16,418 |
2/29/2020 |
$16,541 |
$17,541 |
$15,074 |
3/31/2020 |
$14,585 |
$15,815 |
$13,001 |
4/30/2020 |
$16,933 |
$18,156 |
$14,722 |
5/31/2020 |
$18,257 |
$19,375 |
$15,510 |
6/30/2020 |
$18,804 |
$20,218 |
$15,864 |
7/31/2020 |
$20,162 |
$21,774 |
$16,765 |
8/31/2020 |
$21,967 |
$24,021 |
$17,980 |
9/30/2020 |
$20,931 |
$22,890 |
$17,325 |
10/31/2020 |
$20,166 |
$22,113 |
$16,951 |
11/30/2020 |
$22,068 |
$24,377 |
$19,013 |
12/31/2020 |
$22,824 |
$25,498 |
$19,869 |
1/31/2021 |
$22,165 |
$25,310 |
$19,780 |
2/28/2021 |
$22,789 |
$25,304 |
$20,399 |
3/31/2021 |
$22,771 |
$25,739 |
$21,130 |
4/30/2021 |
$24,341 |
$27,490 |
$22,219 |
5/31/2021 |
$23,837 |
$27,110 |
$22,320 |
6/30/2021 |
$25,075 |
$28,810 |
$22,871 |
7/31/2021 |
$25,760 |
$29,760 |
$23,258 |
8/31/2021 |
$26,547 |
$30,873 |
$23,921 |
9/30/2021 |
$24,986 |
$29,144 |
$22,848 |
10/31/2021 |
$26,543 |
$31,668 |
$24,393 |
11/30/2021 |
$26,185 |
$31,861 |
$24,021 |
12/31/2021 |
$26,502 |
$32,535 |
$24,967 |
1/31/2022 |
$23,822 |
$29,743 |
$23,498 |
2/28/2022 |
$22,998 |
$28,479 |
$22,906 |
3/31/2022 |
$23,603 |
$29,594 |
$23,649 |
4/30/2022 |
$20,400 |
$26,020 |
$21,527 |
5/31/2022 |
$19,978 |
$25,415 |
$21,498 |
6/30/2022 |
$18,412 |
$23,402 |
$19,700 |
7/31/2022 |
$20,481 |
$26,210 |
$21,548 |
8/31/2022 |
$19,495 |
$24,989 |
$20,744 |
9/30/2022 |
$17,659 |
$22,560 |
$18,820 |
10/31/2022 |
$18,544 |
$23,879 |
$20,364 |
11/30/2022 |
$19,673 |
$24,967 |
$21,426 |
12/31/2022 |
$18,365 |
$23,055 |
$20,172 |
1/31/2023 |
$19,684 |
$24,977 |
$21,561 |
2/28/2023 |
$19,359 |
$24,680 |
$21,057 |
3/31/2023 |
$20,684 |
$26,367 |
$21,620 |
4/30/2023 |
$21,150 |
$26,628 |
$21,851 |
5/31/2023 |
$21,868 |
$27,841 |
$21,936 |
6/30/2023 |
$23,345 |
$29,745 |
$23,433 |
7/31/2023 |
$23,833 |
$30,747 |
$24,273 |
8/31/2023 |
$23,743 |
$30,471 |
$23,805 |
9/30/2023 |
$22,458 |
$28,814 |
$22,671 |
10/31/2023 |
$22,306 |
$28,404 |
$22,070 |
11/30/2023 |
$24,906 |
$31,500 |
$24,128 |
12/31/2023 |
$25,897 |
$32,895 |
$25,408 |
1/31/2024 |
$27,226 |
$33,715 |
$25,689 |
2/29/2024 |
$29,342 |
$36,016 |
$27,080 |
3/31/2024 |
$29,876 |
$36,650 |
$27,953 |
4/30/2024 |
$28,314 |
$35,095 |
$26,723 |
5/31/2024 |
$29,943 |
$37,196 |
$27,986 |
6/30/2024 |
$32,133 |
$39,704 |
$28,852 |
7/31/2024 |
$30,945 |
$39,029 |
$29,389 |
8/31/2024 |
$31,939 |
$39,842 |
$30,029 |
9/30/2024 |
$32,674 |
$40,971 |
$30,650 |
10/31/2024 |
$32,567 |
$40,835 |
$30,425 |
11/30/2024 |
$34,603 |
$43,484 |
$32,449 |
12/31/2024 |
$33,836 |
$43,868 |
$31,457 |
1/31/2025 |
$34,880 |
$44,735 |
$32,450 |
2/28/2025 |
$33,609 |
$43,128 |
$31,828 |
3/31/2025 |
$30,921 |
$39,481 |
$29,971 |
4/30/2025 |
$31,534 |
$40,153 |
$29,770 |
5/31/2025 |
$34,449 |
$43,747 |
$31,657 |
6/30/2025 |
$37,091 |
$46,580 |
$33,266 |
7/31/2025 |
$38,522 |
$48,339 |
$33,998 |
|
| Average Annual Return [Table Text Block] |
|
AVERAGE ANNUAL TOTAL RETURNS (%)
AATR |
1 Year |
5 Years |
10 Years |
Class R6 |
24.49 |
13.82 |
14.44 |
Russell 1000® Growth Index |
23.85 |
17.29 |
17.07 |
Russell 3000® Index |
15.68 |
15.19 |
13.02 | |
| AssetsNet |
|
$ 1,027,019,553
|
| Holdings Count | Holding |
|
36
|
| Advisory Fees Paid, Amount |
|
$ 5,162,043
|
| InvestmentCompanyPortfolioTurnover |
|
44.00%
|
| Holdings [Text Block] |
|
SECTOR ALLOCATION (% OF LONG-TERM INVESTMENTS)
Information technology |
40.7 |
Consumer discretionary |
15.7 |
Communication services |
14.0 |
Industrials |
12.2 |
Financials |
11.4 |
Health care |
6.0 | |
| Largest Holdings [Text Block] |
|
TOP TEN HOLDINGS (% OF NET ASSETS)
Microsoft Corp. |
10.8 |
NVIDIA Corp. |
8.6 |
Amazon.com, Inc. |
7.8 |
Meta Platforms, Inc. Class A |
7.0 |
Broadcom, Inc. |
4.7 |
Apple, Inc. |
4.6 |
Oracle Corp. |
3.7 |
General Electric Co. |
2.8 |
Alphabet, Inc. Class A |
2.5 |
Netflix, Inc. |
2.5 | |
| Material Fund Change [Text Block] |
|
|
| C000092781 |
|
|
| Shareholder Report [Line Items] |
|
|
| Fund Name |
|
Large Cap Growth Fund
|
| Class Name |
|
Class C
|
| Trading Symbol |
|
STOFX
|
| Annual or Semi-Annual Statement [Text Block] |
|
This annual shareholder report contains important information about Large Cap Growth Fund for the period from August 1, 2024 to July 31, 2025.
|
| Shareholder Report Annual or Semi-Annual |
|
Annual Shareholder Report
|
| Additional Information [Text Block] |
|
You can find additional information about the Fund at allspringglobal.com. You can also request this information by contacting us at 1-800-222-8222.
|
| Material Fund Change Notice [Text Block] |
|
This report describes changes to the Fund that occurred either during or after the reporting period.
|
| Additional Information Phone Number |
|
<span style="white-space: nowrap; box-sizing: border-box; color: rgb(0, 0, 0); display: inline; flex-wrap: nowrap; font-size: 12px; font-weight: 400; grid-area: auto; line-height: 18px; margin: 0px; overflow: visible; text-align: left; text-align-last: auto;"> 1-800-222-8222.</span>
|
| Additional Information Website |
|
<span style="box-sizing: border-box; color: rgb(0, 0, 0); display: inline; flex-wrap: nowrap; font-size: 12px; font-weight: 400; grid-area: auto; line-height: 18px; margin: 0px; overflow: visible; text-align: left; text-align-last: auto; white-space-collapse: preserve-breaks;">allspringglobal.com</span>
|
| Expenses [Text Block] |
|
What were the Fund costs for the past year?The table explains the costs you would have paid within the reporting period based on a hypothetical $10,000 investment.
CLASS NAME |
COSTS OF A $10,000 INVESTMENT |
COSTS PAID AS A % OF A $10,000 INVESTMENT |
Class C |
$197 |
1.77% | The manager has contractually committed to waive fees and/or reimburse certain expenses to the extent necessary to cap the Fund's total annual fund operating expense ratio at a specific amount. Without this cap, the costs shown above may have been higher. Please see the prospectus for the amount and the expiration date of the cap. Prior to or after the commitment expiration date, the cap may be increased or the commitment to maintain the cap may be terminated only with the approval of the Board of Trustees. |
| Expenses Paid, Amount |
|
$ 197
|
| Expense Ratio, Percent |
|
1.77%
|
| Factors Affecting Performance [Text Block] |
|
How did the Fund perform last year and what affected its performance?The market environment for the 12-month period that ended July 31, 2025, was bifurcated for U.S. equities. During the first half of the period, the economy was generally healthy, with moderating inflation, resilient consumer spending, and favorable earnings growth. In early 2025, the new U.S. administration took office and implemented policies on government spending, immigration, and tariffs. Financial market sentiment grew concerned and volatility spiked until the administration temporarily paused tariffs. With uncertainty easing, overall corporate earnings generally exceeded expectations and propelled growth indexes upward. Artificial intelligence (AI) was a key driver as leading technology firms ramped up capital expenditures on AI infrastructure. The portfolio benefited from security selection within communication services and consumer discretionary, where holdings with innovative services and strong demand, such as Meta Platforms, Inc. and DoorDash, Inc. contributed. In contrast, relative underweights to select mega-cap technology companies, including NVIDIA Corp. and Broadcom, Inc. detracted from returns. |
| Line Graph [Table Text Block] |
|

|
Class C with Load |
Russell 1000® Growth Index |
Russell 3000® Index |
7/31/2015 |
$10,000 |
$10,000 |
$10,000 |
8/31/2015 |
$9,383 |
$9,393 |
$9,396 |
9/30/2015 |
$9,153 |
$9,160 |
$9,122 |
10/31/2015 |
$9,929 |
$9,949 |
$9,843 |
11/30/2015 |
$9,935 |
$9,977 |
$9,898 |
12/31/2015 |
$9,724 |
$9,831 |
$9,694 |
1/31/2016 |
$8,938 |
$9,282 |
$9,147 |
2/29/2016 |
$8,827 |
$9,278 |
$9,144 |
3/31/2016 |
$9,314 |
$9,904 |
$9,788 |
4/30/2016 |
$9,307 |
$9,813 |
$9,849 |
5/31/2016 |
$9,476 |
$10,004 |
$10,025 |
6/30/2016 |
$9,225 |
$9,964 |
$10,046 |
7/31/2016 |
$9,744 |
$10,435 |
$10,444 |
8/31/2016 |
$9,684 |
$10,383 |
$10,471 |
9/30/2016 |
$9,673 |
$10,421 |
$10,488 |
10/31/2016 |
$9,422 |
$10,176 |
$10,261 |
11/30/2016 |
$9,491 |
$10,398 |
$10,720 |
12/31/2016 |
$9,413 |
$10,526 |
$10,929 |
1/31/2017 |
$9,831 |
$10,881 |
$11,135 |
2/28/2017 |
$10,178 |
$11,333 |
$11,549 |
3/31/2017 |
$10,290 |
$11,464 |
$11,557 |
4/30/2017 |
$10,579 |
$11,726 |
$11,679 |
5/31/2017 |
$10,914 |
$12,031 |
$11,799 |
6/30/2017 |
$10,778 |
$11,999 |
$11,905 |
7/31/2017 |
$11,083 |
$12,318 |
$12,130 |
8/31/2017 |
$11,254 |
$12,544 |
$12,153 |
9/30/2017 |
$11,480 |
$12,707 |
$12,449 |
10/31/2017 |
$11,965 |
$13,200 |
$12,721 |
11/30/2017 |
$12,305 |
$13,601 |
$13,107 |
12/31/2017 |
$12,415 |
$13,707 |
$13,238 |
1/31/2018 |
$13,545 |
$14,677 |
$13,936 |
2/28/2018 |
$13,328 |
$14,292 |
$13,423 |
3/31/2018 |
$12,979 |
$13,901 |
$13,153 |
4/30/2018 |
$13,035 |
$13,949 |
$13,203 |
5/31/2018 |
$13,680 |
$14,561 |
$13,576 |
6/30/2018 |
$13,736 |
$14,701 |
$13,665 |
7/31/2018 |
$14,079 |
$15,132 |
$14,118 |
8/31/2018 |
$14,699 |
$15,960 |
$14,614 |
9/30/2018 |
$14,866 |
$16,049 |
$14,638 |
10/31/2018 |
$13,322 |
$14,614 |
$13,560 |
11/30/2018 |
$13,522 |
$14,769 |
$13,832 |
12/31/2018 |
$12,402 |
$13,499 |
$12,544 |
1/31/2019 |
$13,595 |
$14,712 |
$13,621 |
2/28/2019 |
$14,197 |
$15,239 |
$14,100 |
3/31/2019 |
$14,539 |
$15,673 |
$14,306 |
4/30/2019 |
$15,382 |
$16,381 |
$14,877 |
5/31/2019 |
$14,461 |
$15,346 |
$13,915 |
6/30/2019 |
$15,299 |
$16,400 |
$14,892 |
7/31/2019 |
$15,512 |
$16,770 |
$15,113 |
8/31/2019 |
$15,169 |
$16,642 |
$14,805 |
9/30/2019 |
$15,169 |
$16,644 |
$15,065 |
10/31/2019 |
$15,315 |
$17,113 |
$15,389 |
11/30/2019 |
$15,941 |
$17,872 |
$15,974 |
12/31/2019 |
$16,331 |
$18,411 |
$16,436 |
1/31/2020 |
$16,844 |
$18,823 |
$16,418 |
2/29/2020 |
$15,677 |
$17,541 |
$15,074 |
3/31/2020 |
$13,807 |
$15,815 |
$13,001 |
4/30/2020 |
$16,015 |
$18,156 |
$14,722 |
5/31/2020 |
$17,253 |
$19,375 |
$15,510 |
6/30/2020 |
$17,749 |
$20,218 |
$15,864 |
7/31/2020 |
$19,013 |
$21,774 |
$16,765 |
8/31/2020 |
$20,693 |
$24,021 |
$17,980 |
9/30/2020 |
$19,702 |
$22,890 |
$17,325 |
10/31/2020 |
$18,960 |
$22,113 |
$16,951 |
11/30/2020 |
$20,733 |
$24,377 |
$19,013 |
12/31/2020 |
$21,415 |
$25,498 |
$19,869 |
1/31/2021 |
$20,782 |
$25,310 |
$19,780 |
2/28/2021 |
$21,348 |
$25,304 |
$20,399 |
3/31/2021 |
$21,307 |
$25,739 |
$21,130 |
4/30/2021 |
$22,753 |
$27,490 |
$22,219 |
5/31/2021 |
$22,259 |
$27,110 |
$22,320 |
6/30/2021 |
$23,391 |
$28,810 |
$22,871 |
7/31/2021 |
$24,009 |
$29,760 |
$23,258 |
8/31/2021 |
$24,719 |
$30,873 |
$23,921 |
9/30/2021 |
$23,242 |
$29,144 |
$22,848 |
10/31/2021 |
$24,668 |
$31,668 |
$24,393 |
11/30/2021 |
$24,307 |
$31,861 |
$24,021 |
12/31/2021 |
$24,582 |
$32,535 |
$24,967 |
1/31/2022 |
$22,071 |
$29,743 |
$23,498 |
2/28/2022 |
$21,290 |
$28,479 |
$22,906 |
3/31/2022 |
$21,825 |
$29,594 |
$23,649 |
4/30/2022 |
$18,847 |
$26,020 |
$21,527 |
5/31/2022 |
$18,441 |
$25,415 |
$21,498 |
6/30/2022 |
$16,976 |
$23,402 |
$19,700 |
7/31/2022 |
$18,865 |
$26,210 |
$21,548 |
8/31/2022 |
$17,942 |
$24,989 |
$20,744 |
9/30/2022 |
$16,238 |
$22,560 |
$18,820 |
10/31/2022 |
$17,032 |
$23,879 |
$20,364 |
11/30/2022 |
$18,053 |
$24,967 |
$21,426 |
12/31/2022 |
$16,839 |
$23,055 |
$20,172 |
1/31/2023 |
$18,026 |
$24,977 |
$21,561 |
2/28/2023 |
$17,710 |
$24,680 |
$21,057 |
3/31/2023 |
$18,905 |
$26,367 |
$21,620 |
4/30/2023 |
$19,312 |
$26,628 |
$21,851 |
5/31/2023 |
$19,952 |
$27,841 |
$21,936 |
6/30/2023 |
$21,273 |
$29,745 |
$23,433 |
7/31/2023 |
$21,695 |
$30,747 |
$24,273 |
8/31/2023 |
$21,606 |
$30,471 |
$23,805 |
9/30/2023 |
$20,431 |
$28,814 |
$22,671 |
10/31/2023 |
$20,286 |
$28,404 |
$22,070 |
11/30/2023 |
$22,637 |
$31,500 |
$24,128 |
12/31/2023 |
$23,533 |
$32,895 |
$25,408 |
1/31/2024 |
$24,733 |
$33,715 |
$25,689 |
2/29/2024 |
$26,643 |
$36,016 |
$27,080 |
3/31/2024 |
$27,126 |
$36,650 |
$27,953 |
4/30/2024 |
$25,691 |
$35,095 |
$26,723 |
5/31/2024 |
$27,159 |
$37,196 |
$27,986 |
6/30/2024 |
$29,136 |
$39,704 |
$28,852 |
7/31/2024 |
$28,057 |
$39,029 |
$29,389 |
8/31/2024 |
$28,949 |
$39,842 |
$30,029 |
9/30/2024 |
$29,606 |
$40,971 |
$30,650 |
10/31/2024 |
$29,498 |
$40,835 |
$30,425 |
11/30/2024 |
$31,328 |
$43,484 |
$32,449 |
12/31/2024 |
$30,623 |
$43,868 |
$31,457 |
1/31/2025 |
$31,556 |
$44,735 |
$32,450 |
2/28/2025 |
$30,399 |
$43,128 |
$31,828 |
3/31/2025 |
$27,962 |
$39,481 |
$29,971 |
4/30/2025 |
$28,510 |
$40,153 |
$29,770 |
5/31/2025 |
$31,132 |
$43,747 |
$31,657 |
6/30/2025 |
$33,516 |
$46,580 |
$33,266 |
7/31/2025 |
$34,804 |
$48,339 |
$33,998 |
|
| Average Annual Return [Table Text Block] |
|
AVERAGE ANNUAL TOTAL RETURNS (%)
AATR |
1 Year |
5 Years |
10 Years |
Class C |
23.07 |
12.50 |
13.28 |
Class C with Load |
22.07 |
12.50 |
13.28 |
Russell 1000® Growth Index |
23.85 |
17.29 |
17.07 |
Russell 3000® Index |
15.68 |
15.19 |
13.02 | |
| Material Change Date |
Aug. 01, 2024
|
|
| AssetsNet |
|
$ 1,027,019,553
|
| Holdings Count | Holding |
|
36
|
| Advisory Fees Paid, Amount |
|
$ 5,162,043
|
| InvestmentCompanyPortfolioTurnover |
|
44.00%
|
| Holdings [Text Block] |
|
SECTOR ALLOCATION (% OF LONG-TERM INVESTMENTS)
Information technology |
40.7 |
Consumer discretionary |
15.7 |
Communication services |
14.0 |
Industrials |
12.2 |
Financials |
11.4 |
Health care |
6.0 | |
| Largest Holdings [Text Block] |
|
TOP TEN HOLDINGS (% OF NET ASSETS)
Microsoft Corp. |
10.8 |
NVIDIA Corp. |
8.6 |
Amazon.com, Inc. |
7.8 |
Meta Platforms, Inc. Class A |
7.0 |
Broadcom, Inc. |
4.7 |
Apple, Inc. |
4.6 |
Oracle Corp. |
3.7 |
General Electric Co. |
2.8 |
Alphabet, Inc. Class A |
2.5 |
Netflix, Inc. |
2.5 | |
| Material Fund Change [Text Block] |
|
This is a summary of certain changes and planned changes to the Fund since August 1, 2024. At a meeting held on August 19-20, 2025, the Board of Trustees of the Fund approved the conversion of the Fund’s Class C shares into Class A shares effective on or about the close of business on November 14, 2025. In addition, effective at the close of business on September 29, 2025, Class C will be closed to new investors and additional investments from existing shareholders. |
| Summary of Change Legend [Text Block] |
|
This is a summary of certain changes and planned changes to the Fund since August 1, 2024.
|
| C000092780 |
|
|
| Shareholder Report [Line Items] |
|
|
| Fund Name |
|
Large Cap Growth Fund
|
| Class Name |
|
Class A
|
| Trading Symbol |
|
STAFX
|
| Annual or Semi-Annual Statement [Text Block] |
|
This annual shareholder report contains important information about Large Cap Growth Fund for the period from August 1, 2024 to July 31, 2025.
|
| Shareholder Report Annual or Semi-Annual |
|
Annual Shareholder Report
|
| Additional Information [Text Block] |
|
You can find additional information about the Fund at allspringglobal.com. You can also request this information by contacting us at 1-800-222-8222.
|
| Additional Information Phone Number |
|
<span style="white-space: nowrap; box-sizing: border-box; color: rgb(0, 0, 0); display: inline; flex-wrap: nowrap; font-size: 12px; font-weight: 400; grid-area: auto; line-height: 18px; margin: 0px; overflow: visible; text-align: left; text-align-last: auto;"> 1-800-222-8222.</span>
|
| Additional Information Website |
|
<span style="box-sizing: border-box; color: rgb(0, 0, 0); display: inline; flex-wrap: nowrap; font-size: 12px; font-weight: 400; grid-area: auto; line-height: 18px; margin: 0px; overflow: visible; text-align: left; text-align-last: auto; white-space-collapse: preserve-breaks;">allspringglobal.com</span>
|
| Expenses [Text Block] |
|
What were the Fund costs for the past year?The table explains the costs you would have paid within the reporting period based on a hypothetical $10,000 investment.
CLASS NAME |
COSTS OF A $10,000 INVESTMENT |
COSTS PAID AS A % OF A $10,000 INVESTMENT |
Class A |
$109 |
0.97% | The manager has contractually committed to waive fees and/or reimburse certain expenses to the extent necessary to cap the Fund's total annual fund operating expense ratio at a specific amount. Without this cap, the costs shown above may have been higher. Please see the prospectus for the amount and the expiration date of the cap. Prior to or after the commitment expiration date, the cap may be increased or the commitment to maintain the cap may be terminated only with the approval of the Board of Trustees. |
| Expenses Paid, Amount |
|
$ 109
|
| Expense Ratio, Percent |
|
0.97%
|
| Factors Affecting Performance [Text Block] |
|
How did the Fund perform last year and what affected its performance?The market environment for the 12-month period that ended July 31, 2025, was bifurcated for U.S. equities. During the first half of the period, the economy was generally healthy, with moderating inflation, resilient consumer spending, and favorable earnings growth. In early 2025, the new U.S. administration took office and implemented policies on government spending, immigration, and tariffs. Financial market sentiment grew concerned and volatility spiked until the administration temporarily paused tariffs. With uncertainty easing, overall corporate earnings generally exceeded expectations and propelled growth indexes upward. Artificial intelligence (AI) was a key driver as leading technology firms ramped up capital expenditures on AI infrastructure. The portfolio benefited from security selection within communication services and consumer discretionary, where holdings with innovative services and strong demand, such as Meta Platforms, Inc. and DoorDash, Inc. contributed. In contrast, relative underweights to select mega-cap technology companies, including NVIDIA Corp. and Broadcom, Inc. detracted from returns. |
| Line Graph [Table Text Block] |
|

|
Class A with Load |
Russell 1000® Growth Index |
Russell 3000® Index |
7/31/2015 |
$9,425 |
$10,000 |
$10,000 |
8/31/2015 |
$8,849 |
$9,393 |
$9,396 |
9/30/2015 |
$8,638 |
$9,160 |
$9,122 |
10/31/2015 |
$9,374 |
$9,949 |
$9,843 |
11/30/2015 |
$9,385 |
$9,977 |
$9,898 |
12/31/2015 |
$9,192 |
$9,831 |
$9,694 |
1/31/2016 |
$8,455 |
$9,282 |
$9,147 |
2/29/2016 |
$8,357 |
$9,278 |
$9,144 |
3/31/2016 |
$8,821 |
$9,904 |
$9,788 |
4/30/2016 |
$8,821 |
$9,813 |
$9,849 |
5/31/2016 |
$8,985 |
$10,004 |
$10,025 |
6/30/2016 |
$8,752 |
$9,964 |
$10,046 |
7/31/2016 |
$9,253 |
$10,435 |
$10,444 |
8/31/2016 |
$9,200 |
$10,383 |
$10,471 |
9/30/2016 |
$9,194 |
$10,421 |
$10,488 |
10/31/2016 |
$8,963 |
$10,176 |
$10,261 |
11/30/2016 |
$9,036 |
$10,398 |
$10,720 |
12/31/2016 |
$8,965 |
$10,526 |
$10,929 |
1/31/2017 |
$9,369 |
$10,881 |
$11,135 |
2/28/2017 |
$9,706 |
$11,333 |
$11,549 |
3/31/2017 |
$9,820 |
$11,464 |
$11,557 |
4/30/2017 |
$10,102 |
$11,726 |
$11,679 |
5/31/2017 |
$10,428 |
$12,031 |
$11,799 |
6/30/2017 |
$10,305 |
$11,999 |
$11,905 |
7/31/2017 |
$10,603 |
$12,318 |
$12,130 |
8/31/2017 |
$10,775 |
$12,544 |
$12,153 |
9/30/2017 |
$10,997 |
$12,707 |
$12,449 |
10/31/2017 |
$11,469 |
$13,200 |
$12,721 |
11/30/2017 |
$11,801 |
$13,601 |
$13,107 |
12/31/2017 |
$11,916 |
$13,707 |
$13,238 |
1/31/2018 |
$13,007 |
$14,677 |
$13,936 |
2/28/2018 |
$12,806 |
$14,292 |
$13,423 |
3/31/2018 |
$12,480 |
$13,901 |
$13,153 |
4/30/2018 |
$12,540 |
$13,949 |
$13,203 |
5/31/2018 |
$13,169 |
$14,561 |
$13,576 |
6/30/2018 |
$13,231 |
$14,701 |
$13,665 |
7/31/2018 |
$13,571 |
$15,132 |
$14,118 |
8/31/2018 |
$14,176 |
$15,960 |
$14,614 |
9/30/2018 |
$14,345 |
$16,049 |
$14,638 |
10/31/2018 |
$12,866 |
$14,614 |
$13,560 |
11/30/2018 |
$13,067 |
$14,769 |
$13,832 |
12/31/2018 |
$11,992 |
$13,499 |
$12,544 |
1/31/2019 |
$13,153 |
$14,712 |
$13,621 |
2/28/2019 |
$13,742 |
$15,239 |
$14,100 |
3/31/2019 |
$14,083 |
$15,673 |
$14,306 |
4/30/2019 |
$14,907 |
$16,381 |
$14,877 |
5/31/2019 |
$14,025 |
$15,346 |
$13,915 |
6/30/2019 |
$14,849 |
$16,400 |
$14,892 |
7/31/2019 |
$15,064 |
$16,770 |
$15,113 |
8/31/2019 |
$14,740 |
$16,642 |
$14,805 |
9/30/2019 |
$14,747 |
$16,644 |
$15,065 |
10/31/2019 |
$14,900 |
$17,113 |
$15,389 |
11/30/2019 |
$15,517 |
$17,872 |
$15,974 |
12/31/2019 |
$15,913 |
$18,411 |
$16,436 |
1/31/2020 |
$16,423 |
$18,823 |
$16,418 |
2/29/2020 |
$15,295 |
$17,541 |
$15,074 |
3/31/2020 |
$13,480 |
$15,815 |
$13,001 |
4/30/2020 |
$15,643 |
$18,156 |
$14,722 |
5/31/2020 |
$16,862 |
$19,375 |
$15,510 |
6/30/2020 |
$17,361 |
$20,218 |
$15,864 |
7/31/2020 |
$18,606 |
$21,774 |
$16,765 |
8/31/2020 |
$20,267 |
$24,021 |
$17,980 |
9/30/2020 |
$19,307 |
$22,890 |
$17,325 |
10/31/2020 |
$18,591 |
$22,113 |
$16,951 |
11/30/2020 |
$20,342 |
$24,377 |
$19,013 |
12/31/2020 |
$21,031 |
$25,498 |
$19,869 |
1/31/2021 |
$20,416 |
$25,310 |
$19,780 |
2/28/2021 |
$20,984 |
$25,304 |
$20,399 |
3/31/2021 |
$20,962 |
$25,739 |
$21,130 |
4/30/2021 |
$22,399 |
$27,490 |
$22,219 |
5/31/2021 |
$21,926 |
$27,110 |
$22,320 |
6/30/2021 |
$23,057 |
$28,810 |
$22,871 |
7/31/2021 |
$23,676 |
$29,760 |
$23,258 |
8/31/2021 |
$24,394 |
$30,873 |
$23,921 |
9/30/2021 |
$22,954 |
$29,144 |
$22,848 |
10/31/2021 |
$24,373 |
$31,668 |
$24,393 |
11/30/2021 |
$24,037 |
$31,861 |
$24,021 |
12/31/2021 |
$24,319 |
$32,535 |
$24,967 |
1/31/2022 |
$21,854 |
$29,743 |
$23,498 |
2/28/2022 |
$21,095 |
$28,479 |
$22,906 |
3/31/2022 |
$21,639 |
$29,594 |
$23,649 |
4/30/2022 |
$18,700 |
$26,020 |
$21,527 |
5/31/2022 |
$18,305 |
$25,415 |
$21,498 |
6/30/2022 |
$16,863 |
$23,402 |
$19,700 |
7/31/2022 |
$18,754 |
$26,210 |
$21,548 |
8/31/2022 |
$17,846 |
$24,989 |
$20,744 |
9/30/2022 |
$16,159 |
$22,560 |
$18,820 |
10/31/2022 |
$16,963 |
$23,879 |
$20,364 |
11/30/2022 |
$17,986 |
$24,967 |
$21,426 |
12/31/2022 |
$16,787 |
$23,055 |
$20,172 |
1/31/2023 |
$17,986 |
$24,977 |
$21,561 |
2/28/2023 |
$17,681 |
$24,680 |
$21,057 |
3/31/2023 |
$18,886 |
$26,367 |
$21,620 |
4/30/2023 |
$19,302 |
$26,628 |
$21,851 |
5/31/2023 |
$19,952 |
$27,841 |
$21,936 |
6/30/2023 |
$21,290 |
$29,745 |
$23,433 |
7/31/2023 |
$21,729 |
$30,747 |
$24,273 |
8/31/2023 |
$21,640 |
$30,471 |
$23,805 |
9/30/2023 |
$20,463 |
$28,814 |
$22,671 |
10/31/2023 |
$20,319 |
$28,404 |
$22,070 |
11/30/2023 |
$22,673 |
$31,500 |
$24,128 |
12/31/2023 |
$23,570 |
$32,895 |
$25,408 |
1/31/2024 |
$24,772 |
$33,715 |
$25,689 |
2/29/2024 |
$26,685 |
$36,016 |
$27,080 |
3/31/2024 |
$27,169 |
$36,650 |
$27,953 |
4/30/2024 |
$25,732 |
$35,095 |
$26,723 |
5/31/2024 |
$27,202 |
$37,196 |
$27,986 |
6/30/2024 |
$29,183 |
$39,704 |
$28,852 |
7/31/2024 |
$28,102 |
$39,029 |
$29,389 |
8/31/2024 |
$28,995 |
$39,842 |
$30,029 |
9/30/2024 |
$29,652 |
$40,971 |
$30,650 |
10/31/2024 |
$29,545 |
$40,835 |
$30,425 |
11/30/2024 |
$31,378 |
$43,484 |
$32,449 |
12/31/2024 |
$30,672 |
$43,868 |
$31,457 |
1/31/2025 |
$31,606 |
$44,735 |
$32,450 |
2/28/2025 |
$30,447 |
$43,128 |
$31,828 |
3/31/2025 |
$28,006 |
$39,481 |
$29,971 |
4/30/2025 |
$28,555 |
$40,153 |
$29,770 |
5/31/2025 |
$31,181 |
$43,747 |
$31,657 |
6/30/2025 |
$33,569 |
$46,580 |
$33,266 |
7/31/2025 |
$34,859 |
$48,339 |
$33,998 |
|
| Average Annual Return [Table Text Block] |
|
AVERAGE ANNUAL TOTAL RETURNS (%)
AATR |
1 Year |
5 Years |
10 Years |
Class A |
24.04 |
13.38 |
13.97 |
Class A with Load |
16.91 |
12.04 |
13.30 |
Russell 1000® Growth Index |
23.85 |
17.29 |
17.07 |
Russell 3000® Index |
15.68 |
15.19 |
13.02 | |
| AssetsNet |
|
$ 1,027,019,553
|
| Holdings Count | Holding |
|
36
|
| Advisory Fees Paid, Amount |
|
$ 5,162,043
|
| InvestmentCompanyPortfolioTurnover |
|
44.00%
|
| Holdings [Text Block] |
|
SECTOR ALLOCATION (% OF LONG-TERM INVESTMENTS)
Information technology |
40.7 |
Consumer discretionary |
15.7 |
Communication services |
14.0 |
Industrials |
12.2 |
Financials |
11.4 |
Health care |
6.0 | |
| Largest Holdings [Text Block] |
|
TOP TEN HOLDINGS (% OF NET ASSETS)
Microsoft Corp. |
10.8 |
NVIDIA Corp. |
8.6 |
Amazon.com, Inc. |
7.8 |
Meta Platforms, Inc. Class A |
7.0 |
Broadcom, Inc. |
4.7 |
Apple, Inc. |
4.6 |
Oracle Corp. |
3.7 |
General Electric Co. |
2.8 |
Alphabet, Inc. Class A |
2.5 |
Netflix, Inc. |
2.5 | |
| Material Fund Change [Text Block] |
|
|
| C000092782 |
|
|
| Shareholder Report [Line Items] |
|
|
| Fund Name |
|
Large Cap Growth Fund
|
| Class Name |
|
Administrator Class
|
| Trading Symbol |
|
STDFX
|
| Annual or Semi-Annual Statement [Text Block] |
|
This annual shareholder report contains important information about Large Cap Growth Fund for the period from August 1, 2024 to July 31, 2025.
|
| Shareholder Report Annual or Semi-Annual |
|
Annual Shareholder Report
|
| Additional Information [Text Block] |
|
You can find additional information about the Fund at allspringglobal.com. You can also request this information by contacting us at 1-800-222-8222.
|
| Additional Information Phone Number |
|
<span style="white-space: nowrap; box-sizing: border-box; color: rgb(0, 0, 0); display: inline; flex-wrap: nowrap; font-size: 12px; font-weight: 400; grid-area: auto; line-height: 18px; margin: 0px; overflow: visible; text-align: left; text-align-last: auto;"> 1-800-222-8222.</span>
|
| Additional Information Website |
|
<span style="box-sizing: border-box; color: rgb(0, 0, 0); display: inline; flex-wrap: nowrap; font-size: 12px; font-weight: 400; grid-area: auto; line-height: 18px; margin: 0px; overflow: visible; text-align: left; text-align-last: auto; white-space-collapse: preserve-breaks;">allspringglobal.com</span>
|
| Expenses [Text Block] |
|
What were the Fund costs for the past year?The table explains the costs you would have paid within the reporting period based on a hypothetical $10,000 investment.
CLASS NAME |
COSTS OF A $10,000 INVESTMENT |
COSTS PAID AS A % OF A $10,000 INVESTMENT |
Administrator Class |
$105 |
0.94% | The manager has contractually committed to waive fees and/or reimburse certain expenses to the extent necessary to cap the Fund's total annual fund operating expense ratio at a specific amount. Without this cap, the costs shown above may have been higher. Please see the prospectus for the amount and the expiration date of the cap. Prior to or after the commitment expiration date, the cap may be increased or the commitment to maintain the cap may be terminated only with the approval of the Board of Trustees. |
| Expenses Paid, Amount |
|
$ 105
|
| Expense Ratio, Percent |
|
0.94%
|
| Factors Affecting Performance [Text Block] |
|
How did the Fund perform last year and what affected its performance?The market environment for the 12-month period that ended July 31, 2025, was bifurcated for U.S. equities. During the first half of the period, the economy was generally healthy, with moderating inflation, resilient consumer spending, and favorable earnings growth. In early 2025, the new U.S. administration took office and implemented policies on government spending, immigration, and tariffs. Financial market sentiment grew concerned and volatility spiked until the administration temporarily paused tariffs. With uncertainty easing, overall corporate earnings generally exceeded expectations and propelled growth indexes upward. Artificial intelligence (AI) was a key driver as leading technology firms ramped up capital expenditures on AI infrastructure. The portfolio benefited from security selection within communication services and consumer discretionary, where holdings with innovative services and strong demand, such as Meta Platforms, Inc. and DoorDash, Inc. contributed. In contrast, relative underweights to select mega-cap technology companies, including NVIDIA Corp. and Broadcom, Inc. detracted from returns. |
| Line Graph [Table Text Block] |
|

|
Administrator Class |
Russell 1000® Growth Index |
Russell 3000® Index |
7/31/2015 |
$10,000 |
$10,000 |
$10,000 |
8/31/2015 |
$9,390 |
$9,393 |
$9,396 |
9/30/2015 |
$9,165 |
$9,160 |
$9,122 |
10/31/2015 |
$9,950 |
$9,949 |
$9,843 |
11/30/2015 |
$9,962 |
$9,977 |
$9,898 |
12/31/2015 |
$9,759 |
$9,831 |
$9,694 |
1/31/2016 |
$8,976 |
$9,282 |
$9,147 |
2/29/2016 |
$8,872 |
$9,278 |
$9,144 |
3/31/2016 |
$9,367 |
$9,904 |
$9,788 |
4/30/2016 |
$9,367 |
$9,813 |
$9,849 |
5/31/2016 |
$9,543 |
$10,004 |
$10,025 |
6/30/2016 |
$9,297 |
$9,964 |
$10,046 |
7/31/2016 |
$9,829 |
$10,435 |
$10,444 |
8/31/2016 |
$9,774 |
$10,383 |
$10,471 |
9/30/2016 |
$9,770 |
$10,421 |
$10,488 |
10/31/2016 |
$9,524 |
$10,176 |
$10,261 |
11/30/2016 |
$9,602 |
$10,398 |
$10,720 |
12/31/2016 |
$9,529 |
$10,526 |
$10,929 |
1/31/2017 |
$9,958 |
$10,881 |
$11,135 |
2/28/2017 |
$10,318 |
$11,333 |
$11,549 |
3/31/2017 |
$10,441 |
$11,464 |
$11,557 |
4/30/2017 |
$10,742 |
$11,726 |
$11,679 |
5/31/2017 |
$11,089 |
$12,031 |
$11,799 |
6/30/2017 |
$10,959 |
$11,999 |
$11,905 |
7/31/2017 |
$11,279 |
$12,318 |
$12,130 |
8/31/2017 |
$11,462 |
$12,544 |
$12,153 |
9/30/2017 |
$11,699 |
$12,707 |
$12,449 |
10/31/2017 |
$12,202 |
$13,200 |
$12,721 |
11/30/2017 |
$12,557 |
$13,601 |
$13,107 |
12/31/2017 |
$12,681 |
$13,707 |
$13,238 |
1/31/2018 |
$13,845 |
$14,677 |
$13,936 |
2/28/2018 |
$13,633 |
$14,292 |
$13,423 |
3/31/2018 |
$13,286 |
$13,901 |
$13,153 |
4/30/2018 |
$13,349 |
$13,949 |
$13,203 |
5/31/2018 |
$14,021 |
$14,561 |
$13,576 |
6/30/2018 |
$14,089 |
$14,701 |
$13,665 |
7/31/2018 |
$14,452 |
$15,132 |
$14,118 |
8/31/2018 |
$15,099 |
$15,960 |
$14,614 |
9/30/2018 |
$15,280 |
$16,049 |
$14,638 |
10/31/2018 |
$13,704 |
$14,614 |
$13,560 |
11/30/2018 |
$13,922 |
$14,769 |
$13,832 |
12/31/2018 |
$12,777 |
$13,499 |
$12,544 |
1/31/2019 |
$14,016 |
$14,712 |
$13,621 |
2/28/2019 |
$14,645 |
$15,239 |
$14,100 |
3/31/2019 |
$15,010 |
$15,673 |
$14,306 |
4/30/2019 |
$15,891 |
$16,381 |
$14,877 |
5/31/2019 |
$14,953 |
$15,346 |
$13,915 |
6/30/2019 |
$15,830 |
$16,400 |
$14,892 |
7/31/2019 |
$16,063 |
$16,770 |
$15,113 |
8/31/2019 |
$15,719 |
$16,642 |
$14,805 |
9/30/2019 |
$15,730 |
$16,644 |
$15,065 |
10/31/2019 |
$15,895 |
$17,113 |
$15,389 |
11/30/2019 |
$16,553 |
$17,872 |
$15,974 |
12/31/2019 |
$16,973 |
$18,411 |
$16,436 |
1/31/2020 |
$17,520 |
$18,823 |
$16,418 |
2/29/2020 |
$16,316 |
$17,541 |
$15,074 |
3/31/2020 |
$14,384 |
$15,815 |
$13,001 |
4/30/2020 |
$16,694 |
$18,156 |
$14,722 |
5/31/2020 |
$17,993 |
$19,375 |
$15,510 |
6/30/2020 |
$18,528 |
$20,218 |
$15,864 |
7/31/2020 |
$19,858 |
$21,774 |
$16,765 |
8/31/2020 |
$21,633 |
$24,021 |
$17,980 |
9/30/2020 |
$20,610 |
$22,890 |
$17,325 |
10/31/2020 |
$19,846 |
$22,113 |
$16,951 |
11/30/2020 |
$21,719 |
$24,377 |
$19,013 |
12/31/2020 |
$22,454 |
$25,498 |
$19,869 |
1/31/2021 |
$21,802 |
$25,310 |
$19,780 |
2/28/2021 |
$22,409 |
$25,304 |
$20,399 |
3/31/2021 |
$22,387 |
$25,739 |
$21,130 |
4/30/2021 |
$23,922 |
$27,490 |
$22,219 |
5/31/2021 |
$23,423 |
$27,110 |
$22,320 |
6/30/2021 |
$24,629 |
$28,810 |
$22,871 |
7/31/2021 |
$25,296 |
$29,760 |
$23,258 |
8/31/2021 |
$26,066 |
$30,873 |
$23,921 |
9/30/2021 |
$24,526 |
$29,144 |
$22,848 |
10/31/2021 |
$26,048 |
$31,668 |
$24,393 |
11/30/2021 |
$25,687 |
$31,861 |
$24,021 |
12/31/2021 |
$25,996 |
$32,535 |
$24,967 |
1/31/2022 |
$23,361 |
$29,743 |
$23,498 |
2/28/2022 |
$22,549 |
$28,479 |
$22,906 |
3/31/2022 |
$23,132 |
$29,594 |
$23,649 |
4/30/2022 |
$19,992 |
$26,020 |
$21,527 |
5/31/2022 |
$19,570 |
$25,415 |
$21,498 |
6/30/2022 |
$18,034 |
$23,402 |
$19,700 |
7/31/2022 |
$20,054 |
$26,210 |
$21,548 |
8/31/2022 |
$19,086 |
$24,989 |
$20,744 |
9/30/2022 |
$17,284 |
$22,560 |
$18,820 |
10/31/2022 |
$18,143 |
$23,879 |
$20,364 |
11/30/2022 |
$19,242 |
$24,967 |
$21,426 |
12/31/2022 |
$17,959 |
$23,055 |
$20,172 |
1/31/2023 |
$19,242 |
$24,977 |
$21,561 |
2/28/2023 |
$18,919 |
$24,680 |
$21,057 |
3/31/2023 |
$20,213 |
$26,367 |
$21,620 |
4/30/2023 |
$20,658 |
$26,628 |
$21,851 |
5/31/2023 |
$21,357 |
$27,841 |
$21,936 |
6/30/2023 |
$22,796 |
$29,745 |
$23,433 |
7/31/2023 |
$23,264 |
$30,747 |
$24,273 |
8/31/2023 |
$23,172 |
$30,471 |
$23,805 |
9/30/2023 |
$21,912 |
$28,814 |
$22,671 |
10/31/2023 |
$21,756 |
$28,404 |
$22,070 |
11/30/2023 |
$24,287 |
$31,500 |
$24,128 |
12/31/2023 |
$25,250 |
$32,895 |
$25,408 |
1/31/2024 |
$26,535 |
$33,715 |
$25,689 |
2/29/2024 |
$28,591 |
$36,016 |
$27,080 |
3/31/2024 |
$29,104 |
$36,650 |
$27,953 |
4/30/2024 |
$27,577 |
$35,095 |
$26,723 |
5/31/2024 |
$29,153 |
$37,196 |
$27,986 |
6/30/2024 |
$31,278 |
$39,704 |
$28,852 |
7/31/2024 |
$30,111 |
$39,029 |
$29,389 |
8/31/2024 |
$31,070 |
$39,842 |
$30,029 |
9/30/2024 |
$31,771 |
$40,971 |
$30,650 |
10/31/2024 |
$31,667 |
$40,835 |
$30,425 |
11/30/2024 |
$33,632 |
$43,484 |
$32,449 |
12/31/2024 |
$32,873 |
$43,868 |
$31,457 |
1/31/2025 |
$33,883 |
$44,735 |
$32,450 |
2/28/2025 |
$32,643 |
$43,128 |
$31,828 |
3/31/2025 |
$30,019 |
$39,481 |
$29,971 |
4/30/2025 |
$30,608 |
$40,153 |
$29,770 |
5/31/2025 |
$33,430 |
$43,747 |
$31,657 |
6/30/2025 |
$35,982 |
$46,580 |
$33,266 |
7/31/2025 |
$37,365 |
$48,339 |
$33,998 |
|
| Average Annual Return [Table Text Block] |
|
AVERAGE ANNUAL TOTAL RETURNS (%)
AATR |
1 Year |
5 Years |
10 Years |
Administrator Class |
24.09 |
13.48 |
14.09 |
Russell 1000® Growth Index |
23.85 |
17.29 |
17.07 |
Russell 3000® Index |
15.68 |
15.19 |
13.02 | |
| AssetsNet |
|
$ 1,027,019,553
|
| Holdings Count | Holding |
|
36
|
| Advisory Fees Paid, Amount |
|
$ 5,162,043
|
| InvestmentCompanyPortfolioTurnover |
|
44.00%
|
| Holdings [Text Block] |
|
SECTOR ALLOCATION (% OF LONG-TERM INVESTMENTS)
Information technology |
40.7 |
Consumer discretionary |
15.7 |
Communication services |
14.0 |
Industrials |
12.2 |
Financials |
11.4 |
Health care |
6.0 | |
| Largest Holdings [Text Block] |
|
TOP TEN HOLDINGS (% OF NET ASSETS)
Microsoft Corp. |
10.8 |
NVIDIA Corp. |
8.6 |
Amazon.com, Inc. |
7.8 |
Meta Platforms, Inc. Class A |
7.0 |
Broadcom, Inc. |
4.7 |
Apple, Inc. |
4.6 |
Oracle Corp. |
3.7 |
General Electric Co. |
2.8 |
Alphabet, Inc. Class A |
2.5 |
Netflix, Inc. |
2.5 | |
| Material Fund Change [Text Block] |
|
|
| C000089290 |
|
|
| Shareholder Report [Line Items] |
|
|
| Fund Name |
|
Premier Large Company Growth Fund
|
| Class Name |
|
Institutional Class
|
| Trading Symbol |
|
EKJYX
|
| Annual or Semi-Annual Statement [Text Block] |
|
This annual shareholder report contains important information about Premier Large Company Growth Fund for the period from August 1, 2024 to July 31, 2025.
|
| Shareholder Report Annual or Semi-Annual |
|
Annual Shareholder Report
|
| Additional Information [Text Block] |
|
You can find additional information about the Fund at allspringglobal.com. You can also request this information by contacting us at 1-800-222-8222.
|
| Additional Information Phone Number |
|
<span style="white-space: nowrap; box-sizing: border-box; color: rgb(0, 0, 0); display: inline; flex-wrap: nowrap; font-size: 12px; font-weight: 400; grid-area: auto; line-height: 18px; margin: 0px; overflow: visible; text-align: left; text-align-last: auto;"> 1-800-222-8222.</span>
|
| Additional Information Website |
|
<span style="box-sizing: border-box; color: rgb(0, 0, 0); display: inline; flex-wrap: nowrap; font-size: 12px; font-weight: 400; grid-area: auto; line-height: 18px; margin: 0px; overflow: visible; text-align: left; text-align-last: auto; white-space-collapse: preserve-breaks;">allspringglobal.com</span>
|
| Expenses [Text Block] |
|
What were the Fund costs for the past year?The table explains the costs you would have paid within the reporting period based on a hypothetical $10,000 investment.
CLASS NAME |
COSTS OF A $10,000 INVESTMENT |
COSTS PAID AS A % OF A $10,000 INVESTMENT |
Institutional Class |
$81 |
0.70% | The manager has contractually committed to waive fees and/or reimburse certain expenses to the extent necessary to cap the Fund's total annual fund operating expense ratio at a specific amount. Without this cap, the costs shown above may have been higher. Please see the prospectus for the amount and the expiration date of the cap. Prior to or after the commitment expiration date, the cap may be increased or the commitment to maintain the cap may be terminated only with the approval of the Board of Trustees. |
| Expenses Paid, Amount |
|
$ 81
|
| Expense Ratio, Percent |
|
0.70%
|
| Factors Affecting Performance [Text Block] |
|
How did the Fund perform last year and what affected its performance?The market environment for the 12-month period that ended July 31, 2025, was bifurcated for U.S. equities. During the first half of the period, the economy was generally healthy, with moderating inflation, resilient consumer spending, and favorable earnings growth. In early 2025, the new U.S. administration took office and implemented policies on government spending, immigration, and tariffs. Financial market sentiment grew concerned and volatility spiked until the administration temporarily paused tariffs. With uncertainty easing, overall corporate earnings generally exceeded expectations and propelled growth indexes upward. Artificial intelligence (AI) was a key driver as leading technology firms ramped up capital expenditures on AI infrastructure. The portfolio benefited from security selection within information technology, industrials, and communication services, where holdings with innovative products and strong demand, such as AppLovin Corp., Axon Enterprise, Inc. and Roblox Corp., contributed. In contrast, relative underweights to select mega-cap technology companies, including NVIDIA Corp., Broadcom, Inc. and Netflix, Inc. detracted from returns. |
| Line Graph [Table Text Block] |
|

|
Institutional Class |
Russell 1000® Growth Index |
Russell 3000® Index |
7/31/2015 |
$10,000 |
$10,000 |
$10,000 |
8/31/2015 |
$9,350 |
$9,393 |
$9,396 |
9/30/2015 |
$9,097 |
$9,160 |
$9,122 |
10/31/2015 |
$9,705 |
$9,949 |
$9,843 |
11/30/2015 |
$9,795 |
$9,977 |
$9,898 |
12/31/2015 |
$9,645 |
$9,831 |
$9,694 |
1/31/2016 |
$8,806 |
$9,282 |
$9,147 |
2/29/2016 |
$8,696 |
$9,278 |
$9,144 |
3/31/2016 |
$9,225 |
$9,904 |
$9,788 |
4/30/2016 |
$9,232 |
$9,813 |
$9,849 |
5/31/2016 |
$9,445 |
$10,004 |
$10,025 |
6/30/2016 |
$9,186 |
$9,964 |
$10,046 |
7/31/2016 |
$9,715 |
$10,435 |
$10,444 |
8/31/2016 |
$9,664 |
$10,383 |
$10,471 |
9/30/2016 |
$9,703 |
$10,421 |
$10,488 |
10/31/2016 |
$9,380 |
$10,176 |
$10,261 |
11/30/2016 |
$9,425 |
$10,398 |
$10,720 |
12/31/2016 |
$9,334 |
$10,526 |
$10,929 |
1/31/2017 |
$9,798 |
$10,881 |
$11,135 |
2/28/2017 |
$10,177 |
$11,333 |
$11,549 |
3/31/2017 |
$10,312 |
$11,464 |
$11,557 |
4/30/2017 |
$10,670 |
$11,726 |
$11,679 |
5/31/2017 |
$11,055 |
$12,031 |
$11,799 |
6/30/2017 |
$10,977 |
$11,999 |
$11,905 |
7/31/2017 |
$11,312 |
$12,318 |
$12,130 |
8/31/2017 |
$11,484 |
$12,544 |
$12,153 |
9/30/2017 |
$11,669 |
$12,707 |
$12,449 |
10/31/2017 |
$12,119 |
$13,200 |
$12,721 |
11/30/2017 |
$12,448 |
$13,601 |
$13,107 |
12/31/2017 |
$12,549 |
$13,707 |
$13,238 |
1/31/2018 |
$13,676 |
$14,677 |
$13,936 |
2/28/2018 |
$13,449 |
$14,292 |
$13,423 |
3/31/2018 |
$13,212 |
$13,901 |
$13,153 |
4/30/2018 |
$13,258 |
$13,949 |
$13,203 |
5/31/2018 |
$13,913 |
$14,561 |
$13,576 |
6/30/2018 |
$14,067 |
$14,701 |
$13,665 |
7/31/2018 |
$14,385 |
$15,132 |
$14,118 |
8/31/2018 |
$15,167 |
$15,960 |
$14,614 |
9/30/2018 |
$15,313 |
$16,049 |
$14,638 |
10/31/2018 |
$13,722 |
$14,614 |
$13,560 |
11/30/2018 |
$13,949 |
$14,769 |
$13,832 |
12/31/2018 |
$12,715 |
$13,499 |
$12,544 |
1/31/2019 |
$14,004 |
$14,712 |
$13,621 |
2/28/2019 |
$14,751 |
$15,239 |
$14,100 |
3/31/2019 |
$15,076 |
$15,673 |
$14,306 |
4/30/2019 |
$15,921 |
$16,381 |
$14,877 |
5/31/2019 |
$15,217 |
$15,346 |
$13,915 |
6/30/2019 |
$16,105 |
$16,400 |
$14,892 |
7/31/2019 |
$16,310 |
$16,770 |
$15,113 |
8/31/2019 |
$16,105 |
$16,642 |
$14,805 |
9/30/2019 |
$15,834 |
$16,644 |
$15,065 |
10/31/2019 |
$16,050 |
$17,113 |
$15,389 |
11/30/2019 |
$16,765 |
$17,872 |
$15,974 |
12/31/2019 |
$17,001 |
$18,411 |
$16,436 |
1/31/2020 |
$17,655 |
$18,823 |
$16,418 |
2/29/2020 |
$16,487 |
$17,541 |
$15,074 |
3/31/2020 |
$14,245 |
$15,815 |
$13,001 |
4/30/2020 |
$16,604 |
$18,156 |
$14,722 |
5/31/2020 |
$17,947 |
$19,375 |
$15,510 |
6/30/2020 |
$18,694 |
$20,218 |
$15,864 |
7/31/2020 |
$20,107 |
$21,774 |
$16,765 |
8/31/2020 |
$21,578 |
$24,021 |
$17,980 |
9/30/2020 |
$20,878 |
$22,890 |
$17,325 |
10/31/2020 |
$20,598 |
$22,113 |
$16,951 |
11/30/2020 |
$22,828 |
$24,377 |
$19,013 |
12/31/2020 |
$23,792 |
$25,498 |
$19,869 |
1/31/2021 |
$23,492 |
$25,310 |
$19,780 |
2/28/2021 |
$24,482 |
$25,304 |
$20,399 |
3/31/2021 |
$24,104 |
$25,739 |
$21,130 |
4/30/2021 |
$25,668 |
$27,490 |
$22,219 |
5/31/2021 |
$24,834 |
$27,110 |
$22,320 |
6/30/2021 |
$26,397 |
$28,810 |
$22,871 |
7/31/2021 |
$27,231 |
$29,760 |
$23,258 |
8/31/2021 |
$28,065 |
$30,873 |
$23,921 |
9/30/2021 |
$26,671 |
$29,144 |
$22,848 |
10/31/2021 |
$28,691 |
$31,668 |
$24,393 |
11/30/2021 |
$27,375 |
$31,861 |
$24,021 |
12/31/2021 |
$27,158 |
$32,535 |
$24,967 |
1/31/2022 |
$23,887 |
$29,743 |
$23,498 |
2/28/2022 |
$23,449 |
$28,479 |
$22,906 |
3/31/2022 |
$23,692 |
$29,594 |
$23,649 |
4/30/2022 |
$20,534 |
$26,020 |
$21,527 |
5/31/2022 |
$20,032 |
$25,415 |
$21,498 |
6/30/2022 |
$18,559 |
$23,402 |
$19,700 |
7/31/2022 |
$20,777 |
$26,210 |
$21,548 |
8/31/2022 |
$19,870 |
$24,989 |
$20,744 |
9/30/2022 |
$17,927 |
$22,560 |
$18,820 |
10/31/2022 |
$18,640 |
$23,879 |
$20,364 |
11/30/2022 |
$19,385 |
$24,967 |
$21,426 |
12/31/2022 |
$18,008 |
$23,055 |
$20,172 |
1/31/2023 |
$19,449 |
$24,977 |
$21,561 |
2/28/2023 |
$19,044 |
$24,680 |
$21,057 |
3/31/2023 |
$20,097 |
$26,367 |
$21,620 |
4/30/2023 |
$20,227 |
$26,628 |
$21,851 |
5/31/2023 |
$20,810 |
$27,841 |
$21,936 |
6/30/2023 |
$22,283 |
$29,745 |
$23,433 |
7/31/2023 |
$22,688 |
$30,747 |
$24,273 |
8/31/2023 |
$22,397 |
$30,471 |
$23,805 |
9/30/2023 |
$21,130 |
$28,814 |
$22,671 |
10/31/2023 |
$20,763 |
$28,404 |
$22,070 |
11/30/2023 |
$23,167 |
$31,500 |
$24,128 |
12/31/2023 |
$24,045 |
$32,895 |
$25,408 |
1/31/2024 |
$25,168 |
$33,715 |
$25,689 |
2/29/2024 |
$27,392 |
$36,016 |
$27,080 |
3/31/2024 |
$28,031 |
$36,650 |
$27,953 |
4/30/2024 |
$26,578 |
$35,095 |
$26,723 |
5/31/2024 |
$28,163 |
$37,196 |
$27,986 |
6/30/2024 |
$29,528 |
$39,704 |
$28,852 |
7/31/2024 |
$28,868 |
$39,029 |
$29,389 |
8/31/2024 |
$30,233 |
$39,842 |
$30,029 |
9/30/2024 |
$31,202 |
$40,971 |
$30,650 |
10/31/2024 |
$31,444 |
$40,835 |
$30,425 |
11/30/2024 |
$34,306 |
$43,484 |
$32,449 |
12/31/2024 |
$33,109 |
$43,868 |
$31,457 |
1/31/2025 |
$34,260 |
$44,735 |
$32,450 |
2/28/2025 |
$32,725 |
$43,128 |
$31,828 |
3/31/2025 |
$29,655 |
$39,481 |
$29,971 |
4/30/2025 |
$30,601 |
$40,153 |
$29,770 |
5/31/2025 |
$34,030 |
$43,747 |
$31,657 |
6/30/2025 |
$36,972 |
$46,580 |
$33,266 |
7/31/2025 |
$38,149 |
$48,339 |
$33,998 |
|
| Average Annual Return [Table Text Block] |
|
AVERAGE ANNUAL TOTAL RETURNS (%)
AATR |
1 Year |
5 Years |
10 Years |
Institutional Class |
32.15 |
13.67 |
14.33 |
Russell 1000® Growth Index |
23.85 |
17.29 |
17.07 |
Russell 3000® Index |
15.68 |
15.19 |
13.02 | |
| AssetsNet |
|
$ 1,480,254,613
|
| Holdings Count | Holding |
|
60
|
| Advisory Fees Paid, Amount |
|
$ 8,593,474
|
| InvestmentCompanyPortfolioTurnover |
|
63.00%
|
| Holdings [Text Block] |
|
SECTOR ALLOCATION (% OF LONG-TERM INVESTMENTS)
Information technology |
39.1 |
Communication services |
15.1 |
Consumer discretionary |
15.0 |
Industrials |
12.8 |
Financials |
10.6 |
Health care |
6.1 |
Utilities |
1.3 | |
| Largest Holdings [Text Block] |
|
TOP TEN HOLDINGS (% OF NET ASSETS)
NVIDIA Corp. |
9.1 |
Microsoft Corp. |
8.8 |
Meta Platforms, Inc. Class A |
6.3 |
Amazon.com, Inc. |
4.7 |
Broadcom, Inc. |
4.4 |
Oracle Corp. |
2.5 |
DoorDash, Inc. Class A |
2.0 |
Mastercard, Inc. Class A |
2.0 |
Booking Holdings, Inc. |
1.8 |
Arista Networks, Inc. |
1.7 | |
| Material Fund Change [Text Block] |
|
|
| C000120086 |
|
|
| Shareholder Report [Line Items] |
|
|
| Fund Name |
|
Premier Large Company Growth Fund
|
| Class Name |
|
Class R6
|
| Trading Symbol |
|
EKJFX
|
| Annual or Semi-Annual Statement [Text Block] |
|
This annual shareholder report contains important information about Premier Large Company Growth Fund for the period from August 1, 2024 to July 31, 2025.
|
| Shareholder Report Annual or Semi-Annual |
|
Annual Shareholder Report
|
| Additional Information [Text Block] |
|
You can find additional information about the Fund at allspringglobal.com. You can also request this information by contacting us at 1-800-222-8222.
|
| Additional Information Phone Number |
|
<span style="white-space: nowrap; box-sizing: border-box; color: rgb(0, 0, 0); display: inline; flex-wrap: nowrap; font-size: 12px; font-weight: 400; grid-area: auto; line-height: 18px; margin: 0px; overflow: visible; text-align: left; text-align-last: auto;"> 1-800-222-8222.</span>
|
| Additional Information Website |
|
<span style="box-sizing: border-box; color: rgb(0, 0, 0); display: inline; flex-wrap: nowrap; font-size: 12px; font-weight: 400; grid-area: auto; line-height: 18px; margin: 0px; overflow: visible; text-align: left; text-align-last: auto; white-space-collapse: preserve-breaks;">allspringglobal.com</span>
|
| Expenses [Text Block] |
|
What were the Fund costs for the past year?The table explains the costs you would have paid within the reporting period based on a hypothetical $10,000 investment.
CLASS NAME |
COSTS OF A $10,000 INVESTMENT |
COSTS PAID AS A % OF A $10,000 INVESTMENT |
Class R6 |
$75 |
0.65% | The manager has contractually committed to waive fees and/or reimburse certain expenses to the extent necessary to cap the Fund's total annual fund operating expense ratio at a specific amount. Without this cap, the costs shown above may have been higher. Please see the prospectus for the amount and the expiration date of the cap. Prior to or after the commitment expiration date, the cap may be increased or the commitment to maintain the cap may be terminated only with the approval of the Board of Trustees. |
| Expenses Paid, Amount |
|
$ 75
|
| Expense Ratio, Percent |
|
0.65%
|
| Factors Affecting Performance [Text Block] |
|
How did the Fund perform last year and what affected its performance?The market environment for the 12-month period that ended July 31, 2025, was bifurcated for U.S. equities. During the first half of the period, the economy was generally healthy, with moderating inflation, resilient consumer spending, and favorable earnings growth. In early 2025, the new U.S. administration took office and implemented policies on government spending, immigration, and tariffs. Financial market sentiment grew concerned and volatility spiked until the administration temporarily paused tariffs. With uncertainty easing, overall corporate earnings generally exceeded expectations and propelled growth indexes upward. Artificial intelligence (AI) was a key driver as leading technology firms ramped up capital expenditures on AI infrastructure. The portfolio benefited from security selection within information technology, industrials, and communication services, where holdings with innovative products and strong demand, such as AppLovin Corp., Axon Enterprise, Inc. and Roblox Corp., contributed. In contrast, relative underweights to select mega-cap technology companies, including NVIDIA Corp., Broadcom, Inc. and Netflix, Inc. detracted from returns. |
| Line Graph [Table Text Block] |
|
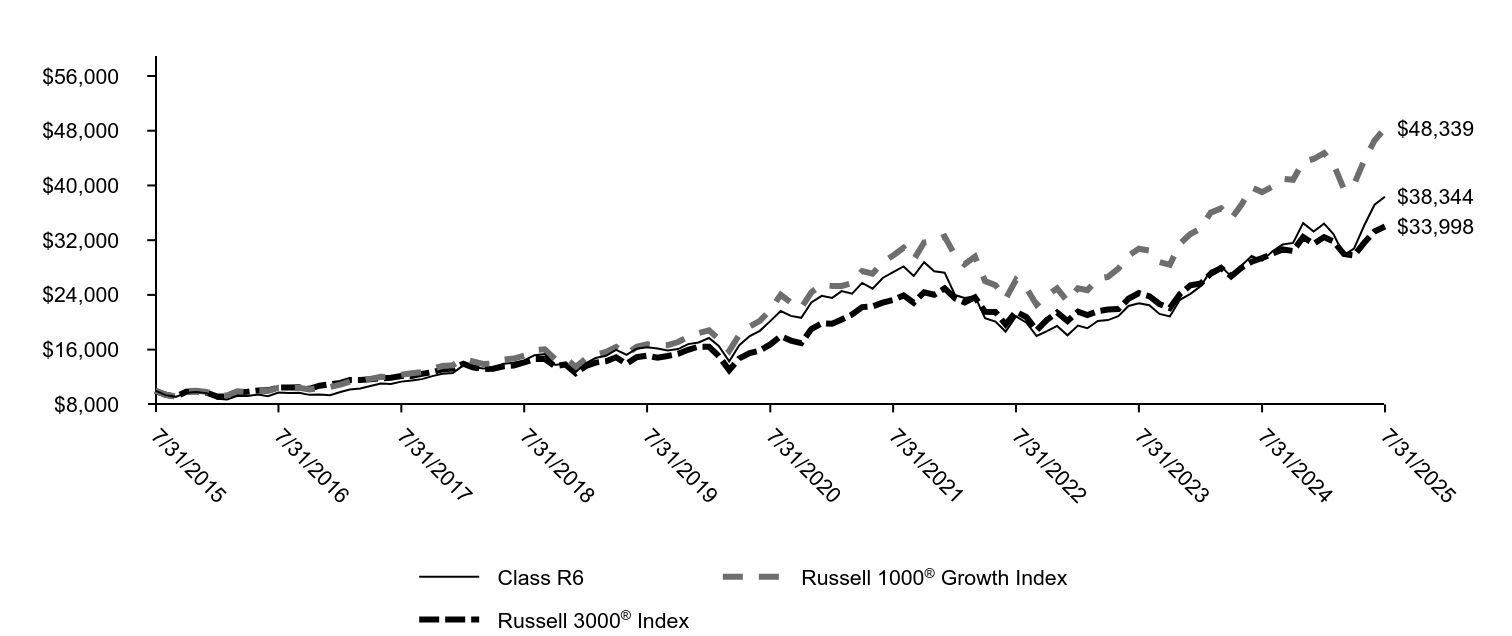
|
Class R6 |
Russell 1000® Growth Index |
Russell 3000® Index |
7/31/2015 |
$10,000 |
$10,000 |
$10,000 |
8/31/2015 |
$9,350 |
$9,393 |
$9,396 |
9/30/2015 |
$9,097 |
$9,160 |
$9,122 |
10/31/2015 |
$9,711 |
$9,949 |
$9,843 |
11/30/2015 |
$9,801 |
$9,977 |
$9,898 |
12/31/2015 |
$9,645 |
$9,831 |
$9,694 |
1/31/2016 |
$8,807 |
$9,282 |
$9,147 |
2/29/2016 |
$8,697 |
$9,278 |
$9,144 |
3/31/2016 |
$9,232 |
$9,904 |
$9,788 |
4/30/2016 |
$9,239 |
$9,813 |
$9,849 |
5/31/2016 |
$9,451 |
$10,004 |
$10,025 |
6/30/2016 |
$9,193 |
$9,964 |
$10,046 |
7/31/2016 |
$9,722 |
$10,435 |
$10,444 |
8/31/2016 |
$9,671 |
$10,383 |
$10,471 |
9/30/2016 |
$9,709 |
$10,421 |
$10,488 |
10/31/2016 |
$9,387 |
$10,176 |
$10,261 |
11/30/2016 |
$9,432 |
$10,398 |
$10,720 |
12/31/2016 |
$9,341 |
$10,526 |
$10,929 |
1/31/2017 |
$9,812 |
$10,881 |
$11,135 |
2/28/2017 |
$10,183 |
$11,333 |
$11,549 |
3/31/2017 |
$10,319 |
$11,464 |
$11,557 |
4/30/2017 |
$10,682 |
$11,726 |
$11,679 |
5/31/2017 |
$11,061 |
$12,031 |
$11,799 |
6/30/2017 |
$10,989 |
$11,999 |
$11,905 |
7/31/2017 |
$11,325 |
$12,318 |
$12,130 |
8/31/2017 |
$11,503 |
$12,544 |
$12,153 |
9/30/2017 |
$11,689 |
$12,707 |
$12,449 |
10/31/2017 |
$12,131 |
$13,200 |
$12,721 |
11/30/2017 |
$12,459 |
$13,601 |
$13,107 |
12/31/2017 |
$12,569 |
$13,707 |
$13,238 |
1/31/2018 |
$13,695 |
$14,677 |
$13,936 |
2/28/2018 |
$13,468 |
$14,292 |
$13,423 |
3/31/2018 |
$13,232 |
$13,901 |
$13,153 |
4/30/2018 |
$13,277 |
$13,949 |
$13,203 |
5/31/2018 |
$13,931 |
$14,561 |
$13,576 |
6/30/2018 |
$14,086 |
$14,701 |
$13,665 |
7/31/2018 |
$14,413 |
$15,132 |
$14,118 |
8/31/2018 |
$15,194 |
$15,960 |
$14,614 |
9/30/2018 |
$15,339 |
$16,049 |
$14,638 |
10/31/2018 |
$13,750 |
$14,614 |
$13,560 |
11/30/2018 |
$13,977 |
$14,769 |
$13,832 |
12/31/2018 |
$12,745 |
$13,499 |
$12,544 |
1/31/2019 |
$14,031 |
$14,712 |
$13,621 |
2/28/2019 |
$14,777 |
$15,239 |
$14,100 |
3/31/2019 |
$15,101 |
$15,673 |
$14,306 |
4/30/2019 |
$15,955 |
$16,381 |
$14,877 |
5/31/2019 |
$15,252 |
$15,346 |
$13,915 |
6/30/2019 |
$16,139 |
$16,400 |
$14,892 |
7/31/2019 |
$16,344 |
$16,770 |
$15,113 |
8/31/2019 |
$16,150 |
$16,642 |
$14,805 |
9/30/2019 |
$15,879 |
$16,644 |
$15,065 |
10/31/2019 |
$16,085 |
$17,113 |
$15,389 |
11/30/2019 |
$16,809 |
$17,872 |
$15,974 |
12/31/2019 |
$17,044 |
$18,411 |
$16,436 |
1/31/2020 |
$17,697 |
$18,823 |
$16,418 |
2/29/2020 |
$16,532 |
$17,541 |
$15,074 |
3/31/2020 |
$14,283 |
$15,815 |
$13,001 |
4/30/2020 |
$16,648 |
$18,156 |
$14,722 |
5/31/2020 |
$17,988 |
$19,375 |
$15,510 |
6/30/2020 |
$18,745 |
$20,218 |
$15,864 |
7/31/2020 |
$20,166 |
$21,774 |
$16,765 |
8/31/2020 |
$21,646 |
$24,021 |
$17,980 |
9/30/2020 |
$20,935 |
$22,890 |
$17,325 |
10/31/2020 |
$20,656 |
$22,113 |
$16,951 |
11/30/2020 |
$22,893 |
$24,377 |
$19,013 |
12/31/2020 |
$23,867 |
$25,498 |
$19,869 |
1/31/2021 |
$23,568 |
$25,310 |
$19,780 |
2/28/2021 |
$24,555 |
$25,304 |
$20,399 |
3/31/2021 |
$24,178 |
$25,739 |
$21,130 |
4/30/2021 |
$25,751 |
$27,490 |
$22,219 |
5/31/2021 |
$24,906 |
$27,110 |
$22,320 |
6/30/2021 |
$26,478 |
$28,810 |
$22,871 |
7/31/2021 |
$27,323 |
$29,760 |
$23,258 |
8/31/2021 |
$28,167 |
$30,873 |
$23,921 |
9/30/2021 |
$26,764 |
$29,144 |
$22,848 |
10/31/2021 |
$28,791 |
$31,668 |
$24,393 |
11/30/2021 |
$27,465 |
$31,861 |
$24,021 |
12/31/2021 |
$27,249 |
$32,535 |
$24,967 |
1/31/2022 |
$23,976 |
$29,743 |
$23,498 |
2/28/2022 |
$23,541 |
$28,479 |
$22,906 |
3/31/2022 |
$23,783 |
$29,594 |
$23,649 |
4/30/2022 |
$20,606 |
$26,020 |
$21,527 |
5/31/2022 |
$20,107 |
$25,415 |
$21,498 |
6/30/2022 |
$18,639 |
$23,402 |
$19,700 |
7/31/2022 |
$20,864 |
$26,210 |
$21,548 |
8/31/2022 |
$19,945 |
$24,989 |
$20,744 |
9/30/2022 |
$17,994 |
$22,560 |
$18,820 |
10/31/2022 |
$18,704 |
$23,879 |
$20,364 |
11/30/2022 |
$19,462 |
$24,967 |
$21,426 |
12/31/2022 |
$18,091 |
$23,055 |
$20,172 |
1/31/2023 |
$19,526 |
$24,977 |
$21,561 |
2/28/2023 |
$19,123 |
$24,680 |
$21,057 |
3/31/2023 |
$20,187 |
$26,367 |
$21,620 |
4/30/2023 |
$20,316 |
$26,628 |
$21,851 |
5/31/2023 |
$20,897 |
$27,841 |
$21,936 |
6/30/2023 |
$22,380 |
$29,745 |
$23,433 |
7/31/2023 |
$22,783 |
$30,747 |
$24,273 |
8/31/2023 |
$22,493 |
$30,471 |
$23,805 |
9/30/2023 |
$21,215 |
$28,814 |
$22,671 |
10/31/2023 |
$20,849 |
$28,404 |
$22,070 |
11/30/2023 |
$23,278 |
$31,500 |
$24,128 |
12/31/2023 |
$24,149 |
$32,895 |
$25,408 |
1/31/2024 |
$25,286 |
$33,715 |
$25,689 |
2/29/2024 |
$27,515 |
$36,016 |
$27,080 |
3/31/2024 |
$28,171 |
$36,650 |
$27,953 |
4/30/2024 |
$26,706 |
$35,095 |
$26,723 |
5/31/2024 |
$28,302 |
$37,196 |
$27,986 |
6/30/2024 |
$29,679 |
$39,704 |
$28,852 |
7/31/2024 |
$29,001 |
$39,029 |
$29,389 |
8/31/2024 |
$30,378 |
$39,842 |
$30,029 |
9/30/2024 |
$31,361 |
$40,971 |
$30,650 |
10/31/2024 |
$31,602 |
$40,835 |
$30,425 |
11/30/2024 |
$34,487 |
$43,484 |
$32,449 |
12/31/2024 |
$33,276 |
$43,868 |
$31,457 |
1/31/2025 |
$34,416 |
$44,735 |
$32,450 |
2/28/2025 |
$32,896 |
$43,128 |
$31,828 |
3/31/2025 |
$29,804 |
$39,481 |
$29,971 |
4/30/2025 |
$30,767 |
$40,153 |
$29,770 |
5/31/2025 |
$34,213 |
$43,747 |
$31,657 |
6/30/2025 |
$37,179 |
$46,580 |
$33,266 |
7/31/2025 |
$38,344 |
$48,339 |
$33,998 |
|
| Average Annual Return [Table Text Block] |
|
AVERAGE ANNUAL TOTAL RETURNS (%)
AATR |
1 Year |
5 Years |
10 Years |
Class R6 |
32.22 |
13.71 |
14.39 |
Russell 1000® Growth Index |
23.85 |
17.29 |
17.07 |
Russell 3000® Index |
15.68 |
15.19 |
13.02 | |
| AssetsNet |
|
$ 1,480,254,613
|
| Holdings Count | Holding |
|
60
|
| Advisory Fees Paid, Amount |
|
$ 8,593,474
|
| InvestmentCompanyPortfolioTurnover |
|
63.00%
|
| Holdings [Text Block] |
|
SECTOR ALLOCATION (% OF LONG-TERM INVESTMENTS)
Information technology |
39.1 |
Communication services |
15.1 |
Consumer discretionary |
15.0 |
Industrials |
12.8 |
Financials |
10.6 |
Health care |
6.1 |
Utilities |
1.3 | |
| Largest Holdings [Text Block] |
|
TOP TEN HOLDINGS (% OF NET ASSETS)
NVIDIA Corp. |
9.1 |
Microsoft Corp. |
8.8 |
Meta Platforms, Inc. Class A |
6.3 |
Amazon.com, Inc. |
4.7 |
Broadcom, Inc. |
4.4 |
Oracle Corp. |
2.5 |
DoorDash, Inc. Class A |
2.0 |
Mastercard, Inc. Class A |
2.0 |
Booking Holdings, Inc. |
1.8 |
Arista Networks, Inc. |
1.7 | |
| Material Fund Change [Text Block] |
|
|
| C000089288 |
|
|
| Shareholder Report [Line Items] |
|
|
| Fund Name |
|
Premier Large Company Growth Fund
|
| Class Name |
|
Class C
|
| Trading Symbol |
|
EKJCX
|
| Annual or Semi-Annual Statement [Text Block] |
|
This annual shareholder report contains important information about Premier Large Company Growth Fund for the period from August 1, 2024 to July 31, 2025.
|
| Shareholder Report Annual or Semi-Annual |
|
Annual Shareholder Report
|
| Additional Information [Text Block] |
|
You can find additional information about the Fund at allspringglobal.com. You can also request this information by contacting us at 1-800-222-8222.
|
| Material Fund Change Notice [Text Block] |
|
This report describes changes to the Fund that occurred either during or after the reporting period.
|
| Additional Information Phone Number |
|
<span style="white-space: nowrap; box-sizing: border-box; color: rgb(0, 0, 0); display: inline; flex-wrap: nowrap; font-size: 12px; font-weight: 400; grid-area: auto; line-height: 18px; margin: 0px; overflow: visible; text-align: left; text-align-last: auto;"> 1-800-222-8222.</span>
|
| Additional Information Website |
|
<span style="box-sizing: border-box; color: rgb(0, 0, 0); display: inline; flex-wrap: nowrap; font-size: 12px; font-weight: 400; grid-area: auto; line-height: 18px; margin: 0px; overflow: visible; text-align: left; text-align-last: auto; white-space-collapse: preserve-breaks;">allspringglobal.com</span>
|
| Expenses [Text Block] |
|
What were the Fund costs for the past year?The table explains the costs you would have paid within the reporting period based on a hypothetical $10,000 investment.
CLASS NAME |
COSTS OF A $10,000 INVESTMENT |
COSTS PAID AS A % OF A $10,000 INVESTMENT |
Class C |
$213 |
1.85% | The manager has contractually committed to waive fees and/or reimburse certain expenses to the extent necessary to cap the Fund's total annual fund operating expense ratio at a specific amount. Without this cap, the costs shown above may have been higher. Please see the prospectus for the amount and the expiration date of the cap. Prior to or after the commitment expiration date, the cap may be increased or the commitment to maintain the cap may be terminated only with the approval of the Board of Trustees. |
| Expenses Paid, Amount |
|
$ 213
|
| Expense Ratio, Percent |
|
1.85%
|
| Factors Affecting Performance [Text Block] |
|
How did the Fund perform last year and what affected its performance?The market environment for the 12-month period that ended July 31, 2025, was bifurcated for U.S. equities. During the first half of the period, the economy was generally healthy, with moderating inflation, resilient consumer spending, and favorable earnings growth. In early 2025, the new U.S. administration took office and implemented policies on government spending, immigration, and tariffs. Financial market sentiment grew concerned and volatility spiked until the administration temporarily paused tariffs. With uncertainty easing, overall corporate earnings generally exceeded expectations and propelled growth indexes upward. Artificial intelligence (AI) was a key driver as leading technology firms ramped up capital expenditures on AI infrastructure. The portfolio benefited from security selection within information technology, industrials, and communication services, where holdings with innovative products and strong demand, such as AppLovin Corp., Axon Enterprise, Inc. and Roblox Corp., contributed. In contrast, relative underweights to select mega-cap technology companies, including NVIDIA Corp., Broadcom, Inc. and Netflix, Inc. detracted from returns. |
| Line Graph [Table Text Block] |
|

|
Class C with Load |
Russell 1000® Growth Index |
Russell 3000® Index |
7/31/2015 |
$10,000 |
$10,000 |
$10,000 |
8/31/2015 |
$9,341 |
$9,393 |
$9,396 |
9/30/2015 |
$9,082 |
$9,160 |
$9,122 |
10/31/2015 |
$9,685 |
$9,949 |
$9,843 |
11/30/2015 |
$9,762 |
$9,977 |
$9,898 |
12/31/2015 |
$9,600 |
$9,831 |
$9,694 |
1/31/2016 |
$8,756 |
$9,282 |
$9,147 |
2/29/2016 |
$8,642 |
$9,278 |
$9,144 |
3/31/2016 |
$9,159 |
$9,904 |
$9,788 |
4/30/2016 |
$9,152 |
$9,813 |
$9,849 |
5/31/2016 |
$9,357 |
$10,004 |
$10,025 |
6/30/2016 |
$9,091 |
$9,964 |
$10,046 |
7/31/2016 |
$9,608 |
$10,435 |
$10,444 |
8/31/2016 |
$9,547 |
$10,383 |
$10,471 |
9/30/2016 |
$9,570 |
$10,421 |
$10,488 |
10/31/2016 |
$9,250 |
$10,176 |
$10,261 |
11/30/2016 |
$9,281 |
$10,398 |
$10,720 |
12/31/2016 |
$9,180 |
$10,526 |
$10,929 |
1/31/2017 |
$9,636 |
$10,881 |
$11,135 |
2/28/2017 |
$9,988 |
$11,333 |
$11,549 |
3/31/2017 |
$10,109 |
$11,464 |
$11,557 |
4/30/2017 |
$10,461 |
$11,726 |
$11,679 |
5/31/2017 |
$10,822 |
$12,031 |
$11,799 |
6/30/2017 |
$10,736 |
$11,999 |
$11,905 |
7/31/2017 |
$11,054 |
$12,318 |
$12,130 |
8/31/2017 |
$11,209 |
$12,544 |
$12,153 |
9/30/2017 |
$11,381 |
$12,707 |
$12,449 |
10/31/2017 |
$11,811 |
$13,200 |
$12,721 |
11/30/2017 |
$12,111 |
$13,601 |
$13,107 |
12/31/2017 |
$12,207 |
$13,707 |
$13,238 |
1/31/2018 |
$13,284 |
$14,677 |
$13,936 |
2/28/2018 |
$13,050 |
$14,292 |
$13,423 |
3/31/2018 |
$12,816 |
$13,901 |
$13,153 |
4/30/2018 |
$12,840 |
$13,949 |
$13,203 |
5/31/2018 |
$13,460 |
$14,561 |
$13,576 |
6/30/2018 |
$13,600 |
$14,701 |
$13,665 |
7/31/2018 |
$13,893 |
$15,132 |
$14,118 |
8/31/2018 |
$14,630 |
$15,960 |
$14,614 |
9/30/2018 |
$14,759 |
$16,049 |
$14,638 |
10/31/2018 |
$13,214 |
$14,614 |
$13,560 |
11/30/2018 |
$13,413 |
$14,769 |
$13,832 |
12/31/2018 |
$12,220 |
$13,499 |
$12,544 |
1/31/2019 |
$13,457 |
$14,712 |
$13,621 |
2/28/2019 |
$14,157 |
$15,239 |
$14,100 |
3/31/2019 |
$14,441 |
$15,673 |
$14,306 |
4/30/2019 |
$15,245 |
$16,381 |
$14,877 |
5/31/2019 |
$14,560 |
$15,346 |
$13,915 |
6/30/2019 |
$15,379 |
$16,400 |
$14,892 |
7/31/2019 |
$15,573 |
$16,770 |
$15,113 |
8/31/2019 |
$15,364 |
$16,642 |
$14,805 |
9/30/2019 |
$15,096 |
$16,644 |
$15,065 |
10/31/2019 |
$15,275 |
$17,113 |
$15,389 |
11/30/2019 |
$15,946 |
$17,872 |
$15,974 |
12/31/2019 |
$16,149 |
$18,411 |
$16,436 |
1/31/2020 |
$16,748 |
$18,823 |
$16,418 |
2/29/2020 |
$15,633 |
$17,541 |
$15,074 |
3/31/2020 |
$13,485 |
$15,815 |
$13,001 |
4/30/2020 |
$15,716 |
$18,156 |
$14,722 |
5/31/2020 |
$16,964 |
$19,375 |
$15,510 |
6/30/2020 |
$17,664 |
$20,218 |
$15,864 |
7/31/2020 |
$18,979 |
$21,774 |
$16,765 |
8/31/2020 |
$20,344 |
$24,021 |
$17,980 |
9/30/2020 |
$19,661 |
$22,890 |
$17,325 |
10/31/2020 |
$19,378 |
$22,113 |
$16,951 |
11/30/2020 |
$21,459 |
$24,377 |
$19,013 |
12/31/2020 |
$22,350 |
$25,498 |
$19,869 |
1/31/2021 |
$22,034 |
$25,310 |
$19,780 |
2/28/2021 |
$22,943 |
$25,304 |
$20,399 |
3/31/2021 |
$22,567 |
$25,739 |
$21,130 |
4/30/2021 |
$24,010 |
$27,490 |
$22,219 |
5/31/2021 |
$23,199 |
$27,110 |
$22,320 |
6/30/2021 |
$24,642 |
$28,810 |
$22,871 |
7/31/2021 |
$25,393 |
$29,760 |
$23,258 |
8/31/2021 |
$26,164 |
$30,873 |
$23,921 |
9/30/2021 |
$24,840 |
$29,144 |
$22,848 |
10/31/2021 |
$26,677 |
$31,668 |
$24,393 |
11/30/2021 |
$25,432 |
$31,861 |
$24,021 |
12/31/2021 |
$25,189 |
$32,535 |
$24,967 |
1/31/2022 |
$22,142 |
$29,743 |
$23,498 |
2/28/2022 |
$21,736 |
$28,479 |
$22,906 |
3/31/2022 |
$21,939 |
$29,594 |
$23,649 |
4/30/2022 |
$18,979 |
$26,020 |
$21,527 |
5/31/2022 |
$18,515 |
$25,415 |
$21,498 |
6/30/2022 |
$17,122 |
$23,402 |
$19,700 |
7/31/2022 |
$19,153 |
$26,210 |
$21,548 |
8/31/2022 |
$18,283 |
$24,989 |
$20,744 |
9/30/2022 |
$16,483 |
$22,560 |
$18,820 |
10/31/2022 |
$17,122 |
$23,879 |
$20,364 |
11/30/2022 |
$17,818 |
$24,967 |
$21,426 |
12/31/2022 |
$16,512 |
$23,055 |
$20,172 |
1/31/2023 |
$17,818 |
$24,977 |
$21,561 |
2/28/2023 |
$17,441 |
$24,680 |
$21,057 |
3/31/2023 |
$18,399 |
$26,367 |
$21,620 |
4/30/2023 |
$18,486 |
$26,628 |
$21,851 |
5/31/2023 |
$19,008 |
$27,841 |
$21,936 |
6/30/2023 |
$20,314 |
$29,745 |
$23,433 |
7/31/2023 |
$20,662 |
$30,747 |
$24,273 |
8/31/2023 |
$20,399 |
$30,471 |
$23,805 |
9/30/2023 |
$19,226 |
$28,814 |
$22,671 |
10/31/2023 |
$18,885 |
$28,404 |
$22,070 |
11/30/2023 |
$21,084 |
$31,500 |
$24,128 |
12/31/2023 |
$21,878 |
$32,895 |
$25,408 |
1/31/2024 |
$22,883 |
$33,715 |
$25,689 |
2/29/2024 |
$24,893 |
$36,016 |
$27,080 |
3/31/2024 |
$25,454 |
$36,650 |
$27,953 |
4/30/2024 |
$24,145 |
$35,095 |
$26,723 |
5/31/2024 |
$25,571 |
$37,196 |
$27,986 |
6/30/2024 |
$26,810 |
$39,704 |
$28,852 |
7/31/2024 |
$26,202 |
$39,029 |
$29,389 |
8/31/2024 |
$27,417 |
$39,842 |
$30,029 |
9/30/2024 |
$28,282 |
$40,971 |
$30,650 |
10/31/2024 |
$28,493 |
$40,835 |
$30,425 |
11/30/2024 |
$31,087 |
$43,484 |
$32,449 |
12/31/2024 |
$29,973 |
$43,868 |
$31,457 |
1/31/2025 |
$31,007 |
$44,735 |
$32,450 |
2/28/2025 |
$29,638 |
$43,128 |
$31,828 |
3/31/2025 |
$26,845 |
$39,481 |
$29,971 |
4/30/2025 |
$27,683 |
$40,153 |
$29,770 |
5/31/2025 |
$30,783 |
$43,747 |
$31,657 |
6/30/2025 |
$33,437 |
$46,580 |
$33,266 |
7/31/2025 |
$34,471 |
$48,339 |
$33,998 |
|
| Average Annual Return [Table Text Block] |
|
AVERAGE ANNUAL TOTAL RETURNS (%)
AATR |
1 Year |
5 Years |
10 Years |
Class C |
30.78 |
12.35 |
13.17 |
Class C with Load |
29.78 |
12.35 |
13.17 |
Russell 1000® Growth Index |
23.85 |
17.29 |
17.07 |
Russell 3000® Index |
15.68 |
15.19 |
13.02 | |
| Material Change Date |
Aug. 01, 2024
|
|
| AssetsNet |
|
$ 1,480,254,613
|
| Holdings Count | Holding |
|
60
|
| Advisory Fees Paid, Amount |
|
$ 8,593,474
|
| InvestmentCompanyPortfolioTurnover |
|
63.00%
|
| Holdings [Text Block] |
|
SECTOR ALLOCATION (% OF LONG-TERM INVESTMENTS)
Information technology |
39.1 |
Communication services |
15.1 |
Consumer discretionary |
15.0 |
Industrials |
12.8 |
Financials |
10.6 |
Health care |
6.1 |
Utilities |
1.3 | |
| Largest Holdings [Text Block] |
|
TOP TEN HOLDINGS (% OF NET ASSETS)
NVIDIA Corp. |
9.1 |
Microsoft Corp. |
8.8 |
Meta Platforms, Inc. Class A |
6.3 |
Amazon.com, Inc. |
4.7 |
Broadcom, Inc. |
4.4 |
Oracle Corp. |
2.5 |
DoorDash, Inc. Class A |
2.0 |
Mastercard, Inc. Class A |
2.0 |
Booking Holdings, Inc. |
1.8 |
Arista Networks, Inc. |
1.7 | |
| Material Fund Change [Text Block] |
|
This is a summary of certain changes and planned changes to the Fund since August 1, 2024. At a meeting held on August 19-20, 2025, the Board of Trustees of the Fund approved the conversion of the Fund’s Class C shares into Class A shares effective on or about the close of business on November 14, 2025. In addition, effective at the close of business on September 29, 2025, Class C will be closed to new investors and additional investments from existing shareholders. |
| Summary of Change Legend [Text Block] |
|
This is a summary of certain changes and planned changes to the Fund since August 1, 2024.
|
| C000089286 |
|
|
| Shareholder Report [Line Items] |
|
|
| Fund Name |
|
Premier Large Company Growth Fund
|
| Class Name |
|
Class A
|
| Trading Symbol |
|
EKJAX
|
| Annual or Semi-Annual Statement [Text Block] |
|
This annual shareholder report contains important information about Premier Large Company Growth Fund for the period from August 1, 2024 to July 31, 2025.
|
| Shareholder Report Annual or Semi-Annual |
|
Annual Shareholder Report
|
| Additional Information [Text Block] |
|
You can find additional information about the Fund at allspringglobal.com. You can also request this information by contacting us at 1-800-222-8222.
|
| Additional Information Phone Number |
|
<span style="white-space: nowrap; box-sizing: border-box; color: rgb(0, 0, 0); display: inline; flex-wrap: nowrap; font-size: 12px; font-weight: 400; grid-area: auto; line-height: 18px; margin: 0px; overflow: visible; text-align: left; text-align-last: auto;"> 1-800-222-8222.</span>
|
| Additional Information Website |
|
<span style="box-sizing: border-box; color: rgb(0, 0, 0); display: inline; flex-wrap: nowrap; font-size: 12px; font-weight: 400; grid-area: auto; line-height: 18px; margin: 0px; overflow: visible; text-align: left; text-align-last: auto; white-space-collapse: preserve-breaks;">allspringglobal.com</span>
|
| Expenses [Text Block] |
|
What were the Fund costs for the past year?The table explains the costs you would have paid within the reporting period based on a hypothetical $10,000 investment.
CLASS NAME |
COSTS OF A $10,000 INVESTMENT |
COSTS PAID AS A % OF A $10,000 INVESTMENT |
Class A |
$125 |
1.08% | The manager has contractually committed to waive fees and/or reimburse certain expenses to the extent necessary to cap the Fund's total annual fund operating expense ratio at a specific amount. Without this cap, the costs shown above may have been higher. Please see the prospectus for the amount and the expiration date of the cap. Prior to or after the commitment expiration date, the cap may be increased or the commitment to maintain the cap may be terminated only with the approval of the Board of Trustees. |
| Expenses Paid, Amount |
|
$ 125
|
| Expense Ratio, Percent |
|
1.08%
|
| Factors Affecting Performance [Text Block] |
|
How did the Fund perform last year and what affected its performance?The market environment for the 12-month period that ended July 31, 2025, was bifurcated for U.S. equities. During the first half of the period, the economy was generally healthy, with moderating inflation, resilient consumer spending, and favorable earnings growth. In early 2025, the new U.S. administration took office and implemented policies on government spending, immigration, and tariffs. Financial market sentiment grew concerned and volatility spiked until the administration temporarily paused tariffs. With uncertainty easing, overall corporate earnings generally exceeded expectations and propelled growth indexes upward. Artificial intelligence (AI) was a key driver as leading technology firms ramped up capital expenditures on AI infrastructure. The portfolio benefited from security selection within information technology, industrials, and communication services, where holdings with innovative products and strong demand, such as AppLovin Corp., Axon Enterprise, Inc. and Roblox Corp., contributed. In contrast, relative underweights to select mega-cap technology companies, including NVIDIA Corp., Broadcom, Inc. and Netflix, Inc. detracted from returns. |
| Line Graph [Table Text Block] |
|

|
Class A with Load |
Russell 1000® Growth Index |
Russell 3000® Index |
7/31/2015 |
$9,427 |
$10,000 |
$10,000 |
8/31/2015 |
$8,813 |
$9,393 |
$9,396 |
9/30/2015 |
$8,570 |
$9,160 |
$9,122 |
10/31/2015 |
$9,143 |
$9,949 |
$9,843 |
11/30/2015 |
$9,224 |
$9,977 |
$9,898 |
12/31/2015 |
$9,073 |
$9,831 |
$9,694 |
1/31/2016 |
$8,284 |
$9,282 |
$9,147 |
2/29/2016 |
$8,178 |
$9,278 |
$9,144 |
3/31/2016 |
$8,675 |
$9,904 |
$9,788 |
4/30/2016 |
$8,682 |
$9,813 |
$9,849 |
5/31/2016 |
$8,874 |
$10,004 |
$10,025 |
6/30/2016 |
$8,632 |
$9,964 |
$10,046 |
7/31/2016 |
$9,123 |
$10,435 |
$10,444 |
8/31/2016 |
$9,073 |
$10,383 |
$10,471 |
9/30/2016 |
$9,104 |
$10,421 |
$10,488 |
10/31/2016 |
$8,800 |
$10,176 |
$10,261 |
11/30/2016 |
$8,837 |
$10,398 |
$10,720 |
12/31/2016 |
$8,749 |
$10,526 |
$10,929 |
1/31/2017 |
$9,183 |
$10,881 |
$11,135 |
2/28/2017 |
$9,528 |
$11,333 |
$11,549 |
3/31/2017 |
$9,652 |
$11,464 |
$11,557 |
4/30/2017 |
$9,990 |
$11,726 |
$11,679 |
5/31/2017 |
$10,342 |
$12,031 |
$11,799 |
6/30/2017 |
$10,266 |
$11,999 |
$11,905 |
7/31/2017 |
$10,584 |
$12,318 |
$12,130 |
8/31/2017 |
$10,736 |
$12,544 |
$12,153 |
9/30/2017 |
$10,908 |
$12,707 |
$12,449 |
10/31/2017 |
$11,322 |
$13,200 |
$12,721 |
11/30/2017 |
$11,626 |
$13,601 |
$13,107 |
12/31/2017 |
$11,717 |
$13,707 |
$13,238 |
1/31/2018 |
$12,763 |
$14,677 |
$13,936 |
2/28/2018 |
$12,551 |
$14,292 |
$13,423 |
3/31/2018 |
$12,329 |
$13,901 |
$13,153 |
4/30/2018 |
$12,364 |
$13,949 |
$13,203 |
5/31/2018 |
$12,967 |
$14,561 |
$13,576 |
6/30/2018 |
$13,100 |
$14,701 |
$13,665 |
7/31/2018 |
$13,393 |
$15,132 |
$14,118 |
8/31/2018 |
$14,120 |
$15,960 |
$14,614 |
9/30/2018 |
$14,254 |
$16,049 |
$14,638 |
10/31/2018 |
$12,772 |
$14,614 |
$13,560 |
11/30/2018 |
$12,976 |
$14,769 |
$13,832 |
12/31/2018 |
$11,825 |
$13,499 |
$12,544 |
1/31/2019 |
$13,019 |
$14,712 |
$13,621 |
2/28/2019 |
$13,702 |
$15,239 |
$14,100 |
3/31/2019 |
$14,000 |
$15,673 |
$14,306 |
4/30/2019 |
$14,779 |
$16,381 |
$14,877 |
5/31/2019 |
$14,128 |
$15,346 |
$13,915 |
6/30/2019 |
$14,939 |
$16,400 |
$14,892 |
7/31/2019 |
$15,131 |
$16,770 |
$15,113 |
8/31/2019 |
$14,939 |
$16,642 |
$14,805 |
9/30/2019 |
$14,683 |
$16,644 |
$15,065 |
10/31/2019 |
$14,875 |
$17,113 |
$15,389 |
11/30/2019 |
$15,536 |
$17,872 |
$15,974 |
12/31/2019 |
$15,746 |
$18,411 |
$16,436 |
1/31/2020 |
$16,347 |
$18,823 |
$16,418 |
2/29/2020 |
$15,261 |
$17,541 |
$15,074 |
3/31/2020 |
$13,170 |
$15,815 |
$13,001 |
4/30/2020 |
$15,354 |
$18,156 |
$14,722 |
5/31/2020 |
$16,590 |
$19,375 |
$15,510 |
6/30/2020 |
$17,283 |
$20,218 |
$15,864 |
7/31/2020 |
$18,577 |
$21,774 |
$16,765 |
8/31/2020 |
$19,929 |
$24,021 |
$17,980 |
9/30/2020 |
$19,270 |
$22,890 |
$17,325 |
10/31/2020 |
$19,004 |
$22,113 |
$16,951 |
11/30/2020 |
$21,061 |
$24,377 |
$19,013 |
12/31/2020 |
$21,945 |
$25,498 |
$19,869 |
1/31/2021 |
$21,659 |
$25,310 |
$19,780 |
2/28/2021 |
$22,569 |
$25,304 |
$20,399 |
3/31/2021 |
$22,205 |
$25,739 |
$21,130 |
4/30/2021 |
$23,635 |
$27,490 |
$22,219 |
5/31/2021 |
$22,868 |
$27,110 |
$22,320 |
6/30/2021 |
$24,298 |
$28,810 |
$22,871 |
7/31/2021 |
$25,065 |
$29,760 |
$23,258 |
8/31/2021 |
$25,819 |
$30,873 |
$23,921 |
9/30/2021 |
$24,532 |
$29,144 |
$22,848 |
10/31/2021 |
$26,378 |
$31,668 |
$24,393 |
11/30/2021 |
$25,156 |
$31,861 |
$24,021 |
12/31/2021 |
$24,935 |
$32,535 |
$24,967 |
1/31/2022 |
$21,931 |
$29,743 |
$23,498 |
2/28/2022 |
$21,535 |
$28,479 |
$22,906 |
3/31/2022 |
$21,750 |
$29,594 |
$23,649 |
4/30/2022 |
$18,829 |
$26,020 |
$21,527 |
5/31/2022 |
$18,383 |
$25,415 |
$21,498 |
6/30/2022 |
$17,014 |
$23,402 |
$19,700 |
7/31/2022 |
$19,043 |
$26,210 |
$21,548 |
8/31/2022 |
$18,202 |
$24,989 |
$20,744 |
9/30/2022 |
$16,419 |
$22,560 |
$18,820 |
10/31/2022 |
$17,063 |
$23,879 |
$20,364 |
11/30/2022 |
$17,740 |
$24,967 |
$21,426 |
12/31/2022 |
$16,485 |
$23,055 |
$20,172 |
1/31/2023 |
$17,789 |
$24,977 |
$21,561 |
2/28/2023 |
$17,410 |
$24,680 |
$21,057 |
3/31/2023 |
$18,367 |
$26,367 |
$21,620 |
4/30/2023 |
$18,482 |
$26,628 |
$21,851 |
5/31/2023 |
$19,010 |
$27,841 |
$21,936 |
6/30/2023 |
$20,347 |
$29,745 |
$23,433 |
7/31/2023 |
$20,710 |
$30,747 |
$24,273 |
8/31/2023 |
$20,446 |
$30,471 |
$23,805 |
9/30/2023 |
$19,271 |
$28,814 |
$22,671 |
10/31/2023 |
$18,928 |
$28,404 |
$22,070 |
11/30/2023 |
$21,133 |
$31,500 |
$24,128 |
12/31/2023 |
$21,928 |
$32,895 |
$25,408 |
1/31/2024 |
$22,936 |
$33,715 |
$25,689 |
2/29/2024 |
$24,951 |
$36,016 |
$27,080 |
3/31/2024 |
$25,513 |
$36,650 |
$27,953 |
4/30/2024 |
$24,201 |
$35,095 |
$26,723 |
5/31/2024 |
$25,630 |
$37,196 |
$27,986 |
6/30/2024 |
$26,872 |
$39,704 |
$28,852 |
7/31/2024 |
$26,263 |
$39,029 |
$29,389 |
8/31/2024 |
$27,481 |
$39,842 |
$30,029 |
9/30/2024 |
$28,348 |
$40,971 |
$30,650 |
10/31/2024 |
$28,558 |
$40,835 |
$30,425 |
11/30/2024 |
$31,159 |
$43,484 |
$32,449 |
12/31/2024 |
$30,042 |
$43,868 |
$31,457 |
1/31/2025 |
$31,078 |
$44,735 |
$32,450 |
2/28/2025 |
$29,707 |
$43,128 |
$31,828 |
3/31/2025 |
$26,907 |
$39,481 |
$29,971 |
4/30/2025 |
$27,747 |
$40,153 |
$29,770 |
5/31/2025 |
$30,854 |
$43,747 |
$31,657 |
6/30/2025 |
$33,514 |
$46,580 |
$33,266 |
7/31/2025 |
$34,550 |
$48,339 |
$33,998 |
|
| Average Annual Return [Table Text Block] |
|
AVERAGE ANNUAL TOTAL RETURNS (%)
AATR |
1 Year |
5 Years |
10 Years |
Class A |
31.67 |
13.21 |
13.87 |
Class A with Load |
24.14 |
11.88 |
13.20 |
Russell 1000® Growth Index |
23.85 |
17.29 |
17.07 |
Russell 3000® Index |
15.68 |
15.19 |
13.02 | |
| AssetsNet |
|
$ 1,480,254,613
|
| Holdings Count | Holding |
|
60
|
| Advisory Fees Paid, Amount |
|
$ 8,593,474
|
| InvestmentCompanyPortfolioTurnover |
|
63.00%
|
| Holdings [Text Block] |
|
SECTOR ALLOCATION (% OF LONG-TERM INVESTMENTS)
Information technology |
39.1 |
Communication services |
15.1 |
Consumer discretionary |
15.0 |
Industrials |
12.8 |
Financials |
10.6 |
Health care |
6.1 |
Utilities |
1.3 | |
| Largest Holdings [Text Block] |
|
TOP TEN HOLDINGS (% OF NET ASSETS)
NVIDIA Corp. |
9.1 |
Microsoft Corp. |
8.8 |
Meta Platforms, Inc. Class A |
6.3 |
Amazon.com, Inc. |
4.7 |
Broadcom, Inc. |
4.4 |
Oracle Corp. |
2.5 |
DoorDash, Inc. Class A |
2.0 |
Mastercard, Inc. Class A |
2.0 |
Booking Holdings, Inc. |
1.8 |
Arista Networks, Inc. |
1.7 | |
| Material Fund Change [Text Block] |
|
|
| C000089291 |
|
|
| Shareholder Report [Line Items] |
|
|
| Fund Name |
|
Premier Large Company Growth Fund
|
| Class Name |
|
Administrator Class
|
| Trading Symbol |
|
WFPDX
|
| Annual or Semi-Annual Statement [Text Block] |
|
This annual shareholder report contains important information about Premier Large Company Growth Fund for the period from August 1, 2024 to July 31, 2025.
|
| Shareholder Report Annual or Semi-Annual |
|
Annual Shareholder Report
|
| Additional Information [Text Block] |
|
You can find additional information about the Fund at allspringglobal.com. You can also request this information by contacting us at 1-800-222-8222.
|
| Additional Information Phone Number |
|
<span style="white-space: nowrap; box-sizing: border-box; color: rgb(0, 0, 0); display: inline; flex-wrap: nowrap; font-size: 12px; font-weight: 400; grid-area: auto; line-height: 18px; margin: 0px; overflow: visible; text-align: left; text-align-last: auto;"> 1-800-222-8222.</span>
|
| Additional Information Website |
|
<span style="box-sizing: border-box; color: rgb(0, 0, 0); display: inline; flex-wrap: nowrap; font-size: 12px; font-weight: 400; grid-area: auto; line-height: 18px; margin: 0px; overflow: visible; text-align: left; text-align-last: auto; white-space-collapse: preserve-breaks;">allspringglobal.com</span>
|
| Expenses [Text Block] |
|
What were the Fund costs for the past year?The table explains the costs you would have paid within the reporting period based on a hypothetical $10,000 investment.
CLASS NAME |
COSTS OF A $10,000 INVESTMENT |
COSTS PAID AS A % OF A $10,000 INVESTMENT |
Administrator Class |
$116 |
1.00% | The manager has contractually committed to waive fees and/or reimburse certain expenses to the extent necessary to cap the Fund's total annual fund operating expense ratio at a specific amount. Without this cap, the costs shown above may have been higher. Please see the prospectus for the amount and the expiration date of the cap. Prior to or after the commitment expiration date, the cap may be increased or the commitment to maintain the cap may be terminated only with the approval of the Board of Trustees. |
| Expenses Paid, Amount |
|
$ 116
|
| Expense Ratio, Percent |
|
1.00%
|
| Factors Affecting Performance [Text Block] |
|
How did the Fund perform last year and what affected its performance?The market environment for the 12-month period that ended July 31, 2025, was bifurcated for U.S. equities. During the first half of the period, the economy was generally healthy, with moderating inflation, resilient consumer spending, and favorable earnings growth. In early 2025, the new U.S. administration took office and implemented policies on government spending, immigration, and tariffs. Financial market sentiment grew concerned and volatility spiked until the administration temporarily paused tariffs. With uncertainty easing, overall corporate earnings generally exceeded expectations and propelled growth indexes upward. Artificial intelligence (AI) was a key driver as leading technology firms ramped up capital expenditures on AI infrastructure. The portfolio benefited from security selection within information technology, industrials, and communication services, where holdings with innovative products and strong demand, such as AppLovin Corp., Axon Enterprise, Inc. and Roblox Corp., contributed. In contrast, relative underweights to select mega-cap technology companies, including NVIDIA Corp., Broadcom, Inc. and Netflix, Inc. detracted from returns. |
| Line Graph [Table Text Block] |
|
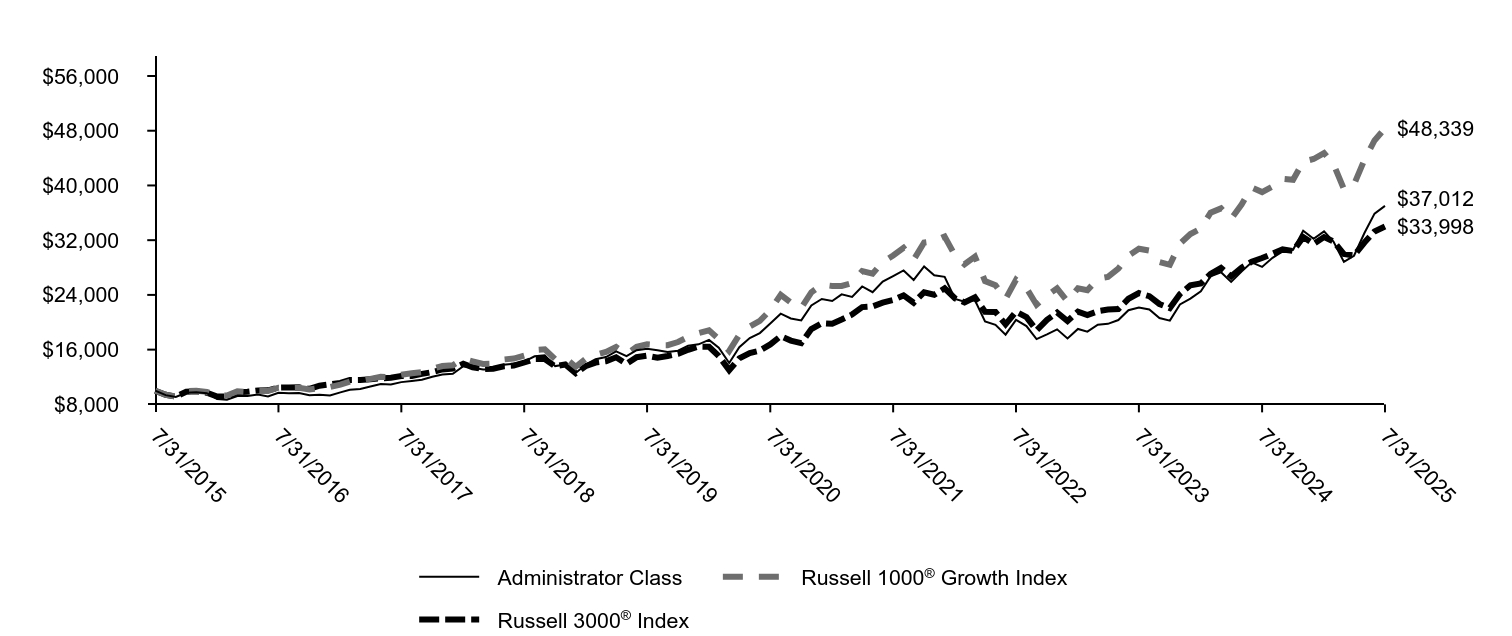
|
Administrator Class |
Russell 1000® Growth Index |
Russell 3000® Index |
7/31/2015 |
$10,000 |
$10,000 |
$10,000 |
8/31/2015 |
$9,348 |
$9,393 |
$9,396 |
9/30/2015 |
$9,092 |
$9,160 |
$9,122 |
10/31/2015 |
$9,701 |
$9,949 |
$9,843 |
11/30/2015 |
$9,787 |
$9,977 |
$9,898 |
12/31/2015 |
$9,628 |
$9,831 |
$9,694 |
1/31/2016 |
$8,791 |
$9,282 |
$9,147 |
2/29/2016 |
$8,680 |
$9,278 |
$9,144 |
3/31/2016 |
$9,209 |
$9,904 |
$9,788 |
4/30/2016 |
$9,209 |
$9,813 |
$9,849 |
5/31/2016 |
$9,425 |
$10,004 |
$10,025 |
6/30/2016 |
$9,164 |
$9,964 |
$10,046 |
7/31/2016 |
$9,687 |
$10,435 |
$10,444 |
8/31/2016 |
$9,634 |
$10,383 |
$10,471 |
9/30/2016 |
$9,667 |
$10,421 |
$10,488 |
10/31/2016 |
$9,347 |
$10,176 |
$10,261 |
11/30/2016 |
$9,392 |
$10,398 |
$10,720 |
12/31/2016 |
$9,293 |
$10,526 |
$10,929 |
1/31/2017 |
$9,757 |
$10,881 |
$11,135 |
2/28/2017 |
$10,127 |
$11,333 |
$11,549 |
3/31/2017 |
$10,257 |
$11,464 |
$11,557 |
4/30/2017 |
$10,620 |
$11,726 |
$11,679 |
5/31/2017 |
$10,989 |
$12,031 |
$11,799 |
6/30/2017 |
$10,910 |
$11,999 |
$11,905 |
7/31/2017 |
$11,250 |
$12,318 |
$12,130 |
8/31/2017 |
$11,417 |
$12,544 |
$12,153 |
9/30/2017 |
$11,598 |
$12,707 |
$12,449 |
10/31/2017 |
$12,040 |
$13,200 |
$12,721 |
11/30/2017 |
$12,359 |
$13,601 |
$13,107 |
12/31/2017 |
$12,462 |
$13,707 |
$13,238 |
1/31/2018 |
$13,577 |
$14,677 |
$13,936 |
2/28/2018 |
$13,344 |
$14,292 |
$13,423 |
3/31/2018 |
$13,112 |
$13,901 |
$13,153 |
4/30/2018 |
$13,149 |
$13,949 |
$13,203 |
5/31/2018 |
$13,799 |
$14,561 |
$13,576 |
6/30/2018 |
$13,948 |
$14,701 |
$13,665 |
7/31/2018 |
$14,254 |
$15,132 |
$14,118 |
8/31/2018 |
$15,034 |
$15,960 |
$14,614 |
9/30/2018 |
$15,174 |
$16,049 |
$14,638 |
10/31/2018 |
$13,595 |
$14,614 |
$13,560 |
11/30/2018 |
$13,809 |
$14,769 |
$13,832 |
12/31/2018 |
$12,583 |
$13,499 |
$12,544 |
1/31/2019 |
$13,863 |
$14,712 |
$13,621 |
2/28/2019 |
$14,597 |
$15,239 |
$14,100 |
3/31/2019 |
$14,909 |
$15,673 |
$14,306 |
4/30/2019 |
$15,743 |
$16,381 |
$14,877 |
5/31/2019 |
$15,042 |
$15,346 |
$13,915 |
6/30/2019 |
$15,910 |
$16,400 |
$14,892 |
7/31/2019 |
$16,110 |
$16,770 |
$15,113 |
8/31/2019 |
$15,910 |
$16,642 |
$14,805 |
9/30/2019 |
$15,643 |
$16,644 |
$15,065 |
10/31/2019 |
$15,843 |
$17,113 |
$15,389 |
11/30/2019 |
$16,555 |
$17,872 |
$15,974 |
12/31/2019 |
$16,774 |
$18,411 |
$16,436 |
1/31/2020 |
$17,424 |
$18,823 |
$16,418 |
2/29/2020 |
$16,269 |
$17,541 |
$15,074 |
3/31/2020 |
$14,043 |
$15,815 |
$13,001 |
4/30/2020 |
$16,365 |
$18,156 |
$14,722 |
5/31/2020 |
$17,689 |
$19,375 |
$15,510 |
6/30/2020 |
$18,423 |
$20,218 |
$15,864 |
7/31/2020 |
$19,819 |
$21,774 |
$16,765 |
8/31/2020 |
$21,251 |
$24,021 |
$17,980 |
9/30/2020 |
$20,553 |
$22,890 |
$17,325 |
10/31/2020 |
$20,276 |
$22,113 |
$16,951 |
11/30/2020 |
$22,466 |
$24,377 |
$19,013 |
12/31/2020 |
$23,411 |
$25,498 |
$19,869 |
1/31/2021 |
$23,114 |
$25,310 |
$19,780 |
2/28/2021 |
$24,086 |
$25,304 |
$20,399 |
3/31/2021 |
$23,695 |
$25,739 |
$21,130 |
4/30/2021 |
$25,234 |
$27,490 |
$22,219 |
5/31/2021 |
$24,397 |
$27,110 |
$22,320 |
6/30/2021 |
$25,936 |
$28,810 |
$22,871 |
7/31/2021 |
$26,759 |
$29,760 |
$23,258 |
8/31/2021 |
$27,569 |
$30,873 |
$23,921 |
9/30/2021 |
$26,192 |
$29,144 |
$22,848 |
10/31/2021 |
$28,163 |
$31,668 |
$24,393 |
11/30/2021 |
$26,867 |
$31,861 |
$24,021 |
12/31/2021 |
$26,642 |
$32,535 |
$24,967 |
1/31/2022 |
$23,426 |
$29,743 |
$23,498 |
2/28/2022 |
$23,001 |
$28,479 |
$22,906 |
3/31/2022 |
$23,222 |
$29,594 |
$23,649 |
4/30/2022 |
$20,126 |
$26,020 |
$21,527 |
5/31/2022 |
$19,632 |
$25,415 |
$21,498 |
6/30/2022 |
$18,186 |
$23,402 |
$19,700 |
7/31/2022 |
$20,347 |
$26,210 |
$21,548 |
8/31/2022 |
$19,445 |
$24,989 |
$20,744 |
9/30/2022 |
$17,540 |
$22,560 |
$18,820 |
10/31/2022 |
$18,237 |
$23,879 |
$20,364 |
11/30/2022 |
$18,969 |
$24,967 |
$21,426 |
12/31/2022 |
$17,625 |
$23,055 |
$20,172 |
1/31/2023 |
$19,020 |
$24,977 |
$21,561 |
2/28/2023 |
$18,629 |
$24,680 |
$21,057 |
3/31/2023 |
$19,649 |
$26,367 |
$21,620 |
4/30/2023 |
$19,768 |
$26,628 |
$21,851 |
5/31/2023 |
$20,330 |
$27,841 |
$21,936 |
6/30/2023 |
$21,759 |
$29,745 |
$23,433 |
7/31/2023 |
$22,150 |
$30,747 |
$24,273 |
8/31/2023 |
$21,861 |
$30,471 |
$23,805 |
9/30/2023 |
$20,614 |
$28,814 |
$22,671 |
10/31/2023 |
$20,244 |
$28,404 |
$22,070 |
11/30/2023 |
$22,602 |
$31,500 |
$24,128 |
12/31/2023 |
$23,455 |
$32,895 |
$25,408 |
1/31/2024 |
$24,525 |
$33,715 |
$25,689 |
2/29/2024 |
$26,713 |
$36,016 |
$27,080 |
3/31/2024 |
$27,308 |
$36,650 |
$27,953 |
4/30/2024 |
$25,905 |
$35,095 |
$26,723 |
5/31/2024 |
$27,427 |
$37,196 |
$27,986 |
6/30/2024 |
$28,759 |
$39,704 |
$28,852 |
7/31/2024 |
$28,093 |
$39,029 |
$29,389 |
8/31/2024 |
$29,425 |
$39,842 |
$30,029 |
9/30/2024 |
$30,353 |
$40,971 |
$30,650 |
10/31/2024 |
$30,591 |
$40,835 |
$30,425 |
11/30/2024 |
$33,374 |
$43,484 |
$32,449 |
12/31/2024 |
$32,199 |
$43,868 |
$31,457 |
1/31/2025 |
$33,296 |
$44,735 |
$32,450 |
2/28/2025 |
$31,805 |
$43,128 |
$31,828 |
3/31/2025 |
$28,821 |
$39,481 |
$29,971 |
4/30/2025 |
$29,722 |
$40,153 |
$29,770 |
5/31/2025 |
$33,043 |
$43,747 |
$31,657 |
6/30/2025 |
$35,886 |
$46,580 |
$33,266 |
7/31/2025 |
$37,012 |
$48,339 |
$33,998 |
|
| Average Annual Return [Table Text Block] |
|
AVERAGE ANNUAL TOTAL RETURNS (%)
AATR |
1 Year |
5 Years |
10 Years |
Administrator Class |
31.75 |
13.31 |
13.98 |
Russell 1000® Growth Index |
23.85 |
17.29 |
17.07 |
Russell 3000® Index |
15.68 |
15.19 |
13.02 | |
| AssetsNet |
|
$ 1,480,254,613
|
| Holdings Count | Holding |
|
60
|
| Advisory Fees Paid, Amount |
|
$ 8,593,474
|
| InvestmentCompanyPortfolioTurnover |
|
63.00%
|
| Holdings [Text Block] |
|
SECTOR ALLOCATION (% OF LONG-TERM INVESTMENTS)
Information technology |
39.1 |
Communication services |
15.1 |
Consumer discretionary |
15.0 |
Industrials |
12.8 |
Financials |
10.6 |
Health care |
6.1 |
Utilities |
1.3 | |
| Largest Holdings [Text Block] |
|
TOP TEN HOLDINGS (% OF NET ASSETS)
NVIDIA Corp. |
9.1 |
Microsoft Corp. |
8.8 |
Meta Platforms, Inc. Class A |
6.3 |
Amazon.com, Inc. |
4.7 |
Broadcom, Inc. |
4.4 |
Oracle Corp. |
2.5 |
DoorDash, Inc. Class A |
2.0 |
Mastercard, Inc. Class A |
2.0 |
Booking Holdings, Inc. |
1.8 |
Arista Networks, Inc. |
1.7 | |
| Material Fund Change [Text Block] |
|
|
| C000120088 |
|
|
| Shareholder Report [Line Items] |
|
|
| Fund Name |
|
Special Large Cap Value Fund
|
| Class Name |
|
Class R6
|
| Trading Symbol |
|
EIVFX
|
| Annual or Semi-Annual Statement [Text Block] |
|
This annual shareholder report contains important information about Special Large Cap Value Fund for the period from August 1, 2024 to July 31, 2025.
|
| Shareholder Report Annual or Semi-Annual |
|
Annual Shareholder Report
|
| Additional Information [Text Block] |
|
You can find additional information about the Fund at allspringglobal.com. You can also request this information by contacting us at 1-800-222-8222.
|
| Additional Information Phone Number |
|
<span style="white-space: nowrap; box-sizing: border-box; color: rgb(0, 0, 0); display: inline; flex-wrap: nowrap; font-size: 12px; font-weight: 400; grid-area: auto; line-height: 18px; margin: 0px; overflow: visible; text-align: left; text-align-last: auto;"> 1-800-222-8222.</span>
|
| Additional Information Website |
|
<span style="box-sizing: border-box; color: rgb(0, 0, 0); display: inline; flex-wrap: nowrap; font-size: 12px; font-weight: 400; grid-area: auto; line-height: 18px; margin: 0px; overflow: visible; text-align: left; text-align-last: auto; white-space-collapse: preserve-breaks;">allspringglobal.com</span>
|
| Expenses [Text Block] |
|
What were the Fund costs for the past year?The table explains the costs you would have paid within the reporting period based on a hypothetical $10,000 investment.
CLASS NAME |
COSTS OF A $10,000 INVESTMENT |
COSTS PAID AS A % OF A $10,000 INVESTMENT |
Class R6 |
$43 |
0.41% | The manager has contractually committed to waive fees and/or reimburse certain expenses to the extent necessary to cap the Fund's total annual fund operating expense ratio at a specific amount. Without this cap, the costs shown above may have been higher. Please see the prospectus for the amount and the expiration date of the cap. Prior to or after the commitment expiration date, the cap may be increased or the commitment to maintain the cap may be terminated only with the approval of the Board of Trustees. |
| Expenses Paid, Amount |
|
$ 43
|
| Expense Ratio, Percent |
|
0.41%
|
| Factors Affecting Performance [Text Block] |
|
How did the Fund perform last year and what affected its performance?In a volatile year, the Fund outperformed its strategy benchmark, driven by stock selection. The period saw a fluctuation in investors’ risk appetites as optimism around monetary policy easing gave way to fears that a restrictive trade policy and the Federal Reserve’s decision to pause rate cuts could lead to a recession. However, markets rallied off the April 9 announcement that the implementation of tariffs would be delayed. The Fund made minor changes to sector allocation, with an increase in its consumer discretionary weight while reducing its exposure to real estate and financials. Citigroup, Inc. was the largest contributor, as it is exiting less profitable, non-core franchises and eliminating managerial layers to improve returns and reduce its capital needs, with a goal of achieving more durable and higher-growth cash flow. The largest detractor was Canadian Pacific Kansas City Ltd., an operator of a transnational rail network, on fears that trade policy could affect volumes. Management announced its first share repurchase program in more than three years, and we believe shares are materially undervalued from a reward/risk perspective. |
| Line Graph [Table Text Block] |
|

|
Class R6 |
Russell 1000® Value Index |
Russell 3000® Index |
7/31/2015 |
$10,000 |
$10,000 |
$10,000 |
8/31/2015 |
$9,361 |
$9,404 |
$9,396 |
9/30/2015 |
$9,090 |
$9,121 |
$9,122 |
10/31/2015 |
$9,846 |
$9,809 |
$9,843 |
11/30/2015 |
$9,824 |
$9,846 |
$9,898 |
12/31/2015 |
$9,597 |
$9,634 |
$9,694 |
1/31/2016 |
$8,983 |
$9,137 |
$9,147 |
2/29/2016 |
$8,950 |
$9,134 |
$9,144 |
3/31/2016 |
$9,522 |
$9,792 |
$9,788 |
4/30/2016 |
$9,605 |
$9,998 |
$9,849 |
5/31/2016 |
$9,646 |
$10,153 |
$10,025 |
6/30/2016 |
$9,621 |
$10,241 |
$10,046 |
7/31/2016 |
$9,870 |
$10,538 |
$10,444 |
8/31/2016 |
$9,937 |
$10,620 |
$10,471 |
9/30/2016 |
$9,970 |
$10,598 |
$10,488 |
10/31/2016 |
$9,771 |
$10,434 |
$10,261 |
11/30/2016 |
$10,161 |
$11,029 |
$10,720 |
12/31/2016 |
$10,336 |
$11,305 |
$10,929 |
1/31/2017 |
$10,480 |
$11,386 |
$11,135 |
2/28/2017 |
$10,751 |
$11,795 |
$11,549 |
3/31/2017 |
$10,760 |
$11,675 |
$11,557 |
4/30/2017 |
$10,787 |
$11,653 |
$11,679 |
5/31/2017 |
$10,886 |
$11,641 |
$11,799 |
6/30/2017 |
$10,949 |
$11,832 |
$11,905 |
7/31/2017 |
$11,255 |
$11,989 |
$12,130 |
8/31/2017 |
$11,120 |
$11,849 |
$12,153 |
9/30/2017 |
$11,354 |
$12,200 |
$12,449 |
10/31/2017 |
$11,471 |
$12,289 |
$12,721 |
11/30/2017 |
$11,832 |
$12,665 |
$13,107 |
12/31/2017 |
$12,016 |
$12,850 |
$13,238 |
1/31/2018 |
$12,685 |
$13,347 |
$13,936 |
2/28/2018 |
$12,065 |
$12,709 |
$13,423 |
3/31/2018 |
$11,819 |
$12,486 |
$13,153 |
4/30/2018 |
$11,937 |
$12,527 |
$13,203 |
5/31/2018 |
$12,045 |
$12,601 |
$13,576 |
6/30/2018 |
$12,203 |
$12,633 |
$13,665 |
7/31/2018 |
$12,714 |
$13,133 |
$14,118 |
8/31/2018 |
$12,941 |
$13,327 |
$14,614 |
9/30/2018 |
$13,147 |
$13,353 |
$14,638 |
10/31/2018 |
$12,439 |
$12,662 |
$13,560 |
11/30/2018 |
$12,813 |
$13,040 |
$13,832 |
12/31/2018 |
$11,461 |
$11,788 |
$12,544 |
1/31/2019 |
$12,406 |
$12,705 |
$13,621 |
2/28/2019 |
$12,840 |
$13,111 |
$14,100 |
3/31/2019 |
$13,003 |
$13,194 |
$14,306 |
4/30/2019 |
$13,643 |
$13,662 |
$14,877 |
5/31/2019 |
$12,872 |
$12,784 |
$13,915 |
6/30/2019 |
$13,741 |
$13,702 |
$14,892 |
7/31/2019 |
$14,034 |
$13,815 |
$15,113 |
8/31/2019 |
$13,686 |
$13,409 |
$14,805 |
9/30/2019 |
$14,196 |
$13,887 |
$15,065 |
10/31/2019 |
$14,262 |
$14,081 |
$15,389 |
11/30/2019 |
$14,750 |
$14,517 |
$15,974 |
12/31/2019 |
$15,255 |
$14,916 |
$16,436 |
1/31/2020 |
$14,760 |
$14,595 |
$16,418 |
2/29/2020 |
$13,333 |
$13,182 |
$15,074 |
3/31/2020 |
$11,351 |
$10,929 |
$13,001 |
4/30/2020 |
$12,523 |
$12,158 |
$14,722 |
5/31/2020 |
$12,958 |
$12,574 |
$15,510 |
6/30/2020 |
$13,055 |
$12,491 |
$15,864 |
7/31/2020 |
$13,490 |
$12,985 |
$16,765 |
8/31/2020 |
$14,046 |
$13,522 |
$17,980 |
9/30/2020 |
$13,587 |
$13,190 |
$17,325 |
10/31/2020 |
$13,309 |
$13,016 |
$16,951 |
11/30/2020 |
$15,001 |
$14,767 |
$19,013 |
12/31/2020 |
$15,481 |
$15,333 |
$19,869 |
1/31/2021 |
$15,137 |
$15,193 |
$19,780 |
2/28/2021 |
$15,886 |
$16,111 |
$20,399 |
3/31/2021 |
$17,028 |
$17,059 |
$21,130 |
4/30/2021 |
$17,691 |
$17,741 |
$22,219 |
5/31/2021 |
$18,022 |
$18,155 |
$22,320 |
6/30/2021 |
$17,863 |
$17,947 |
$22,871 |
7/31/2021 |
$18,084 |
$18,091 |
$23,258 |
8/31/2021 |
$18,366 |
$18,450 |
$23,921 |
9/30/2021 |
$17,875 |
$17,807 |
$22,848 |
10/31/2021 |
$18,992 |
$18,712 |
$24,393 |
11/30/2021 |
$18,329 |
$18,052 |
$24,021 |
12/31/2021 |
$19,239 |
$19,191 |
$24,967 |
1/31/2022 |
$18,711 |
$18,744 |
$23,498 |
2/28/2022 |
$18,290 |
$18,527 |
$22,906 |
3/31/2022 |
$18,591 |
$19,050 |
$23,649 |
4/30/2022 |
$17,356 |
$17,975 |
$21,527 |
5/31/2022 |
$17,627 |
$18,324 |
$21,498 |
6/30/2022 |
$15,954 |
$16,723 |
$19,700 |
7/31/2022 |
$17,205 |
$17,832 |
$21,548 |
8/31/2022 |
$16,873 |
$17,301 |
$20,744 |
9/30/2022 |
$15,578 |
$15,784 |
$18,820 |
10/31/2022 |
$17,521 |
$17,402 |
$20,364 |
11/30/2022 |
$18,696 |
$18,490 |
$21,426 |
12/31/2022 |
$18,045 |
$17,744 |
$20,172 |
1/31/2023 |
$18,757 |
$18,664 |
$21,561 |
2/28/2023 |
$18,062 |
$18,006 |
$21,057 |
3/31/2023 |
$17,879 |
$17,923 |
$21,620 |
4/30/2023 |
$18,443 |
$18,193 |
$21,851 |
5/31/2023 |
$17,995 |
$17,491 |
$21,936 |
6/30/2023 |
$19,221 |
$18,653 |
$23,433 |
7/31/2023 |
$19,719 |
$19,309 |
$24,273 |
8/31/2023 |
$19,321 |
$18,788 |
$23,805 |
9/30/2023 |
$18,641 |
$18,063 |
$22,671 |
10/31/2023 |
$18,310 |
$17,426 |
$22,070 |
11/30/2023 |
$19,304 |
$18,740 |
$24,128 |
12/31/2023 |
$20,594 |
$19,778 |
$25,408 |
1/31/2024 |
$20,817 |
$19,799 |
$25,689 |
2/29/2024 |
$21,485 |
$20,529 |
$27,080 |
3/31/2024 |
$22,668 |
$21,556 |
$27,953 |
4/30/2024 |
$21,845 |
$20,635 |
$26,723 |
5/31/2024 |
$22,702 |
$21,289 |
$27,986 |
6/30/2024 |
$22,702 |
$21,089 |
$28,852 |
7/31/2024 |
$23,781 |
$22,167 |
$29,389 |
8/31/2024 |
$24,724 |
$22,762 |
$30,029 |
9/30/2024 |
$24,706 |
$23,077 |
$30,650 |
10/31/2024 |
$24,415 |
$22,823 |
$30,425 |
11/30/2024 |
$25,563 |
$24,281 |
$32,449 |
12/31/2024 |
$24,106 |
$22,620 |
$31,457 |
1/31/2025 |
$25,268 |
$23,667 |
$32,450 |
2/28/2025 |
$25,193 |
$23,763 |
$31,828 |
3/31/2025 |
$24,556 |
$23,103 |
$29,971 |
4/30/2025 |
$24,256 |
$22,399 |
$29,770 |
5/31/2025 |
$25,212 |
$23,186 |
$31,657 |
6/30/2025 |
$26,149 |
$23,978 |
$33,266 |
7/31/2025 |
$26,280 |
$24,116 |
$33,998 |
|
| Average Annual Return [Table Text Block] |
|
AVERAGE ANNUAL TOTAL RETURNS (%)
AATR |
1 Year |
5 Years |
10 Years |
Class R6 |
10.51 |
14.27 |
10.14 |
Russell 1000® Value Index |
8.79 |
13.18 |
9.20 |
Russell 3000® Index |
15.68 |
15.19 |
13.02 | |
| AssetsNet |
|
$ 2,001,713,305
|
| Holdings Count | Holding |
|
46
|
| Advisory Fees Paid, Amount |
|
$ 6,257,425
|
| InvestmentCompanyPortfolioTurnover |
|
44.00%
|
| Holdings [Text Block] |
|
SECTOR ALLOCATION (% OF LONG-TERM INVESTMENTS)
Financials |
21.0 |
Industrials |
15.3 |
Health care |
14.0 |
Consumer discretionary |
10.3 |
Information technology |
9.9 |
Consumer staples |
7.7 |
Energy |
5.8 |
Materials |
4.8 |
Communication services |
4.6 |
Real estate |
3.5 |
Utilities |
3.1 | |
| Largest Holdings [Text Block] |
|
TOP TEN HOLDINGS (% OF NET ASSETS)
Alphabet, Inc. Class C |
4.5 |
Canadian Pacific Kansas City Ltd. |
4.4 |
Bank of America Corp. |
3.9 |
Intercontinental Exchange, Inc. |
3.8 |
Citigroup, Inc. |
3.6 |
Berkshire Hathaway, Inc. Class B |
3.3 |
Mondelez International, Inc. Class A |
3.2 |
D.R. Horton, Inc. |
3.0 |
NextEra Energy, Inc. |
3.0 |
Labcorp Holdings, Inc. |
2.9 | |
| Material Fund Change [Text Block] |
|
|
| C000089437 |
|
|
| Shareholder Report [Line Items] |
|
|
| Fund Name |
|
Special Large Cap Value Fund
|
| Class Name |
|
Institutional Class
|
| Trading Symbol |
|
EIVIX
|
| Annual or Semi-Annual Statement [Text Block] |
|
This annual shareholder report contains important information about Special Large Cap Value Fund for the period from August 1, 2024 to July 31, 2025.
|
| Shareholder Report Annual or Semi-Annual |
|
Annual Shareholder Report
|
| Additional Information [Text Block] |
|
You can find additional information about the Fund at allspringglobal.com. You can also request this information by contacting us at 1-800-222-8222.
|
| Additional Information Phone Number |
|
<span style="white-space: nowrap; box-sizing: border-box; color: rgb(0, 0, 0); display: inline; flex-wrap: nowrap; font-size: 12px; font-weight: 400; grid-area: auto; line-height: 18px; margin: 0px; overflow: visible; text-align: left; text-align-last: auto;"> 1-800-222-8222.</span>
|
| Additional Information Website |
|
<span style="box-sizing: border-box; color: rgb(0, 0, 0); display: inline; flex-wrap: nowrap; font-size: 12px; font-weight: 400; grid-area: auto; line-height: 18px; margin: 0px; overflow: visible; text-align: left; text-align-last: auto; white-space-collapse: preserve-breaks;">allspringglobal.com</span>
|
| Expenses [Text Block] |
|
What were the Fund costs for the past year?The table explains the costs you would have paid within the reporting period based on a hypothetical $10,000 investment.
CLASS NAME |
COSTS OF A $10,000 INVESTMENT |
COSTS PAID AS A % OF A $10,000 INVESTMENT |
Institutional Class |
$56 |
0.53% | The manager has contractually committed to waive fees and/or reimburse certain expenses to the extent necessary to cap the Fund's total annual fund operating expense ratio at a specific amount. Without this cap, the costs shown above may have been higher. Please see the prospectus for the amount and the expiration date of the cap. Prior to or after the commitment expiration date, the cap may be increased or the commitment to maintain the cap may be terminated only with the approval of the Board of Trustees. |
| Expenses Paid, Amount |
|
$ 56
|
| Expense Ratio, Percent |
|
0.53%
|
| Factors Affecting Performance [Text Block] |
|
How did the Fund perform last year and what affected its performance?In a volatile year, the Fund outperformed its strategy benchmark, driven by stock selection. The period saw a fluctuation in investors’ risk appetites as optimism around monetary policy easing gave way to fears that a restrictive trade policy and the Federal Reserve’s decision to pause rate cuts could lead to a recession. However, markets rallied off the April 9 announcement that the implementation of tariffs would be delayed. The Fund made minor changes to sector allocation, with an increase in its consumer discretionary weight while reducing its exposure to real estate and financials. Citigroup, Inc. was the largest contributor, as it is exiting less profitable, non-core franchises and eliminating managerial layers to improve returns and reduce its capital needs, with a goal of achieving more durable and higher-growth cash flow. The largest detractor was Canadian Pacific Kansas City Ltd., an operator of a transnational rail network, on fears that trade policy could affect volumes. Management announced its first share repurchase program in more than three years, and we believe shares are materially undervalued from a reward/risk perspective. |
| Line Graph [Table Text Block] |
|
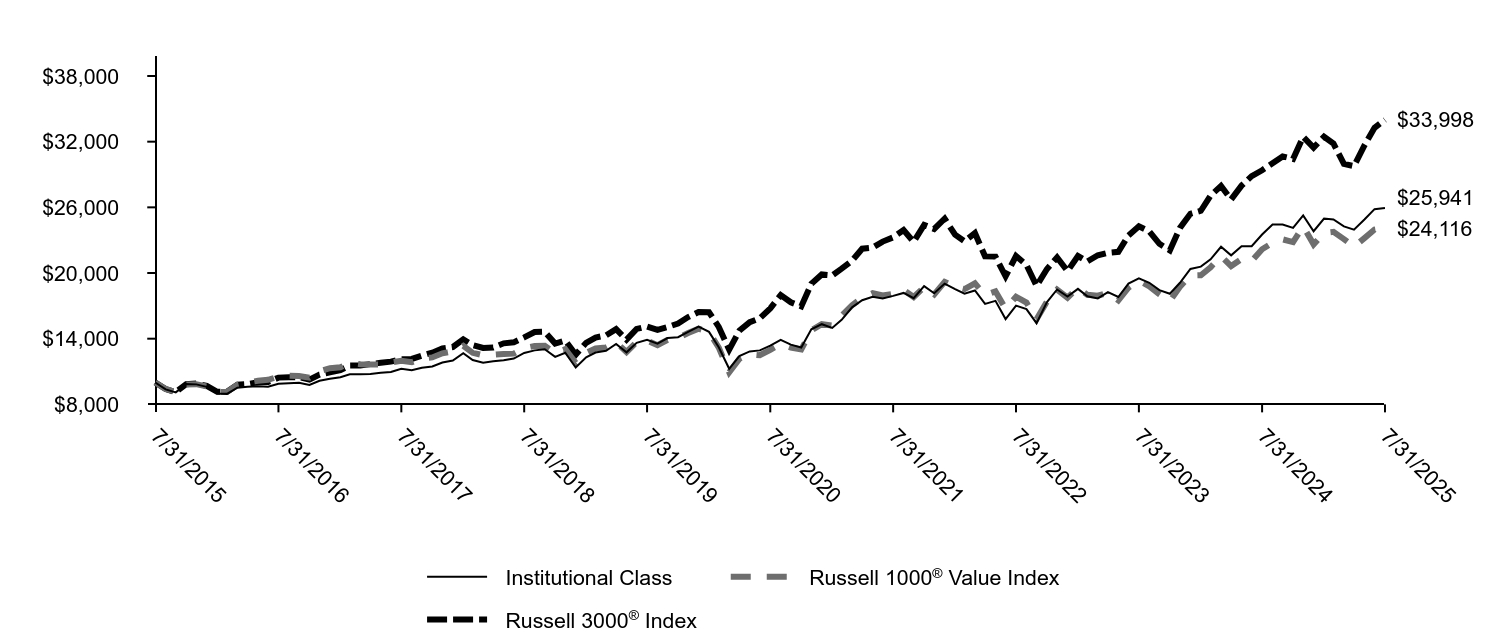
|
Institutional Class |
Russell 1000® Value Index |
Russell 3000® Index |
7/31/2015 |
$10,000 |
$10,000 |
$10,000 |
8/31/2015 |
$9,362 |
$9,404 |
$9,396 |
9/30/2015 |
$9,094 |
$9,121 |
$9,122 |
10/31/2015 |
$9,848 |
$9,809 |
$9,843 |
11/30/2015 |
$9,826 |
$9,846 |
$9,898 |
12/31/2015 |
$9,595 |
$9,634 |
$9,694 |
1/31/2016 |
$8,982 |
$9,137 |
$9,147 |
2/29/2016 |
$8,958 |
$9,134 |
$9,144 |
3/31/2016 |
$9,522 |
$9,792 |
$9,788 |
4/30/2016 |
$9,604 |
$9,998 |
$9,849 |
5/31/2016 |
$9,644 |
$10,153 |
$10,025 |
6/30/2016 |
$9,620 |
$10,241 |
$10,046 |
7/31/2016 |
$9,873 |
$10,538 |
$10,444 |
8/31/2016 |
$9,939 |
$10,620 |
$10,471 |
9/30/2016 |
$9,971 |
$10,598 |
$10,488 |
10/31/2016 |
$9,775 |
$10,434 |
$10,261 |
11/30/2016 |
$10,159 |
$11,029 |
$10,720 |
12/31/2016 |
$10,330 |
$11,305 |
$10,929 |
1/31/2017 |
$10,472 |
$11,386 |
$11,135 |
2/28/2017 |
$10,747 |
$11,795 |
$11,549 |
3/31/2017 |
$10,756 |
$11,675 |
$11,557 |
4/30/2017 |
$10,783 |
$11,653 |
$11,679 |
5/31/2017 |
$10,880 |
$11,641 |
$11,799 |
6/30/2017 |
$10,951 |
$11,832 |
$11,905 |
7/31/2017 |
$11,244 |
$11,989 |
$12,130 |
8/31/2017 |
$11,120 |
$11,849 |
$12,153 |
9/30/2017 |
$11,350 |
$12,200 |
$12,449 |
10/31/2017 |
$11,465 |
$12,289 |
$12,721 |
11/30/2017 |
$11,829 |
$12,665 |
$13,107 |
12/31/2017 |
$12,005 |
$12,850 |
$13,238 |
1/31/2018 |
$12,682 |
$13,347 |
$13,936 |
2/28/2018 |
$12,054 |
$12,709 |
$13,423 |
3/31/2018 |
$11,812 |
$12,486 |
$13,153 |
4/30/2018 |
$11,928 |
$12,527 |
$13,203 |
5/31/2018 |
$12,034 |
$12,601 |
$13,576 |
6/30/2018 |
$12,189 |
$12,633 |
$13,665 |
7/31/2018 |
$12,701 |
$13,133 |
$14,118 |
8/31/2018 |
$12,933 |
$13,327 |
$14,614 |
9/30/2018 |
$13,030 |
$13,353 |
$14,638 |
10/31/2018 |
$12,334 |
$12,662 |
$13,560 |
11/30/2018 |
$12,711 |
$13,040 |
$13,832 |
12/31/2018 |
$11,366 |
$11,788 |
$12,544 |
1/31/2019 |
$12,302 |
$12,705 |
$13,621 |
2/28/2019 |
$12,733 |
$13,111 |
$14,100 |
3/31/2019 |
$12,891 |
$13,194 |
$14,306 |
4/30/2019 |
$13,511 |
$13,662 |
$14,877 |
5/31/2019 |
$12,754 |
$12,784 |
$13,915 |
6/30/2019 |
$13,617 |
$13,702 |
$14,892 |
7/31/2019 |
$13,900 |
$13,815 |
$15,113 |
8/31/2019 |
$13,553 |
$13,409 |
$14,805 |
9/30/2019 |
$14,058 |
$13,887 |
$15,065 |
10/31/2019 |
$14,132 |
$14,081 |
$15,389 |
11/30/2019 |
$14,615 |
$14,517 |
$15,974 |
12/31/2019 |
$15,104 |
$14,916 |
$16,436 |
1/31/2020 |
$14,625 |
$14,595 |
$16,418 |
2/29/2020 |
$13,212 |
$13,182 |
$15,074 |
3/31/2020 |
$11,249 |
$10,929 |
$13,001 |
4/30/2020 |
$12,406 |
$12,158 |
$14,722 |
5/31/2020 |
$12,838 |
$12,574 |
$15,510 |
6/30/2020 |
$12,931 |
$12,491 |
$15,864 |
7/31/2020 |
$13,364 |
$12,985 |
$16,765 |
8/31/2020 |
$13,901 |
$13,522 |
$17,980 |
9/30/2020 |
$13,457 |
$13,190 |
$17,325 |
10/31/2020 |
$13,188 |
$13,016 |
$16,951 |
11/30/2020 |
$14,859 |
$14,767 |
$19,013 |
12/31/2020 |
$15,323 |
$15,333 |
$19,869 |
1/31/2021 |
$14,979 |
$15,193 |
$19,780 |
2/28/2021 |
$15,727 |
$16,111 |
$20,399 |
3/31/2021 |
$16,865 |
$17,059 |
$21,130 |
4/30/2021 |
$17,518 |
$17,741 |
$22,219 |
5/31/2021 |
$17,838 |
$18,155 |
$22,320 |
6/30/2021 |
$17,684 |
$17,947 |
$22,871 |
7/31/2021 |
$17,909 |
$18,091 |
$23,258 |
8/31/2021 |
$18,182 |
$18,450 |
$23,921 |
9/30/2021 |
$17,695 |
$17,807 |
$22,848 |
10/31/2021 |
$18,798 |
$18,712 |
$24,393 |
11/30/2021 |
$18,146 |
$18,052 |
$24,021 |
12/31/2021 |
$19,030 |
$19,191 |
$24,967 |
1/31/2022 |
$18,524 |
$18,744 |
$23,498 |
2/28/2022 |
$18,105 |
$18,527 |
$22,906 |
3/31/2022 |
$18,408 |
$19,050 |
$23,649 |
4/30/2022 |
$17,179 |
$17,975 |
$21,527 |
5/31/2022 |
$17,454 |
$18,324 |
$21,498 |
6/30/2022 |
$15,791 |
$16,723 |
$19,700 |
7/31/2022 |
$17,020 |
$17,832 |
$21,548 |
8/31/2022 |
$16,702 |
$17,301 |
$20,744 |
9/30/2022 |
$15,415 |
$15,784 |
$18,820 |
10/31/2022 |
$17,338 |
$17,402 |
$20,364 |
11/30/2022 |
$18,495 |
$18,490 |
$21,426 |
12/31/2022 |
$17,855 |
$17,744 |
$20,172 |
1/31/2023 |
$18,552 |
$18,664 |
$21,561 |
2/28/2023 |
$17,871 |
$18,006 |
$21,057 |
3/31/2023 |
$17,680 |
$17,923 |
$21,620 |
4/30/2023 |
$18,251 |
$18,193 |
$21,851 |
5/31/2023 |
$17,807 |
$17,491 |
$21,936 |
6/30/2023 |
$19,028 |
$18,653 |
$23,433 |
7/31/2023 |
$19,520 |
$19,309 |
$24,273 |
8/31/2023 |
$19,107 |
$18,788 |
$23,805 |
9/30/2023 |
$18,441 |
$18,063 |
$22,671 |
10/31/2023 |
$18,108 |
$17,426 |
$22,070 |
11/30/2023 |
$19,107 |
$18,740 |
$24,128 |
12/31/2023 |
$20,370 |
$19,778 |
$25,408 |
1/31/2024 |
$20,583 |
$19,799 |
$25,689 |
2/29/2024 |
$21,254 |
$20,529 |
$27,080 |
3/31/2024 |
$22,400 |
$21,556 |
$27,953 |
4/30/2024 |
$21,614 |
$20,635 |
$26,723 |
5/31/2024 |
$22,450 |
$21,289 |
$27,986 |
6/30/2024 |
$22,450 |
$21,089 |
$28,852 |
7/31/2024 |
$23,514 |
$22,167 |
$29,389 |
8/31/2024 |
$24,431 |
$22,762 |
$30,029 |
9/30/2024 |
$24,431 |
$23,077 |
$30,650 |
10/31/2024 |
$24,120 |
$22,823 |
$30,425 |
11/30/2024 |
$25,266 |
$24,281 |
$32,449 |
12/31/2024 |
$23,818 |
$22,620 |
$31,457 |
1/31/2025 |
$24,978 |
$23,667 |
$32,450 |
2/28/2025 |
$24,889 |
$23,763 |
$31,828 |
3/31/2025 |
$24,264 |
$23,103 |
$29,971 |
4/30/2025 |
$23,961 |
$22,399 |
$29,770 |
5/31/2025 |
$24,889 |
$23,186 |
$31,657 |
6/30/2025 |
$25,834 |
$23,978 |
$33,266 |
7/31/2025 |
$25,941 |
$24,116 |
$33,998 |
|
| Average Annual Return [Table Text Block] |
|
AVERAGE ANNUAL TOTAL RETURNS (%)
AATR |
1 Year |
5 Years |
10 Years |
Institutional Class |
10.32 |
14.19 |
10.00 |
Russell 1000® Value Index |
8.79 |
13.18 |
9.20 |
Russell 3000® Index |
15.68 |
15.19 |
13.02 | |
| AssetsNet |
|
$ 2,001,713,305
|
| Holdings Count | Holding |
|
46
|
| Advisory Fees Paid, Amount |
|
$ 6,257,425
|
| InvestmentCompanyPortfolioTurnover |
|
44.00%
|
| Holdings [Text Block] |
|
SECTOR ALLOCATION (% OF LONG-TERM INVESTMENTS)
Financials |
21.0 |
Industrials |
15.3 |
Health care |
14.0 |
Consumer discretionary |
10.3 |
Information technology |
9.9 |
Consumer staples |
7.7 |
Energy |
5.8 |
Materials |
4.8 |
Communication services |
4.6 |
Real estate |
3.5 |
Utilities |
3.1 | |
| Largest Holdings [Text Block] |
|
TOP TEN HOLDINGS (% OF NET ASSETS)
Alphabet, Inc. Class C |
4.5 |
Canadian Pacific Kansas City Ltd. |
4.4 |
Bank of America Corp. |
3.9 |
Intercontinental Exchange, Inc. |
3.8 |
Citigroup, Inc. |
3.6 |
Berkshire Hathaway, Inc. Class B |
3.3 |
Mondelez International, Inc. Class A |
3.2 |
D.R. Horton, Inc. |
3.0 |
NextEra Energy, Inc. |
3.0 |
Labcorp Holdings, Inc. |
2.9 | |
| Material Fund Change [Text Block] |
|
|
| C000089436 |
|
|
| Shareholder Report [Line Items] |
|
|
| Fund Name |
|
Special Large Cap Value Fund
|
| Class Name |
|
Class C
|
| Trading Symbol |
|
EIVCX
|
| Annual or Semi-Annual Statement [Text Block] |
|
This annual shareholder report contains important information about Special Large Cap Value Fund for the period from August 1, 2024 to July 31, 2025.
|
| Shareholder Report Annual or Semi-Annual |
|
Annual Shareholder Report
|
| Additional Information [Text Block] |
|
You can find additional information about the Fund at allspringglobal.com. You can also request this information by contacting us at 1-800-222-8222.
|
| Material Fund Change Notice [Text Block] |
|
This report describes changes to the Fund that occurred either during or after the reporting period.
|
| Additional Information Phone Number |
|
<span style="white-space: nowrap; box-sizing: border-box; color: rgb(0, 0, 0); display: inline; flex-wrap: nowrap; font-size: 12px; font-weight: 400; grid-area: auto; line-height: 18px; margin: 0px; overflow: visible; text-align: left; text-align-last: auto;"> 1-800-222-8222.</span>
|
| Additional Information Website |
|
<span style="box-sizing: border-box; color: rgb(0, 0, 0); display: inline; flex-wrap: nowrap; font-size: 12px; font-weight: 400; grid-area: auto; line-height: 18px; margin: 0px; overflow: visible; text-align: left; text-align-last: auto; white-space-collapse: preserve-breaks;">allspringglobal.com</span>
|
| Expenses [Text Block] |
|
What were the Fund costs for the past year?The table explains the costs you would have paid within the reporting period based on a hypothetical $10,000 investment.
CLASS NAME |
COSTS OF A $10,000 INVESTMENT |
COSTS PAID AS A % OF A $10,000 INVESTMENT |
Class C |
$166 |
1.59% | The manager has contractually committed to waive fees and/or reimburse certain expenses to the extent necessary to cap the Fund's total annual fund operating expense ratio at a specific amount. Without this cap, the costs shown above may have been higher. Please see the prospectus for the amount and the expiration date of the cap. Prior to or after the commitment expiration date, the cap may be increased or the commitment to maintain the cap may be terminated only with the approval of the Board of Trustees. |
| Expenses Paid, Amount |
|
$ 166
|
| Expense Ratio, Percent |
|
1.59%
|
| Factors Affecting Performance [Text Block] |
|
How did the Fund perform last year and what affected its performance?In a volatile year, the Fund outperformed its strategy benchmark, driven by stock selection. The period saw a fluctuation in investors’ risk appetites as optimism around monetary policy easing gave way to fears that a restrictive trade policy and the Federal Reserve’s decision to pause rate cuts could lead to a recession. However, markets rallied off the April 9 announcement that the implementation of tariffs would be delayed. The Fund made minor changes to sector allocation, with an increase in its consumer discretionary weight while reducing its exposure to real estate and financials. Citigroup, Inc. was the largest contributor, as it is exiting less profitable, non-core franchises and eliminating managerial layers to improve returns and reduce its capital needs, with a goal of achieving more durable and higher-growth cash flow. The largest detractor was Canadian Pacific Kansas City Ltd., an operator of a transnational rail network, on fears that trade policy could affect volumes. Management announced its first share repurchase program in more than three years, and we believe shares are materially undervalued from a reward/risk perspective. |
| Line Graph [Table Text Block] |
|
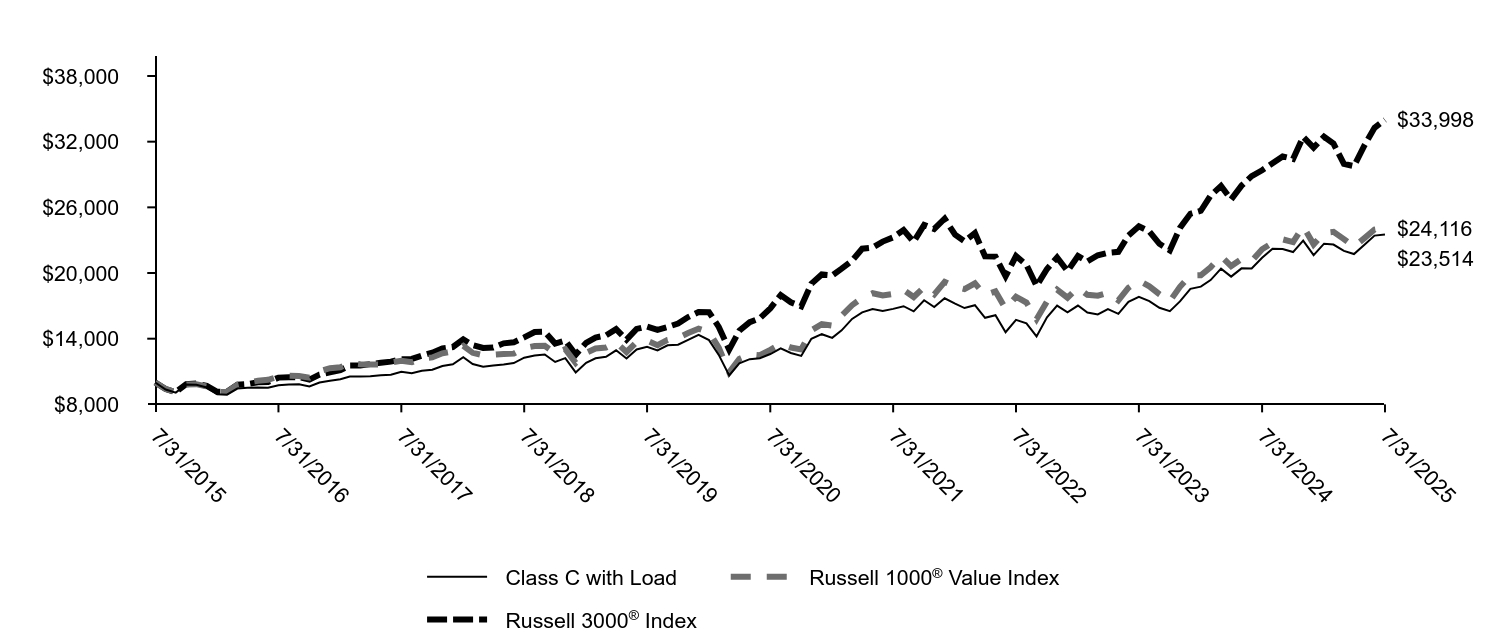
|
Class C with Load |
Russell 1000® Value Index |
Russell 3000® Index |
7/31/2015 |
$10,000 |
$10,000 |
$10,000 |
8/31/2015 |
$9,353 |
$9,404 |
$9,396 |
9/30/2015 |
$9,071 |
$9,121 |
$9,122 |
10/31/2015 |
$9,814 |
$9,809 |
$9,843 |
11/30/2015 |
$9,784 |
$9,846 |
$9,898 |
12/31/2015 |
$9,546 |
$9,634 |
$9,694 |
1/31/2016 |
$8,923 |
$9,137 |
$9,147 |
2/29/2016 |
$8,889 |
$9,134 |
$9,144 |
3/31/2016 |
$9,446 |
$9,792 |
$9,788 |
4/30/2016 |
$9,512 |
$9,998 |
$9,849 |
5/31/2016 |
$9,546 |
$10,153 |
$10,025 |
6/30/2016 |
$9,512 |
$10,241 |
$10,046 |
7/31/2016 |
$9,753 |
$10,538 |
$10,444 |
8/31/2016 |
$9,812 |
$10,620 |
$10,471 |
9/30/2016 |
$9,828 |
$10,598 |
$10,488 |
10/31/2016 |
$9,629 |
$10,434 |
$10,261 |
11/30/2016 |
$9,994 |
$11,029 |
$10,720 |
12/31/2016 |
$10,160 |
$11,305 |
$10,929 |
1/31/2017 |
$10,294 |
$11,386 |
$11,135 |
2/28/2017 |
$10,543 |
$11,795 |
$11,549 |
3/31/2017 |
$10,543 |
$11,675 |
$11,557 |
4/30/2017 |
$10,561 |
$11,653 |
$11,679 |
5/31/2017 |
$10,650 |
$11,641 |
$11,799 |
6/30/2017 |
$10,704 |
$11,832 |
$11,905 |
7/31/2017 |
$10,980 |
$11,989 |
$12,130 |
8/31/2017 |
$10,847 |
$11,849 |
$12,153 |
9/30/2017 |
$11,061 |
$12,200 |
$12,449 |
10/31/2017 |
$11,159 |
$12,289 |
$12,721 |
11/30/2017 |
$11,507 |
$12,665 |
$13,107 |
12/31/2017 |
$11,661 |
$12,850 |
$13,238 |
1/31/2018 |
$12,308 |
$13,347 |
$13,936 |
2/28/2018 |
$11,690 |
$12,709 |
$13,423 |
3/31/2018 |
$11,448 |
$12,486 |
$13,153 |
4/30/2018 |
$11,555 |
$12,527 |
$13,203 |
5/31/2018 |
$11,642 |
$12,601 |
$13,576 |
6/30/2018 |
$11,777 |
$12,633 |
$13,665 |
7/31/2018 |
$12,260 |
$13,133 |
$14,118 |
8/31/2018 |
$12,472 |
$13,327 |
$14,614 |
9/30/2018 |
$12,559 |
$13,353 |
$14,638 |
10/31/2018 |
$11,873 |
$12,662 |
$13,560 |
11/30/2018 |
$12,221 |
$13,040 |
$13,832 |
12/31/2018 |
$10,920 |
$11,788 |
$12,544 |
1/31/2019 |
$11,804 |
$12,705 |
$13,621 |
2/28/2019 |
$12,210 |
$13,111 |
$14,100 |
3/31/2019 |
$12,345 |
$13,194 |
$14,306 |
4/30/2019 |
$12,938 |
$13,662 |
$14,877 |
5/31/2019 |
$12,189 |
$12,784 |
$13,915 |
6/30/2019 |
$13,011 |
$13,702 |
$14,892 |
7/31/2019 |
$13,260 |
$13,815 |
$15,113 |
8/31/2019 |
$12,927 |
$13,409 |
$14,805 |
9/30/2019 |
$13,395 |
$13,887 |
$15,065 |
10/31/2019 |
$13,447 |
$14,081 |
$15,389 |
11/30/2019 |
$13,895 |
$14,517 |
$15,974 |
12/31/2019 |
$14,341 |
$14,916 |
$16,436 |
1/31/2020 |
$13,871 |
$14,595 |
$16,418 |
2/29/2020 |
$12,518 |
$13,182 |
$15,074 |
3/31/2020 |
$10,650 |
$10,929 |
$13,001 |
4/30/2020 |
$11,739 |
$12,158 |
$14,722 |
5/31/2020 |
$12,128 |
$12,574 |
$15,510 |
6/30/2020 |
$12,209 |
$12,491 |
$15,864 |
7/31/2020 |
$12,598 |
$12,985 |
$16,765 |
8/31/2020 |
$13,126 |
$13,522 |
$17,980 |
9/30/2020 |
$12,690 |
$13,190 |
$17,325 |
10/31/2020 |
$12,427 |
$13,016 |
$16,951 |
11/30/2020 |
$13,986 |
$14,767 |
$19,013 |
12/31/2020 |
$14,410 |
$15,333 |
$19,869 |
1/31/2021 |
$14,077 |
$15,193 |
$19,780 |
2/28/2021 |
$14,765 |
$16,111 |
$20,399 |
3/31/2021 |
$15,808 |
$17,059 |
$21,130 |
4/30/2021 |
$16,404 |
$17,741 |
$22,219 |
5/31/2021 |
$16,702 |
$18,155 |
$22,320 |
6/30/2021 |
$16,542 |
$17,947 |
$22,871 |
7/31/2021 |
$16,725 |
$18,091 |
$23,258 |
8/31/2021 |
$16,966 |
$18,450 |
$23,921 |
9/30/2021 |
$16,496 |
$17,807 |
$22,848 |
10/31/2021 |
$17,516 |
$18,712 |
$24,393 |
11/30/2021 |
$16,886 |
$18,052 |
$24,021 |
12/31/2021 |
$17,690 |
$19,191 |
$24,967 |
1/31/2022 |
$17,202 |
$18,744 |
$23,498 |
2/28/2022 |
$16,798 |
$18,527 |
$22,906 |
3/31/2022 |
$17,062 |
$19,050 |
$23,649 |
4/30/2022 |
$15,905 |
$17,975 |
$21,527 |
5/31/2022 |
$16,142 |
$18,324 |
$21,498 |
6/30/2022 |
$14,595 |
$16,723 |
$19,700 |
7/31/2022 |
$15,724 |
$17,832 |
$21,548 |
8/31/2022 |
$15,404 |
$17,301 |
$20,744 |
9/30/2022 |
$14,205 |
$15,784 |
$18,820 |
10/31/2022 |
$15,961 |
$17,402 |
$20,364 |
11/30/2022 |
$17,021 |
$18,490 |
$21,426 |
12/31/2022 |
$16,406 |
$17,744 |
$20,172 |
1/31/2023 |
$17,027 |
$18,664 |
$21,561 |
2/28/2023 |
$16,391 |
$18,006 |
$21,057 |
3/31/2023 |
$16,209 |
$17,923 |
$21,620 |
4/30/2023 |
$16,694 |
$18,193 |
$21,851 |
5/31/2023 |
$16,270 |
$17,491 |
$21,936 |
6/30/2023 |
$17,376 |
$18,653 |
$23,433 |
7/31/2023 |
$17,815 |
$19,309 |
$24,273 |
8/31/2023 |
$17,435 |
$18,788 |
$23,805 |
9/30/2023 |
$16,821 |
$18,063 |
$22,671 |
10/31/2023 |
$16,513 |
$17,426 |
$22,070 |
11/30/2023 |
$17,406 |
$18,740 |
$24,128 |
12/31/2023 |
$18,558 |
$19,778 |
$25,408 |
1/31/2024 |
$18,754 |
$19,799 |
$25,689 |
2/29/2024 |
$19,356 |
$20,529 |
$27,080 |
3/31/2024 |
$20,395 |
$21,556 |
$27,953 |
4/30/2024 |
$19,672 |
$20,635 |
$26,723 |
5/31/2024 |
$20,425 |
$21,289 |
$27,986 |
6/30/2024 |
$20,410 |
$21,089 |
$28,852 |
7/31/2024 |
$21,388 |
$22,167 |
$29,389 |
8/31/2024 |
$22,216 |
$22,762 |
$30,029 |
9/30/2024 |
$22,201 |
$23,077 |
$30,650 |
10/31/2024 |
$21,915 |
$22,823 |
$30,425 |
11/30/2024 |
$22,953 |
$24,281 |
$32,449 |
12/31/2024 |
$21,632 |
$22,620 |
$31,457 |
1/31/2025 |
$22,680 |
$23,667 |
$32,450 |
2/28/2025 |
$22,598 |
$23,763 |
$31,828 |
3/31/2025 |
$22,025 |
$23,103 |
$29,971 |
4/30/2025 |
$21,731 |
$22,399 |
$29,770 |
5/31/2025 |
$22,582 |
$23,186 |
$31,657 |
6/30/2025 |
$23,416 |
$23,978 |
$33,266 |
7/31/2025 |
$23,514 |
$24,116 |
$33,998 |
|
| Average Annual Return [Table Text Block] |
|
AVERAGE ANNUAL TOTAL RETURNS (%)
AATR |
1 Year |
5 Years |
10 Years |
Class C |
9.13 |
12.96 |
8.93 |
Class C with Load |
8.13 |
12.96 |
8.93 |
Russell 1000® Value Index |
8.79 |
13.18 |
9.20 |
Russell 3000® Index |
15.68 |
15.19 |
13.02 | |
| Material Change Date |
Aug. 01, 2024
|
|
| AssetsNet |
|
$ 2,001,713,305
|
| Holdings Count | Holding |
|
46
|
| Advisory Fees Paid, Amount |
|
$ 6,257,425
|
| InvestmentCompanyPortfolioTurnover |
|
44.00%
|
| Holdings [Text Block] |
|
SECTOR ALLOCATION (% OF LONG-TERM INVESTMENTS)
Financials |
21.0 |
Industrials |
15.3 |
Health care |
14.0 |
Consumer discretionary |
10.3 |
Information technology |
9.9 |
Consumer staples |
7.7 |
Energy |
5.8 |
Materials |
4.8 |
Communication services |
4.6 |
Real estate |
3.5 |
Utilities |
3.1 | |
| Largest Holdings [Text Block] |
|
TOP TEN HOLDINGS (% OF NET ASSETS)
Alphabet, Inc. Class C |
4.5 |
Canadian Pacific Kansas City Ltd. |
4.4 |
Bank of America Corp. |
3.9 |
Intercontinental Exchange, Inc. |
3.8 |
Citigroup, Inc. |
3.6 |
Berkshire Hathaway, Inc. Class B |
3.3 |
Mondelez International, Inc. Class A |
3.2 |
D.R. Horton, Inc. |
3.0 |
NextEra Energy, Inc. |
3.0 |
Labcorp Holdings, Inc. |
2.9 | |
| Material Fund Change [Text Block] |
|
This is a summary of certain changes and planned changes to the Fund since August 1, 2024. At a meeting held on August 19-20, 2025, the Board of Trustees of the Fund approved the conversion of the Fund’s Class C shares into Class A shares effective on or about the close of business on November 14, 2025. In addition, effective at the close of business on September 29, 2025, Class C will be closed to new investors and additional investments from existing shareholders. |
| Summary of Change Legend [Text Block] |
|
This is a summary of certain changes and planned changes to the Fund since August 1, 2024.
|
| C000089434 |
|
|
| Shareholder Report [Line Items] |
|
|
| Fund Name |
|
Special Large Cap Value Fund
|
| Class Name |
|
Class A
|
| Trading Symbol |
|
EIVAX
|
| Annual or Semi-Annual Statement [Text Block] |
|
This annual shareholder report contains important information about Special Large Cap Value Fund for the period from August 1, 2024 to July 31, 2025.
|
| Shareholder Report Annual or Semi-Annual |
|
Annual Shareholder Report
|
| Additional Information [Text Block] |
|
You can find additional information about the Fund at allspringglobal.com. You can also request this information by contacting us at 1-800-222-8222.
|
| Additional Information Phone Number |
|
<span style="white-space: nowrap; box-sizing: border-box; color: rgb(0, 0, 0); display: inline; flex-wrap: nowrap; font-size: 12px; font-weight: 400; grid-area: auto; line-height: 18px; margin: 0px; overflow: visible; text-align: left; text-align-last: auto;"> 1-800-222-8222.</span>
|
| Additional Information Website |
|
<span style="box-sizing: border-box; color: rgb(0, 0, 0); display: inline; flex-wrap: nowrap; font-size: 12px; font-weight: 400; grid-area: auto; line-height: 18px; margin: 0px; overflow: visible; text-align: left; text-align-last: auto; white-space-collapse: preserve-breaks;">allspringglobal.com</span>
|
| Expenses [Text Block] |
|
What were the Fund costs for the past year?The table explains the costs you would have paid within the reporting period based on a hypothetical $10,000 investment.
CLASS NAME |
COSTS OF A $10,000 INVESTMENT |
COSTS PAID AS A % OF A $10,000 INVESTMENT |
Class A |
$88 |
0.84% | The manager has contractually committed to waive fees and/or reimburse certain expenses to the extent necessary to cap the Fund's total annual fund operating expense ratio at a specific amount. Without this cap, the costs shown above may have been higher. Please see the prospectus for the amount and the expiration date of the cap. Prior to or after the commitment expiration date, the cap may be increased or the commitment to maintain the cap may be terminated only with the approval of the Board of Trustees. |
| Expenses Paid, Amount |
|
$ 88
|
| Expense Ratio, Percent |
|
0.84%
|
| Factors Affecting Performance [Text Block] |
|
How did the Fund perform last year and what affected its performance?In a volatile year, the Fund outperformed its strategy benchmark, driven by stock selection. The period saw a fluctuation in investors’ risk appetites as optimism around monetary policy easing gave way to fears that a restrictive trade policy and the Federal Reserve’s decision to pause rate cuts could lead to a recession. However, markets rallied off the April 9 announcement that the implementation of tariffs would be delayed. The Fund made minor changes to sector allocation, with an increase in its consumer discretionary weight while reducing its exposure to real estate and financials. Citigroup, Inc. was the largest contributor, as it is exiting less profitable, non-core franchises and eliminating managerial layers to improve returns and reduce its capital needs, with a goal of achieving more durable and higher-growth cash flow. The largest detractor was Canadian Pacific Kansas City Ltd., an operator of a transnational rail network, on fears that trade policy could affect volumes. Management announced its first share repurchase program in more than three years, and we believe shares are materially undervalued from a reward/risk perspective. |
| Line Graph [Table Text Block] |
|
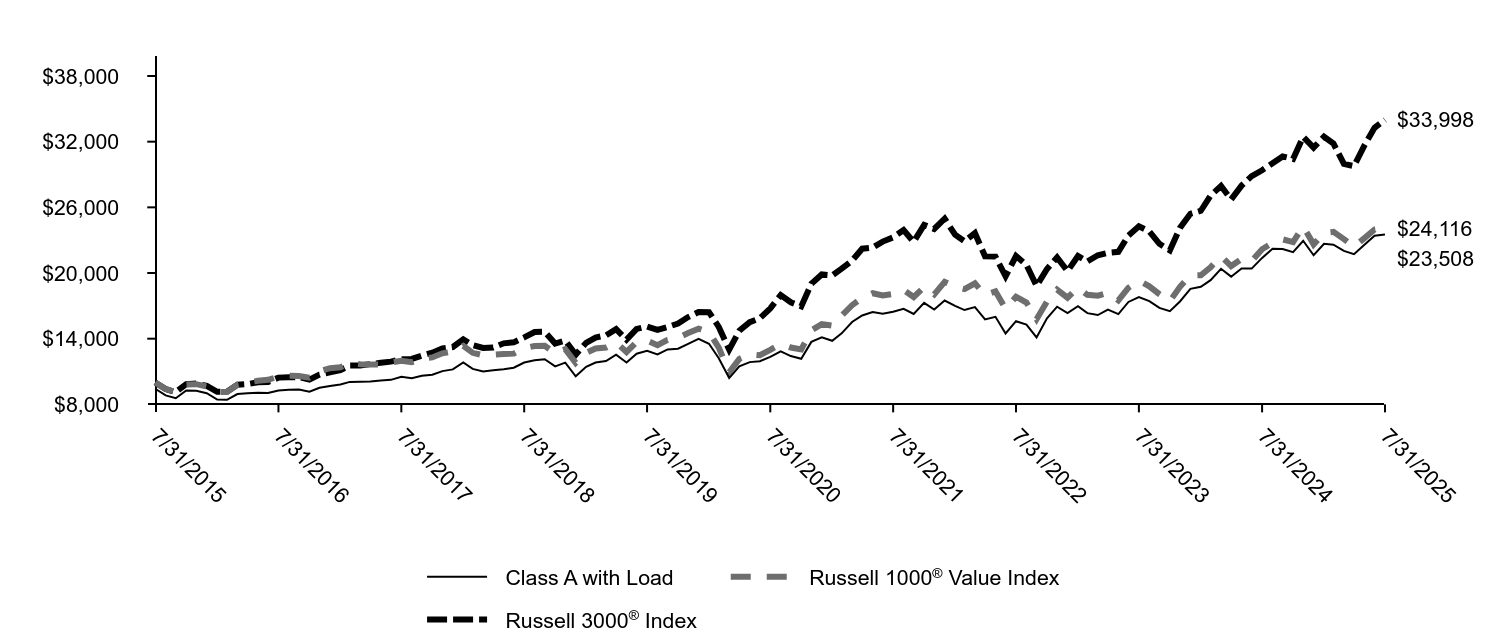
|
Class A with Load |
Russell 1000® Value Index |
Russell 3000® Index |
7/31/2015 |
$9,425 |
$10,000 |
$10,000 |
8/31/2015 |
$8,821 |
$9,404 |
$9,396 |
9/30/2015 |
$8,560 |
$9,121 |
$9,122 |
10/31/2015 |
$9,267 |
$9,809 |
$9,843 |
11/30/2015 |
$9,247 |
$9,846 |
$9,898 |
12/31/2015 |
$9,023 |
$9,634 |
$9,694 |
1/31/2016 |
$8,445 |
$9,137 |
$9,147 |
2/29/2016 |
$8,414 |
$9,134 |
$9,144 |
3/31/2016 |
$8,946 |
$9,792 |
$9,788 |
4/30/2016 |
$9,015 |
$9,998 |
$9,849 |
5/31/2016 |
$9,054 |
$10,153 |
$10,025 |
6/30/2016 |
$9,031 |
$10,241 |
$10,046 |
7/31/2016 |
$9,262 |
$10,538 |
$10,444 |
8/31/2016 |
$9,324 |
$10,620 |
$10,471 |
9/30/2016 |
$9,347 |
$10,598 |
$10,488 |
10/31/2016 |
$9,162 |
$10,434 |
$10,261 |
11/30/2016 |
$9,517 |
$11,029 |
$10,720 |
12/31/2016 |
$9,679 |
$11,305 |
$10,929 |
1/31/2017 |
$9,812 |
$11,386 |
$11,135 |
2/28/2017 |
$10,054 |
$11,795 |
$11,549 |
3/31/2017 |
$10,062 |
$11,675 |
$11,557 |
4/30/2017 |
$10,088 |
$11,653 |
$11,679 |
5/31/2017 |
$10,179 |
$11,641 |
$11,799 |
6/30/2017 |
$10,238 |
$11,832 |
$11,905 |
7/31/2017 |
$10,513 |
$11,989 |
$12,130 |
8/31/2017 |
$10,388 |
$11,849 |
$12,153 |
9/30/2017 |
$10,604 |
$12,200 |
$12,449 |
10/31/2017 |
$10,704 |
$12,289 |
$12,721 |
11/30/2017 |
$11,038 |
$12,665 |
$13,107 |
12/31/2017 |
$11,194 |
$12,850 |
$13,238 |
1/31/2018 |
$11,828 |
$13,347 |
$13,936 |
2/28/2018 |
$11,239 |
$12,709 |
$13,423 |
3/31/2018 |
$11,013 |
$12,486 |
$13,153 |
4/30/2018 |
$11,113 |
$12,527 |
$13,203 |
5/31/2018 |
$11,212 |
$12,601 |
$13,576 |
6/30/2018 |
$11,348 |
$12,633 |
$13,665 |
7/31/2018 |
$11,819 |
$13,133 |
$14,118 |
8/31/2018 |
$12,027 |
$13,327 |
$14,614 |
9/30/2018 |
$12,127 |
$13,353 |
$14,638 |
10/31/2018 |
$11,466 |
$12,662 |
$13,560 |
11/30/2018 |
$11,810 |
$13,040 |
$13,832 |
12/31/2018 |
$10,560 |
$11,788 |
$12,544 |
1/31/2019 |
$11,424 |
$12,705 |
$13,621 |
2/28/2019 |
$11,826 |
$13,111 |
$14,100 |
3/31/2019 |
$11,963 |
$13,194 |
$14,306 |
4/30/2019 |
$12,542 |
$13,662 |
$14,877 |
5/31/2019 |
$11,826 |
$12,784 |
$13,915 |
6/30/2019 |
$12,631 |
$13,702 |
$14,892 |
7/31/2019 |
$12,886 |
$13,815 |
$15,113 |
8/31/2019 |
$12,562 |
$13,409 |
$14,805 |
9/30/2019 |
$13,023 |
$13,887 |
$15,065 |
10/31/2019 |
$13,082 |
$14,081 |
$15,389 |
11/30/2019 |
$13,534 |
$14,517 |
$15,974 |
12/31/2019 |
$13,980 |
$14,916 |
$16,436 |
1/31/2020 |
$13,534 |
$14,595 |
$16,418 |
2/29/2020 |
$12,219 |
$13,182 |
$15,074 |
3/31/2020 |
$10,403 |
$10,929 |
$13,001 |
4/30/2020 |
$11,469 |
$12,158 |
$14,722 |
5/31/2020 |
$11,860 |
$12,574 |
$15,510 |
6/30/2020 |
$11,947 |
$12,491 |
$15,864 |
7/31/2020 |
$12,339 |
$12,985 |
$16,765 |
8/31/2020 |
$12,839 |
$13,522 |
$17,980 |
9/30/2020 |
$12,415 |
$13,190 |
$17,325 |
10/31/2020 |
$12,165 |
$13,016 |
$16,951 |
11/30/2020 |
$13,708 |
$14,767 |
$19,013 |
12/31/2020 |
$14,128 |
$15,333 |
$19,869 |
1/31/2021 |
$13,810 |
$15,193 |
$19,780 |
2/28/2021 |
$14,491 |
$16,111 |
$20,399 |
3/31/2021 |
$15,525 |
$17,059 |
$21,130 |
4/30/2021 |
$16,119 |
$17,741 |
$22,219 |
5/31/2021 |
$16,426 |
$18,155 |
$22,320 |
6/30/2021 |
$16,272 |
$17,947 |
$22,871 |
7/31/2021 |
$16,470 |
$18,091 |
$23,258 |
8/31/2021 |
$16,723 |
$18,450 |
$23,921 |
9/30/2021 |
$16,261 |
$17,807 |
$22,848 |
10/31/2021 |
$17,273 |
$18,712 |
$24,393 |
11/30/2021 |
$16,668 |
$18,052 |
$24,021 |
12/31/2021 |
$17,486 |
$19,191 |
$24,967 |
1/31/2022 |
$17,004 |
$18,744 |
$23,498 |
2/28/2022 |
$16,616 |
$18,527 |
$22,906 |
3/31/2022 |
$16,884 |
$19,050 |
$23,649 |
4/30/2022 |
$15,760 |
$17,975 |
$21,527 |
5/31/2022 |
$16,001 |
$18,324 |
$21,498 |
6/30/2022 |
$14,476 |
$16,723 |
$19,700 |
7/31/2022 |
$15,600 |
$17,832 |
$21,548 |
8/31/2022 |
$15,292 |
$17,301 |
$20,744 |
9/30/2022 |
$14,114 |
$15,784 |
$18,820 |
10/31/2022 |
$15,867 |
$17,402 |
$20,364 |
11/30/2022 |
$16,924 |
$18,490 |
$21,426 |
12/31/2022 |
$16,333 |
$17,744 |
$20,172 |
1/31/2023 |
$16,962 |
$18,664 |
$21,561 |
2/28/2023 |
$16,333 |
$18,006 |
$21,057 |
3/31/2023 |
$16,158 |
$17,923 |
$21,620 |
4/30/2023 |
$16,655 |
$18,193 |
$21,851 |
5/31/2023 |
$16,246 |
$17,491 |
$21,936 |
6/30/2023 |
$17,357 |
$18,653 |
$23,433 |
7/31/2023 |
$17,810 |
$19,309 |
$24,273 |
8/31/2023 |
$17,430 |
$18,788 |
$23,805 |
9/30/2023 |
$16,816 |
$18,063 |
$22,671 |
10/31/2023 |
$16,509 |
$17,426 |
$22,070 |
11/30/2023 |
$17,401 |
$18,740 |
$24,128 |
12/31/2023 |
$18,553 |
$19,778 |
$25,408 |
1/31/2024 |
$18,749 |
$19,799 |
$25,689 |
2/29/2024 |
$19,351 |
$20,529 |
$27,080 |
3/31/2024 |
$20,389 |
$21,556 |
$27,953 |
4/30/2024 |
$19,667 |
$20,635 |
$26,723 |
5/31/2024 |
$20,419 |
$21,289 |
$27,986 |
6/30/2024 |
$20,404 |
$21,089 |
$28,852 |
7/31/2024 |
$21,382 |
$22,167 |
$29,389 |
8/31/2024 |
$22,210 |
$22,762 |
$30,029 |
9/30/2024 |
$22,195 |
$23,077 |
$30,650 |
10/31/2024 |
$21,909 |
$22,823 |
$30,425 |
11/30/2024 |
$22,947 |
$24,281 |
$32,449 |
12/31/2024 |
$21,626 |
$22,620 |
$31,457 |
1/31/2025 |
$22,673 |
$23,667 |
$32,450 |
2/28/2025 |
$22,592 |
$23,763 |
$31,828 |
3/31/2025 |
$22,019 |
$23,103 |
$29,971 |
4/30/2025 |
$21,725 |
$22,399 |
$29,770 |
5/31/2025 |
$22,575 |
$23,186 |
$31,657 |
6/30/2025 |
$23,410 |
$23,978 |
$33,266 |
7/31/2025 |
$23,508 |
$24,116 |
$33,998 |
|
| Average Annual Return [Table Text Block] |
|
AVERAGE ANNUAL TOTAL RETURNS (%)
AATR |
1 Year |
5 Years |
10 Years |
Class A |
9.94 |
13.76 |
9.57 |
Class A with Load |
3.62 |
12.42 |
8.92 |
Russell 1000® Value Index |
8.79 |
13.18 |
9.20 |
Russell 3000® Index |
15.68 |
15.19 |
13.02 | |
| AssetsNet |
|
$ 2,001,713,305
|
| Holdings Count | Holding |
|
46
|
| Advisory Fees Paid, Amount |
|
$ 6,257,425
|
| InvestmentCompanyPortfolioTurnover |
|
44.00%
|
| Holdings [Text Block] |
|
SECTOR ALLOCATION (% OF LONG-TERM INVESTMENTS)
Financials |
21.0 |
Industrials |
15.3 |
Health care |
14.0 |
Consumer discretionary |
10.3 |
Information technology |
9.9 |
Consumer staples |
7.7 |
Energy |
5.8 |
Materials |
4.8 |
Communication services |
4.6 |
Real estate |
3.5 |
Utilities |
3.1 | |
| Largest Holdings [Text Block] |
|
TOP TEN HOLDINGS (% OF NET ASSETS)
Alphabet, Inc. Class C |
4.5 |
Canadian Pacific Kansas City Ltd. |
4.4 |
Bank of America Corp. |
3.9 |
Intercontinental Exchange, Inc. |
3.8 |
Citigroup, Inc. |
3.6 |
Berkshire Hathaway, Inc. Class B |
3.3 |
Mondelez International, Inc. Class A |
3.2 |
D.R. Horton, Inc. |
3.0 |
NextEra Energy, Inc. |
3.0 |
Labcorp Holdings, Inc. |
2.9 | |
| Material Fund Change [Text Block] |
|
|
| C000092797 |
|
|
| Shareholder Report [Line Items] |
|
|
| Fund Name |
|
Special Large Cap Value Fund
|
| Class Name |
|
Administrator Class
|
| Trading Symbol |
|
EIVDX
|
| Annual or Semi-Annual Statement [Text Block] |
|
This annual shareholder report contains important information about Special Large Cap Value Fund for the period from August 1, 2024 to July 31, 2025.
|
| Shareholder Report Annual or Semi-Annual |
|
Annual Shareholder Report
|
| Additional Information [Text Block] |
|
You can find additional information about the Fund at allspringglobal.com. You can also request this information by contacting us at 1-800-222-8222.
|
| Additional Information Phone Number |
|
<span style="white-space: nowrap; box-sizing: border-box; color: rgb(0, 0, 0); display: inline; flex-wrap: nowrap; font-size: 12px; font-weight: 400; grid-area: auto; line-height: 18px; margin: 0px; overflow: visible; text-align: left; text-align-last: auto;"> 1-800-222-8222.</span>
|
| Additional Information Website |
|
<span style="box-sizing: border-box; color: rgb(0, 0, 0); display: inline; flex-wrap: nowrap; font-size: 12px; font-weight: 400; grid-area: auto; line-height: 18px; margin: 0px; overflow: visible; text-align: left; text-align-last: auto; white-space-collapse: preserve-breaks;">allspringglobal.com</span>
|
| Expenses [Text Block] |
|
What were the Fund costs for the past year?The table explains the costs you would have paid within the reporting period based on a hypothetical $10,000 investment.
CLASS NAME |
COSTS OF A $10,000 INVESTMENT |
COSTS PAID AS A % OF A $10,000 INVESTMENT |
Administrator Class |
$77 |
0.73% | The manager has contractually committed to waive fees and/or reimburse certain expenses to the extent necessary to cap the Fund's total annual fund operating expense ratio at a specific amount. Without this cap, the costs shown above may have been higher. Please see the prospectus for the amount and the expiration date of the cap. Prior to or after the commitment expiration date, the cap may be increased or the commitment to maintain the cap may be terminated only with the approval of the Board of Trustees. |
| Expenses Paid, Amount |
|
$ 77
|
| Expense Ratio, Percent |
|
0.73%
|
| Factors Affecting Performance [Text Block] |
|
How did the Fund perform last year and what affected its performance?In a volatile year, the Fund outperformed its strategy benchmark, driven by stock selection. The period saw a fluctuation in investors’ risk appetites as optimism around monetary policy easing gave way to fears that a restrictive trade policy and the Federal Reserve’s decision to pause rate cuts could lead to a recession. However, markets rallied off the April 9 announcement that the implementation of tariffs would be delayed. The Fund made minor changes to sector allocation, with an increase in its consumer discretionary weight while reducing its exposure to real estate and financials. Citigroup, Inc. was the largest contributor, as it is exiting less profitable, non-core franchises and eliminating managerial layers to improve returns and reduce its capital needs, with a goal of achieving more durable and higher-growth cash flow. The largest detractor was Canadian Pacific Kansas City Ltd., an operator of a transnational rail network, on fears that trade policy could affect volumes. Management announced its first share repurchase program in more than three years, and we believe shares are materially undervalued from a reward/risk perspective. |
| Line Graph [Table Text Block] |
|

|
Administrator Class |
Russell 1000® Value Index |
Russell 3000® Index |
7/31/2015 |
$10,000 |
$10,000 |
$10,000 |
8/31/2015 |
$9,361 |
$9,404 |
$9,396 |
9/30/2015 |
$9,088 |
$9,121 |
$9,122 |
10/31/2015 |
$9,839 |
$9,809 |
$9,843 |
11/30/2015 |
$9,818 |
$9,846 |
$9,898 |
12/31/2015 |
$9,582 |
$9,634 |
$9,694 |
1/31/2016 |
$8,969 |
$9,137 |
$9,147 |
2/29/2016 |
$8,937 |
$9,134 |
$9,144 |
3/31/2016 |
$9,504 |
$9,792 |
$9,788 |
4/30/2016 |
$9,582 |
$9,998 |
$9,849 |
5/31/2016 |
$9,622 |
$10,153 |
$10,025 |
6/30/2016 |
$9,598 |
$10,241 |
$10,046 |
7/31/2016 |
$9,842 |
$10,538 |
$10,444 |
8/31/2016 |
$9,905 |
$10,620 |
$10,471 |
9/30/2016 |
$9,936 |
$10,598 |
$10,488 |
10/31/2016 |
$9,740 |
$10,434 |
$10,261 |
11/30/2016 |
$10,125 |
$11,029 |
$10,720 |
12/31/2016 |
$10,295 |
$11,305 |
$10,929 |
1/31/2017 |
$10,430 |
$11,386 |
$11,135 |
2/28/2017 |
$10,694 |
$11,795 |
$11,549 |
3/31/2017 |
$10,702 |
$11,675 |
$11,557 |
4/30/2017 |
$10,736 |
$11,653 |
$11,679 |
5/31/2017 |
$10,830 |
$11,641 |
$11,799 |
6/30/2017 |
$10,889 |
$11,832 |
$11,905 |
7/31/2017 |
$11,186 |
$11,989 |
$12,130 |
8/31/2017 |
$11,059 |
$11,849 |
$12,153 |
9/30/2017 |
$11,288 |
$12,200 |
$12,449 |
10/31/2017 |
$11,399 |
$12,289 |
$12,721 |
11/30/2017 |
$11,756 |
$12,665 |
$13,107 |
12/31/2017 |
$11,927 |
$12,850 |
$13,238 |
1/31/2018 |
$12,599 |
$13,347 |
$13,936 |
2/28/2018 |
$11,973 |
$12,709 |
$13,423 |
3/31/2018 |
$11,733 |
$12,486 |
$13,153 |
4/30/2018 |
$11,844 |
$12,527 |
$13,203 |
5/31/2018 |
$11,945 |
$12,601 |
$13,576 |
6/30/2018 |
$12,101 |
$12,633 |
$13,665 |
7/31/2018 |
$12,599 |
$13,133 |
$14,118 |
8/31/2018 |
$12,829 |
$13,327 |
$14,614 |
9/30/2018 |
$12,930 |
$13,353 |
$14,638 |
10/31/2018 |
$12,230 |
$12,662 |
$13,560 |
11/30/2018 |
$12,599 |
$13,040 |
$13,832 |
12/31/2018 |
$11,268 |
$11,788 |
$12,544 |
1/31/2019 |
$12,195 |
$12,705 |
$13,621 |
2/28/2019 |
$12,613 |
$13,111 |
$14,100 |
3/31/2019 |
$12,763 |
$13,194 |
$14,306 |
4/30/2019 |
$13,380 |
$13,662 |
$14,877 |
5/31/2019 |
$12,623 |
$12,784 |
$13,915 |
6/30/2019 |
$13,480 |
$13,702 |
$14,892 |
7/31/2019 |
$13,759 |
$13,815 |
$15,113 |
8/31/2019 |
$13,420 |
$13,409 |
$14,805 |
9/30/2019 |
$13,908 |
$13,887 |
$15,065 |
10/31/2019 |
$13,978 |
$14,081 |
$15,389 |
11/30/2019 |
$14,456 |
$14,517 |
$15,974 |
12/31/2019 |
$14,938 |
$14,916 |
$16,436 |
1/31/2020 |
$14,465 |
$14,595 |
$16,418 |
2/29/2020 |
$13,057 |
$13,182 |
$15,074 |
3/31/2020 |
$11,121 |
$10,929 |
$13,001 |
4/30/2020 |
$12,265 |
$12,158 |
$14,722 |
5/31/2020 |
$12,683 |
$12,574 |
$15,510 |
6/30/2020 |
$12,771 |
$12,491 |
$15,864 |
7/31/2020 |
$13,189 |
$12,985 |
$16,765 |
8/31/2020 |
$13,728 |
$13,522 |
$17,980 |
9/30/2020 |
$13,288 |
$13,190 |
$17,325 |
10/31/2020 |
$13,013 |
$13,016 |
$16,951 |
11/30/2020 |
$14,663 |
$14,767 |
$19,013 |
12/31/2020 |
$15,121 |
$15,333 |
$19,869 |
1/31/2021 |
$14,787 |
$15,193 |
$19,780 |
2/28/2021 |
$15,511 |
$16,111 |
$20,399 |
3/31/2021 |
$16,625 |
$17,059 |
$21,130 |
4/30/2021 |
$17,271 |
$17,741 |
$22,219 |
5/31/2021 |
$17,595 |
$18,155 |
$22,320 |
6/30/2021 |
$17,439 |
$17,947 |
$22,871 |
7/31/2021 |
$17,639 |
$18,091 |
$23,258 |
8/31/2021 |
$17,918 |
$18,450 |
$23,921 |
9/30/2021 |
$17,427 |
$17,807 |
$22,848 |
10/31/2021 |
$18,519 |
$18,712 |
$24,393 |
11/30/2021 |
$17,873 |
$18,052 |
$24,021 |
12/31/2021 |
$18,745 |
$19,191 |
$24,967 |
1/31/2022 |
$18,235 |
$18,744 |
$23,498 |
2/28/2022 |
$17,818 |
$18,527 |
$22,906 |
3/31/2022 |
$18,114 |
$19,050 |
$23,649 |
4/30/2022 |
$16,905 |
$17,975 |
$21,527 |
5/31/2022 |
$17,160 |
$18,324 |
$21,498 |
6/30/2022 |
$15,522 |
$16,723 |
$19,700 |
7/31/2022 |
$16,744 |
$17,832 |
$21,548 |
8/31/2022 |
$16,422 |
$17,301 |
$20,744 |
9/30/2022 |
$15,146 |
$15,784 |
$18,820 |
10/31/2022 |
$17,040 |
$17,402 |
$20,364 |
11/30/2022 |
$18,181 |
$18,490 |
$21,426 |
12/31/2022 |
$17,548 |
$17,744 |
$20,172 |
1/31/2023 |
$18,221 |
$18,664 |
$21,561 |
2/28/2023 |
$17,548 |
$18,006 |
$21,057 |
3/31/2023 |
$17,358 |
$17,923 |
$21,620 |
4/30/2023 |
$17,899 |
$18,193 |
$21,851 |
5/31/2023 |
$17,460 |
$17,491 |
$21,936 |
6/30/2023 |
$18,659 |
$18,653 |
$23,433 |
7/31/2023 |
$19,142 |
$19,309 |
$24,273 |
8/31/2023 |
$18,747 |
$18,788 |
$23,805 |
9/30/2023 |
$18,074 |
$18,063 |
$22,671 |
10/31/2023 |
$17,767 |
$17,426 |
$22,070 |
11/30/2023 |
$18,718 |
$18,740 |
$24,128 |
12/31/2023 |
$19,958 |
$19,778 |
$25,408 |
1/31/2024 |
$20,169 |
$19,799 |
$25,689 |
2/29/2024 |
$20,816 |
$20,529 |
$27,080 |
3/31/2024 |
$21,945 |
$21,556 |
$27,953 |
4/30/2024 |
$21,162 |
$20,635 |
$26,723 |
5/31/2024 |
$21,975 |
$21,289 |
$27,986 |
6/30/2024 |
$21,975 |
$21,089 |
$28,852 |
7/31/2024 |
$23,029 |
$22,167 |
$29,389 |
8/31/2024 |
$23,917 |
$22,762 |
$30,029 |
9/30/2024 |
$23,902 |
$23,077 |
$30,650 |
10/31/2024 |
$23,601 |
$22,823 |
$30,425 |
11/30/2024 |
$24,715 |
$24,281 |
$32,449 |
12/31/2024 |
$23,287 |
$22,620 |
$31,457 |
1/31/2025 |
$24,410 |
$23,667 |
$32,450 |
2/28/2025 |
$24,345 |
$23,763 |
$31,828 |
3/31/2025 |
$23,710 |
$23,103 |
$29,971 |
4/30/2025 |
$23,417 |
$22,399 |
$29,770 |
5/31/2025 |
$24,328 |
$23,186 |
$31,657 |
6/30/2025 |
$25,240 |
$23,978 |
$33,266 |
7/31/2025 |
$25,354 |
$24,116 |
$33,998 |
|
| Average Annual Return [Table Text Block] |
|
AVERAGE ANNUAL TOTAL RETURNS (%)
AATR |
1 Year |
5 Years |
10 Years |
Administrator Class |
10.10 |
13.96 |
9.75 |
Russell 1000® Value Index |
8.79 |
13.18 |
9.20 |
Russell 3000® Index |
15.68 |
15.19 |
13.02 | |
| AssetsNet |
|
$ 2,001,713,305
|
| Holdings Count | Holding |
|
46
|
| Advisory Fees Paid, Amount |
|
$ 6,257,425
|
| InvestmentCompanyPortfolioTurnover |
|
44.00%
|
| Holdings [Text Block] |
|
SECTOR ALLOCATION (% OF LONG-TERM INVESTMENTS)
Financials |
21.0 |
Industrials |
15.3 |
Health care |
14.0 |
Consumer discretionary |
10.3 |
Information technology |
9.9 |
Consumer staples |
7.7 |
Energy |
5.8 |
Materials |
4.8 |
Communication services |
4.6 |
Real estate |
3.5 |
Utilities |
3.1 | |
| Largest Holdings [Text Block] |
|
TOP TEN HOLDINGS (% OF NET ASSETS)
Alphabet, Inc. Class C |
4.5 |
Canadian Pacific Kansas City Ltd. |
4.4 |
Bank of America Corp. |
3.9 |
Intercontinental Exchange, Inc. |
3.8 |
Citigroup, Inc. |
3.6 |
Berkshire Hathaway, Inc. Class B |
3.3 |
Mondelez International, Inc. Class A |
3.2 |
D.R. Horton, Inc. |
3.0 |
NextEra Energy, Inc. |
3.0 |
Labcorp Holdings, Inc. |
2.9 | |
| Material Fund Change [Text Block] |
|
|